Embed Size (px)
Citation preview

Quantitatively Evaluating
Test-Driven Development by
Applying Object-Oriented Quality
Metrics to Open Source Projects
Rod Hilton
Department of Computer & Information Sciences
Regis University
A thesis submitted for the degree of
Master of Science in Software Engineering
December 19, 2009
Abstract
Test-Driven Development is a Software Engineering practice gaining in-
creasing popularity within the software industry. Many studies have been
done to determine the effectiveness of Test-Driven Development, but most
of them evaluate effectiveness according to a reduction in defects. This
kind of evaluation ignores one of the primary claimed benefits of Test-
Driven Development: that it improves the design of code. To evaluate
this claim of Test-Driven Development advocates, it is important to eval-
uate the effect of Test-Driven Development upon object-oriented metrics
that measure the quality of the code itself. Some studies have measured
code in this manner, but they generally have not worked with real-world
code written in a natural, industrial setting. Thus, this work utilizes
Open Source Software as a sample for evaluation, separating Open Source
projects that were written using Test-Driven Development from those that
were not. These projects are then evaluated according to various object-
oriented metrics to determine the overall effectiveness of Test-Driven De-
velopment as a practice for improving the quality of code. This study finds
that Test-Driven Development provides a substantial improvement in code
quality in the categories of cohesion, coupling, and code complexity.
Acknowledgements
There are a number of people without whom this work would not have
been completed.
First, I would thank the developers working on Apache Commons, Blo-
jsam, FitNesse, HTMLParser, Jalopy, JAMWiki, Jericho HTML Parser,
JSPWiki, JTidy, JTrac, JUnit, Roller, ROME, and XWiki for taking the
time to fill out the survey that was instrumental in my research.
I would like to also acknowledge Rally Software and particularly Adam
Esterline and Russ Teabeault, who taught me about Test-Driven Devel-
opment in the first place.
I wish to thank my thesis advisor, Professor Douglas Hart, who tolerated
an endless barrage of drafts and late changes without completely cutting
off communication with me.
Most importantly, I offer my sincerest gratitude to my wife, Julia, whose
encouragement and companionship were absolutely crucial in completing
this work.

Contents
1 Introduction 1
2 Test-Driven Development 5
Practicing Test-Driven Development . . . . . . . . . . . . . . . . . . . . . 5
Benefits of Test-Driven Development . . . . . . . . . . . . . . . . . . . . . 7
Effect on Code . . . . . . . . . . . . . . . . . . . . . . . . . . . . . . . . . 8
3 Existing Research on Test-Driven Development 10
The University of Karlsruhe Study . . . . . . . . . . . . . . . . . . . . . . 10
The Bethel College Study . . . . . . . . . . . . . . . . . . . . . . . . . . . 12
The IBM Case Study . . . . . . . . . . . . . . . . . . . . . . . . . . . . . 14
The Microsoft Case Studies . . . . . . . . . . . . . . . . . . . . . . . . . . 15
The Janzen Study . . . . . . . . . . . . . . . . . . . . . . . . . . . . . . . 16
Summary . . . . . . . . . . . . . . . . . . . . . . . . . . . . . . . . . . . . 18
4 Measuring Code Quality 19
Cohesion . . . . . . . . . . . . . . . . . . . . . . . . . . . . . . . . . . . . 20
Lack of Cohesion Methods . . . . . . . . . . . . . . . . . . . . . . . 21
Specialization Index . . . . . . . . . . . . . . . . . . . . . . . . . . . 23
Number of Method Parameters . . . . . . . . . . . . . . . . . . . . . 25
Number of Static Methods . . . . . . . . . . . . . . . . . . . . . . . 25
Coupling . . . . . . . . . . . . . . . . . . . . . . . . . . . . . . . . . . . . 26
Afferent and Efferent Coupling . . . . . . . . . . . . . . . . . . . . . 27
Distance from The Main Sequence . . . . . . . . . . . . . . . . . . . 28
Depth of Inheritance Tree . . . . . . . . . . . . . . . . . . . . . . . . 31
Complexity . . . . . . . . . . . . . . . . . . . . . . . . . . . . . . . . . . . 32
Quantitatively Evaluating Test-Driven Development iv
Size of Methods and Classes . . . . . . . . . . . . . . . . . . . . . . 33
McCabe Cyclomatic Complexity . . . . . . . . . . . . . . . . . . . . 34
Nested Block Depth . . . . . . . . . . . . . . . . . . . . . . . . . . . 36
5 Description of Experiment 38
Survey Setup . . . . . . . . . . . . . . . . . . . . . . . . . . . . . . . . . . 38
Survey Results . . . . . . . . . . . . . . . . . . . . . . . . . . . . . . . . . 39
Selecting the Experimental Groups . . . . . . . . . . . . . . . . . . . . . . 41
Exclusions . . . . . . . . . . . . . . . . . . . . . . . . . . . . . . . . 44
Versions . . . . . . . . . . . . . . . . . . . . . . . . . . . . . . . . . 44
Static Analysis Tools . . . . . . . . . . . . . . . . . . . . . . . . . . . . . 45
6 Experimental Results 48
Effect of TDD on Cohesion . . . . . . . . . . . . . . . . . . . . . . . . . . 49
Lack of Cohesion Methods . . . . . . . . . . . . . . . . . . . . . . . 49
Specialization Index . . . . . . . . . . . . . . . . . . . . . . . . . . . 50
Number of Parameters . . . . . . . . . . . . . . . . . . . . . . . . . 51
Number of Static Methods . . . . . . . . . . . . . . . . . . . . . . . 53
Overall . . . . . . . . . . . . . . . . . . . . . . . . . . . . . . . . . . 53
Effect of TDD on Coupling . . . . . . . . . . . . . . . . . . . . . . . . . . 54
Afferent Coupling . . . . . . . . . . . . . . . . . . . . . . . . . . . . 54
Efferent Coupling . . . . . . . . . . . . . . . . . . . . . . . . . . . . 56
Normalized Distance from The Main Sequence . . . . . . . . . . . . 56
Depth of Inheritance Tree . . . . . . . . . . . . . . . . . . . . . . . . 57
Overall . . . . . . . . . . . . . . . . . . . . . . . . . . . . . . . . . . 58
Effect of TDD on Complexity . . . . . . . . . . . . . . . . . . . . . . . . 59
Method Lines of Code . . . . . . . . . . . . . . . . . . . . . . . . . . 59
Class Lines of Code . . . . . . . . . . . . . . . . . . . . . . . . . . . 60
McCabe Cyclomatic Complexity . . . . . . . . . . . . . . . . . . . . 61
Nested Block Depth . . . . . . . . . . . . . . . . . . . . . . . . . . . 62
Overall . . . . . . . . . . . . . . . . . . . . . . . . . . . . . . . . . . 63
Overall Effect of TDD . . . . . . . . . . . . . . . . . . . . . . . . . . . . . 64
Threats to Validity . . . . . . . . . . . . . . . . . . . . . . . . . . . . . . 64
Quantitatively Evaluating Test-Driven Development v
7 Conclusions 67
Further Work . . . . . . . . . . . . . . . . . . . . . . . . . . . . . . . . . 69
A Metrics Analyzer Code 77
List of Figures
1.1 Test-Driven Development Job Listing Trends from January 2005 to
July 2009 . . . . . . . . . . . . . . . . . . . . . . . . . . . . . . . . . 2
2.1 The TDD Cycle . . . . . . . . . . . . . . . . . . . . . . . . . . . . . . 6
4.1 SI Illustration . . . . . . . . . . . . . . . . . . . . . . . . . . . . . . . 24
4.2 Coupling Example . . . . . . . . . . . . . . . . . . . . . . . . . . . . 28
4.3 The Main Sequence . . . . . . . . . . . . . . . . . . . . . . . . . . . . 30
4.4 An Example Inheritance Tree . . . . . . . . . . . . . . . . . . . . . . 32
4.5 Example Program Stucture Graph . . . . . . . . . . . . . . . . . . . . 36
5.1 TDD Survey . . . . . . . . . . . . . . . . . . . . . . . . . . . . . . . . 42
5.2 The Eclipse Metrics Plugin . . . . . . . . . . . . . . . . . . . . . . . . 46
6.1 Lack of Cohesion Methods by Project Size . . . . . . . . . . . . . . . 49
6.2 Specialization Index by Project Size . . . . . . . . . . . . . . . . . . . 50
6.3 Number of Parameters by Project Size . . . . . . . . . . . . . . . . . 52
6.4 Number of Static Methods by Project Size . . . . . . . . . . . . . . . 53
6.5 Afferent Coupling by Project Size . . . . . . . . . . . . . . . . . . . . 55
6.6 Efferent Coupling by Project Size . . . . . . . . . . . . . . . . . . . . 56
6.7 Normalized Distance from The Main Sequence by Project Size . . . . 57
6.8 Depth of Inheritance Tree by Project Size . . . . . . . . . . . . . . . 58
6.9 Method Lines of Code by Project Size . . . . . . . . . . . . . . . . . 60
6.10 Class Lines of Code by Project Size . . . . . . . . . . . . . . . . . . . 61
6.11 McCabe Cyclomatic Complexity by Project Size . . . . . . . . . . . . 62
6.12 Nested Block Depth by Project Size . . . . . . . . . . . . . . . . . . . 63
Chapter 1
Introduction
The term Software Engineering was first coined at the NATO Software Engineering
Conference in 1968. In the proceedings, there was a debate about the existence of
a “software crisis” (Naur and Randell, 1969). The crisis under discussion centered
around the fact that software was becoming increasingly important in society, yet the
existing practices for programming computers were having a difficult time scaling to
the demands of larger, more complex systems. One attendee said “The basic problem
is that certain classes of systems are placing demands on us which are beyond our
capabilities and our theories and methods of design and production at this time.” In
short, the rate at which the need for software was increasing was exceeding the rate
at which programmers could learn to scale their techniques and methods. In a very
real way, improving the techniques employed to build software has been the focus of
Software Engineering as long as the phrase has existed.
It is no surprise, then, that the bulk of progress made in the field of Software En-
gineering in the last forty years has been focused on improving these techniques. From
the Capability Maturity Model for Software to the Agile Manifesto, from Big Design
Up Front to Iterative Design, and from Waterfall to eXtreme Programming, signifi-
cant efforts have been made within the industry to improve the ability of professional
programmers to write high-quality software for large, critical systems. One particular
effort that has been gaining a great deal of respect in the industry is Test-Driven De-
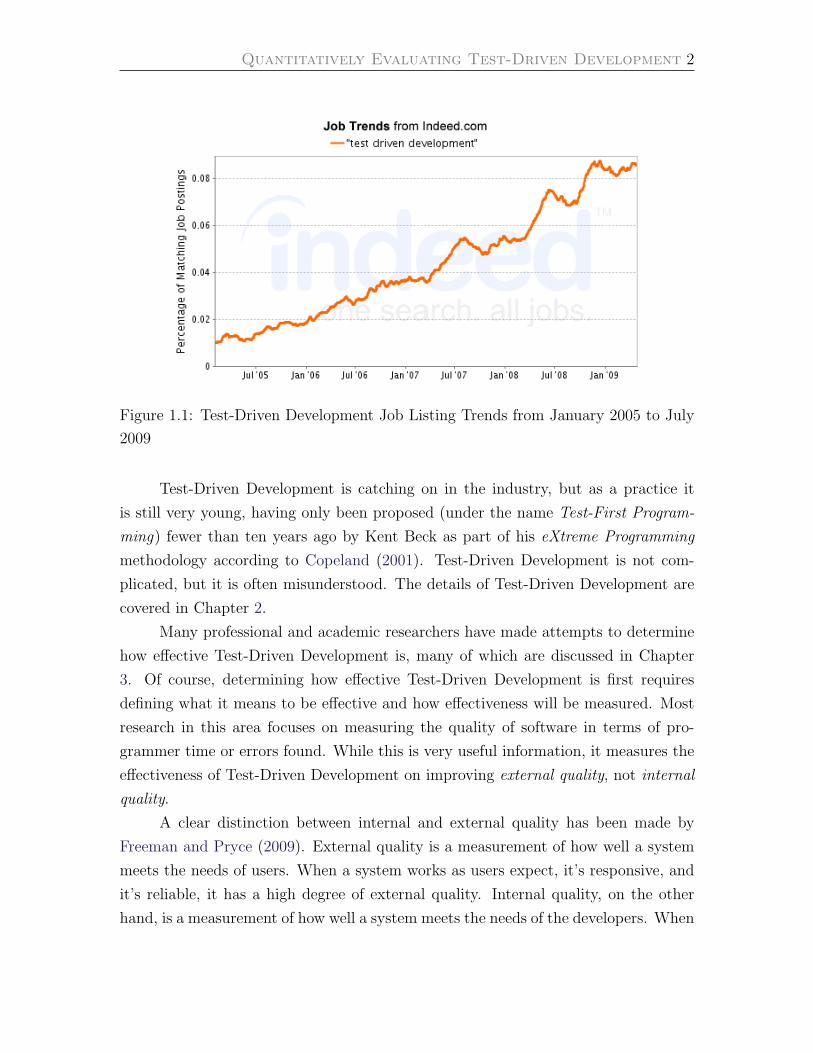
velopment (TDD). As shown in Figure 1.1, according to job listing aggregation site
Indeed.com, the percentage of job postings that mention “Test Driven Development”
has more than quadrupled in the last four years.
Quantitatively Evaluating Test-Driven Development 2
Figure 1.1: Test-Driven Development Job Listing Trends from January 2005 to July
2009
Test-Driven Development is catching on in the industry, but as a practice it
is still very young, having only been proposed (under the name Test-First Program-
ming) fewer than ten years ago by Kent Beck as part of his eXtreme Programming
methodology according to Copeland (2001). Test-Driven Development is not com-
plicated, but it is often misunderstood. The details of Test-Driven Development are
covered in Chapter 2.
Many professional and academic researchers have made attempts to determine
how effective Test-Driven Development is, many of which are discussed in Chapter
3. Of course, determining how effective Test-Driven Development is first requires
defining what it means to be effective and how effectiveness will be measured. Most
research in this area focuses on measuring the quality of software in terms of pro-
grammer time or errors found. While this is very useful information, it measures the
effectiveness of Test-Driven Development on improving external quality, not internal
quality.
A clear distinction between internal and external quality has been made by
Freeman and Pryce (2009). External quality is a measurement of how well a system
meets the needs of users. When a system works as users expect, it’s responsive, and
it’s reliable, it has a high degree of external quality. Internal quality, on the other
hand, is a measurement of how well a system meets the needs of the developers. When
Quantitatively Evaluating Test-Driven Development 3
a system is easy to understand and easy to change, it has a high degree of internal
quality. Essentially, external quality refers to the quality of software, while internal
quality refers to the quality of code.
End users and engineers alike may feel the pain of low external quality, but
only the engineers feel the pain associated with low internal quality, often referred to
as “bad code”. Users may observe slipped deadlines, error messages, and incorrect
calculations in the software they use, but only the engineers behind that software
observe the fact that adding a new widget to the software might require modifying
hundreds of lines of code across twenty different files.
If the end users are happy, does it matter what the engineers think? Does
code quality matter? Abelson and Sussman (1996) answer this question succinctly
by saying “Programs must be written for people to read, and only incidentally for
machines to execute.” In other words, the most important thing a good program can
do is be readable, which makes it easier to maintain. Indeed, being understandable
by other engineers is often more important than being functionally correct, since an
incorrect program can be made correct by another engineer, but only if it is under-
standable to that engineer. Abelson and Sussman (1996) go on to say “The essential
material to be addressed [. . . ] is not the syntax of particular programming-language
constructs, nor clever algorithms for computing particular functions efficiently, nor
even the mathematical analysis of algorithms and the foundations of computing, but
rather the techniques used to control the intellectual complexity of large software
systems.”
Bad code hinders new development. Rather than adding new features to soft-
ware, software engineers often spend their days fighting through a mess of spaghetti
code, tracking down unexpected side effects from small changes, and scratching their
heads to figure out what the source code is doing.
Martin (2008) shares a story from his career as a software engineer:
“I know of one company that, in the late 80s, wrote a killer app. It was
very popular, and lots of professionals bought and used it. But then the
release cycles began to stretch. Bugs were not repaired from one release
to the next. Load times grew and crashes increased. I remember the
day I shut the product down in frustration and never used it again. The
company went out of business a short time after that.
Quantitatively Evaluating Test-Driven Development 4
Two decades later I met one of the early employees of that company
and asked him what had happened. The answer confirmed my fears. They
had rushed the product to market and had made a huge mess in the code.
As they added more and more features, the code got worse and worse
until they simply could not manage it any longer. It was the bad code
that brought the company down.”
Bad code eventually leads to bad software in the form of defects and missed
deadlines, but measuring the effectiveness of a practice like Test-Driven Development
by measuring the external quality of software is like measuring the presence of a fire
by detecting smoke. A fire can burn for quite some time before generating any smoke;
by the time smoke is detected, it may be too late.
To truly determine the effectiveness of Test-Driven Development, it must be
analyzed in terms of how it improves internal code quality. To accomplish this, this
work uses object-oriented metrics, which are discussed in Chapter 4. They are used to
measure the quality of the code written using Test-Driven Development and compare
it to the code written using more traditional means of software development. The
code for this comparison comes from publicly available Open Source projects, the
details of which are discussed in Chapter 5.
The goal of using Open Source projects is to build a large enough sample of code
to yield informative results, which will help determine if Test-Driven Development
is truly an effective means of improving the quality of code and, as an end-result,
software. The results of this experiment are discussed in Chapter 6.

Chapter 2
Test-Driven Development
Test-Driven Development (TDD) is one of the key engineering practices of eXtreme
Programming (XP), created by Kent Beck in 1999 and detailed by Beck and Andres
(2004). XP was created to help developers deliver quality code quickly. To that end,
Test-Driven Development is used to design and develop code incrementally, ensuring
that the only code written is absolutely crucial to the system and that all code written
is inherently testable.
In the Test-Driven Development process, the code that is written is determined
by the tests that an engineer writes. The engineer first write the test, then write
the code it is meant to test. This approach is, to a great extent, counterintuitive.
Developers tend to think of tests as the thing that proves that code works, but Test-
Driven Development requires that engineers think of code as the thing that makes
the tests pass.
Practicing Test-Driven Development
When using Test-Driven Development, the first thing an engineer does is think about
how to make the smallest change to move the code closer to implementing a particular
feature. Next, the engineer writes a test for that code change. When that test runs, it
should fail, yielding a red bar in the unit testing framework being used. It should fail
because the code hasn’t been written yet to make it pass. Next, the engineer makes
the code change needed to make the test pass - this code should be the bare minimum
amount of code possible to make the test pass, and it doesn’t have to be “good code”
Quantitatively Evaluating Test-Driven Development 6
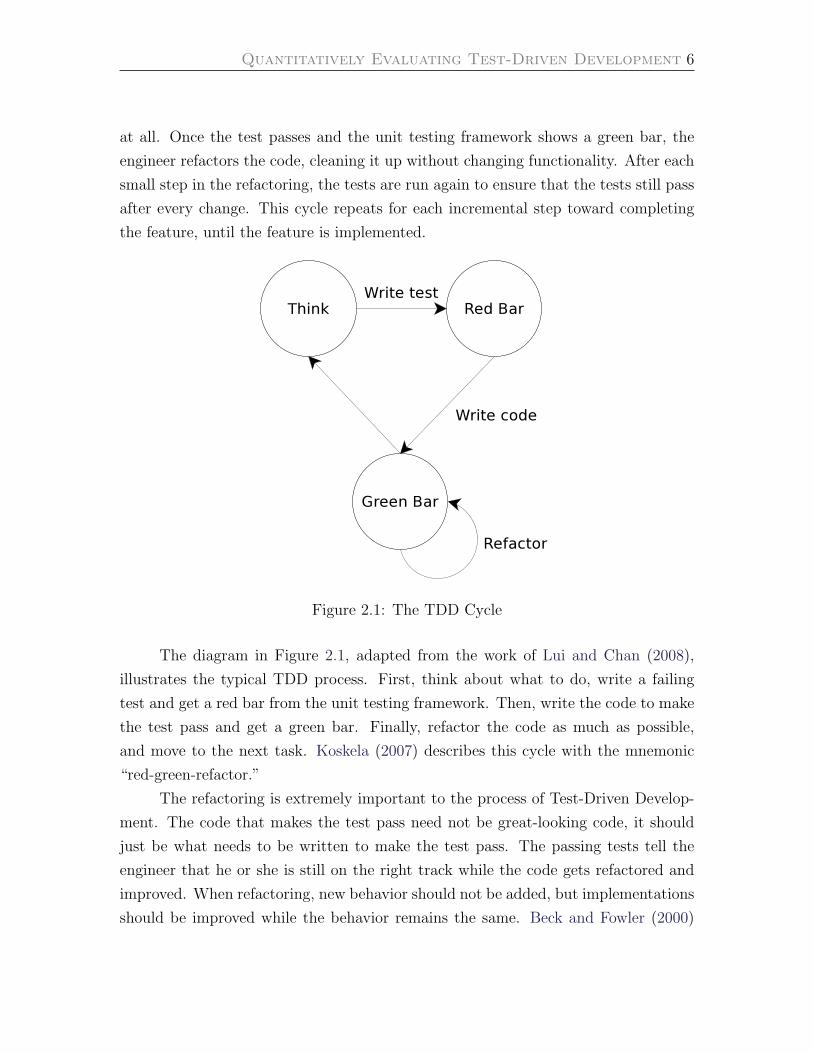
at all. Once the test passes and the unit testing framework shows a green bar, the
engineer refactors the code, cleaning it up without changing functionality. After each
small step in the refactoring, the tests are run again to ensure that the tests still pass
after every change. This cycle repeats for each incremental step toward completing
the feature, until the feature is implemented.
Figure 2.1: The TDD Cycle
The diagram in Figure 2.1, adapted from the work of Lui and Chan (2008),
illustrates the typical TDD process. First, think about what to do, write a failing
test and get a red bar from the unit testing framework. Then, write the code to make
the test pass and get a green bar. Finally, refactor the code as much as possible,
and move to the next task. Koskela (2007) describes this cycle with the mnemonic
“red-green-refactor.”
The refactoring is extremely important to the process of Test-Driven Develop-
ment. The code that makes the test pass need not be great-looking code, it should
just be what needs to be written to make the test pass. The passing tests tell the
engineer that he or she is still on the right track while the code gets refactored and
improved. When refactoring, new behavior should not be added, but implementations
should be improved while the behavior remains the same. Beck and Fowler (2000)
Quantitatively Evaluating Test-Driven Development 7
describe this using a metaphor of “two hats”: developers can wear an implementation
hat or a refactoring hat, but cannot wear both at once.
Determining exactly when it’s time to stop refactoring and move on to the next
task is subjective, but the fact that the methodology builds in time to improve the
quality of code is meant to enable engineers to keep their code as clean as possible.
Benefits of Test-Driven Development
Test-Driven Development advocates claim it offers many benefits to software engi-
neers. These include:
Predictability: Beck (2002) suggests that Test-Driven Development allows engi-
neers to know when they are finished because they have written tests to cover
all of the aspects of a feature, and all of those tests pass.
Learning: Beck (2002) also claims Test-Driven Development gives engineers a chance
to learn more about code. He argues that “if you only slap together the first
thing you think of, then you never have time to think of a second, better thing”.
Reliability: Martin (2002) argues that one of the greatest advantages of Test-Driven
Development is having a suite of regression tests covering all aspects of the
system. Engineers can modify the program and be notified immediately if they
have accidentally modified functionality.
Speed: A work by Shore and Warden (2007) points out that Test-Driven Develop-
ment helps develop code quickly, since developers spend very little time debug-
ging and they find mistakes sooner.
Confidence: Astels (2003) maintains that one of Test-Driven Development’s greatest
strengths is that no code goes into production without tests associated with it,
so an organization whose engineers are using Test-Driven Development can be
confident that all of the code they release behaves as expected.
Cost: It is argued by Crispin and House (2002) that, because developers are respon-
sible for writing all of the automated tests in the system as a byproduct of
Test-Driven Development, the organization’s testers are freed up to do things
Quantitatively Evaluating Test-Driven Development 8
like perform exploratory testing and help define acceptance criteria, helping
save the company developing the software precious resources.
Scope Limiting: Test-Driven Development helps teams avoid scope creep according
to Beck and Andres (2004). Scope creep is the tendency for developers to write
extra code or functionality “just in case,” even if it isn’t required by customers.
Because adding the functionality requires writing a test, it forces developers to
reconsider whether the functionality is really needed.
Managability: Koskela (2007) points out that human beings can only focus on
about seven concepts at a time, and using Test-Driven Development forces
programmers to focus on only a few pieces of functionality at a time. Splitting
the big system into smaller pieces via tests makes it easier for programmers to
manage complex systems in their heads.
Documentation: It is noted by Langr (2005) that Test-Driven Development creates
programmer documentation automatically. Each unit test acts as a part of
documentation about the appropriate usage of a class. Tests can be referred to
by programmers to understand how a system is supposed to behave, and what
its responsibilities are.
While these advantages are substantial, Beck (2002) summarizes the greatest
benefit of Test-Driven Development as “clean code that works.” Test-Driven Devel-
opment is primarily meant to yield good, clean code. It’s not about the quality of
the software, it’s about the quality of the code.
Effect on Code
It is important to distinguish between Test-Driven Development and merely writing
unit tests (often called Test-Last Development). Studies such as those done by Zhu
et al. (1997) have illustrated that writing tests helps increase the quality of software,
but the mere existence of tests has little power to improve the quality of code. While a
comprehensive unit test suite enables safe refactoring and refactoring encourages code
quality improvements, Test-Driven Development is about much more than simply
enabling engineers to improve the quality of code. As North (2003) argues, Test-
Driven Development, despite the name, is not about writing tests, it’s about driving
Quantitatively Evaluating Test-Driven Development 9
the creation of the code to improve its quality. Ford (2009) acknowledges that the
perception of Test-Driven Development is that the key benefit is a comprehensive
suite of unit tests, but argues that the real benefit is that it “can change the overall
design of your code for the better because it defers decisions until the last responsible
moment.”
Test-Driven Development means that every decision made in code design is
driven by a test, and that test is driven by the need to develop a feature. Burke
and Coyner (2003) explain that it discourages large-scale, up-front code design, and
instead encourages developers to accurately design each small change and write the
code for it right away. Test-Driven Development drives the design of the code, con-
tinually forcing developers to write code that is easy to test and therefore likely to
be highly modular. Test-Driven Development enables what Ford (2008) refers to as
“emergent design”: the ability for the code’s design to improve as the number of
actions it can perform increases. Wilson (2009) argues that ‘TDD’ should not stand
for Test-Driven Development, but for Test-Driven Design.
Feathers (2004) explains that the work of trying to create tests for every piece of
new functionality forces the developer to design it in a good way. Bain (2008) suggests
that working in a test-driven manner improves the quality of code because it makes
developers think about code from the perspective of the client, which helps inform
decisions made while emerging the design of the code. Small, concrete, modular
units of code are written to perform specific task, and those units are then integrated
together to create the complete program. The purpose of Test-Driven Development
is to end up with code that is better designed than code written without it.
Reading the work of TDD advocates, one comes away with the sense that Test-
Driven Development is a huge industry-changer. In fact, at FutureTest 2008, Robert
Martin said exactly that: “TDD is probably the single most important practice dis-
covered in the last 10 years” (Mullaney, 2008).
If this assessment is correct, software engineers have a professional obligation
to adopt this practice. However, considering how different Test-Driven Development
is from a traditional, code-oriented approach to software development, software en-
gineers have a right to require substantial evidence that TDD improves code quality
before adopting it.
Chapter 3
Existing Research on Test-Driven
Development
Many different groups and individuals have attempted to evaluate the effectiveness of
Test-Driven Development. Each has discovered different aspects about the practice,
where its strengths are, and where its weaknesses are. This work aims to analyze
Test-Driven Development in a somewhat different manner than previous studies, but
there is a great deal of value in knowing what these studies have concluded.
The University of Karlsruhe Study
Muller and Hagner (2002), two researchers at the University of Karlsruhe in Germany,
attempted to conduct a tightly controlled experiment to determine the effectiveness of
Test-Driven Development (referred to by the researchers as test-first programming).
They conducted the experiment with graduate Computer Science students, dividing
the students into two groups: an experimental group that wrote tests first, and a
control group that did not.
The students were given a specific task: implement the bodies of a number of
methods in a graph library (the method declarations were provided). The students
wrote code to try to pass acceptance tests created by the researchers. When they felt
their solutions were adequate, they submitted the code to the testing system, which
then checked if their code behaved correctly or not. If the code did not produce the
desired behavior, the students were given opportunities to fix the code until it passed.
Quantitatively Evaluating Test-Driven Development 11
The researchers kept track of how long it took students to create their solutions, how
often the solutions failed the acceptance tests, and how consistently the students
reused existing methods.
The results of the study were that the two groups showed no difference in
the overall problem-solving time, but the test-first group did produce fewer errors
when reusing an existing method, indicating that the test-first group’s code was more
understandable. Somewhat surprisingly, the test-first group actually had a lower
reliability rating, measured in terms of failing the acceptance test the first time it was
run against the project. In fact, except for three of the programs, all of the programs
written using test-first were less reliable than even the worst program produced by
the control group.
Since the understandability (which relates to code quality) was higher for the
test-first group while the reliability measurement (which relates to software quality)
was lower, this study seems to indicate that Test-Driven Development improves code
quality while decreasing software quality. Unfortunately, it’s difficult to draw solid
conclusions from the study for a variety of reasons.
This study does not specify if the control group wrote their tests after their
implementations, or if they wrote no tests at all. If the control group wrote no tests
at all, the fact that the two groups spent approximately the same amount of time
writing their method implementations is actually an indicator that the test-first group
was faster, since they spent at least some portion of their time writing tests while the
control group did not.
It is also worthwhile to note that the variance for the observed reliability of the
test-first group’s code was higher than that of the control group’s code, indicating
greater differences among student skill levels in the test-first group. Furthermore, the
students had only begun learning about test-first programming a short time before
the experiment, so it’s likely that the test-first students simply struggled more with
test-first programming, perhaps some more than others.
Most critically, the Test-Driven Development group did not strictly adhere to
the Test-Driven Development technique, as the experiment was constructed in a way
to prevent refactoring. Refactoring, as explained in Chapter 2, is one of the key
tenets of improving quality through Test-Driven Development. Because the students
were given the method signatures for their programs, they were unable to apply high
level design refactoring, which is important to the process of improving the structure
Quantitatively Evaluating Test-Driven Development 12
and design of programs. As explained by Fowler et al. (1999), refactoring makes
programs easier to understand, and understanding programs better makes it easier
to find defects. To an extent, it is not surprising that the test-first group of students
did a poor job finding defects, as they were denied one of the most critical tools for
that task.
The Bethel College Study
Another study to determine the effectiveness of Test-Driven Development was done
at Kansas’s Bethel College in 2003. Reid Kaufmann from Sun Microsystems worked
with David Janzen at Bethel College to set up a controlled experiment using college
students in order to isolate the variable of Test-Driven Development as much as
possible. Unlike the previous study, this one tried to focus on the quality of the code
itself (Kaufmann and Janzen, 2003).
The experiment’s participants consisted of two groups with four students each,
one group using TDD, the other not. Every student was at least a sophomore and
all were Computer Science majors with at least two programming courses completed.
The students used Java to develop a game of their group’s choosing. The non-TDD
group chose to write an adventure game, while the TDD group chose an action fighting
game.
The effectiveness of Test-Driven Development was determined by analyzing var-
ious code metrics for snapshots of the code. Snapshots were gathered three times
during the experiment and then run through various code metrics tools.
The results were very interesting. The Test-Driven Development group pro-
duced about 50% more code than the non-TDD group, though the cyclomatic com-
plexity (discussed in more detail on page 34) of both projects was about the same.
Kaufmann and Janzen argue that this is an argument in favor of Test-Driven De-
velopment, as it could be said that the TDD group chose a more complex problem,
which dealt with real-time interaction between two players.
One of the metrics indicated that the non-TDD group’s code contained a class
with more than twice the information flow measure (an indicator of a design problem)
than any other class in either project. Another metric indicated that, as time went
on and the number of functions required of the program increased, the number of
classes decreased with the non-TDD group. In other words, responsibilities per class
Quantitatively Evaluating Test-Driven Development 13
increased with time at a much faster rate in the non-TDD group, indicating a strong
likelihood that the quality of the code was decreasing over time when Test-Driven
Development was not used.
The students filled out surveys when the work was completed, rating how confi-
dent they felt about their code on a scale from 1 to 5. The non-TDD group averaged
a score of 2.5, while the TDD group averaged 4.75. Using the same scale, the TDD
students were asked to rate how much they thought TDD helped with design, and
the final score was 4.25.
Though this study indicates Test-Driven Development helps with both code
design and programmer confidence, it is not without its limitations. Because the two
groups did not work on the same project, it is difficult to compare the outputs of
the two groups. Additionally, the Test-Driven Development group didn’t follow TDD
practices rigorously, only writing 16 total tests for the project. This is likely a side
effect of the students being exposed to the Test-Driven Development methodology for
the first time immediately prior to the experiment.
Kaufmann and Janzen (2003) point out that very few conclusions about TDD
can be drawn from this study because of differences in the sample. The two groups
were very small, and not similar enough. The TDD group had one senior, while the
non-TDD group had none. Furthermore, the average grade for a programming class
that all of the students had taken was higher for the Test-Driven Development group,
indicating that the students who self-selected into the group had more experience
and more seasoned programming skills than the non-TDD group, which may have
impacted the accuracy of the results.
Most importantly, both this study and the University of Karlsruhe Study suffer
from the same limitation: that they were performed in an academic environment
with a group of students. Using students to study Test-Driven Development has
many advantages, not the least of which is how easy it is to perform a controlled
experiment, but doing so limits the ability to draw conclusions about Test-Driven
Development as an engineering practice in the software industry. Students that write
code for an experiment or class project will never have to maintain that code, nor will
anyone else. Industrial software projects spend 75% of their lifetimes in maintenance
mode (Schach, 2006), so software professionals place a great deal of emphasis on
maintainability and understandability. Test-Driven Development is meant to help
improve internal code quality for the purpose of improving the maintainability of
Quantitatively Evaluating Test-Driven Development 14
code, so it is difficult to draw conclusions when testing its efficacy using groups of
students that have no reason to write maintainable code.
To truly measure the effectiveness of Test-Driven Development as a professional
Software Engineering practice, it needs to be analyzed in an industrial, real-world
environment.
The IBM Case Study
A group at IBM had spent over 10 years developing device drivers. This team had
released 7 revisions to their product since 1998, but in 2002 the group switched
to a different platform for development. Laurie Williams and Mladen Vouk from
North Carolina State University’s department of Computer Science worked with E.
Michael Maximilien from IBM to compare the seventh release on the legacy platform
(developed without TDD) against the first release on the new platform (developed
using TDD) to determine the efficacy of Test-Driven Development (Williams et al.,
2003).
The makeup of the group changed significantly between these two projects, but
they were similar enough to draw some conclusions from the study. All engineers in-
volved had at least a bachelor’s degree in Computer Science, Electrical Engineering,
or Computer Engineering. The legacy team consisted of five local full-time employ-
ees with significant experience in both the languages used (Java and C++) as well
as the domain, while the new product team consisted of nine distributed full-time
employees, three of which didn’t know the language used (Java) and seven of which
were unfamiliar with the domain.
The legacy team had developed the product using an “ad-hoc” approach to
testing, often using interactive scripting languages such as Jython to manually exe-
cute class methods. The new product team, however, used Test-Driven Development.
Determining the value of Test-Driven Development relied on the Functional Verifi-
cation Test system in place at IBM, which consisted of a variety of automated and
manual tests to verify the correctness of the product’s functionality and find defects.
After the work was completed, researchers analyzed the number of defects,
test cases, and lines of code for the two teams. When comparing the two teams,
the TDD team’s number of defects found per test case was 1.8 times that of the
legacy team, indicating that the quality of the test cases themselves did a better job
Quantitatively Evaluating Test-Driven Development 15
of finding defects when written as part of a TDD process. More importantly, the
average number of defects found per line of code in the TDD team was 40% less
than that of the legacy team, providing a strong indicator that the TDD team did a
superior job of avoiding introducing defects into the product.
The researchers observed that productivity was about the same for both teams,
and the team generally felt that Test-Driven Development “aided [them] in producing
a product that more easily incorporated later changes,” claiming that support for new
devices was added to the product later “without major perturbations.” Considering
that the new product team lacked the domain knowledge possessed by the legacy
team, Test-Driven Development seemed to provide a great benefit to the IBM team.
This study, though illuminating, would benefit from some additional study. The
metrics used to analyze the efficacy of Test-Driven Development, based primarily in
defect density, focused more on external quality than on internal quality. Further-
more, since the legacy team’s tests consisted of many manual and “ad-hoc” tests,
this study really illustrates that automated testing is effective at reducing defects, not
necessarily Test-Driven Development. Though TDD generates automated regression
tests as a byproduct of its process, it’s possible that the defect density reduction ob-
served in the study was due more to the presence of automated regression tests than
to the adherence to Test-Driven Development.
The Microsoft Case Studies
In 2006, two researchers from Microsoft, Thirumalesh Bhat and Nachiappan Na-
gappan, attempted to evaluate the effectiveness of Test-Driven Development in a
corporate, professional environment. They observed two different teams at Microsoft
as they tried TDD and analyzed the effect TDD had on, primarily, defect reduction
(Bhat and Nagappan, 2006).
Bhat and Nagappan analyzed two case studies as part of their research. They
picked two projects at Microsoft, one that was part of Windows and one that was part
of MSN. The two teams tried TDD for a short period of time and the two researchers
looked at the bug tracking system to determine if TDD helped reduce the number
of defects that were found in the code. They also kept track of how long it took the
engineers to complete their work. For each of these projects, Bhat and Nagappan
found a similar project of similar size and used the same bug tracking system to
Quantitatively Evaluating Test-Driven Development 16
determine how many defects were found at the completion of that effort. The two
projects were then compared.
In the first case study, which dealt with code that was part of the Windows
operating system, the “experimental” group was a team consisting of 6 developers
writing 6,000 lines of code over a period of 24 man-months using TDD. They were
compared to another Windows project in which 2 developers wrote 4,500 lines of code
in 12 man-months without using TDD. In the second case study, which dealt with
code that was part of the Microsoft Network, a team of 5-8 developers writing 26,000
lines of code over 46 man-months using TDD was compared to a Microsoft Network
team consisting of 12 developers writing 149,000 lines of code over 144 man-months
without TDD.
The Microsoft researchers found substantial improvement in quality when Test-
Driven Development was used. In the first case study, the non-TDD group produced
2.6 times as many defects as the TDD group. In the second case study, the non-TDD
group produced 4.2 times as many defects. The managers of the groups also provided
estimates for how much adopting TDD slowed the teams down. In the first case
study, the manager estimated that the TDD group took 25-35% longer because of
TDD, while the manager from the second case study estimated 15%.
These studies provide a strong argument in favor of Test-Driven Development
being helpful in improving external quality despite causing development time to in-
crease, but any conclusions that can be drawn from the study are limited to external
quality since only defect reductions were measured. Since Test-Driven Development
is meant to improve code quality, the code itself must be measured.
The Janzen Study
Though the vast majority of prior work studying the effectiveness of Test-Driven
Development focuses on external quality by using bugs or failed test cases for analysis,
a work by Janzen (2006) provides a noteworthy exception.
Janzen’s doctoral thesis discusses a number of experiments done in both aca-
demic and industrial settings, where experimental and control groups have had their
code analyzed using various internal quality metrics, many of which are covered in
Chapter 4. The studies offer a number of valuable insights into the effectiveness of
Test-Driven Development with regard to improving code quality.
Quantitatively Evaluating Test-Driven Development 17
Of particular interest are the four industrial experiments, all of which were
performed with the same Fortune 500 company. The first of the experiments was
done as part of a training seminar on the practice of Test-Driven Development as
well as the usage of popular Java-based libraries Spring and Hibernate. The trainees
were randomly selected into two groups, one that implemented a bowling game scoring
system using Test-Driven Development, and the other that implemented it by writing
the code before the tests.
The remaining three experiments were conducted with the developers in their
regular work environment, working on production code. The first had the developers
forego writing any automated tests to write the code, which was then analyzed using
various code metrics tools. Then the developers underwent Test-Driven Development
training before using TDD to write the code for the next phase of the experiment, after
which the code was analyzed using the same tools. The second industrial experiment
worked almost exactly as the first, but required that the developers in the non-TDD
group write tests after completing the code. The third and final industrial experiment
simply reversed the order, having developers first try TDD, then switch to writing
the tests after the code.
The studies showed that, for the most part, Test-Driven Development helped
decrease code complexity among mature developers (the industrial studies), but sub-
stantially increased it among beginning developers (the academic studies). The study
also found that many metrics showed improvement in the test-last group after the
developers had switched to a test-last style after doing Test-Driven Development first.
Janzen explains that this may show that TDD had a “residual” effect on developers,
even when they were not using it.
A number of aspects of Janzen’s work call for additional research. First and
foremost, his metrics analysis includes the test code itself. This unfairly penalizes
Test-Driven Development code, since Test-Driven Development code tends to have
more tests, and tests are coupled to the classes they are testing. Since tests are not,
themselves, designed with Test-Driven Development, it seems inaccurate to include
them in metrics analysis.
Most importantly, these studies were a few steps removed from real-world in-
dustrial usage of Test-Driven Development. The industrial studies were conducted as
a controlled experiment in which the programmers were told that their code would
be analyzed. By making the developers aware of the fact that their code would be
Quantitatively Evaluating Test-Driven Development 18
analyzed for internal quality using metrics tools, the experiment may have tainted
the results.
Summary
These studies (as well as many more not covered here) generally tell the same story:
Test-Driven Development helps seasoned developers improve the quality of their soft-
ware. Unfortunately, very few of these studies provide a strong indication that Test-
Driven Development helps improve the quality of code. Many of these studies evaluate
quality in terms of defects found in the system when work is complete, a measurement
that stresses the external quality of software rather than the internal quality of code.
Many of these studies were done in an academic setting or in an experimental
group setting. Though the findings from these studies are extremely valuable, the
situations are a bit removed from a real-world industry setting. Students are more
junior than seasoned professionals in the industry, and the effectiveness of Test-Driven
Development may be different when exercised by professionals. To truly determine
how effective Test-Driven Development is at aiding in the production of high-quality
source code, it must be analyzed in a natural, industrial setting. Additionally, it must
be analyzed in a manner in which the developers writing the code are not aware of
the fact that their code will be analyzed for internal quality while writing it.
This work has attempted to improve upon previous studies in two specific ways.
First, to determine the effect of Test-Driven Development on internal quality, object-
oriented metrics have been used (detailed in Chapter 4). Second, the analysis has
been performed on real-world code by obtaining a sample of Open Source projects
(discussed in Chapter 5). By using code quality metrics, this work has attempted
to evaluate Test-Driven Development as a Software Engineering practice with the
purpose of improving code rather than software. By looking at real-world Open Source
code, this work has attempted to determine Test-Driven Development’s effectiveness
in a professional, industrial setting. Since the Open Source developers were unaware
of the fact that their code would be analyzed for internal quality while writing it,
observer effect bias has been avoided.
Chapter 4
Measuring Code Quality
There are many ways to measure the quality of software. Jones (2008) describes
a number of metrics that can be used to measure the quality of software and the
productivity of developers. It details how to calculate how much money each line of
code costs a business, how to measure “requirements creep” during the requirements
phase of software development, and how to measure the effectiveness of integrating
outsourced code, among many other things. Moller (1992) describes methods for
measuring software quality by monitoring system uptime and evaluating the level of
user satisfaction. Pandian (2003) describes in great detail various ways to measure
the quality of software by looking at defects, lines of code, and time. While these
metrics are valuable for helping improve the quality of products that engineers create,
they do not help improve the quality of code.
Henney (2004) describes the difference between software and code by essentially
saying that software is what users see and code is what programmers see. Though
it is common for poor-quality code to yield poor-quality software, it is possible for
high-quality code to yield software the users cannot use, and it is also possible for
software that users adore to have been cobbled together from a difficult-to-maintain
mess of code.
Bad quality code often leads to slipped deadlines and defects, but it’s not un-
heard of for developers to make deadlines and fix defects in spite of frustratingly bad
code. If there is value in looking at the quality of code, the best mechanism for doing
so may well not be measuring the quality of software.
There are a number of ways to measure the quality of code, most notably object-
oriented metrics. These metrics can measure the primary indicators of bad code: low
Quantitatively Evaluating Test-Driven Development 20
cohesion, high coupling, and high complexity.
Cohesion
One thing that makes code “bad” is a low level of cohesion. McLaughlin et al. (2006)
define cohesion as the degree to which the elements of a module are connected. In
object-oriented programming, a class whose lines of code are all closely related is said
to have a high cohesion, whereas a class whose lines of code are barely related is said
to have a low cohesion.
A module has coincidental cohesion when the parts of a module are grouped
randomly, with little or no relation between them. A simple example of a module with
coincidental cohesion is a utility class full of random commonly-used static methods.
At the other end of the cohesion spectrum is functional cohesion. Functional
cohesion is achieved when all of the code in a module works together to support
a single task. A well designed object with a single, understandable purpose has
functional cohesion. It illustrates the quintessential “does one thing and does it well”
design paradigm.
When cohesion is low, as in coincidental cohesion, it is very difficult for people to
understand the code in a module, since much of it is unrelated. Furthermore, when
cohesion is very low, functionally related changes will require changes to multiple
modules rather than just one. Low cohesion also makes it difficult to reuse modules,
because using a module with a low level of cohesion very often involves pulling in
a undesirable set of functions. Schach (2006) explains that high cohesion is good
because it is easier to maintain and it isolates faults to one module.
Cohesion is essentially a measure of organization - it measures how related all
of the responsibilities of a module are. Freeman et al. (2004) define cohesion as “how
closely a class or a module supports a single purpose or responsibility.”
When programmers complain that the feature they wish to add requires chang-
ing dozens of modules, or that they can’t understand what an object is doing because
it’s doing dozens of different things, they are experiencing low cohesion.
There are a handful of code metrics that allow developers to measure the degree
of cohesion in their software systems.
Quantitatively Evaluating Test-Driven Development 21
Lack of Cohesion Methods
One popular method for measuring the level of cohesion is by determining the “Lack
of Cohesion Methods” (LCOM), proposed by Chidamber and Kemerer (1991). The
theory behind this measurement is simple. A maximally cohesive class should have
every single instance variable used by every single method defined in the class. A class
where one of the variables isn’t used by one of the methods is slightly less cohesive
than a class where all of the variables are used by all of the methods.
With that in mind, Chidamber and Kemerer proposed that you could take the
number of disjoint sets formed by intersecting the sets created by taking all of the
instance variables used by each of the methods in the class. In other words, one can
analyze how often there are methods that don’t use the same set of instance variables
as other methods. Henderson-Sellers (1995) revised this method to normalize it so
that classes with similar values for LCOM could be said to have similar levels of
cohesion.
The formal specification for this metric is, given a set of methods {Mi}(i =
1, . . . ,m) which access a set of attributes {Aj}(j = 1, . . . , a), let the number of
methods which access each piece of data be µ(Aj) and define the Lack of Cohesion
Methods as follows:
LCOM =
(1a
a∑j=1
µ(Aj)
)−m
1−m
Under this formula, a perfectly cohesive class (one in which every method ac-
cesses every attribute), should have an LCOM of 0. On the other hand, a completely
noncohesive class (one in which each method uniquely accesses exactly one attribute)
would have an LCOM of 1. It should be reiterated that the Henderson-Sellers (1995)
method for calculating LCOM provides a ranking between 0 and 1, not the actual
number of non-cohesive methods as the name may imply.
LCOM can be understood more easily using simple code examples.
public class Rectangle { // LCOM: 0
private double width;
private double height;
public Rectangle(double width, double height) {
super();
this.width = width;
Quantitatively Evaluating Test-Driven Development 22
this.height = height;
}
public double getArea() {
return this.width * this.height;
}
public double getPerimeter() {
return this.width * 2 + this.height * 2;
}
}
The Rectangle class contains two attributes (width and height) and two meth-
ods (getArea and getPerimeter) Both of the methods use both of the attributes,
and as a result LCOM = 0.
public class Circle { // LCOM: 0.333
private double x;
private double y;
private double radius;
public Circle(double x, double y, double radius) {
this.x = x;
this.y = y;
this.radius = radius;
}
public double getArea() {
return Math.PI * this.radius * this.radius;
}
public boolean contains(double x, double y) {
double distance = Math.sqrt(
(x - this.x) * (x - this.x) +
(y - this.y) * (y - this.y));
return distance <= this.radius;
}
}
The Circle class, on the other hand, contains three attributes (x, y, and ra-
dius) and two methods (getArea and contains). The contains method uses all
three of the attributes, but getArea only uses one. As a result, it has a higher
measurement for LCOM , 0.333.
This measurement illustrates a genuine cohesion problem with the design of the
Circle class. The Circle class has two disparate responsibilities: maintaining the
state of the circle itself (radius), and maintaining the state for that circle’s placement
Quantitatively Evaluating Test-Driven Development 23
on a 2D plane (x and y). If someone wished to reuse the Circle class for a purpose
that did not require drawing it on any sort of plane, it would be somewhat difficult,
as the Circle class is bound to the notion of graphing. The Rectangle class, on the
other hand, is completely reusable for any aspect of an application that requires the
notion of a rectangle.
This deficiency in the reusability of Circle is accurately reflected by the sig-
nificantly higher value for LCOM .
Specialization Index
Object-oriented systems enable classes to use polymorphism: the ability to treat an
object as though it is another object, as long as they share an interface. Polymorphism
is a very powerful tool, but developers can overuse and abuse it when programming.
Cavaness et al. (2000) argue that class hierarchies can become rigid when polymorphic
principles are taken to the extreme.
One common abuse is for programmers to create inheritance relationships be-
tween classes even though the subclasses don’t naturally share a type. This is often
done for convenience: a parent class has many methods that a new class wants, so it
is declared to extend the parent, even when it isn’t truly appropriate. Good programs
follow what Martin and Martin (2006) call the “Liskov Substitution Principle,” which
means that subtypes are easily substitutable for their base types. When this principle
is violated, it means that a relationship between classes has been created that isn’t a
natural one, often simply to reuse small pieces of code such as methods or variables
within subtypes. This is an indicator of low cohesion.
It is possible, somewhat indirectly, to measure how well the Liskov principle is
being followed. When relationships exist between classes that are unnatural, there
is often a need for subtypes to not only extend their parent types, but to override
portions of the parent’s code. When a subtype overrides many methods on a base
type, it means that the base type’s behavior isn’t truly appropriate. This can be
measured using the “Specialization Index.”
The Specialization Index (SI), proposed by Lorenz and Kidd (1994), can be
used to determine how effectively subclasses add new behavior while utilizing existing
behavior. This helps determine the quality of the subclassing and the level of cohesion
within subclasses. The formula for the Specialization Index (SI) given the Depth of
Inheritance Tree (DIT ), Number of Overridden Methods (NORM) and Number of
Quantitatively Evaluating Test-Driven Development 24
Methods (NOM) is defined as:
SI =DIT ×NORM
NOM
A high Specialization Index indicates that a subclass overrides a very large
number of its inherited methods. Schroeder (1999) explains that this indicates the
abstraction is inappropriate because the child and its ancestors do not have enough in
common to warrant inheritance. This means that the grouping within the inheritance
tree was less about correctly designing relationships, and more about sharing a few
method implementations, which is an indicator of high coincidental cohesion, the
worst kind.
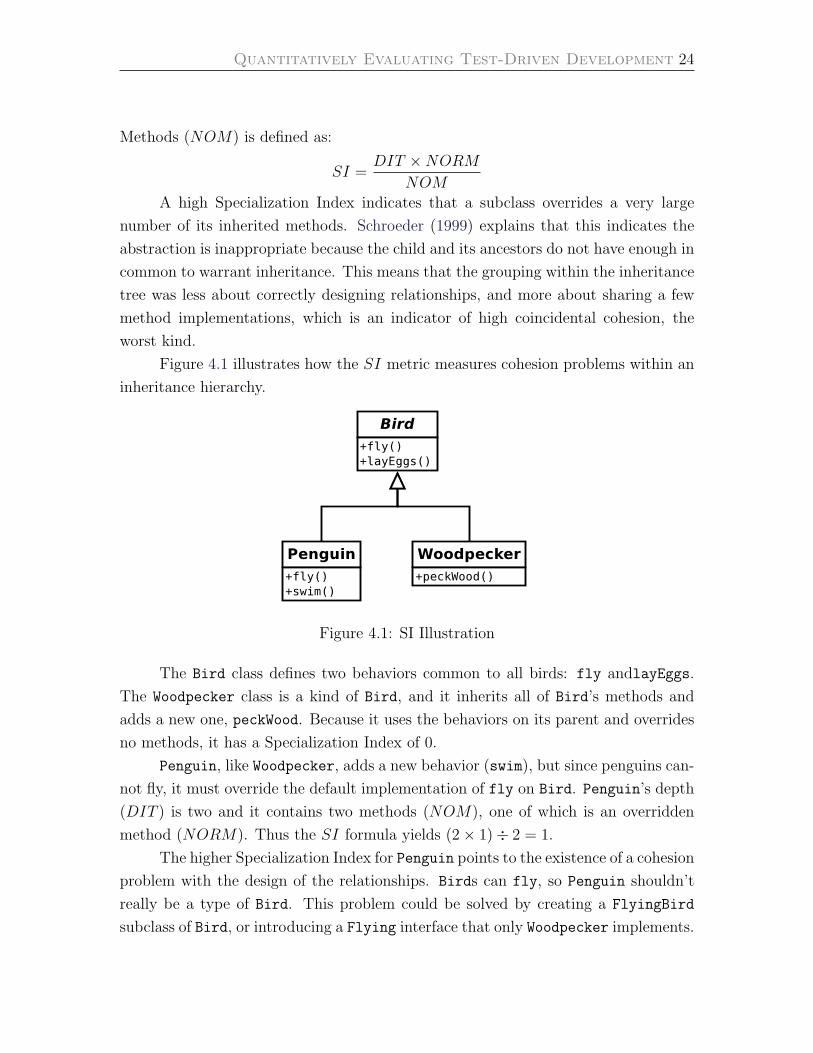
Figure 4.1 illustrates how the SI metric measures cohesion problems within an
inheritance hierarchy.
Figure 4.1: SI Illustration
The Bird class defines two behaviors common to all birds: fly andlayEggs.
The Woodpecker class is a kind of Bird, and it inherits all of Bird’s methods and
adds a new one, peckWood. Because it uses the behaviors on its parent and overrides
no methods, it has a Specialization Index of 0.
Penguin, like Woodpecker, adds a new behavior (swim), but since penguins can-
not fly, it must override the default implementation of fly on Bird. Penguin’s depth
(DIT ) is two and it contains two methods (NOM), one of which is an overridden
method (NORM). Thus the SI formula yields (2× 1)÷ 2 = 1.
The higher Specialization Index for Penguin points to the existence of a cohesion
problem with the design of the relationships. Birds can fly, so Penguin shouldn’t
really be a type of Bird. This problem could be solved by creating a FlyingBird
subclass of Bird, or introducing a Flying interface that only Woodpecker implements.
Quantitatively Evaluating Test-Driven Development 25
Number of Method Parameters
Martin (2008) explains that functions which need many arguments (he suggests no
more than three) are good indicators that some code needs to be wrapped into its
own class. Method arguments represent information to which the method does not
have access. Ideally, objects only require data internal to themselves, indicating a
high level of cohesion. When methods require access to data that they do not “own”,
it indicates that the boundaries that have been drawn between objects are poor.
A method that requires three external values to be passed in as parameters is
very much like a method that uses three internal variables that no other method uses,
which would result in a high LCOM measurement (discussed on page 21). An object
with a method that takes many parameters requires more information than the object
contains, which means it has low encapsulation and, as a result, low cohesion.
The Number of Method Parameters (PAR) can be counted simply by looking
at the number of parameters each method takes. Many languages, including Java,
are capable of supporting “varargs” style arguments in which the final argument can
be an array of arguments that share a type. Because varargs arguments must be
the same type, they are essentially a single parameter: a typed array. Martin (2008)
makes the same point: if the variable arguments are treated the same (as they usually
are), they can be treated as a single argument for the purposes of metrics gathering.
Number of Static Methods
Static methods are methods that belong to a class but do not require an instance of
that class to invoke them. All data the method requires for completion are passed
into it. This points to a disconnect between the data used by a class responsibility
(the parameters) and the implementation of that responsibility (the method itself).
In other words, why does the method belong to the class if the data it uses do not?
Static methods indicate that the boundaries of encapsulation are incorrectly
placed, and as such they indicate a low level of cohesion. A static method that
operates on data really belongs in the class that has that data to begin with. The
only real reason to make that method static is if, for example, Class A and Class
B both require the same method but can in no way be part of the same inheritance
hierarchy. This indicates that a responsibility has been split into two (or more) places
which means that cohesion is low.
Another way of thinking about static methods is in terms of where those meth-
Quantitatively Evaluating Test-Driven Development 26
ods truly belong. For example, Java contains a class called Math which contains a
number of static methods, one of which is abs. This allows a programmer to get the
absolute value of a number by calling Math.abs(-5). But really, the responsibility
of taking the absolute value of a number should belong to the number itself, since
that number contains all of the relevant data to perform the task. Hevery (2008)
argues it would be better to write -5.abs(), but of course Java does not allow this.
Because of this limitation, one of the true responsibilities of the Number class is found
in Math, decreasing the overall cohesion of Number. Math suffers from an obvious
lack of cohesion, containing functions relating to Algebra (abs, sqrt, pow, log, etc),
Trigonometry (sin, cos, tan, etc), and Statistics (random, max, min) all lumped to-
gether in a single class (Sun Microsystems, 2009). Static methods are a good indicator
that class responsibilities are in the wrong place.
The Number of Static Methods (NSM) can be counted in a straightforward
way, simply counting the number of methods on a class that are declared static.
Coupling
Another contributor to bad code is a high degree of coupling. Page-Jones (1999)
defines coupling as the degree to which different modules depend on each other. In
object-oriented programming, if a class x contains a variable of type y, or calls services
on y, or references y as a parameter or a return type, or is a subclass of y, then x
is coupled to‘ y. Coupling, in and of itself, does not constitute bad code; in a well-
designed system, modules are going to have to interact with other modules. Problems
arise based on the type of coupling that is used.
A module has content coupling when one module modifies or relies on the in-
ternal workings of another module. Changing one module requires changing another
module.
In contrast, when a module uses message coupling, modules are not dependent
on each other even when they use each other. Modules communicate by exchanging
messages via a public interface. One module can be changed without affecting any
other modules as long as the interfaces remain the same.
In between these two opposites are, from worst to best, common coupling, exter-
nal coupling, control coupling, data-structured coupling, and data coupling. Message
coupling is considered low, or “loose” coupling, while content coupling is considered
high, or “tight” coupling (Schach, 2006).
Quantitatively Evaluating Test-Driven Development 27
Tight coupling leads to cascading changes. When the engineer changes one
module, she is required to change other modules as well (which can also lead to
highly inaccurate time estimates for how long work will take). Modules are extremely
difficult to understand by looking at them alone, and engineers may have to follow a
chain of modules to figure out what’s happening. Modules are also difficult to reuse,
because they require the undesirable usage of their dependent modules.
When developers complain about having to open dozens of files to support a
change in a specific module, or they lament having to construct instances of many
classes in order to use a specific one, they are experiencing tight coupling.
As with cohesion, a number of metrics have been developed in the software
industry to measure coupling between modules in modern object-oriented systems.
Afferent and Efferent Coupling
Martin (1994) proposed many metrics for keeping track of the coupling between mod-
ules in a system. The simplest two of these are Afferent Coupling and Efferent Cou-
pling.
The Afferent Coupling (Ca) for a package is defined as the number of classes
outside of that package that depend on classes within it. The Efferent Coupling (Ce)
for a package is defined as the number of classes outside of the package that are
depended upon by classes within it.
Quantitatively Evaluating Test-Driven Development 28
Package A Package B
Package C
Package D
q
t
r
u
s
v
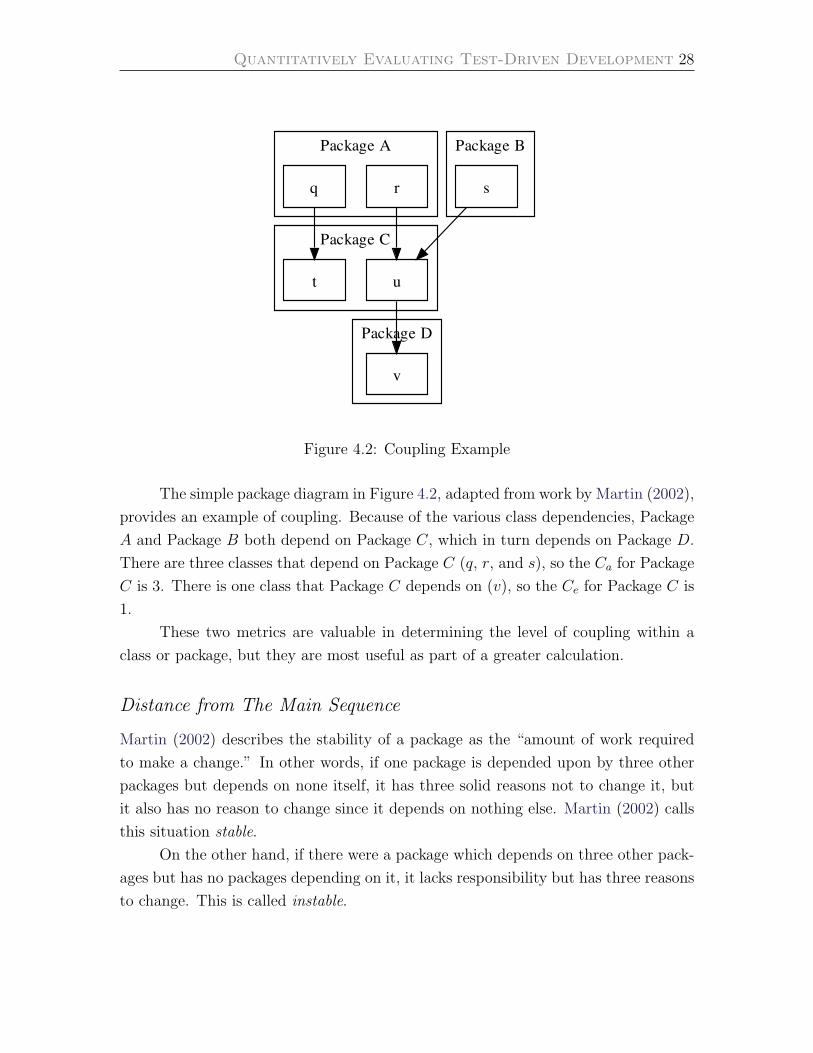
Figure 4.2: Coupling Example
The simple package diagram in Figure 4.2, adapted from work by Martin (2002),
provides an example of coupling. Because of the various class dependencies, Package
A and Package B both depend on Package C, which in turn depends on Package D.
There are three classes that depend on Package C (q, r, and s), so the Ca for Package
C is 3. There is one class that Package C depends on (v), so the Ce for Package C is
1.
These two metrics are valuable in determining the level of coupling within a
class or package, but they are most useful as part of a greater calculation.
Distance from The Main Sequence
Martin (2002) describes the stability of a package as the “amount of work required
to make a change.” In other words, if one package is depended upon by three other
packages but depends on none itself, it has three solid reasons not to change it, but
it also has no reason to change since it depends on nothing else. Martin (2002) calls
this situation stable.
On the other hand, if there were a package which depends on three other pack-
ages but has no packages depending on it, it lacks responsibility but has three reasons
to change. This is called instable.
Quantitatively Evaluating Test-Driven Development 29
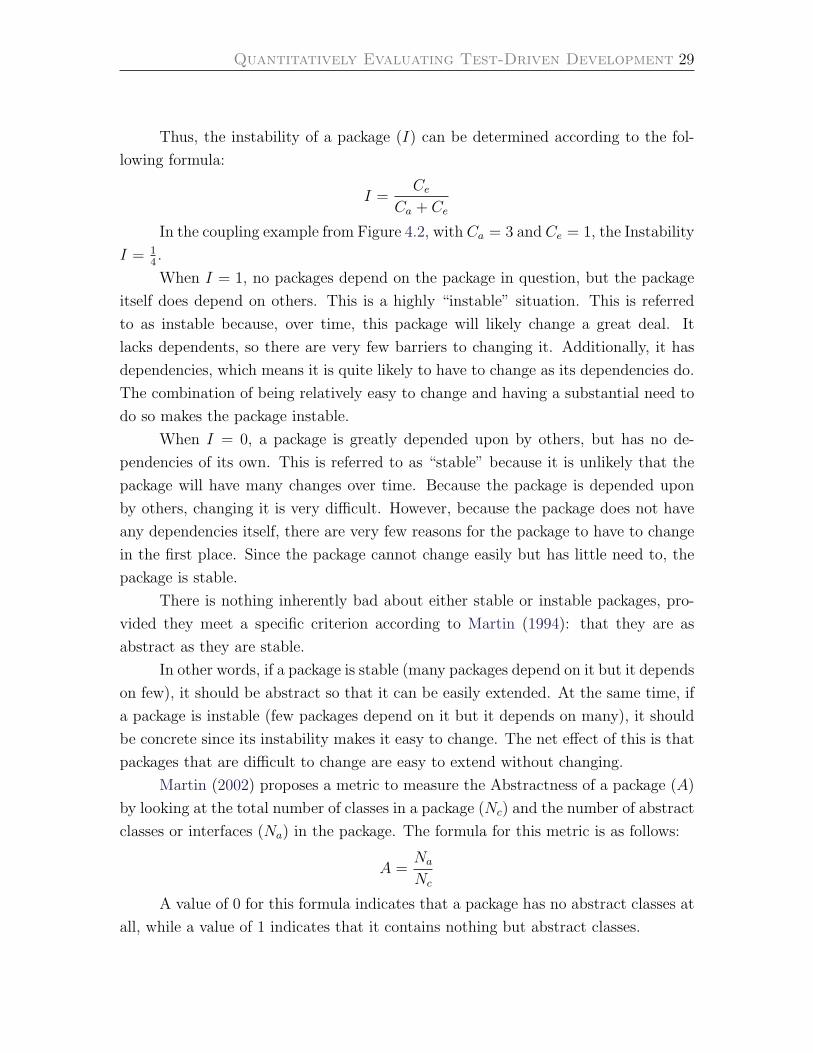
Thus, the instability of a package (I) can be determined according to the fol-
lowing formula:
I =Ce
Ca + Ce
In the coupling example from Figure 4.2, with Ca = 3 and Ce = 1, the Instability
I = 14.
When I = 1, no packages depend on the package in question, but the package
itself does depend on others. This is a highly “instable” situation. This is referred
to as instable because, over time, this package will likely change a great deal. It
lacks dependents, so there are very few barriers to changing it. Additionally, it has
dependencies, which means it is quite likely to have to change as its dependencies do.
The combination of being relatively easy to change and having a substantial need to
do so makes the package instable.
When I = 0, a package is greatly depended upon by others, but has no de-
pendencies of its own. This is referred to as “stable” because it is unlikely that the
package will have many changes over time. Because the package is depended upon
by others, changing it is very difficult. However, because the package does not have
any dependencies itself, there are very few reasons for the package to have to change
in the first place. Since the package cannot change easily but has little need to, the
package is stable.
There is nothing inherently bad about either stable or instable packages, pro-
vided they meet a specific criterion according to Martin (1994): that they are as
abstract as they are stable.
In other words, if a package is stable (many packages depend on it but it depends
on few), it should be abstract so that it can be easily extended. At the same time, if
a package is instable (few packages depend on it but it depends on many), it should
be concrete since its instability makes it easy to change. The net effect of this is that
packages that are difficult to change are easy to extend without changing.
Martin (2002) proposes a metric to measure the Abstractness of a package (A)
by looking at the total number of classes in a package (Nc) and the number of abstract
classes or interfaces (Na) in the package. The formula for this metric is as follows:
A =Na
Nc
A value of 0 for this formula indicates that a package has no abstract classes at
all, while a value of 1 indicates that it contains nothing but abstract classes.
Quantitatively Evaluating Test-Driven Development 30
Since both A and I are fractional values between 0 and 1, and since the rule of
thumb is that a package should be as abstract as it is stable, it means that a package
is ideal when it’s value for I is inversely proportional to its value for A. A package
is an ideal state when it has A = 1 and I = 0 or when it has A = 0 and I = 1. A
package could still be considered ideal if it has A = 0.8 and I = 0.2 as well.
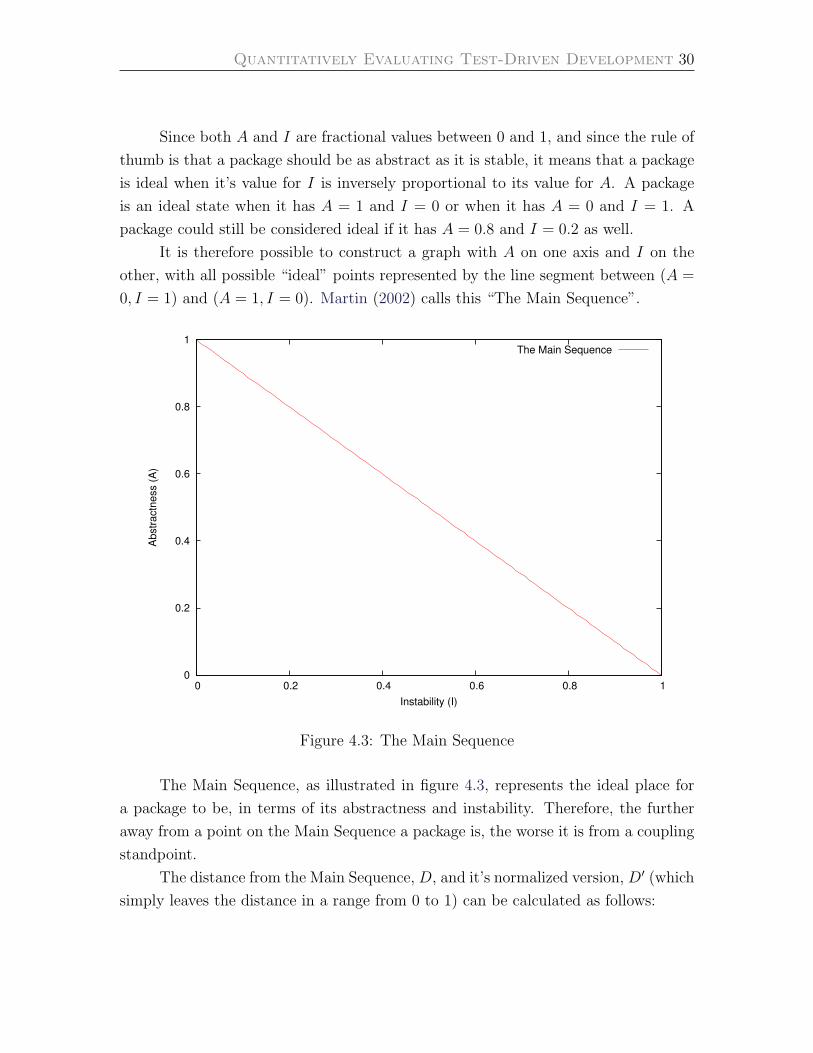
It is therefore possible to construct a graph with A on one axis and I on the
other, with all possible “ideal” points represented by the line segment between (A =
0, I = 1) and (A = 1, I = 0). Martin (2002) calls this “The Main Sequence”.
0
0.2
0.4
0.6
0.8
1
0 0.2 0.4 0.6 0.8 1
Abstr
actn
ess (
A)
Instability (I)
The Main Sequence
Figure 4.3: The Main Sequence
The Main Sequence, as illustrated in figure 4.3, represents the ideal place for
a package to be, in terms of its abstractness and instability. Therefore, the further
away from a point on the Main Sequence a package is, the worse it is from a coupling
standpoint.
The distance from the Main Sequence, D, and it’s normalized version, D′ (which
simply leaves the distance in a range from 0 to 1) can be calculated as follows:
Quantitatively Evaluating Test-Driven Development 31
D =|A+ I − 1|√
2D′ = |A+ I − 1|
A value of 0 for D′ indicates that a package is directly on the main sequence,
while a value of 1 indicates it is as far away as possible.
Depth of Inheritance Tree
When a class implementation extends another class implementation, the correctness
of the former is tied to the latter. Bloch (2008) argues that inheritance violates
encapsulation because it exposes the implementation of a parent class to the child
class, and strongly advises that programmers favor composition over inheritance.
Kegel and Steimann (2008) refer to inheritance as a “curse because it establishes a
strong coupling between classes.”
Inheritance is an indicator of high coupling, and it can be measured by sim-
ply looking at any given class and counting the number of classes as one traverses
up the inheritance tree until one finds a generic parent class (in the case of Java,
java.lang.Object is the ancestor of all objects). This metric is called Depth of
Inheritance Tree (DIT )
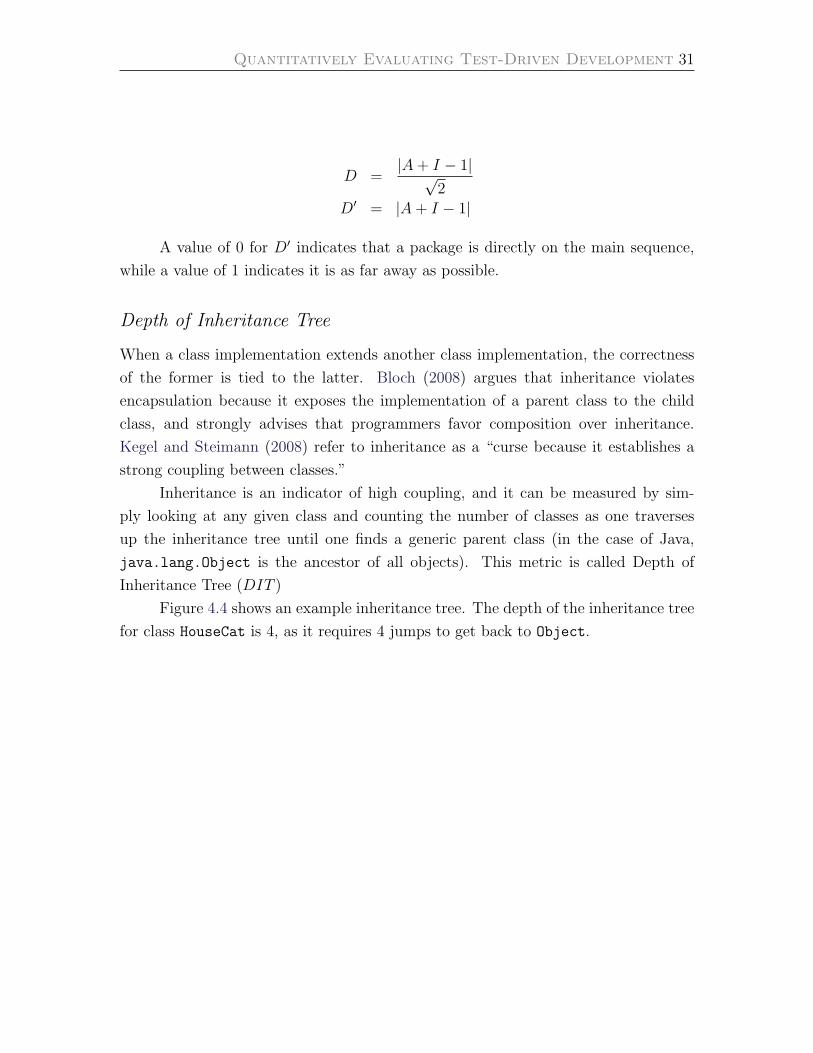
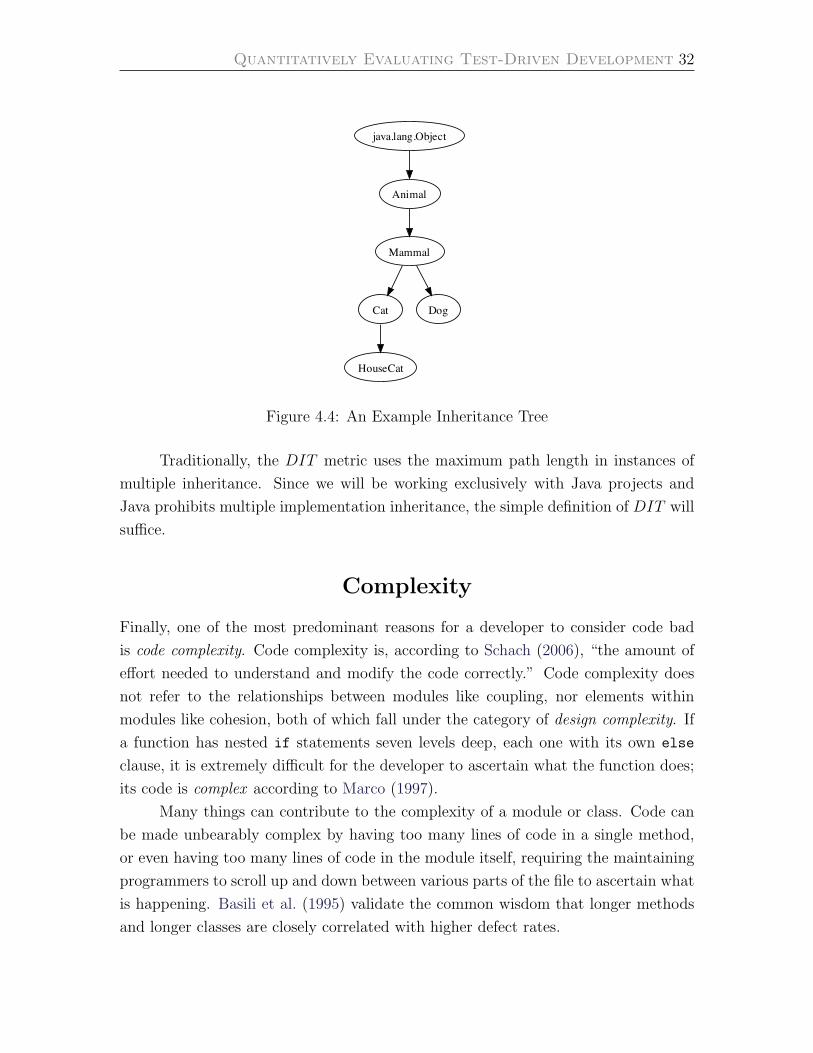
Figure 4.4 shows an example inheritance tree. The depth of the inheritance tree
for class HouseCat is 4, as it requires 4 jumps to get back to Object.
Quantitatively Evaluating Test-Driven Development 32
java.lang.Object
Animal
Mammal
Cat Dog
HouseCat
Figure 4.4: An Example Inheritance Tree
Traditionally, the DIT metric uses the maximum path length in instances of
multiple inheritance. Since we will be working exclusively with Java projects and
Java prohibits multiple implementation inheritance, the simple definition of DIT will
suffice.
Complexity
Finally, one of the most predominant reasons for a developer to consider code bad
is code complexity. Code complexity is, according to Schach (2006), “the amount of
effort needed to understand and modify the code correctly.” Code complexity does
not refer to the relationships between modules like coupling, nor elements within
modules like cohesion, both of which fall under the category of design complexity. If
a function has nested if statements seven levels deep, each one with its own else
clause, it is extremely difficult for the developer to ascertain what the function does;
its code is complex according to Marco (1997).
Many things can contribute to the complexity of a module or class. Code can
be made unbearably complex by having too many lines of code in a single method,
or even having too many lines of code in the module itself, requiring the maintaining
programmers to scroll up and down between various parts of the file to ascertain what
is happening. Basili et al. (1995) validate the common wisdom that longer methods
and longer classes are closely correlated with higher defect rates.
Quantitatively Evaluating Test-Driven Development 33
Code can be made complex by having poor commenting, or misleading com-
menting. It can be complex because it contains too many branching statements
such as if statements or switch statements, or even too many nested loops. Char-
ney (2005) argues that code is complex when variable names are too short or non-
descriptive, because it’s difficult for engineers to remember what purpose a variable
serves when it is encountered in the code without good names. If expressions contain
too many nested parentheses or functions take too many arguments, it is difficult for
developers understand or change them according to Martin (2008).
Code that is “clever” also tends to be complex. According to Kernighan and
Plauger (1978), “everyone knows that debugging is twice as hard as writing a program
in the first place. So if you’re as clever as you can be when you write it, how will you
ever debug it?” This is a simple but powerful argument against writing code that
tests the skills of the developers writing it.
Complex code is difficult to understand, difficult to modify, and extraordinarily
difficult to test according to Glover (2006). Furthermore, as argued by Shore and
Warden (2007), code that is difficult to test often lacks automated tests, which makes
it difficult to refactor the code with confidence.
When developers express frustration at a module they can’t understand or
lament how large a source code file is, or when testers have trouble figuring out
how to test all of the possible execution paths through code, they are dealing with
code complexity. Even if a program consisted of a single class (which therefore has
no coupling problems) with a single responsibility (which therefore has no cohesion
problems), that program can still be extremely difficult to read, understand, and
maintain. Such a program suffers from high complexity.
Complexity is a bit more vague than cohesion and coupling, so naturally it is
somewhat more difficult to measure. Nonetheless, there are some imperfect metrics
available that help determine if a project suffers from high complexity.
Size of Methods and Classes
A number of indicators of problematic code are listed by Fowler et al. (1999). These
indicators are called “code smells.” The second code smell mentioned, preceded
only by “Duplicate Code,” is “Long Method.” The third is “Large Class.” Clearly,
software professionals feel that the sizes of methods and classes has an impact on the
quality of code.
Quantitatively Evaluating Test-Driven Development 34
Longer methods and classes are more difficult to understand and more prone to
defects. A 2002 study conducted by El Emam et al. (2002) indicate that shorter code
is, in general, desirable for reducing the number of defects in a system. Kerievsky
(2004) favors methods around 10 lines of code or less and makes a case that breaking
long methods into a series of short methods will often lead to a higher level of reuse.
As argued by Fowler et al. (1999), methods and classes should be so short that new
programmers should feel as though “no computation ever takes place, that object
programs are endless sequences of delegation.”
Measuring methods and classes is a relatively straightforward process, since the
number of lines in code can be easily measured. However, comments and white-space
help make code clearer, so they shouldn’t be counted in size-based metrics.
The size of a section of code can be determined simply by counting the number
of non-blank, non-comment lines of source code in the section. It is important for this
metric to ignore blank lines and comments, because simple differences in formatting
taste could lead to widely varying measurements for the metric.
A common metric, Total Lines of Code, should not be used as a measure of code
complexity, as it is not so much an estimate of code complexity as it is of software
complexity (software with more features tends to have more code than software with
fewer features). Another common metric, number of methods per class, should not be
used as an estimate of code complexity because many professionals, including Martin
(2008), argue that multiple small methods actually make code easier to understand
than a small number of long methods.
McCabe Cyclomatic Complexity
The more if, else, for, and while statements within a code block, the more complex
it is. More decision-making code means more possible paths through the code. The
greater the number of possible paths, the more difficult it is for engineers to fully
understand the flow of the code, and the harder it is to modify.
McCabe (1976) proposed one of the earliest software metrics for measuring this
exact type of problem. Today it is referred to as McCabe Cyclomatic Complexity. The
Cyclomatic Complexity of a block of code is essentially the number of possible paths
through that code. A block with no loops or conditionals has a McCabe Cyclomatic
Complexity of 1, due to the fact that no decisions are made. A block of code with
exactly one if statement has one decision to make in the code, and has a higher
Quantitatively Evaluating Test-Driven Development 35
Cyclomatic Complexity.
A method’s McCabe Cyclomatic Complexity (MCC) isn’t quite the same as the
number of actual paths through the method, it is the number of linearly independent
paths. MCC is the number of decision points plus 1, and it is meant to represent
the smallest set of paths which can be combined together to create all possible paths
through the code (Ponczak and Miller, 2007).
Formally, the McCabe Cyclomatic Complexity of a block of code proposes the
existence of a directed graph in which every statement is represented as a node, and
every opportunity for control flow to pass from one statement to another is represented
as an edge. If E is the number of edges, N is the number of nodes, and P is the number
of independent subgraphs, the McCabe Cyclomatic Complexity MCC is defined as:
MCC = E −N + P
When looking at the McCabe Cyclomatic Complexity of methods, there are no
disconnected subgraphs, and P is always 1 in this case.
The following code example is simple enough to easily determine its McCabe
Cyclomatic Complexity:
public class McCabe {
private Bar bar;
public void performWork(boolean a, boolean b) {
if (a) {
bar.baz();
} else {
bar.quux();
}
if (b) {
bar.corge();
} else {
bar.grault();
}
}
}
The graph for this code is in Figure 4.5. In the graph, there are 8 nodes and 10
edges, and the graph is fully connected (there are no disconnected subgraphs). Thus
the McCabe Cyclomatic Complexity formula yields 10 − 8 + 1 = 3. This method is
more complex and difficult to understand than a method with a McCabe Cyclomatic
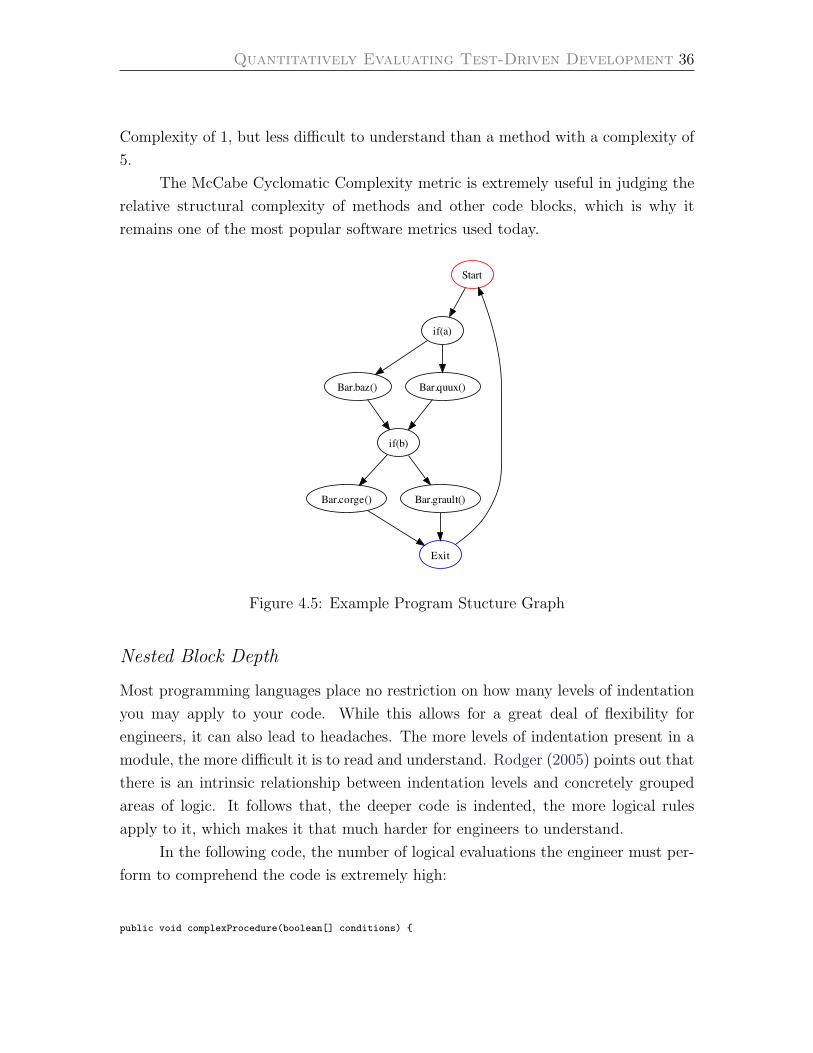
Quantitatively Evaluating Test-Driven Development 36
Complexity of 1, but less difficult to understand than a method with a complexity of
5.
The McCabe Cyclomatic Complexity metric is extremely useful in judging the
relative structural complexity of methods and other code blocks, which is why it
remains one of the most popular software metrics used today.
Start
if(a)
Bar.baz() Bar.quux()
if(b)
Bar.corge() Bar.grault()
Exit
Figure 4.5: Example Program Stucture Graph
Nested Block Depth
Most programming languages place no restriction on how many levels of indentation
you may apply to your code. While this allows for a great deal of flexibility for
engineers, it can also lead to headaches. The more levels of indentation present in a
module, the more difficult it is to read and understand. Rodger (2005) points out that
there is an intrinsic relationship between indentation levels and concretely grouped
areas of logic. It follows that, the deeper code is indented, the more logical rules
apply to it, which makes it that much harder for engineers to understand.
In the following code, the number of logical evaluations the engineer must per-
form to comprehend the code is extremely high:
public void complexProcedure(boolean[] conditions) {
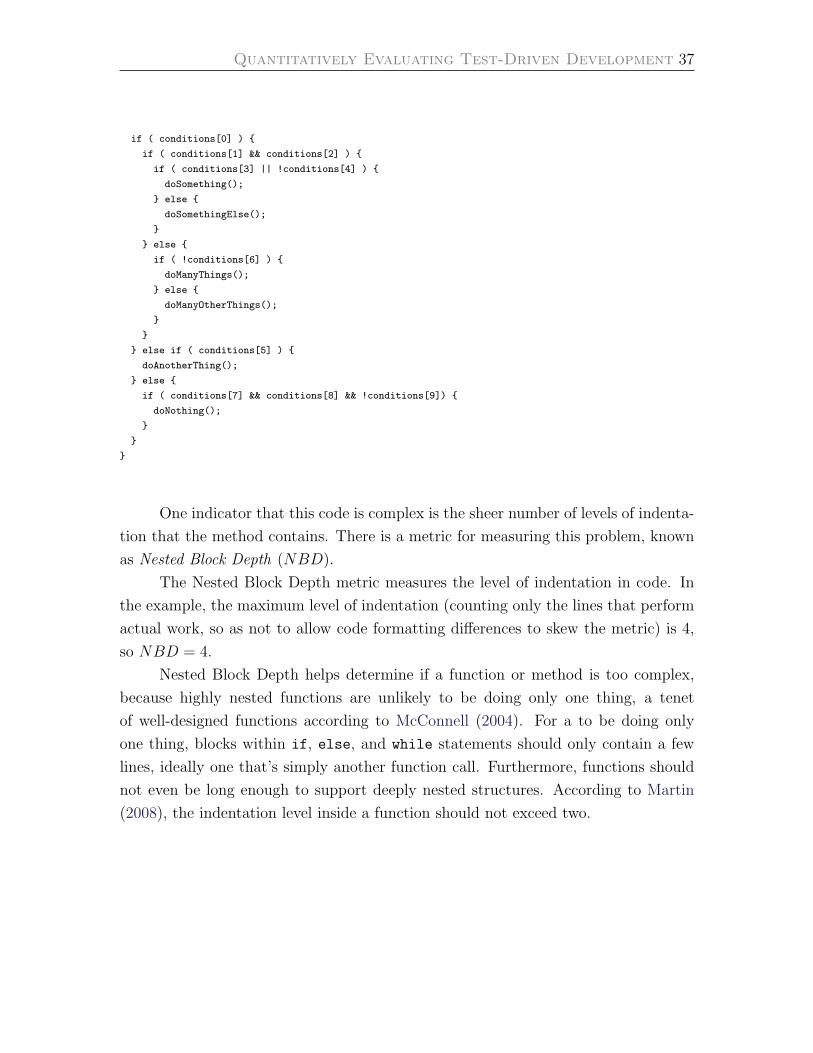
Quantitatively Evaluating Test-Driven Development 37
if ( conditions[0] ) {
if ( conditions[1] && conditions[2] ) {
if ( conditions[3] || !conditions[4] ) {
doSomething();
} else {
doSomethingElse();
}
} else {
if ( !conditions[6] ) {
doManyThings();
} else {
doManyOtherThings();
}
}
} else if ( conditions[5] ) {
doAnotherThing();
} else {
if ( conditions[7] && conditions[8] && !conditions[9]) {
doNothing();
}
}
}
One indicator that this code is complex is the sheer number of levels of indenta-
tion that the method contains. There is a metric for measuring this problem, known
as Nested Block Depth (NBD).
The Nested Block Depth metric measures the level of indentation in code. In
the example, the maximum level of indentation (counting only the lines that perform
actual work, so as not to allow code formatting differences to skew the metric) is 4,
so NBD = 4.
Nested Block Depth helps determine if a function or method is too complex,
because highly nested functions are unlikely to be doing only one thing, a tenet
of well-designed functions according to McConnell (2004). For a to be doing only
one thing, blocks within if, else, and while statements should only contain a few
lines, ideally one that’s simply another function call. Furthermore, functions should
not even be long enough to support deeply nested structures. According to Martin
(2008), the indentation level inside a function should not exceed two.
Chapter 5
Description of Experiment
This work used the metrics outlined in Chapter 4 as a measurement of code quality.
Though these metrics are not a perfect way to determine the quality of code, the bene-
fit of using them is that they are objective. Metrics are based in simple measurements
of source code - applying metrics to the same code base twice will yield identical re-
sults, whereas other potential measurements of code quality are more subjective and
may not have such consistent and concrete results.
This work created two code samples - code that was written using Test-Driven
Development (the experimental group) and code that was written without it (the
control group). To obtain large enough samples of industrial, real-world code, Open
Source projects were used.
Surveys were sent out to the developer mailing lists for dozens of Open Source
projects. The projects were written in the same language (Java) to prevent language
differences from influencing the measurements. The surveys helped determine which
projects were written using TDD and which were not, which allowed for the creation
of the two groups.
Measurements were then taken using Eclipse Metrics, detailed on page 45.
Survey Setup
The survey was created using Google Docs with the Spreadsheet/Form editor. The
URL to the survey was sent to the developer mailing lists for a number of different
open source projects, and the results were automatically entered into a spreadsheet.
If the project was too small to have a mailing list, the URL was sent directly to the
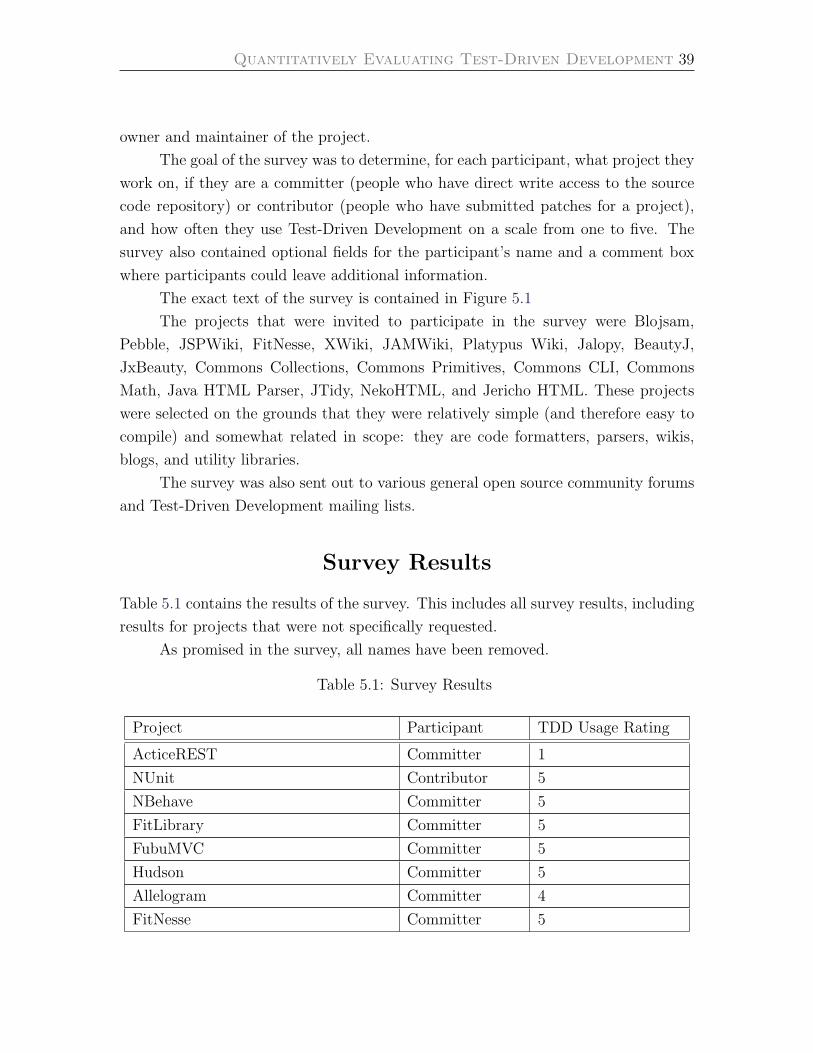
Quantitatively Evaluating Test-Driven Development 39
owner and maintainer of the project.
The goal of the survey was to determine, for each participant, what project they
work on, if they are a committer (people who have direct write access to the source
code repository) or contributor (people who have submitted patches for a project),
and how often they use Test-Driven Development on a scale from one to five. The
survey also contained optional fields for the participant’s name and a comment box
where participants could leave additional information.
The exact text of the survey is contained in Figure 5.1
The projects that were invited to participate in the survey were Blojsam,
Pebble, JSPWiki, FitNesse, XWiki, JAMWiki, Platypus Wiki, Jalopy, BeautyJ,
JxBeauty, Commons Collections, Commons Primitives, Commons CLI, Commons
Math, Java HTML Parser, JTidy, NekoHTML, and Jericho HTML. These projects
were selected on the grounds that they were relatively simple (and therefore easy to
compile) and somewhat related in scope: they are code formatters, parsers, wikis,
blogs, and utility libraries.
The survey was also sent out to various general open source community forums
and Test-Driven Development mailing lists.
Survey Results
Table 5.1 contains the results of the survey. This includes all survey results, including
results for projects that were not specifically requested.
As promised in the survey, all names have been removed.
Table 5.1: Survey Results
Project Participant TDD Usage Rating
ActiceREST Committer 1
NUnit Contributor 5
NBehave Committer 5
FitLibrary Committer 5
FubuMVC Committer 5
Hudson Committer 5
Allelogram Committer 4
FitNesse Committer 5
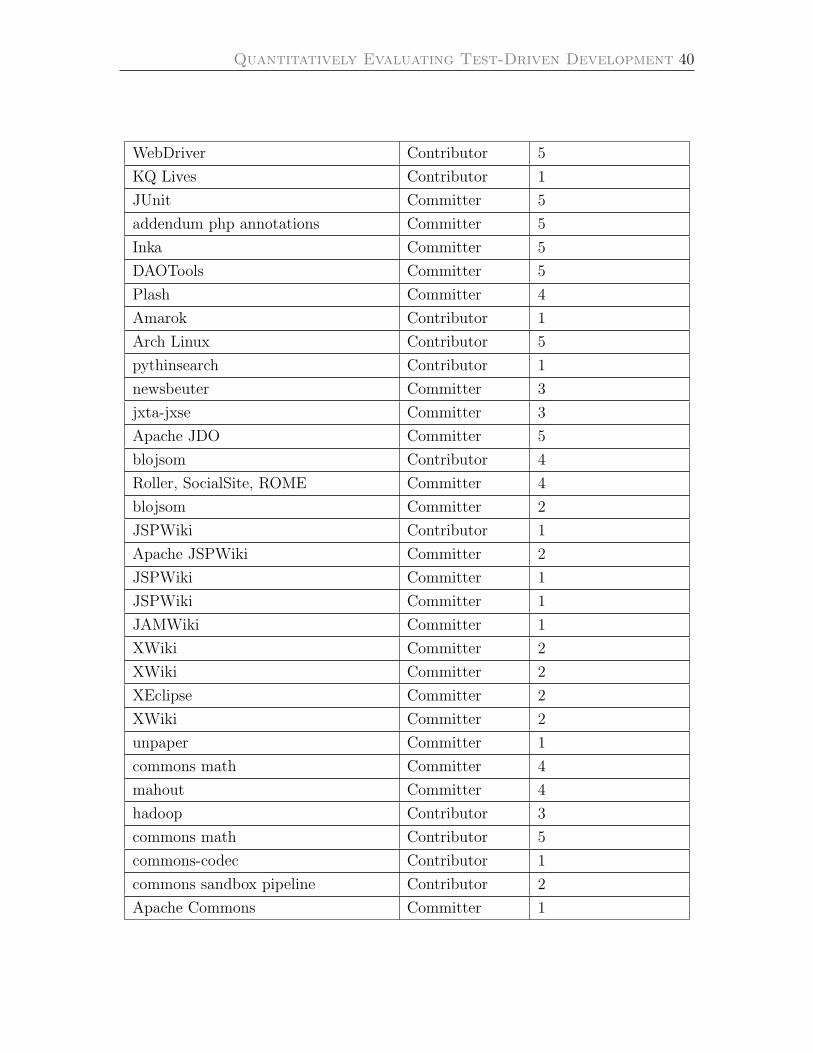
Quantitatively Evaluating Test-Driven Development 40
WebDriver Contributor 5
KQ Lives Contributor 1
JUnit Committer 5
addendum php annotations Committer 5
Inka Committer 5
DAOTools Committer 5
Plash Committer 4
Amarok Contributor 1
Arch Linux Contributor 5
pythinsearch Contributor 1
newsbeuter Committer 3
jxta-jxse Committer 3
Apache JDO Committer 5
blojsom Contributor 4
Roller, SocialSite, ROME Committer 4
blojsom Committer 2
JSPWiki Contributor 1
Apache JSPWiki Committer 2
JSPWiki Committer 1
JSPWiki Committer 1
JAMWiki Committer 1
XWiki Committer 2
XWiki Committer 2
XEclipse Committer 2
XWiki Committer 2
unpaper Committer 1
commons math Committer 4
mahout Committer 4
hadoop Contributor 3
commons math Contributor 5
commons-codec Contributor 1
commons sandbox pipeline Contributor 2
Apache Commons Committer 1
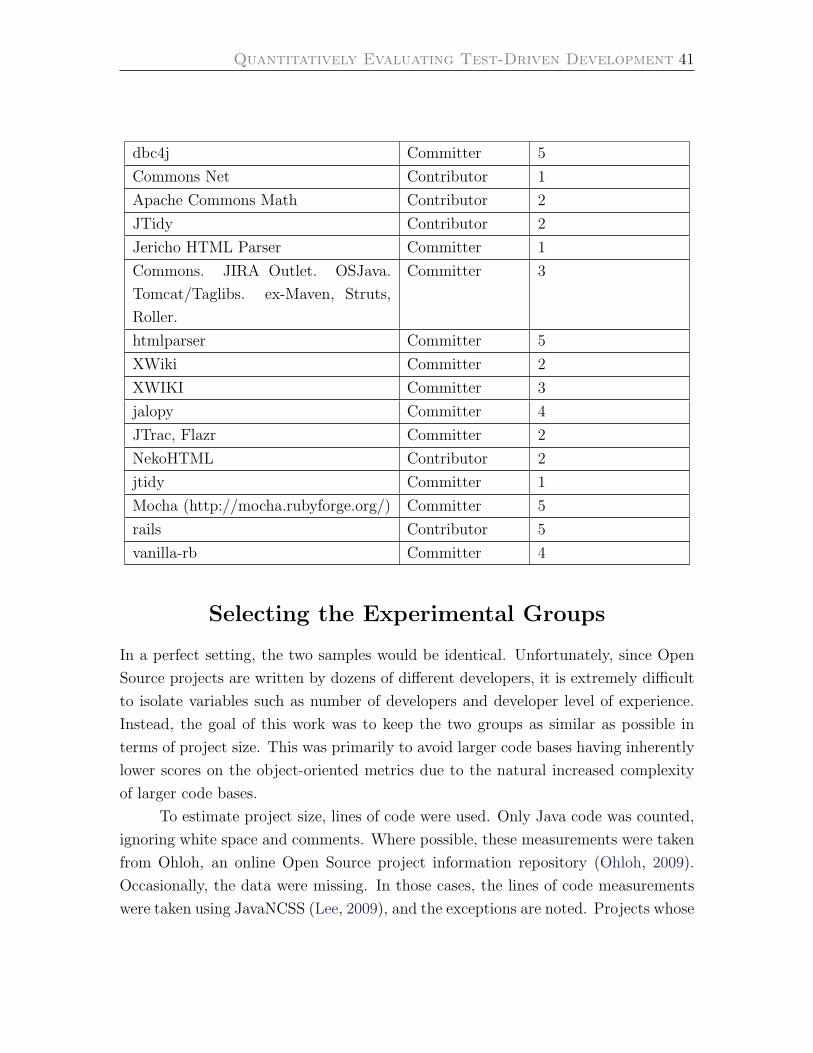
Quantitatively Evaluating Test-Driven Development 41
dbc4j Committer 5
Commons Net Contributor 1
Apache Commons Math Contributor 2
JTidy Contributor 2
Jericho HTML Parser Committer 1
Commons. JIRA Outlet. OSJava.
Tomcat/Taglibs. ex-Maven, Struts,
Roller.
Committer 3
htmlparser Committer 5
XWiki Committer 2
XWIKI Committer 3
jalopy Committer 4
JTrac, Flazr Committer 2
NekoHTML Contributor 2
jtidy Committer 1
Mocha (http://mocha.rubyforge.org/) Committer 5
rails Contributor 5
vanilla-rb Committer 4
Selecting the Experimental Groups
In a perfect setting, the two samples would be identical. Unfortunately, since Open
Source projects are written by dozens of different developers, it is extremely difficult
to isolate variables such as number of developers and developer level of experience.
Instead, the goal of this work was to keep the two groups as similar as possible in
terms of project size. This was primarily to avoid larger code bases having inherently
lower scores on the object-oriented metrics due to the natural increased complexity
of larger code bases.
To estimate project size, lines of code were used. Only Java code was counted,
ignoring white space and comments. Where possible, these measurements were taken
from Ohloh, an online Open Source project information repository (Ohloh, 2009).
Occasionally, the data were missing. In those cases, the lines of code measurements
were taken using JavaNCSS (Lee, 2009), and the exceptions are noted. Projects whose
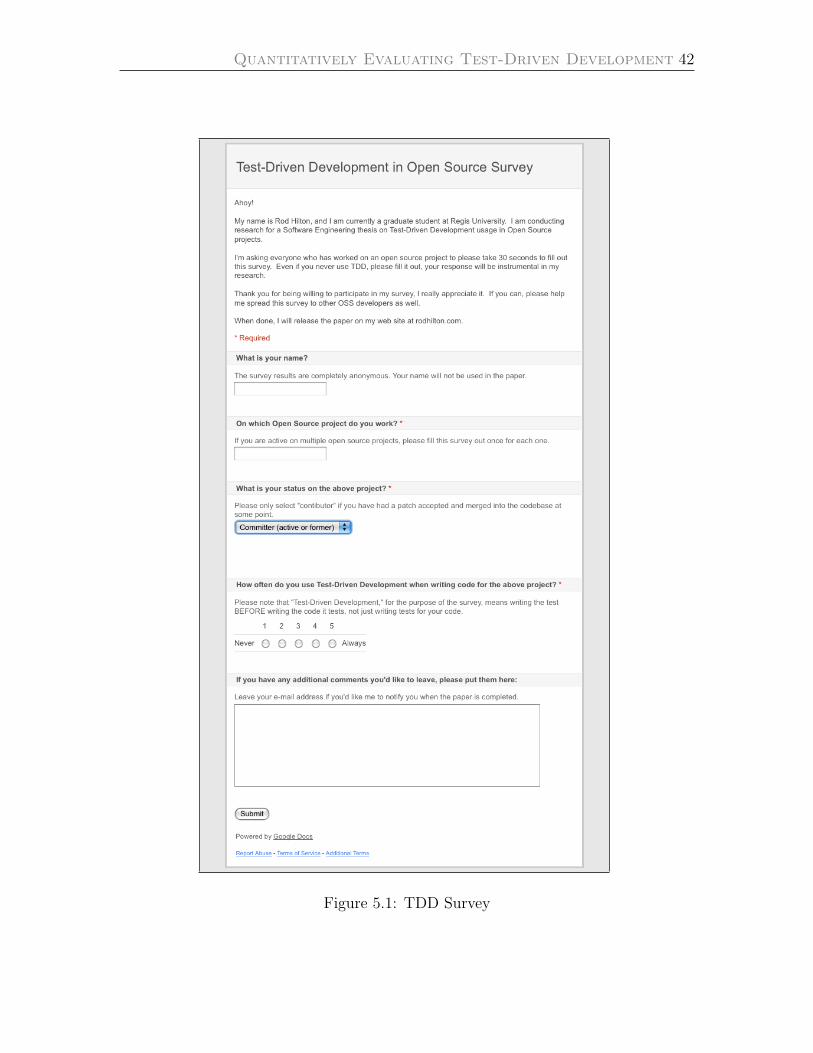
Quantitatively Evaluating Test-Driven Development 42
Figure 5.1: TDD Survey
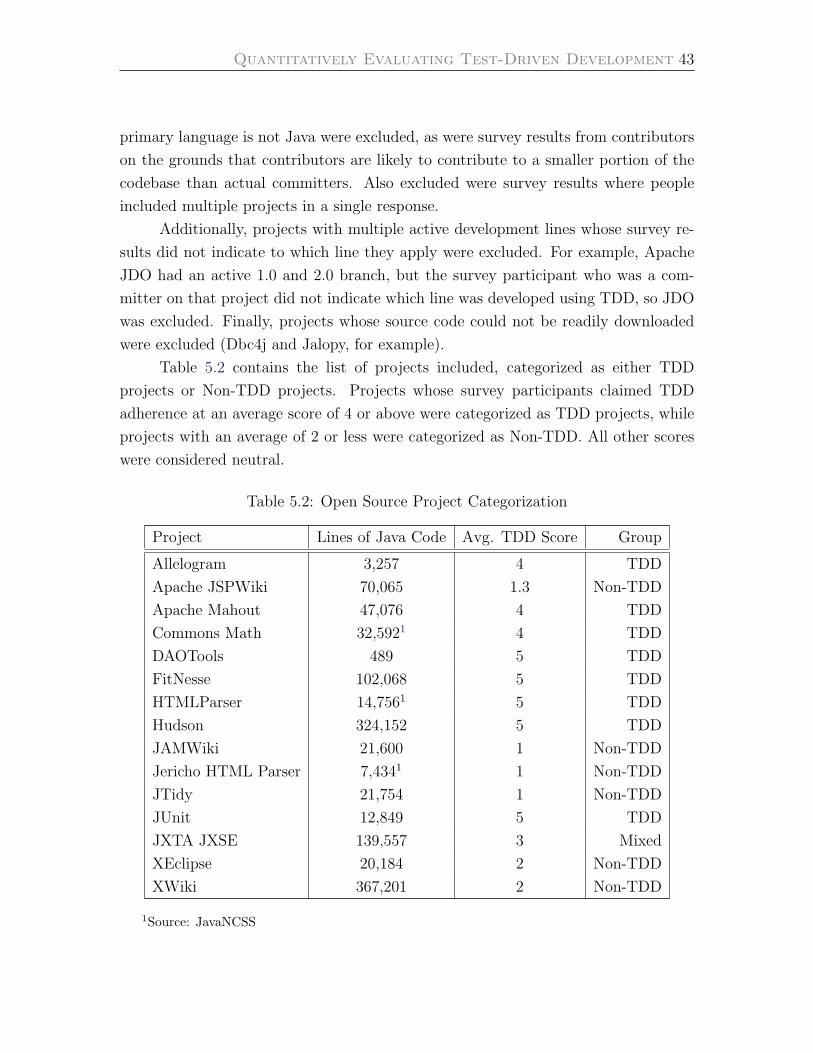
Quantitatively Evaluating Test-Driven Development 43
primary language is not Java were excluded, as were survey results from contributors
on the grounds that contributors are likely to contribute to a smaller portion of the
codebase than actual committers. Also excluded were survey results where people
included multiple projects in a single response.
Additionally, projects with multiple active development lines whose survey re-
sults did not indicate to which line they apply were excluded. For example, Apache
JDO had an active 1.0 and 2.0 branch, but the survey participant who was a com-
mitter on that project did not indicate which line was developed using TDD, so JDO
was excluded. Finally, projects whose source code could not be readily downloaded
were excluded (Dbc4j and Jalopy, for example).
Table 5.2 contains the list of projects included, categorized as either TDD
projects or Non-TDD projects. Projects whose survey participants claimed TDD
adherence at an average score of 4 or above were categorized as TDD projects, while
projects with an average of 2 or less were categorized as Non-TDD. All other scores
were considered neutral.
Table 5.2: Open Source Project Categorization
Project Lines of Java Code Avg. TDD Score Group
Allelogram 3,257 4 TDD
Apache JSPWiki 70,065 1.3 Non-TDD
Apache Mahout 47,076 4 TDD
Commons Math 32,5921 4 TDD
DAOTools 489 5 TDD
FitNesse 102,068 5 TDD
HTMLParser 14,7561 5 TDD
Hudson 324,152 5 TDD
JAMWiki 21,600 1 Non-TDD
Jericho HTML Parser 7,4341 1 Non-TDD
JTidy 21,754 1 Non-TDD
JUnit 12,849 5 TDD
JXTA JXSE 139,557 3 Mixed
XEclipse 20,184 2 Non-TDD
XWiki 367,201 2 Non-TDD
1Source: JavaNCSS
Quantitatively Evaluating Test-Driven Development 44
For both the TDD and Non-TDD group, this work selected a small (about
10,000 Lines of Java code) project, a medium (about 30,000 lines) project, a large
(about 100,000 lines) project, and a very large (about 300,000 lines) project. The
selected projects were JUnit, Commons Math, FitNesse, and Hudson in the TDD
experimental group, and Jericho HTML Parser, JAMWiki, JSPWiki, and XWiki in
the Non-TDD control group.
Exclusions
The code that was analyzed was a specific subset of the overall project code. For
projects that consisted of multiple modules (specifically JAMWiki, Hudson, and
XWiki), only the ‘Core’ module was analyzed. The core modules are likely to be
the ones that are worked on most frequently, and are generally the most important
to the project.
Additionally, all tests were removed prior to analysis. A Test Class T for Class
A inherently couples T to A, unfairly penalizing the coupling scores of projects with
higher test coverage. Most importantly, tests themselves are not designed using TDD,
so their measurement does not tell us anything about the efficacy of Test-Driven
Development.
Furthermore, any code samples that were part of the source tree were excluded.
Occasionally, projects include source code example files for users to have as a point
of reference for using their library. These example files are not part of the real source
tree, and thus were not analyzed as if they were.
Lastly, all generated code was excluded from analysis. Some projects rely on
other tools to generate Java files used in the project. These tools are generally invoked
as part of the project building process. The code output by these tools is inherently
not designed using TDD, and the code is not written by human beings. Generated
code does not contribute to code complexity, as it has little to no reason to be read
(since it cannot be modified by hand). Only source code that was part of the project
prior to the project being built was considered in the analysis.
Versions
Where possible, source code for analysis was checked out directly from the source
code repository for the project. The latest version at the time was generally what
was analyzed. In cases where the latest version of the code was not available or did
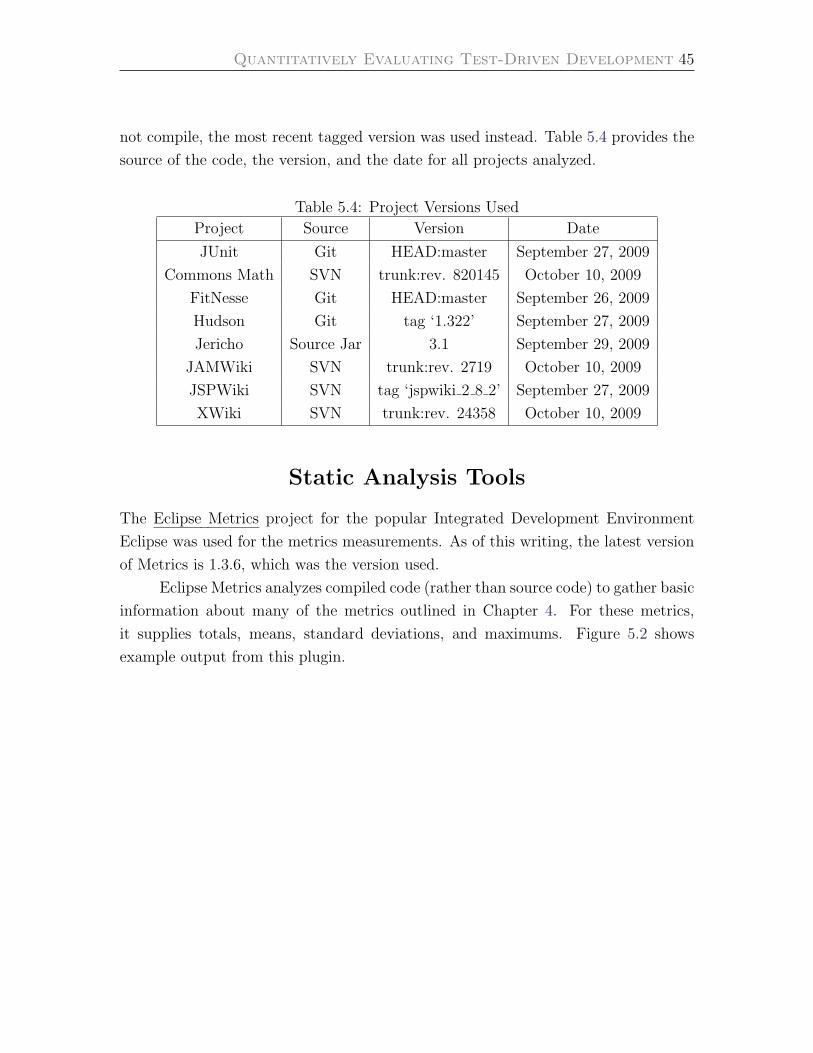
Quantitatively Evaluating Test-Driven Development 45
not compile, the most recent tagged version was used instead. Table 5.4 provides the
source of the code, the version, and the date for all projects analyzed.
Table 5.4: Project Versions Used
Project Source Version Date
JUnit Git HEAD:master September 27, 2009
Commons Math SVN trunk:rev. 820145 October 10, 2009
FitNesse Git HEAD:master September 26, 2009
Hudson Git tag ‘1.322’ September 27, 2009
Jericho Source Jar 3.1 September 29, 2009
JAMWiki SVN trunk:rev. 2719 October 10, 2009
JSPWiki SVN tag ‘jspwiki 2 8 2’ September 27, 2009
XWiki SVN trunk:rev. 24358 October 10, 2009
Static Analysis Tools
The Eclipse Metrics project for the popular Integrated Development Environment
Eclipse was used for the metrics measurements. As of this writing, the latest version
of Metrics is 1.3.6, which was the version used.
Eclipse Metrics analyzes compiled code (rather than source code) to gather basic
information about many of the metrics outlined in Chapter 4. For these metrics,
it supplies totals, means, standard deviations, and maximums. Figure 5.2 shows
example output from this plugin.

Quantitatively Evaluating Test-Driven Development 46
Figure 5.2: The Eclipse Metrics Plugin
For the purposes of this experiment, the overall averages for each project were
used for analysis. Each of these metrics was provided by the tool as an average
per-package, per-class, or per-method.
Eclipse Metrics was able to track all of the desired metrics with a single ex-
ception: the number of lines of code per class. However, the tool did provide the
average Lines of Code per Method (Method Lines of Code, or MLOC) and Methods
per Class. Multiplying these two numbers together yields the Lines of Code per Class
Quantitatively Evaluating Test-Driven Development 47
(Class Lines of Code, or CLOC):
Lines of Code
Method· Method
Class=
Lines of Code
Class
With this calculation for CLOC, Eclipse Metrics provided all of the information
needed to collect the metrics.
Projects were imported into Eclipse using Maven pom.xml or Ant build.xml
files where possible, then had the Eclipse Metrics module enabled before being fully
compiled. Once enabled, the Metrics plugin calculated the various values, which were
then exported in XML format. Eclipse Metrics required that projects successfully
compile before metrics could be tabulated and provided no mechanism for excluding
specific files. Tests and sample code were excluded by simply deleting the files, but
generated code was often required for the project to successfully build, so a Ruby
program was created specifically to parse the Metrics XML and extract the desired
values, excluding from tabulation any files that were deemed as exclusions via the
criteria specified on page 44. The source code for this program can be found in
Appendix A.
Chapter 6
Experimental Results
Using the Eclipse Metrics tool, raw data was gathered for the projects being analyzed.
The data is shown in Figure 6.1, which tracks the Number of Methods (NOM),
Number of Classes (NOC), Number of Packages (NOP ), Lack of Cohesion Meth-
ods (LCOM), Specialization Index (SI), Number of Parameters (PAR), Number of
Static Methods (NSM), Afferent Coupling (Ca), Efferent Coupling (Ce), Normalized
Distance from The Main Sequence (D′), Depth of Inheritance Tree (DIT ), Method
Lines of Code (MLOC), Class Lines of Code (CLOC), McCabe Cyclomatic Com-
plexity (MCC), and Nested Block Depth (NBD) for each project.
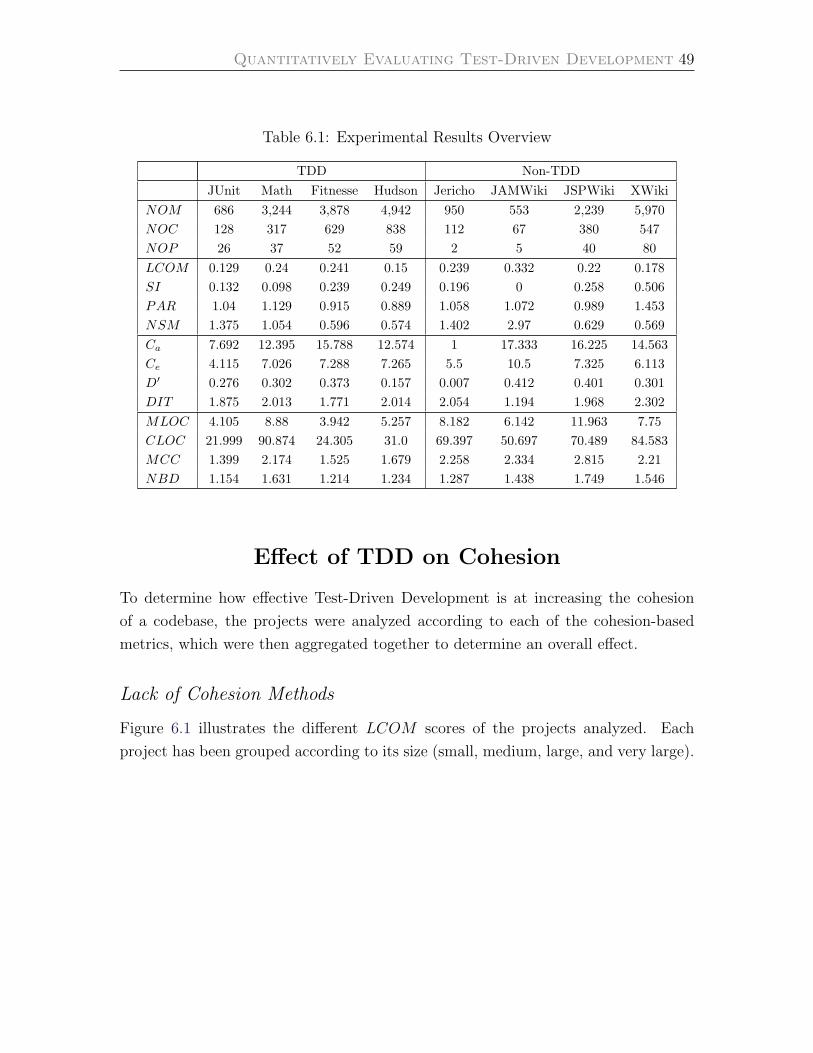
Quantitatively Evaluating Test-Driven Development 49
Table 6.1: Experimental Results Overview
TDD Non-TDDJUnit Math Fitnesse Hudson Jericho JAMWiki JSPWiki XWiki
NOM 686 3,244 3,878 4,942 950 553 2,239 5,970NOC 128 317 629 838 112 67 380 547NOP 26 37 52 59 2 5 40 80LCOM 0.129 0.24 0.241 0.15 0.239 0.332 0.22 0.178SI 0.132 0.098 0.239 0.249 0.196 0 0.258 0.506PAR 1.04 1.129 0.915 0.889 1.058 1.072 0.989 1.453NSM 1.375 1.054 0.596 0.574 1.402 2.97 0.629 0.569Ca 7.692 12.395 15.788 12.574 1 17.333 16.225 14.563Ce 4.115 7.026 7.288 7.265 5.5 10.5 7.325 6.113D′ 0.276 0.302 0.373 0.157 0.007 0.412 0.401 0.301DIT 1.875 2.013 1.771 2.014 2.054 1.194 1.968 2.302MLOC 4.105 8.88 3.942 5.257 8.182 6.142 11.963 7.75CLOC 21.999 90.874 24.305 31.0 69.397 50.697 70.489 84.583MCC 1.399 2.174 1.525 1.679 2.258 2.334 2.815 2.21NBD 1.154 1.631 1.214 1.234 1.287 1.438 1.749 1.546
Effect of TDD on Cohesion
To determine how effective Test-Driven Development is at increasing the cohesion
of a codebase, the projects were analyzed according to each of the cohesion-based
metrics, which were then aggregated together to determine an overall effect.
Lack of Cohesion Methods
Figure 6.1 illustrates the different LCOM scores of the projects analyzed. Each
project has been grouped according to its size (small, medium, large, and very large).
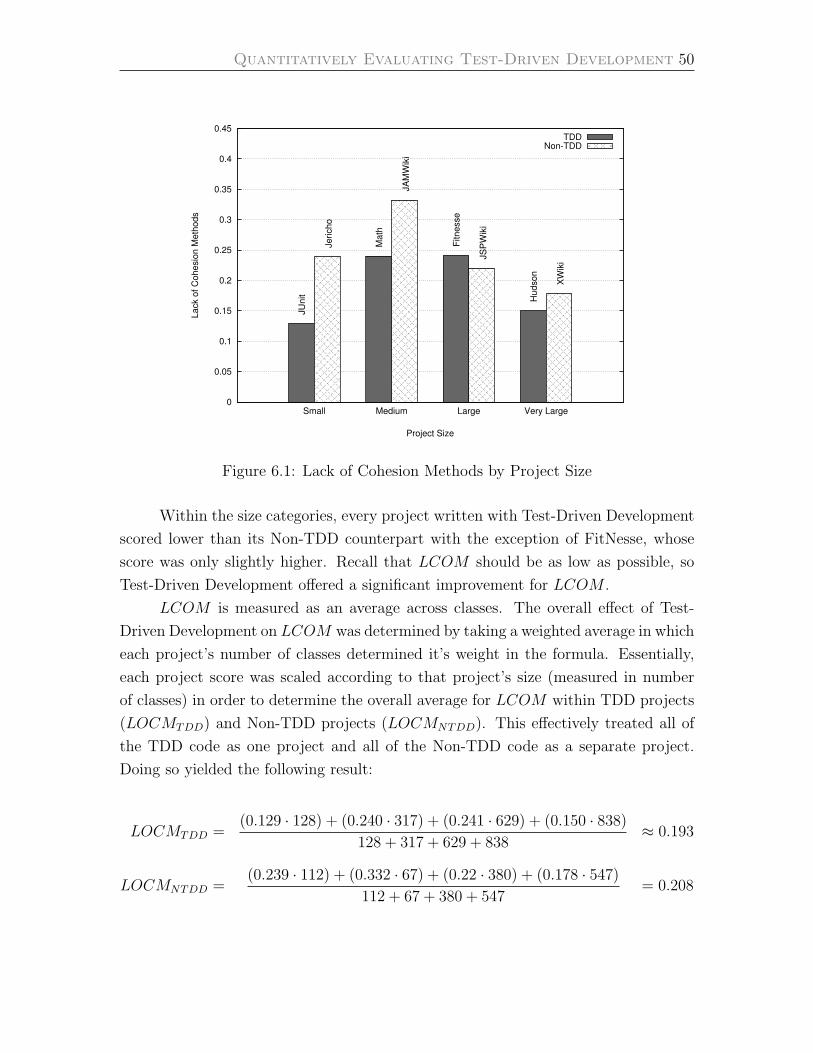
Quantitatively Evaluating Test-Driven Development 50
0
0.05
0.1
0.15
0.2
0.25
0.3
0.35
0.4
0.45
Small Medium Large Very Large
La
ck o
f C
oh
esio
n M
eth
od
s
Project Size
TDDNon-TDD
JU
nit
Ma
th
Fitn
esse
Hu
dso
n
Je
rich
o
JA
MW
iki
JS
PW
iki
XW
iki
Figure 6.1: Lack of Cohesion Methods by Project Size
Within the size categories, every project written with Test-Driven Development
scored lower than its Non-TDD counterpart with the exception of FitNesse, whose
score was only slightly higher. Recall that LCOM should be as low as possible, so
Test-Driven Development offered a significant improvement for LCOM .
LCOM is measured as an average across classes. The overall effect of Test-
Driven Development on LCOM was determined by taking a weighted average in which
each project’s number of classes determined it’s weight in the formula. Essentially,
each project score was scaled according to that project’s size (measured in number
of classes) in order to determine the overall average for LCOM within TDD projects
(LOCMTDD) and Non-TDD projects (LOCMNTDD). This effectively treated all of
the TDD code as one project and all of the Non-TDD code as a separate project.
Doing so yielded the following result:
LOCMTDD =(0.129 · 128) + (0.240 · 317) + (0.241 · 629) + (0.150 · 838)
128 + 317 + 629 + 838≈ 0.193
LOCMNTDD =(0.239 · 112) + (0.332 · 67) + (0.22 · 380) + (0.178 · 547)
112 + 67 + 380 + 547= 0.208

Quantitatively Evaluating Test-Driven Development 51
More precisely, LOCMTDD = 0.1934524 and LOCMNTDD = 0.208. Since
LCOM should be as low as possible, Test-Driven Development offered an average
improvement of 6.97%.
Specialization Index
The effect of Test-Driven Development on the Specialization Index metric is illus-
trated in Figure 6.2.
0
0.1
0.2
0.3
0.4
0.5
0.6
0.7
Small Medium Large Very Large
Sp
ecia
liza
tio
n I
nd
ex
Project Size
TDDNon-TDD
JU
nit
Ma
th
Fitn
esse
Hu
dso
n
Je
rich
o
JA
MW
iki
JS
PW
iki
XW
iki
Figure 6.2: Specialization Index by Project Size
Here again, all of the TDD projects scored better (closer to 0) than their Non-
TDD counterparts with a single exception. In this case, the exception was that
JAMWiki scored significantly better than Commons Math, with a Specialization In-
dex of 0. This low score for JAMWiki was caused by the fact that not a single method
on any class in the codebase overrides a parent method, partially due to the fact that
the vast majority of JAMWiki’s classes extend directly from java.lang.Object.
It is also interesting to observe how much worse XWiki scored on this metric
than its categorical counterpart, Hudson. It could be argued that XWiki is a very
large project, and as such should have a tendency toward complex type hierarchies,
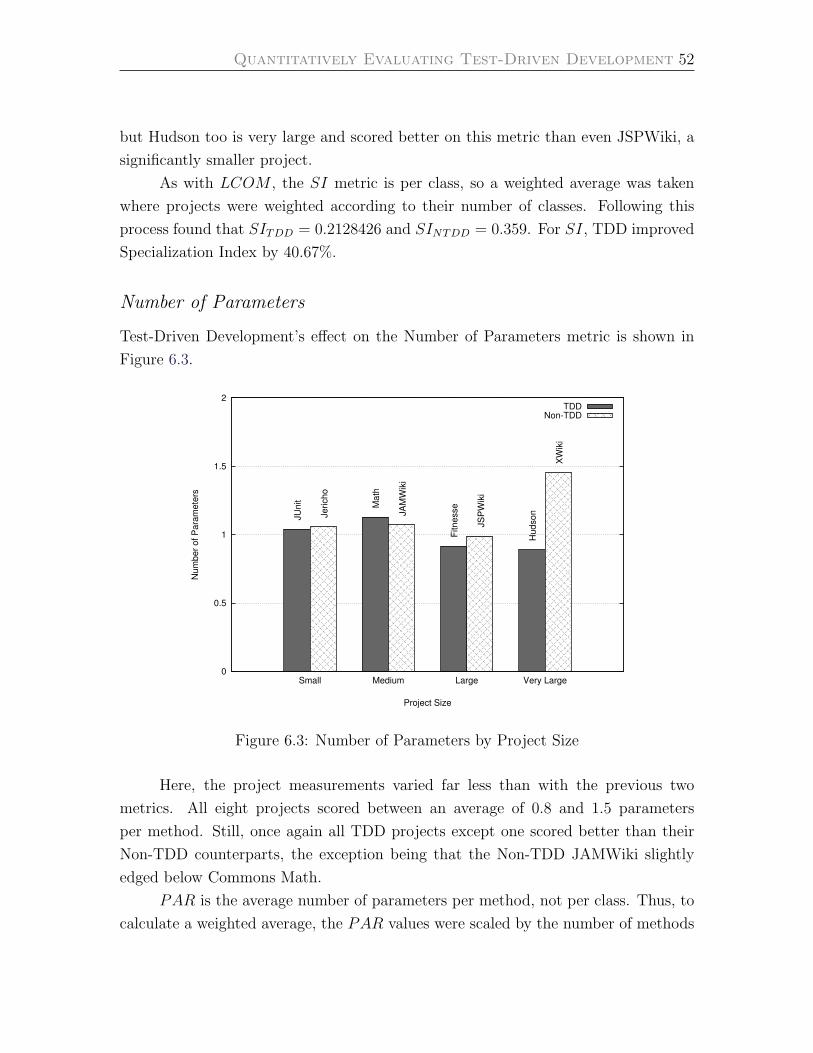
Quantitatively Evaluating Test-Driven Development 52
but Hudson too is very large and scored better on this metric than even JSPWiki, a
significantly smaller project.
As with LCOM , the SI metric is per class, so a weighted average was taken
where projects were weighted according to their number of classes. Following this
process found that SITDD = 0.2128426 and SINTDD = 0.359. For SI, TDD improved
Specialization Index by 40.67%.
Number of Parameters
Test-Driven Development’s effect on the Number of Parameters metric is shown in
Figure 6.3.
0
0.5
1
1.5
2
Small Medium Large Very Large
Nu
mb
er
of
Pa
ram
ete
rs
Project Size
TDDNon-TDD
JU
nit Ma
th
Fitn
esse
Hu
dso
nJe
rich
o
JA
MW
iki
JS
PW
iki
XW
iki
Figure 6.3: Number of Parameters by Project Size
Here, the project measurements varied far less than with the previous two
metrics. All eight projects scored between an average of 0.8 and 1.5 parameters
per method. Still, once again all TDD projects except one scored better than their
Non-TDD counterparts, the exception being that the Non-TDD JAMWiki slightly
edged below Commons Math.
PAR is the average number of parameters per method, not per class. Thus, to
calculate a weighted average, the PAR values were scaled by the number of methods
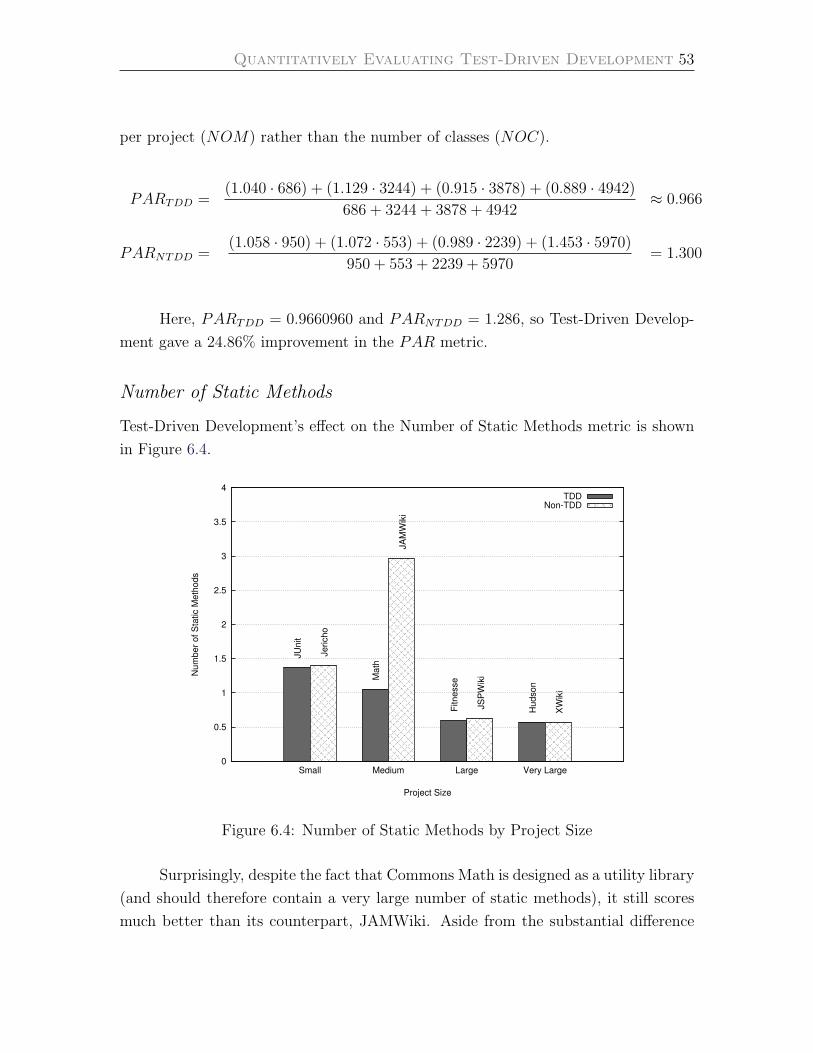
Quantitatively Evaluating Test-Driven Development 53
per project (NOM) rather than the number of classes (NOC).
PARTDD =(1.040 · 686) + (1.129 · 3244) + (0.915 · 3878) + (0.889 · 4942)
686 + 3244 + 3878 + 4942≈ 0.966
PARNTDD =(1.058 · 950) + (1.072 · 553) + (0.989 · 2239) + (1.453 · 5970)
950 + 553 + 2239 + 5970= 1.300
Here, PARTDD = 0.9660960 and PARNTDD = 1.286, so Test-Driven Develop-
ment gave a 24.86% improvement in the PAR metric.
Number of Static Methods
Test-Driven Development’s effect on the Number of Static Methods metric is shown
in Figure 6.4.
0
0.5
1
1.5
2
2.5
3
3.5
4
Small Medium Large Very Large
Nu
mb
er
of
Sta
tic M
eth
od
s
Project Size
TDDNon-TDD
JU
nit
Ma
th
Fitn
esse
Hu
dso
n
Je
rich
o
JA
MW
iki
JS
PW
iki
XW
iki
Figure 6.4: Number of Static Methods by Project Size
Surprisingly, despite the fact that Commons Math is designed as a utility library
(and should therefore contain a very large number of static methods), it still scores
much better than its counterpart, JAMWiki. Aside from the substantial difference
Quantitatively Evaluating Test-Driven Development 54
between Commons Math and JAMWiki, the projects didn’t differ much for the NSM
metric.
NSM is the average number of static methods per class, so the overall effect
of TDD on NSM was calculated in the same way as LCOM and SI. When this
was done, NSMTDD = 0.7144425 and NSMNTDD = 0.819. For NSM , Test-Driven
Development offered an improvement of 12.81%
Overall
The overall effect of Test-Driven Development on cohesion is summarized in Table
6.3. The overall effect was determined by taking the average of the improvement
percentages.
Table 6.3: Test-Driven Development’s Effect on Cohesion
Metric TDD Non-TDD TDD Improvement
LCOM 0.1934524 0.208 6.97%
SI 0.2128426 0.359 40.67%
PAR 0.9660960 1.286 24.86%
NSM 0.7144425 0.819 12.81%
Overall 21.33%
According to this data, Test-Driven Development improved the level of cohesion
by about 21%.
When this same process was modified to use a regular arithmetic mean in place
of the weighted average for each metric, Test-Driven Development improved the level
of cohesion by 24%. This indicates that the process of taking a weighted average
rather than an arithmetic mean did not drastically alter the results.
Effect of TDD on Coupling
Following the same analyzation process used to determine Test-Driven Development’s
effect on cohesion, TDD’s effect on coupling was determined.
Afferent Coupling
Test-Driven Development’s effect on Afferent Coupling is shown in Figure 6.5.
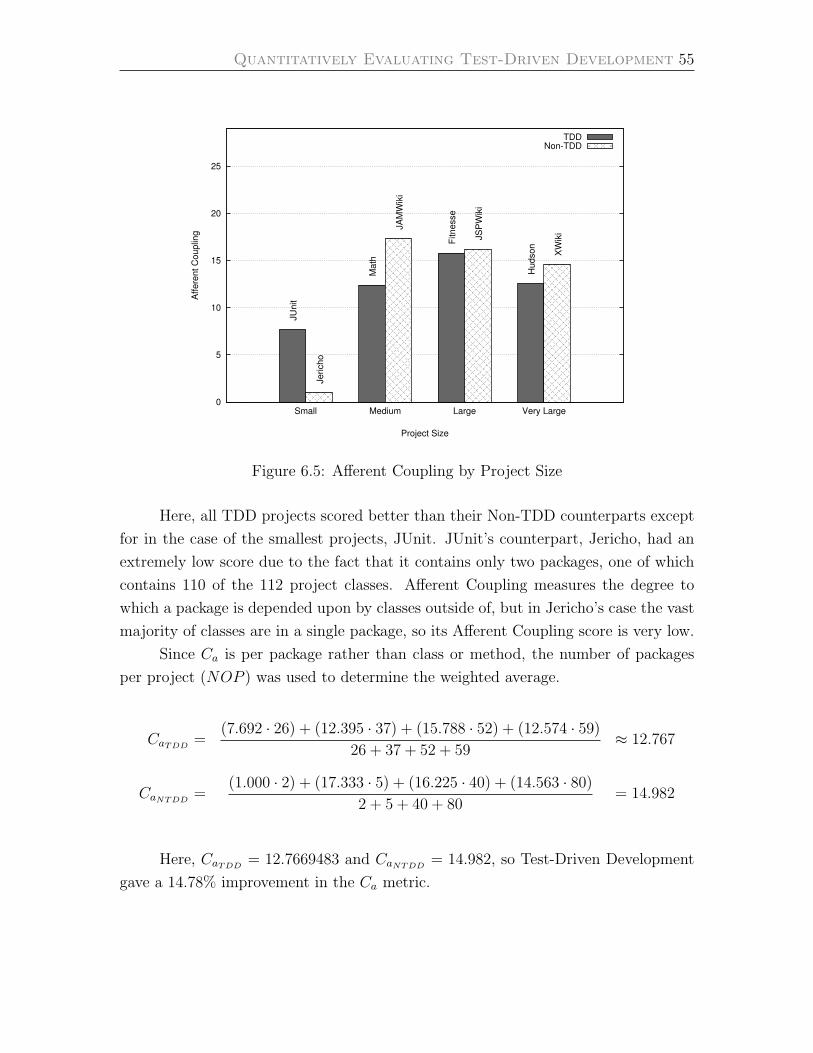
Quantitatively Evaluating Test-Driven Development 55
0
5
10
15
20
25
Small Medium Large Very Large
Aff
ere
nt
Co
up
ling
Project Size
TDDNon-TDD
JU
nit
Ma
th
Fitn
esse
Hu
dso
n
Je
rich
o
JA
MW
iki
JS
PW
iki
XW
iki
Figure 6.5: Afferent Coupling by Project Size
Here, all TDD projects scored better than their Non-TDD counterparts except
for in the case of the smallest projects, JUnit. JUnit’s counterpart, Jericho, had an
extremely low score due to the fact that it contains only two packages, one of which
contains 110 of the 112 project classes. Afferent Coupling measures the degree to
which a package is depended upon by classes outside of, but in Jericho’s case the vast
majority of classes are in a single package, so its Afferent Coupling score is very low.
Since Ca is per package rather than class or method, the number of packages
per project (NOP ) was used to determine the weighted average.
CaTDD=
(7.692 · 26) + (12.395 · 37) + (15.788 · 52) + (12.574 · 59)
26 + 37 + 52 + 59≈ 12.767
CaNTDD=
(1.000 · 2) + (17.333 · 5) + (16.225 · 40) + (14.563 · 80)
2 + 5 + 40 + 80= 14.982
Here, CaTDD= 12.7669483 and CaNTDD
= 14.982, so Test-Driven Development
gave a 14.78% improvement in the Ca metric.
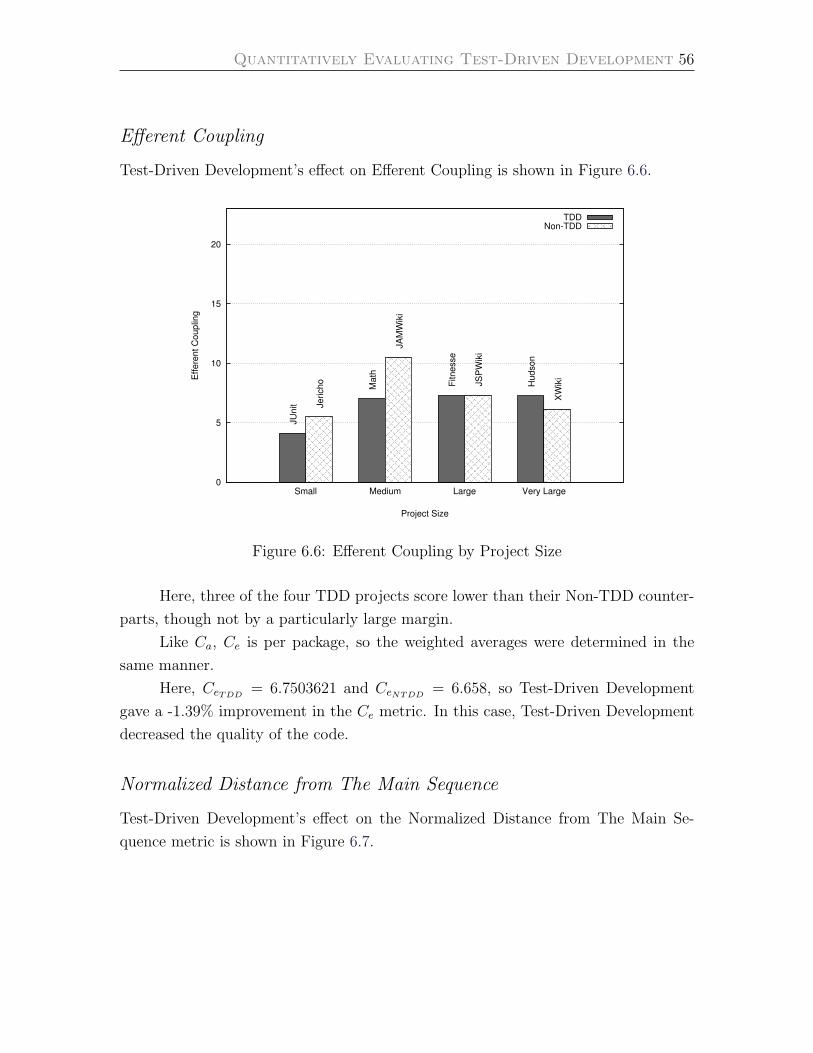
Quantitatively Evaluating Test-Driven Development 56
Efferent Coupling
Test-Driven Development’s effect on Efferent Coupling is shown in Figure 6.6.
0
5
10
15
20
Small Medium Large Very Large
Eff
ere
nt
Co
up
ling
Project Size
TDDNon-TDD
JU
nit
Ma
th
Fitn
esse
Hu
dso
n
Je
rich
o
JA
MW
iki
JS
PW
iki
XW
iki
Figure 6.6: Efferent Coupling by Project Size
Here, three of the four TDD projects score lower than their Non-TDD counter-
parts, though not by a particularly large margin.
Like Ca, Ce is per package, so the weighted averages were determined in the
same manner.
Here, CeTDD= 6.7503621 and CeNTDD
= 6.658, so Test-Driven Development
gave a -1.39% improvement in the Ce metric. In this case, Test-Driven Development
decreased the quality of the code.
Normalized Distance from The Main Sequence
Test-Driven Development’s effect on the Normalized Distance from The Main Se-
quence metric is shown in Figure 6.7.
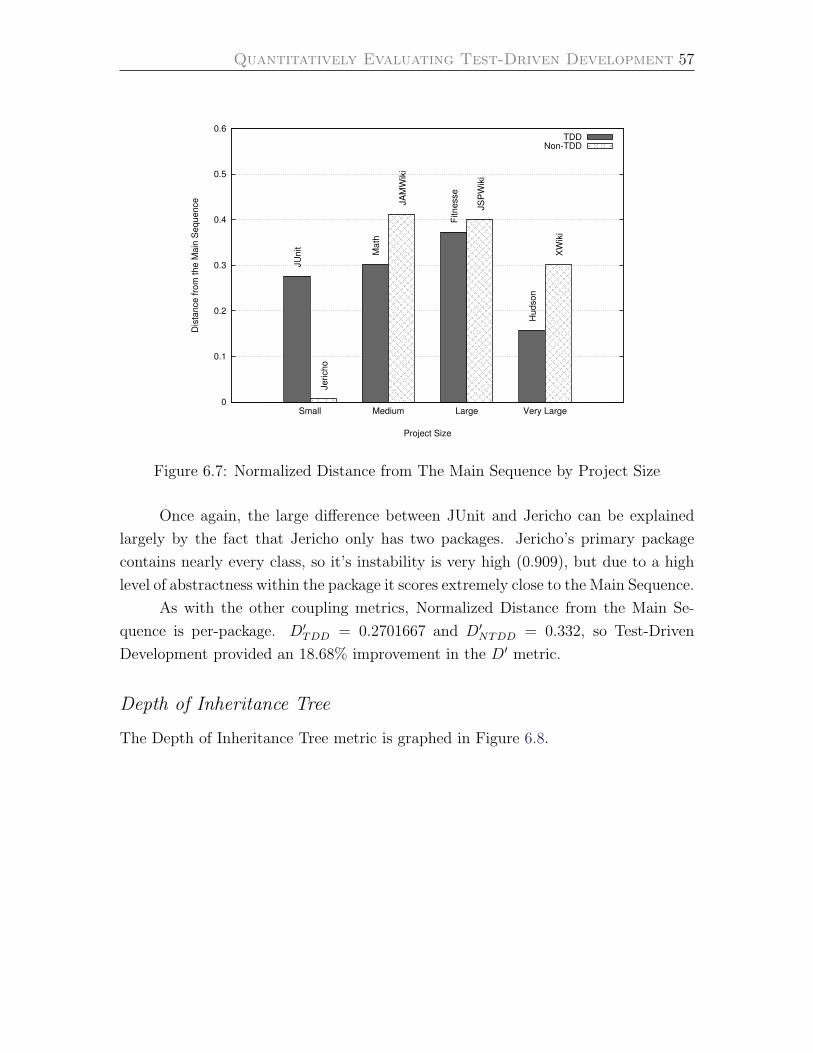
Quantitatively Evaluating Test-Driven Development 57
0
0.1
0.2
0.3
0.4
0.5
0.6
Small Medium Large Very Large
Dis
tan
ce
fro
m t
he
Ma
in S
eq
ue
nce
Project Size
TDDNon-TDD
JU
nit Ma
th
Fitn
esse
Hu
dso
n
Je
rich
o
JA
MW
iki
JS
PW
iki
XW
iki
Figure 6.7: Normalized Distance from The Main Sequence by Project Size
Once again, the large difference between JUnit and Jericho can be explained
largely by the fact that Jericho only has two packages. Jericho’s primary package
contains nearly every class, so it’s instability is very high (0.909), but due to a high
level of abstractness within the package it scores extremely close to the Main Sequence.
As with the other coupling metrics, Normalized Distance from the Main Se-
quence is per-package. D′TDD = 0.2701667 and D′
NTDD = 0.332, so Test-Driven
Development provided an 18.68% improvement in the D′ metric.
Depth of Inheritance Tree
The Depth of Inheritance Tree metric is graphed in Figure 6.8.

Quantitatively Evaluating Test-Driven Development 58
0
0.5
1
1.5
2
2.5
3
3.5
Small Medium Large Very Large
De
pth
of
Inh
erita
nce
Tre
e
Project Size
TDDNon-TDD
JU
nit
Ma
th
Fitn
esse
Hu
dso
n
Je
rich
o
JA
MW
iki
JS
PW
iki
XW
iki
Figure 6.8: Depth of Inheritance Tree by Project Size
Once again, JAMWiki scores extremely well on the metric for the same reason
it scored so well on the SI metric: the project uses very little inheritance at all.
JAMWiki not only bested its TDD counterpart, but outscored all seven of the other
projects in the study.
Unlike other coupling metrics, DIT is measured per class, not per package. The
weighted average for this metric utilized NOC like LCOM .
DITTDD = 1.9245879 and D′NTDD = 2.095, so Test-Driven Development gave
an 8.13% improvement in the DIT metric.
Overall
The overall effect of TDD on coupling is summarized in Table 6.4.
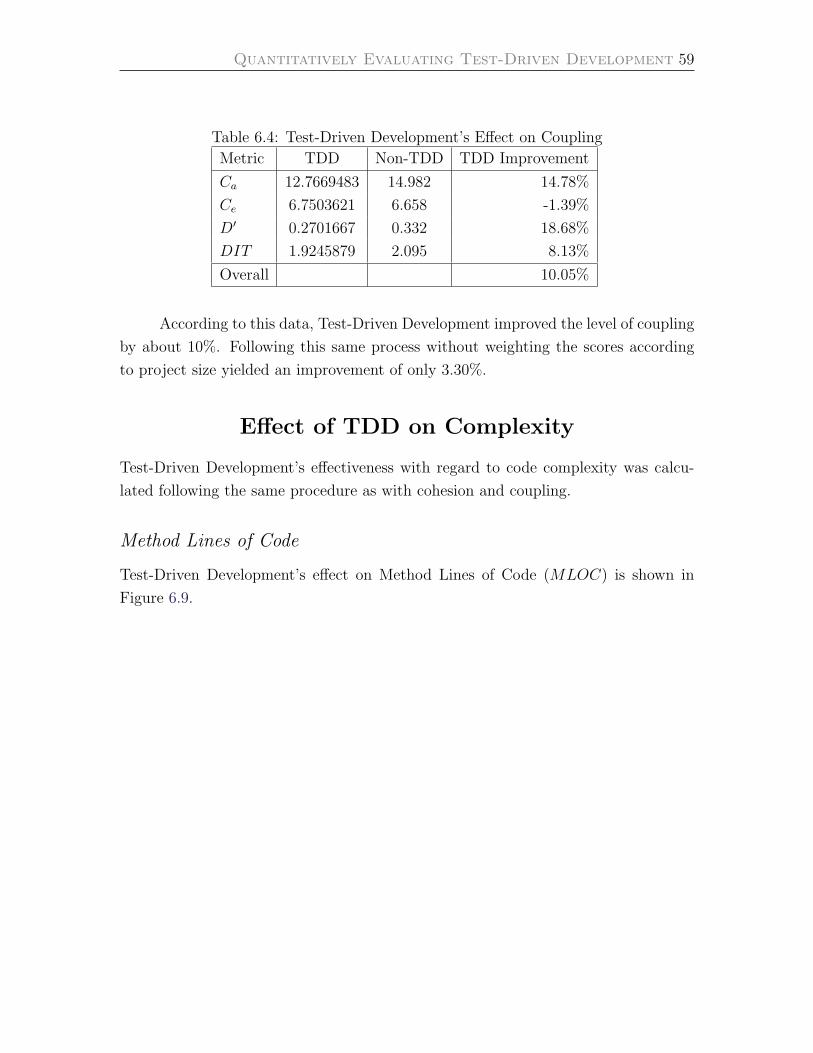
Quantitatively Evaluating Test-Driven Development 59
Table 6.4: Test-Driven Development’s Effect on Coupling
Metric TDD Non-TDD TDD Improvement
Ca 12.7669483 14.982 14.78%
Ce 6.7503621 6.658 -1.39%
D′ 0.2701667 0.332 18.68%
DIT 1.9245879 2.095 8.13%
Overall 10.05%
According to this data, Test-Driven Development improved the level of coupling
by about 10%. Following this same process without weighting the scores according
to project size yielded an improvement of only 3.30%.
Effect of TDD on Complexity
Test-Driven Development’s effectiveness with regard to code complexity was calcu-
lated following the same procedure as with cohesion and coupling.
Method Lines of Code
Test-Driven Development’s effect on Method Lines of Code (MLOC) is shown in
Figure 6.9.
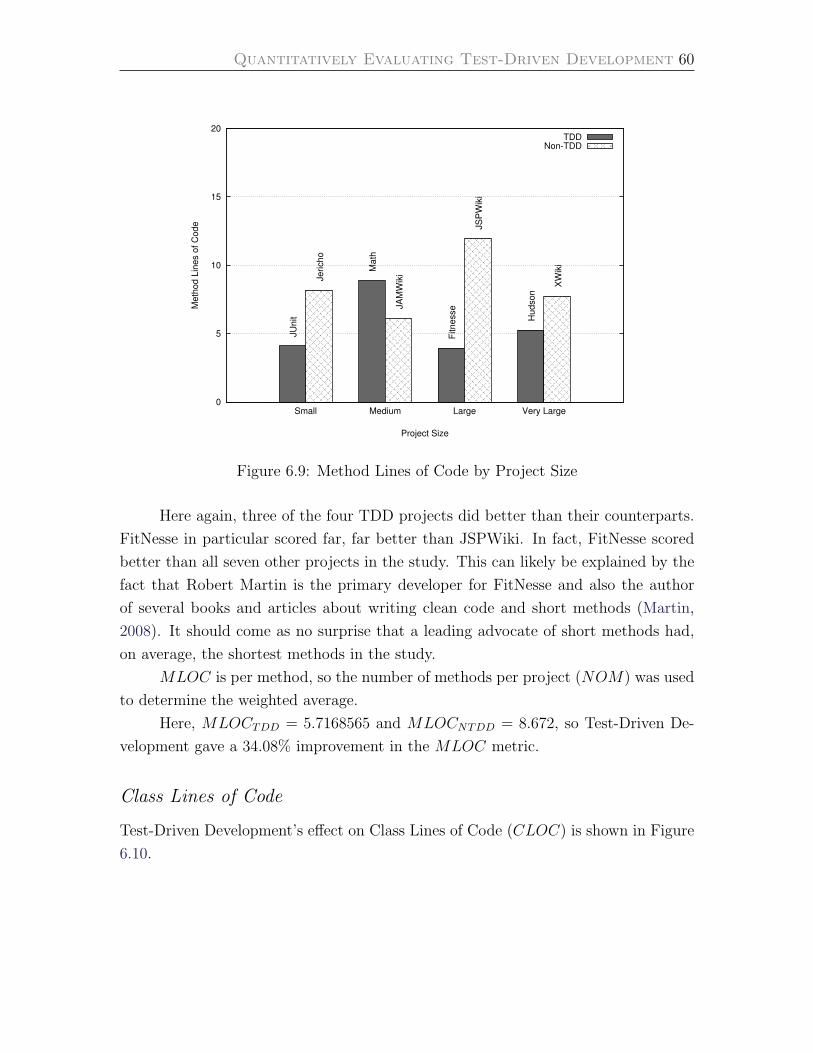
Quantitatively Evaluating Test-Driven Development 60
0
5
10
15
20
Small Medium Large Very Large
Me
tho
d L
ine
s o
f C
od
e
Project Size
TDDNon-TDD
JU
nit
Ma
th
Fitn
esse
Hu
dso
n
Je
rich
o
JA
MW
iki
JS
PW
iki
XW
iki
Figure 6.9: Method Lines of Code by Project Size
Here again, three of the four TDD projects did better than their counterparts.
FitNesse in particular scored far, far better than JSPWiki. In fact, FitNesse scored
better than all seven other projects in the study. This can likely be explained by the
fact that Robert Martin is the primary developer for FitNesse and also the author
of several books and articles about writing clean code and short methods (Martin,
2008). It should come as no surprise that a leading advocate of short methods had,
on average, the shortest methods in the study.
MLOC is per method, so the number of methods per project (NOM) was used
to determine the weighted average.
Here, MLOCTDD = 5.7168565 and MLOCNTDD = 8.672, so Test-Driven De-
velopment gave a 34.08% improvement in the MLOC metric.
Class Lines of Code
Test-Driven Development’s effect on Class Lines of Code (CLOC) is shown in Figure
6.10.
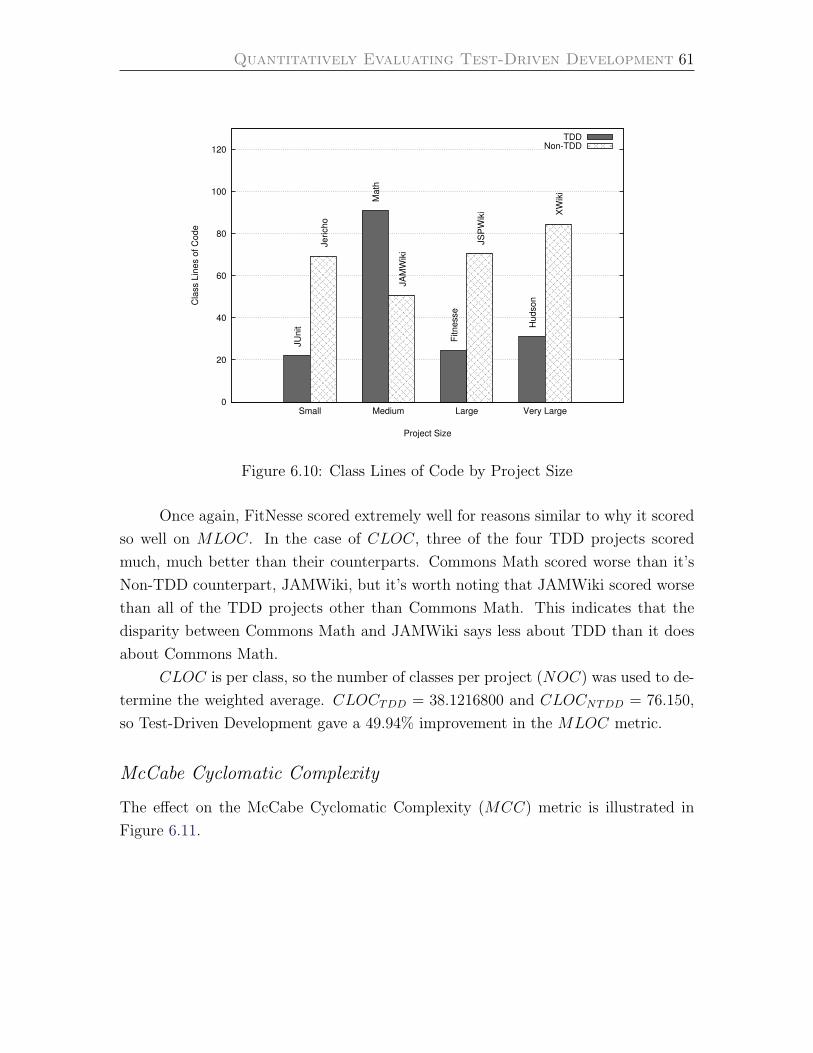
Quantitatively Evaluating Test-Driven Development 61
0
20
40
60
80
100
120
Small Medium Large Very Large
Cla
ss L
ine
s o
f C
od
e
Project Size
TDDNon-TDD
JU
nit
Ma
th
Fitn
esse
Hu
dso
n
Je
rich
o
JA
MW
iki
JS
PW
iki XW
iki
Figure 6.10: Class Lines of Code by Project Size
Once again, FitNesse scored extremely well for reasons similar to why it scored
so well on MLOC. In the case of CLOC, three of the four TDD projects scored
much, much better than their counterparts. Commons Math scored worse than it’s
Non-TDD counterpart, JAMWiki, but it’s worth noting that JAMWiki scored worse
than all of the TDD projects other than Commons Math. This indicates that the
disparity between Commons Math and JAMWiki says less about TDD than it does
about Commons Math.
CLOC is per class, so the number of classes per project (NOC) was used to de-
termine the weighted average. CLOCTDD = 38.1216800 and CLOCNTDD = 76.150,
so Test-Driven Development gave a 49.94% improvement in the MLOC metric.
McCabe Cyclomatic Complexity
The effect on the McCabe Cyclomatic Complexity (MCC) metric is illustrated in
Figure 6.11.
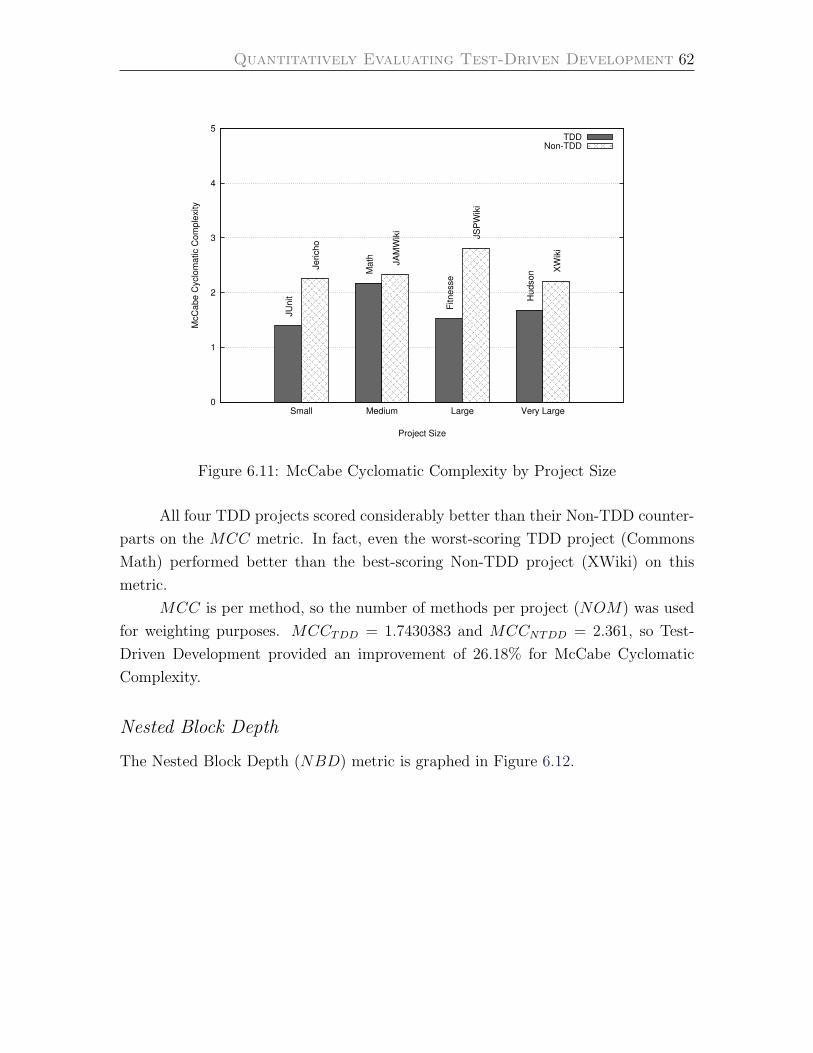
Quantitatively Evaluating Test-Driven Development 62
0
1
2
3
4
5
Small Medium Large Very Large
McC
ab
e C
yclo
ma
tic C
om
ple
xity
Project Size
TDDNon-TDD
JU
nit
Ma
th
Fitn
esse
Hu
dso
n
Je
rich
o
JA
MW
iki
JS
PW
iki
XW
iki
Figure 6.11: McCabe Cyclomatic Complexity by Project Size
All four TDD projects scored considerably better than their Non-TDD counter-
parts on the MCC metric. In fact, even the worst-scoring TDD project (Commons
Math) performed better than the best-scoring Non-TDD project (XWiki) on this
metric.
MCC is per method, so the number of methods per project (NOM) was used
for weighting purposes. MCCTDD = 1.7430383 and MCCNTDD = 2.361, so Test-
Driven Development provided an improvement of 26.18% for McCabe Cyclomatic
Complexity.
Nested Block Depth
The Nested Block Depth (NBD) metric is graphed in Figure 6.12.

Quantitatively Evaluating Test-Driven Development 63
0
0.5
1
1.5
2
2.5
3
Small Medium Large Very Large
Ne
ste
d B
lock D
ep
th
Project Size
TDDNon-TDD
JU
nit
Ma
th
Fitn
esse
Hu
dso
n
Je
rich
o
JA
MW
iki
JS
PW
iki
XW
iki
Figure 6.12: Nested Block Depth by Project Size
Once again, three of the four TDD projects performed better and, once again,
the only one to perform worse was Commons Math. It seems that Commons Math
simply suffers from a high level of code complexity in general. It is worth noting that
the other three TDD projects claimed a TDD adherence level of 5 while Commons
Math claimed a TDD adherence level of 4. This means that, while still classified as a
TDD project, Commons Math likely had a greater portion of its code written without
Test-Driven Development than did the other TDD projects.
NBD is per method, so the number of methods per project (NOM) was used
for weighting purposes again. NBDTDD = 1.3246218 and NBDNTDD = 1.536, so
Test-Driven Development improved Nested Block Depth by 13.74%.
Overall
The overall effect of TDD on complexity is summarized in Table 6.5.

Quantitatively Evaluating Test-Driven Development 64
Table 6.5: Test-Driven Development’s Effect on Complexity
Metric TDD Non-TDD TDD Improvement
MLOC 5.7168565 8.672 34.08%
CLOC 38.1216800 76.150 49.94%
MCC 1.7430383 2.361 26.18%
NBD 1.3246218 1.536 13.74%
Overall 30.98%
The data indicates that Test-Driven Development improved the complexity level
of code by about 31%. Following this same process without weighting the scores
according to project size yielded an improvement of 29.08%.
Overall Effect of TDD
Test-Driven Development improved the level of cohesion by 21.33%, the level of cou-
pling by 10.05%, and the level of complexity by 30.98%. Averaging these together
yields an overall improvement of 20.79%. The average of the three unweighted per-
centages is 18.73%, indicating that any biases that may have resulted from weighting
the scores by project size weren’t particularly influential.
Test-Driven Development most strongly influenced scores for complexity, a cor-
relation made even stronger by the fact that the one TDD project that had a lower
level of TDD adherence was the only TDD project to score lower than it’s Non-TDD
counterpart in code complexity, and frequently did so.
Threats to Validity
Before conclusions are drawn from this data, it is important to note that, as with any
study, there are some potential threats to the validity of the study.
First and foremost, this study’s sample size was quite small. Only four programs
were in the experimental group and control groups each. This was due primarily to
the unfortunately low number of survey participants. Despite efforts to distribute
and spread the survey as widely as possible, only sixty people filled out the survey.
Of those, only a small handful of projects were written using Java. Given the large
number of open source projects in existence, a sample size of only eight makes it easy
Quantitatively Evaluating Test-Driven Development 65
to argue that the numbers in this study may not reach a suitable level of statistical
significance.
Another potential problem is the survey itself. Because the survey was opt-in,
there was no way to verify that the survey responses for a particular project were
representative of the project’s developers. With no more than five survey responses
for any given project, it’s entirely possible that a project written using primarily
Test-Driven Development had survey participants who simply did not adhere to the
practice while developing, incorrectly categorizing a TDD’d project as Non-TDD.
Similarly, projects written mostly without Test-Driven Development could have had
a few TDD adherents fill out the survey, or even exaggerate the usage of TDD when
responding. The effect of this problem has been somewhat minimized by analyzing
eight different projects, but it’s entirely possible that the lines between the two groups
were not drawn accurately enough.
Additionally, object-oriented metrics are simply an imperfect way of measuring
code quality. The quality of code is largely subjective, and though the metrics used
in this work are a solid attempt at estimating the levels of quality contained in code,
they are not ideal measurements. Design elegance is a complex subject, and it is
something difficult to show mathematically.
Furthermore, as pointed out in Chapter 2, one of the key benefits of Test-Driven
Development is that a byproduct of using it is a comprehensive suite of unit tests.
It could be argued that the large number of unit tests was responsible for cleanliness
of the code, rather than the process used to develop it. This concern should be
somewhat mitigated by the fact that all eight projects had large numbers of tests,
but it’s a valid concern nonetheless.
It is also possible that the samples themselves were biased in favor of Test-
Driven Development. One of the projects, JUnit, was written primarily by Kent
Beck, arguably the inventor of Test-Driven Development as a software engineering
practice. Another project, FitNesse, was written mostly by Robert C. Martin, author
of a number of books about clean code as well as the creator of a number of metrics
used in this work (Ca, Ce, and D′). It would be reasonable to expect that the code
written by these individuals would generally be of higher quality than code written
by others, and since the two of them practiced Test-Driven Development, it might
have unfairly affected the TDD group. This concern should be somewhat mitigated
by the fact that JUnit and FitNesse were sometimes the worst-scoring projects in
their size categories.
Quantitatively Evaluating Test-Driven Development 66
Lastly, a great deal of nuance was lost in the process of analyzing the metrics
at all. The metrics themselves were averages across projects, and those averages
were averaged together to determine the percent improvement offered by Test-Driven
Development. These averages were, once again, averaged to determine the overall
effectiveness of TDD. Each time a set of numbers was averaged, information was lost.
Additionally, by taking weighted averages to determine scores for the experimental
and control groups, the larger projects in the experiment (Hudson and XWiki) in-
fluenced the final results greatly. This problem was minimized by the fact that the
non-weighted averages were provided as well, but in that case it seems that the smaller
projects might wield a disproportionately high influence over the final results.
Chapter 7
Conclusions
This study provided substantial evidence that Test-Driven Development is, indeed,
an effective tool for improving the quality of source code. Test-Driven Development
offered an overall improvement of 21% over code written using the test-last technique.
Considering the sheer volume of the codebases being analyzed, it’s reasonable to
conclude that the substantial difference is noteworthy.
Test-Driven Development was most effective at decreasing the complexity of the
code, with an improvement of 31%. Complexity deals exclusively with the code inside
of a module, ignoring any relationships with other aspects of a system. Reducing the
Method Lines of Code metric could be accomplished by extracting methods out of
other methods. According to Fowler et al. (1999), 99% of the time the simple solution
to reducing the length of a method is to extract new methods from them, replacing
a large block of code with a well-named function call that performs the same task.
Similarly, Martin (2008) explains that the way to reduce the level of indentation
(which affects both Nested Block Depth and McCabe Cyclomatic Complexity) is to
replace blocks of code that execute under if, else, or while statements with single-
line function calls. In short, the best way to reduce code complexity is to regularly
refactor the code. It is not surprising, then, that Test-Driven Development is so
effective at improving complexity metrics, since refactoring is a crucial step of the
Test-Driven Development cycle.
The next-best improvement was on cohesion metrics, an improvement of 21%.
Recall that cohesion is essentially a measure of how related all of the responsibilities
of a module are. Every time a programmer writes code that interacts with a class, she
is given a reminder of that class’s responsibilities. Test-Driven Development, because
Quantitatively Evaluating Test-Driven Development 68
it requires writing the test for the responsibility as well as the implementation of
that responsibility, faces programmers with this reminder twice as often before the
code is written. Subramaniam and Hunt (2006) argue that writing tests first forces
programmers to look at their classes as users of the class’s interface, rather than as
implementors of that class. This perspective shift provides constant opportunity for
the programmer to be confronted by the question of how cohesive a code change is.
Essentially, each test that is written to add new behavior makes the programmer ask
“is this the right place for this new functionality?” As long as programmers remain
cognizant of this concern, Test-Driven Development should help them see when a class
has gained too many responsibilities, and the refactoring portion of the cycle should
make it easy to fix these kinds of issues before they become serious problems. This
seems like an adequate explanation for the improvement TDD offers for cohesion.
It also makes sense why this improvement would be somewhat lower than that of
complexity - it requires a more substantial cognitive effort to continually ask oneself
if the tests being written indicate that a class is growing out of control.
The smallest improvement Test-Driven Development offered was on coupling
metrics, only 10%. Miller (2008) explains that tight coupling means that modules
and subsystems must know the details of other modules and subsystems in order
to function. This means that, for tightly coupled systems, in order to write tests
that verify whether a module or subsystem functions correctly, the test must also
involve the details of other modules and subsystems. Essentially, tests become harder
and harder to write the more tightly coupled the different parts of the system are.
As explained by Tate and Gehtland (2004), the best defense against high system
coupling is writing tests. Tests act as additional clients to the modules of a system,
and each test needs to create (or create mock objects for) everything with which the
module being tested interacts. If developers remain disciplined about following Test-
Driven Development practices, the tests for highly coupled modules become more
difficult to write, forcing them to eventually refactor to reduce or remove coupling in
order to write additional tests. This is a possible explanation for why Test-Driven
Development helps reduce the coupling in a project. At the same time, the process of
mocking and stubbing out the modules that a module under test requires is always
becoming easier with mocking frameworks like JMock, EasyMock, and Mockito, which
are becoming increasingly popular and may be an explanation for the relatively low
improvement in coupling scores.
Overall, Test-Driven Development practices provide a well-structured method-
Quantitatively Evaluating Test-Driven Development 69
ology for helping developers see coding problems as they start, well before they become
serious design problems in the code, and the safe refactoring offered by a suite of unit
tests gives developers the tools to solve those problems early. With an improvement
in metrics scores of 21%, Test-Driven Development appears to be extremely valuable
as a Software Engineering practice. This work lends a great deal of additional validity
to the assertion by Martin (2007) that not following the disciplines of Test-Driven
Development would simply be unprofessional.
Further Work
This work can be greatly improved upon with additional research. First and fore-
most, it would be better to have a larger sample of code to analyze. Though the
amount of code studied in this work was substantial, a greater sample size would lend
more statistical significance to the results found. Had more Open Source developers
responded to the survey, the samples would likely have been improved a great deal.
Additionally, projects could be analyzed using additional metrics beyond the
twelve used in this work. Bansiya and Davis (2002) propose a new cohesion metric
called Cohesion Among Methods in a Class (CAMC). Counsell et al. (2006) discuss a
recently-proposed cohesion metric called the Normalised Hamming Distance (NHD).
Briand et al. (1999) propose a number of coupling-related metrics, and Chidamber and
Kemerer (1991) introduce a coupling metric called Coupling Between Objects (CBO).
Chahal and Singh (2009) discuss a complexity metric called Weighted Methods Per
Class (WMC) which combines the Number of Methods metric with the McCabe Cy-
clomatic Complexity metric to approximate the number of responsibilities belonging
to a class. Kafura (1985) discusses many additional metrics beyond these, and other
sources propose even more. With additional metrics, the same methodologies utilized
in this work could be significantly enhanced.
Another potential area for additional work would be a less metrics-oriented
approach to measuring code quality. One possible example would be a more subjective
rating by a group of seasoned software engineers who are blind to which projects were
written using TDD and which without. Their aggregated ratings along various criteria
such as “ease of understandability” or “level of brittleness” could greatly improve the
understanding of Test-Driven Development’s efficacy.
Test-Driven Development is still a relatively young practice, so there is still a
great deal of additional research that can be done to validate or refute its effectiveness.
Bibliography
Abelson, H., & Sussman, G. J. (1996). Structure and interpretation of computer
programs . Cambridge, MA: The MIT Press. 3
Astels, D. (2003). Test-driven development: A practical guide. Upper Saddle River,
NJ: Prentice Hall PTR. 7
Bain, S. L. (2008). Emergent design: The evolutionary nature of professional software
development . Boston, MA: Addison-Wesley Professional. 9
Bansiya, J., & Davis, C. G. (2002). A hierarchical model for object-oriented design
quality assessment. IEEE Trans. Softw. Eng., 28 (1), 4–17. 69
Basili, V. R., Briand, L., & Melo, W. L. (1995). A validation of object-oriented
design metrics as quality indicators. IEEE Transactions on Software Engineering ,
22 , 751–761. 32
Beck, K. (2002). Test driven development: By example. Boston, MA: Addison-Wesley
Professional. 7, 8
Beck, K., & Andres, C. (2004). Extreme programming explained . Boston, MA:
Addison-Wesley Professional. 5, 8
Beck, K., & Fowler, M. (2000). Planning extreme programming . Boston, MA:
Addison-Wesley Professional. 6
Bhat, T., & Nagappan, N. (2006). Evaluating the efficacy of test-driven development:
industrial case studies. In ISESE ’06: Proceedings of the 2006 ACM/IEEE inter-
national symposium on Empirical software engineering , (pp. 356–363). New York,
NY: ACM. 15
Bloch, J. (2008). Effective java. Upper Saddle River, NJ: Prentice Hall PTR. 31
Quantitatively Evaluating Test-Driven Development 71
Briand, L. C., Daly, J. W., & Wust, J. K. (1999). A unified framework for coupling
measurement in object-oriented systems. IEEE Trans. Softw. Eng., 25 (1), 91–121.
69
Burke, E. M., & Coyner, B. M. (2003). Java extreme programming cookbook . Se-
bastopol, CA: O’Reilly Media, Inc. 9
Cavaness, C., Keeton, B., Friesen, J., & Weber, J. (2000). Special edition using java
2 . Boston, MA: Que. 23
Chahal, K. K., & Singh, H. (2009). Metrics to study symptoms of bad software
designs. SIGSOFT Softw. Eng. Notes , 34 (1), 1–4. 69
Charney, R. (2005). Programming tools: Code complexity metrics. Linux Journal .
Retrieved from http://www.linuxjournal.com/article/8035 33
Chidamber, S. R., & Kemerer, C. F. (1991). Towards a metrics suite for object
oriented design. In OOPSLA ’91: Conference proceedings on Object-oriented pro-
gramming systems, languages, and applications , (pp. 197–211). New York, NY:
ACM. 21, 69
Copeland, L. (2001). Extreme programming. Computerworld . Retrieved from
http://www.computerworld.com/softwaretopics/software/appdev/story/0,
10801,66192,00.html 2
Counsell, S., Swift, S., & Crampton, J. (2006). The interpretation and utility of three
cohesion metrics for object-oriented design. ACM Trans. Softw. Eng. Methodol.,
15 (2), 123–149. 69
Crispin, L., & House, T. (2002). Testing extreme programming . Boston, MA: Addison-
Wesley Professional. 7
El Emam, K., Benlarbi, S., Goel, N., Melo, W., Lounis, H., & Rai, S. N. (2002). The
optimal class size for object-oriented software. IEEE Trans. Softw. Eng., 28 (5),
494–509. 34
Feathers, M. (2004). Working effectively with legacy code. Upper Saddle River, NJ:
Prentice Hall PTR. 9
Quantitatively Evaluating Test-Driven Development 72
Ford, N. (2008). The productive programmer . Sebastopol, CA: O’Reilly Media, Inc.
9
Ford, N. (2009). Evolutionary architecture and emergent design: Test-driven design,
part 1. IBM developerWorks . 9
Fowler, M., Beck, K., Brant, J., Opdyke, W., & Roberts, D. (1999). Refactoring:
Improving the design of existing code. Boston, MA: Addison-Wesley Professional.
12, 33, 34, 67
Freeman, E., Freeman, E., Bates, B., & Sierra, K. (2004). Head first design patterns .
Sebastopol, CA: O’Reilly Media, Inc. 20
Freeman, S., & Pryce, N. (2009). Growing object-oriented software, guided by tests .
Boston, MA: Addison-Wesley Professional. 2
Glover, A. (2006). In pursuit of code quality: Monitoring cyclomatic complex-
ity. IBM developerWorks . Retrieved from http://www.ibm.com/developerworks/
java/library/j-cq03316/ 33
Henderson-Sellers, B. (1995). Object-oriented metrics: Measures of complexity . Upper
Saddle River, NJ: Prentice Hall PTR. 21
Henney, K. (2004). Code versus software. Retrieved from http://www.artima.com/
weblogs/viewpost.jsp?thread=67178 19
Hevery, M. (2008). Static methods are death to testability.
Retrieved from http://googletesting.blogspot.com/2008/12/
static-methods-are-death-to-testability.html 26
Janzen, D. S. (2006). An empirical evaluation of the impact of test-driven development
on software quality . Ph.D. thesis, University of Kansas, Lawrence, KS. Adviser-
Saiedian, Hossein. 16
Jones, C. (2008). Applied software measurement . New York, NY: McGraw-Hill Os-
borne Media. 19
Kafura, D. (1985). A survey of software metrics. In ACM ’85: Proceedings of the
1985 ACM annual conference on The range of computing : mid-80’s perspective,
(pp. 502–506). New York, NY: ACM. 69
Quantitatively Evaluating Test-Driven Development 73
Kaufmann, R., & Janzen, D. (2003). Implications of test-driven development: a pilot
study. In OOPSLA ’03: Companion of the 18th annual ACM SIGPLAN conference
on Object-oriented programming, systems, languages, and applications , (pp. 298–
299). New York, NY: ACM. 12, 13
Kegel, H., & Steimann, F. (2008). Systematically refactoring inheritance to delegation
in java. In ICSE ’08: Proceedings of the 30th international conference on Software
engineering , (pp. 431–440). New York, NY: ACM. 31
Kerievsky, J. (2004). Refactoring to patterns . Boston, MA: Addison-Wesley Profes-
sional. 34
Kernighan, B. W., & Plauger, P. J. (1978). The elements of programming style. New
York, NY: McGraw-Hill. 33
Koskela, L. (2007). Test driven: Practical tdd and acceptance tdd for java developers .
Greenwich, CT: Manning Publications. 6, 8
Langr, J. (2005). Agile java: Crafting code with test-driven development . Upper
Saddle River, NJ: Prentice Hall PTR. 8
Lee, C. C. (2009). Javancss - a source measurement suite for java. Retrieved from
http://www.kclee.de/clemens/java/javancss/#specification 41
Lorenz, M., & Kidd, J. (1994). Object-oriented software metrics . Upper Saddle River,
NJ: Prentice Hall PTR. 23
Lui, K. M., & Chan, K. C. C. (2008). Software development rhythms: Harmonizing
agile practices for synergy . New York, NY: Wiley. 6
Marco, L. (1997). Measuring software complexity. Enterprise Systems Journal . Re-
trieved from http://cispom.boisestate.edu/cis320emaxson/metrics.htm 32
Martin, R. C. (1994). Oo design quality metrics, an analysis of dependencies. Re-
trieved from http://www.objectmentor.com/resources/articles/oodmetrc.
pdf 27, 29
Martin, R. C. (2002). Agile software development, principles, patterns, and practices .
Upper Saddle River, NJ: Prentice Hall PTR. 7, 28, 29, 30
Quantitatively Evaluating Test-Driven Development 74
Martin, R. C. (2007). Professionalism and test-driven development. IEEE Software,
24 (3), 32–36. 69
Martin, R. C. (2008). Clean code: A handbook of agile software craftsmanship. Upper
Saddle River, NJ: Prentice Hall PTR. 3, 25, 33, 34, 37, 60, 67
Martin, R. C., & Martin, M. (2006). Agile principles, patterns, and practices in c#.
Upper Saddle River, NJ: Prentice Hall PTR. 23
McCabe, T. J. (1976). A complexity measure. In ICSE ’76: Proceedings of the
2nd international conference on Software engineering , (p. 407). Los Alamitos, CA:
IEEE Computer Society Press. 34
McConnell, S. (2004). Code complete: A practical handbook of software construction.
Redmond, WA: Microsoft Press. 37
McLaughlin, B. D., Pollice, G., & West, D. (2006). Head first object-oriented analysis
and design. Sebastopol, CA: O’Reilly Media, Inc. 20
Miller, J. (2008). Patterns in practice: Cohesion and coupling. MSDN Magazine. 68
Moller, K.-H. (1992). Software metrics: A practitioner’s guide to improved product
development . Los Alamitos, CA, USA: IEEE Computer Society Press. 19
Mullaney, J. (2008). Test-driven development and the ethics of quality. Software Qual-
ity News . Retrieved from http://searchsoftwarequality.techtarget.com/
news/article/0,289142,sid92_gci1304738,00.html 9
Muller, M., & Hagner, O. (2002). Experiment about test-first programming. Software,
IEE Proceedings- [see also Software Engineering, IEE Proceedings] , 149 (5), 131–
136. 10
Naur, P., & Randell, B. (1969). Software engineering: Report of a conference spon-
sored by the nato science committee, garmisch, germany, 7-11 oct. 1968 . Brussel:
Scientific Affairs Division, NATO. 1
North, D. (2003). Test-driven development is not about unit testing. Java Developer’s
Journal . Retrieved from http://java.sys-con.com/node/37795 8
Ohloh (2009). Ohloh, the open source network. Retrieved from http://www.ohloh.
net/ 41
Quantitatively Evaluating Test-Driven Development 75
Page-Jones, M. (1999). Fundamentals of object-oriented design in uml . Boston, MA:
Addison-Wesley Professional. 26
Pandian, C. R. (2003). Software metrics: A guide to planning, analysis, and applica-
tion. Boca Raton, FL: Auerbach Publications. 19
Ponczak, J., & Miller, J. (2007). Find software bugs, defects using code coverage. Re-
trieved from http://searchsoftwarequality.techtarget.com/news/article/
0,289142,sid92_gci1244258,00.html 35
Rodger, R. (2005). Rant: The evils of indentation. Retrieved from
http://www.richardrodger.com/roller/page/richard/Weblog/rant_the_
evils_of_indentation 36
Schach, S. (2006). Object-oriented and classical software engineering . New York, NY:
McGraw-Hill. 13, 20, 26, 32
Schroeder, M. (1999). A practical guide to object-oriented metrics. IT Professional ,
1 (6), 30–36. 24
Shore, J., & Warden, S. (2007). The art of agile development . Sebastopol, CA:
O’Reilly Media, Inc. 7, 33
Subramaniam, V., & Hunt, A. (2006). Practices of an agile developer: Working in
the real world . Raleigh, NC: Pragmatic Bookshelf. 68
Sun Microsystems (2009). Java 2 platform se 5.0. Retrieved from http://java.sun.
com/j2se/1.5.0/docs/api/ 26
Tate, B., & Gehtland, J. (2004). Better, faster, lighter java. Sebastopol, CA: O’Reilly
Media, Inc. 68
Williams, L., Maximilien, E. M., & Vouk, M. (2003). Test-driven development as a
defect-reduction practice. Software Reliability Engineering, International Sympo-
sium on, 0 , 34. 14
Wilson, B. (2009). It’s not tdd, it’s design by example. Re-
trieved from http://bradwilson.typepad.com/blog/2009/04/
its-not-tdd-its-design-by-example.html 9
Quantitatively Evaluating Test-Driven Development 76
Zhu, H., Hall, P. A. V., & May, J. H. R. (1997). Software unit test coverage and
adequacy. ACM Comput. Surv., 29 (4), 366–427. 8
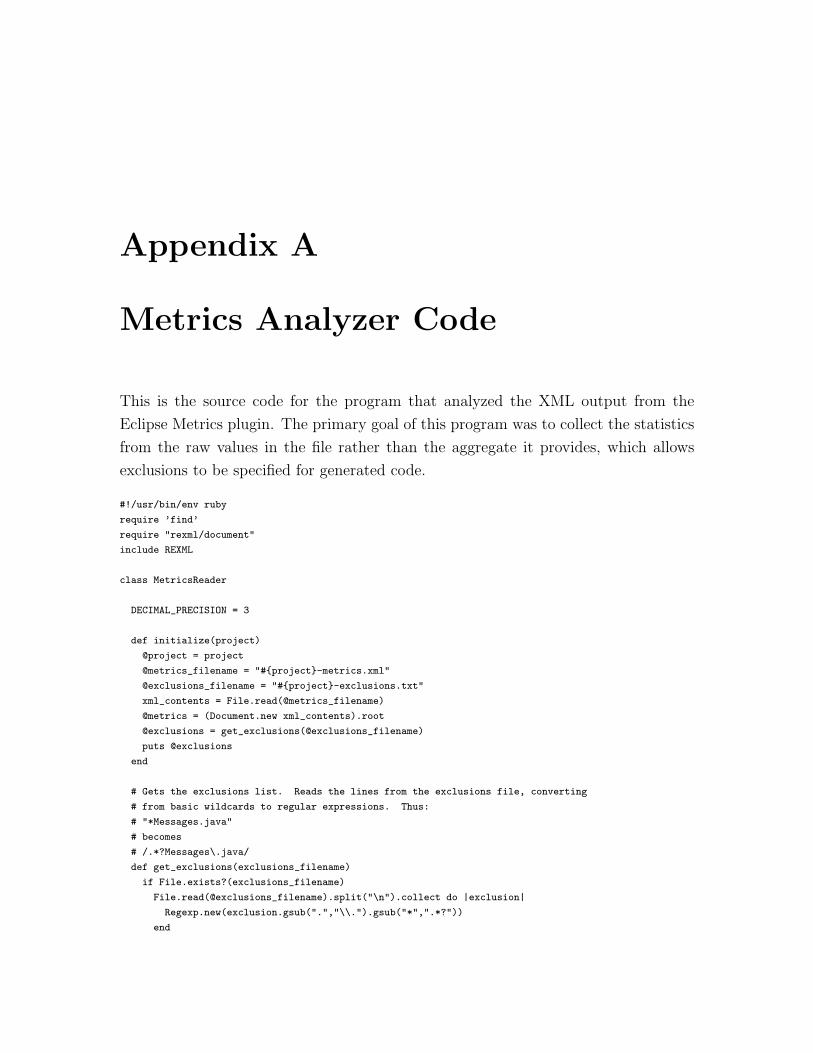
Appendix A
Metrics Analyzer Code
This is the source code for the program that analyzed the XML output from the
Eclipse Metrics plugin. The primary goal of this program was to collect the statistics
from the raw values in the file rather than the aggregate it provides, which allows
exclusions to be specified for generated code.
#!/usr/bin/env ruby
require ’find’
require "rexml/document"
include REXML
class MetricsReader
DECIMAL_PRECISION = 3
def initialize(project)
@project = project
@metrics_filename = "#{project}-metrics.xml"
@exclusions_filename = "#{project}-exclusions.txt"
xml_contents = File.read(@metrics_filename)
@metrics = (Document.new xml_contents).root
@exclusions = get_exclusions(@exclusions_filename)
puts @exclusions
end
# Gets the exclusions list. Reads the lines from the exclusions file, converting
# from basic wildcards to regular expressions. Thus:
# "*Messages.java"
# becomes
# /.*?Messages\.java/
def get_exclusions(exclusions_filename)
if File.exists?(exclusions_filename)
File.read(@exclusions_filename).split("\n").collect do |exclusion|
Regexp.new(exclusion.gsub(".","\\.").gsub("*",".*?"))
end
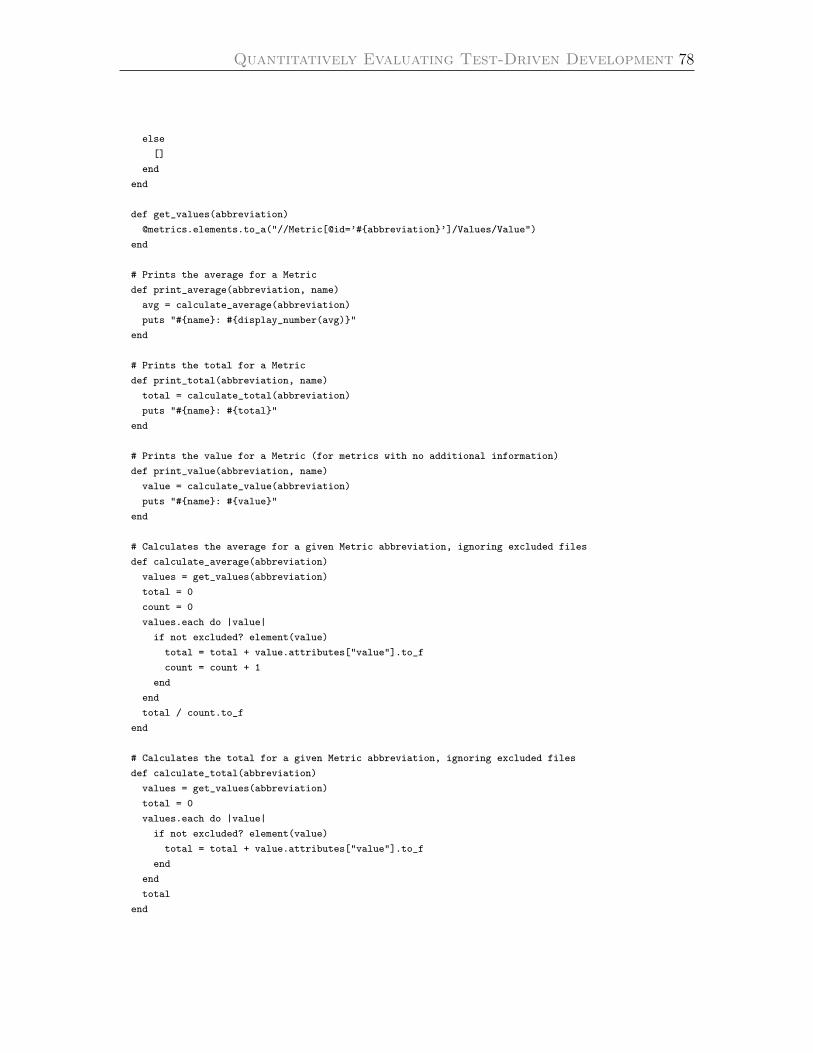
Quantitatively Evaluating Test-Driven Development 78
else
[]
end
end
def get_values(abbreviation)
@metrics.elements.to_a("//Metric[@id=’#{abbreviation}’]/Values/Value")
end
# Prints the average for a Metric
def print_average(abbreviation, name)
avg = calculate_average(abbreviation)
puts "#{name}: #{display_number(avg)}"
end
# Prints the total for a Metric
def print_total(abbreviation, name)
total = calculate_total(abbreviation)
puts "#{name}: #{total}"
end
# Prints the value for a Metric (for metrics with no additional information)
def print_value(abbreviation, name)
value = calculate_value(abbreviation)
puts "#{name}: #{value}"
end
# Calculates the average for a given Metric abbreviation, ignoring excluded files
def calculate_average(abbreviation)
values = get_values(abbreviation)
total = 0
count = 0
values.each do |value|
if not excluded? element(value)
total = total + value.attributes["value"].to_f
count = count + 1
end
end
total / count.to_f
end
# Calculates the total for a given Metric abbreviation, ignoring excluded files
def calculate_total(abbreviation)
values = get_values(abbreviation)
total = 0
values.each do |value|
if not excluded? element(value)
total = total + value.attributes["value"].to_f
end
end
total
end
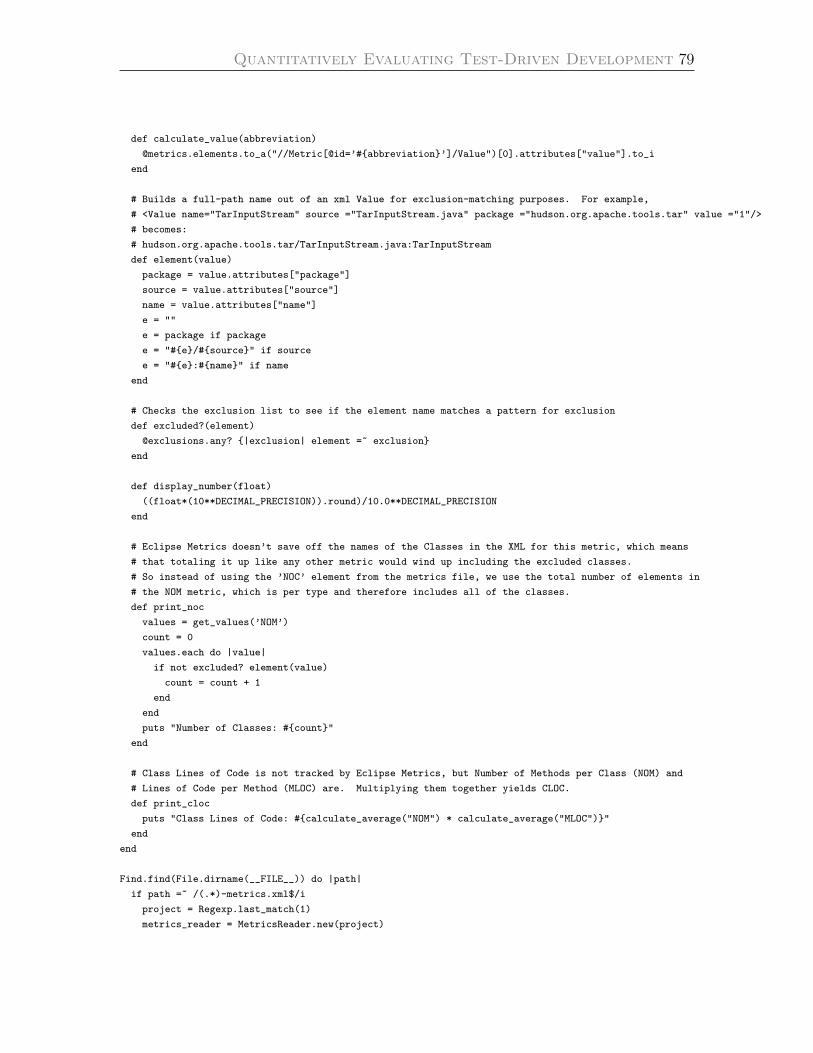
Quantitatively Evaluating Test-Driven Development 79
def calculate_value(abbreviation)
@metrics.elements.to_a("//Metric[@id=’#{abbreviation}’]/Value")[0].attributes["value"].to_i
end
# Builds a full-path name out of an xml Value for exclusion-matching purposes. For example,
# <Value name="TarInputStream" source ="TarInputStream.java" package ="hudson.org.apache.tools.tar" value ="1"/>
# becomes:
# hudson.org.apache.tools.tar/TarInputStream.java:TarInputStream
def element(value)
package = value.attributes["package"]
source = value.attributes["source"]
name = value.attributes["name"]
e = ""
e = package if package
e = "#{e}/#{source}" if source
e = "#{e}:#{name}" if name
end
# Checks the exclusion list to see if the element name matches a pattern for exclusion
def excluded?(element)
@exclusions.any? {|exclusion| element =~ exclusion}
end
def display_number(float)
((float*(10**DECIMAL_PRECISION)).round)/10.0**DECIMAL_PRECISION
end
# Eclipse Metrics doesn’t save off the names of the Classes in the XML for this metric, which means
# that totaling it up like any other metric would wind up including the excluded classes.
# So instead of using the ’NOC’ element from the metrics file, we use the total number of elements in
# the NOM metric, which is per type and therefore includes all of the classes.
def print_noc
values = get_values(’NOM’)
count = 0
values.each do |value|
if not excluded? element(value)
count = count + 1
end
end
puts "Number of Classes: #{count}"
end
# Class Lines of Code is not tracked by Eclipse Metrics, but Number of Methods per Class (NOM) and
# Lines of Code per Method (MLOC) are. Multiplying them together yields CLOC.
def print_cloc
puts "Class Lines of Code: #{calculate_average("NOM") * calculate_average("MLOC")}"
end
end
Find.find(File.dirname(__FILE__)) do |path|
if path =~ /(.*)-metrics.xml$/i
project = Regexp.last_match(1)
metrics_reader = MetricsReader.new(project)
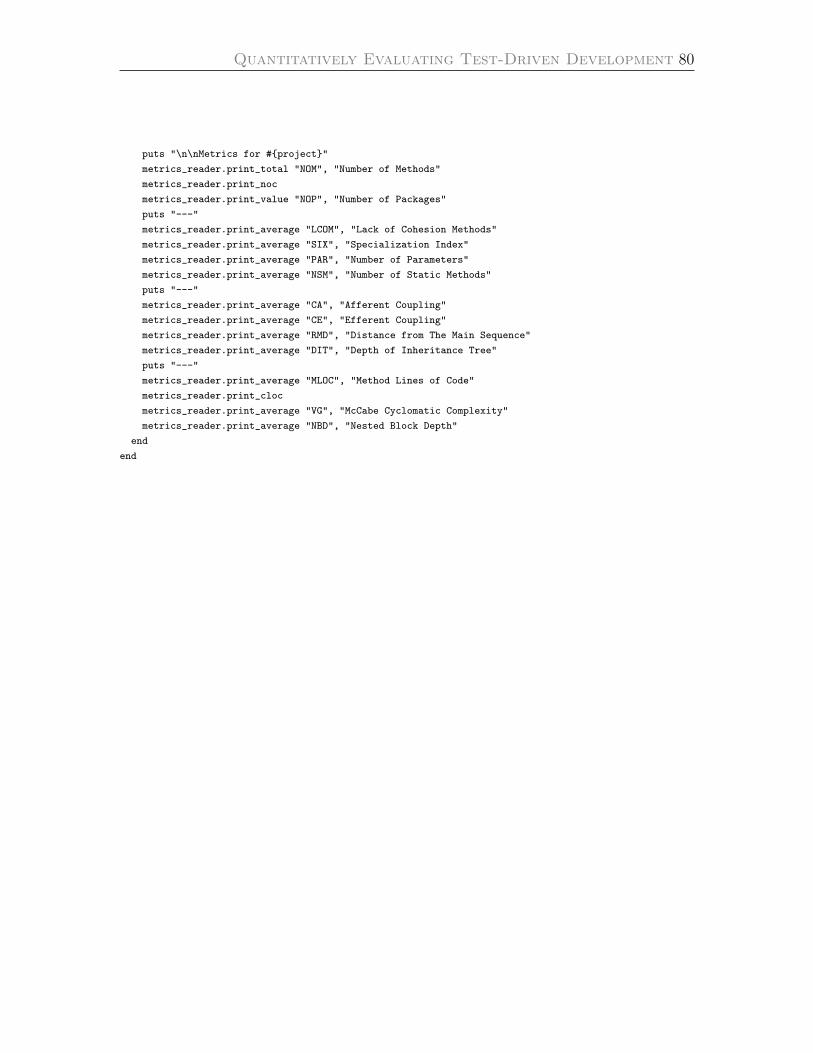
Quantitatively Evaluating Test-Driven Development 80
puts "\n\nMetrics for #{project}"
metrics_reader.print_total "NOM", "Number of Methods"
metrics_reader.print_noc
metrics_reader.print_value "NOP", "Number of Packages"
puts "---"
metrics_reader.print_average "LCOM", "Lack of Cohesion Methods"
metrics_reader.print_average "SIX", "Specialization Index"
metrics_reader.print_average "PAR", "Number of Parameters"
metrics_reader.print_average "NSM", "Number of Static Methods"
puts "---"
metrics_reader.print_average "CA", "Afferent Coupling"
metrics_reader.print_average "CE", "Efferent Coupling"
metrics_reader.print_average "RMD", "Distance from The Main Sequence"
metrics_reader.print_average "DIT", "Depth of Inheritance Tree"
puts "---"
metrics_reader.print_average "MLOC", "Method Lines of Code"
metrics_reader.print_cloc
metrics_reader.print_average "VG", "McCabe Cyclomatic Complexity"
metrics_reader.print_average "NBD", "Nested Block Depth"
end
end


![Evaluating the Effectiveness of Test Driven Development ... · TDD in Embedded Software: A study done on embedded system tends to establish [4][60], Test-driven development as a reliable](https://img.pdfslide.us/doc/110x75/602e83cf2879c5679a255a2e/evaluating-the-effectiveness-of-test-driven-development-tdd-in-embedded-software.jpg)


![Data-Driven and Keyword-Driven Test[1]](https://img.pdfslide.us/doc/110x75/577ce76d1a28abf103951d8d/data-driven-and-keyword-driven-test1.jpg)