Embed Size (px)
Citation preview

12th Annual WRF Users’ Event 20-24 June 2011, Boulder CO, USA
1
QUANTITATIVE VERIFICATION STATISTICS OF WRF PREDICTIONS OVER THE MEDITERRANEAN REGION
Katsafados P.1, Papadopoulos A.2, Mavromatidis E.1 and Gikas N.1
1 Department of Geography, Harokopio University of Athens, El. Venizelou 70 Str., 17671,
Athens, Greece. 2 Institute of Inland Waters, Hellenic Centre for Marine Research, Greece.
1. Introduction
The Weather Research and Forecasting (WRF) limited area model with the embedded Non-hydrostatic Mesoscale Model (NMM) dynamical core has been installed and appropriately configured in the parallel computing infrastructure of the Department of Geography at Harokopio University of Athens in order to provide accurate regional forecasts for the entire Mediterranean basin and the Black Sea. Despite the production of conventional weather predictions, the model forecasts support many others operational and research activities such as driving local hydrological models for flash floods predictions, especially over small catchments, producing fire weather indexes and fire risk assessments during summer and providing estimations of the maximum wind power for areas with dense wind farms installations. The quality of the forecasts is related to the model capability in providing reliable precipitation, temperature, and wind estimations at resolutions that tend to meet the needs of the abovementioned specific applications. Many studies were based on models objective error statistics and verified both upper air and surface predictions of various numerical weather predictions models (Colle et al., 1999; Gallus, 1999; Mass et al., 2002). However, much attention has been put on the WRF model predictions in surface winds and temperature fields which can be greatly influenced by synoptic to mesoscale phenomena and local terrain heterogeneities. Recent studies revealed a rather systematic tendency of the WRF model to overestimate the 10-m wind speed and to underestimate the 2-m daytime temperature (Roux et al., 2008, Gozzini et al. 2008). The comparison with the Eta model (Cheng et al., 2005) revealed that WRF produces larger 2-m temperature and
dewpoint mean absolute and bias error than the Eta model, and overpredicts the 10-m wind speed.
In the present study the performance of the WRF weather forecasts has been assessed using as reference the surface measurements available from the World Meteorological Organization (WMO) network. Surface observations from more than 900 conventional stations were used to verify and compare categorical model forecasts of the 10-m wind field, 2-m air temperature and sea level pressure every 3 hours and the accumulated 6-h precipitation for two consecutive years (2009 and 2010). In this end, a verification procedure has been developed based on the estimation of traditional objective verification techniques such as bias, root mean square error (RMSE) and threat scores for the continuous and discrete predictants.
2. Model characteristics and evaluation methodology
The WRF model is running operationally at a resolution of 0.09x0.09 over a single domain of 305x273 grid points covering Mediterranean basin and the Black Sea (Fig.1). It provides daily weather forecasts for the next 72 hours. Initial and boundary conditions are based on the 12 UTC forecast cycle of the Global Forecasting System (GFS) at 0.50x0.50 of resolution. The lateral boundary conditions are updated every three hours. Model configuration consists of 38 vertical levels asymmetrically stretched up to 50 hPa (420 hPa is the top limit of sigma to pressure). The domain structure, which follows the Arakawa E-staggered grid, is centered at 39.50° N and 14.95° E and the topography is produced from the global 30x30 USGS DEM with a 4-point average while land-use and soil category derives from the USGS categories as well (24 types for land use and

12th Annual WRF Users’ Event 20-24 June 2011, Boulder CO, USA
2
16 types for soil). The microphysical module of the model is based on the Ferrier scheme (Ferrier et al., 2002) for the grid scale cloud formation and precipitation. For the sub-grid scale effects of convective and/or shallow clouds the Betts-Miller-Janjic cumulus scheme is employed (Janjic et al., 2001). The surface layer physics is parameterized with the Monin-Obukhov-Janjic scheme (Janjic, 1996) and the land-surface model is the 4-layer unified NOAH (Chen and Dudhia, 2001). The parameterization of turbulence in the planetary boundary layer and in the free atmosphere follows the Mellor-Yamada-Janjic Level 2.5 turbulence closure scheme (Janjic, 1996). The GFDL scheme is implemented for the estimation of both longwave and shortwave radiation fluxes (Schwarzkopf and Fels, 1991).
Figure 1: The integration domain of the WRF weather prediction system. The red dots indicate the locations of the meteorological stations.
The comparison of the WRF weather forecasts against surface observations was made across the wider area of the Mediterranean basin where the available surface stations are depicted in Fig.1. Surface observations from almost 935 conventional stations were used to verify and compare categorical model forecasts of the 10-m wind field, 2-m air temperature and sea level pressure every 3 hours and the accumulated 6-h precipitation for two consecutive years (2009 and 2010). Quality control has been applied to remove erroneous measurements, based on checking the physical range of each parameter being verified, the allowable rate of change in time and the stationarity.
The evaluation methodology was based on the point-to-point comparison between model-generated variables and observations. For the variables of wind speed, air temperature and sea level pressure the scores produced are the standard mean error (Bias) and the root
mean square error (RMSE). The verification scores used for the precipitation were derived using the contingency table approach (Wilks, 1995). This is a two-dimensional matrix where each element counts the number of occurrences in which the gauge measurements and the model forecasts exceeded or failed to reach a certain threshold for a given forecast period. The table elements are defined as: A-model forecast and gauge measurement exceeded the threshold; B-model forecast exceeded the threshold but measurement not; C-model forecast did not reach the threshold but measurement exceeded it; and D-model forecast and measurement did not reach the threshold. Considering the above elements the bias score is defined as BS = (A+B)/(A+C), while the ET score defined as ETS=(A-E)/(A+B+C-E) where E is defined by E=[(A+B)∙(A+C)]/N, with N holding the total number of observations being verified (N=A+B+C+D).
The aforementioned statistical criteria have been combined in order to provide a comprehensive evaluation of model performance and comparison. For instance, a greater ETS will represent a significant model improvement only if it is accompanied by a bias score with value closer to one (Papadopoulos and Katsafados, 2009).
3. Results and discussion In this section the annual systematic and
RMS errors of the WRF model continuous and discrete forecasts are analyzed. Figure 2 depicts the temporal evolution of the domain-averaged annual mean bias and RMSE of the mean sea level pressure (MSLP) as a function of the forecast hour.
Figure 2: The bias score and the RMSE of mean sea level pressure as a function of the forecast time for the year 2010.
Thus, the mean sea level pressure was systematically underestimated in a range of

12th Annual WRF Users’ Event 20-24 June 2011, Boulder CO, USA
3
0.1-0.5 hPa for the entire year 2010. The RMS error was continuously increased with the forecast time up to 2.5 hPa.
On the same period, the day time temperature forecasts were consistently 0.5C higher than the measurements, while temperature forecasts during evening time were always 0.7C lower (Fig. 3). Consequently, the amplitudes of the predicted diurnal temperature cycles were higher than the observed ones. Moreover, the mean forecast error remained almost constant (2.7C) for the entire forecast time.
Figure 3: The bias score and the RMSE of the temperature at 2-m as a function of the forecast time for the year 2010.
(a)
(b) Figure 4: Box plots of the bias score and the RMSE for the (a) minimum temperature at 2-m and (b) the maximum temperature at 2-m for the year 2010. The box plots present the median (middle line), and the 25th, and 75th percentiles of the RMSE and bias values for both minimum and maximum near surface temperatures, respectively (Fig. 4). The
underestimated minimum temperatures indicated a significant deviation of +/- 2C around the medium value. No systematic over- or underprediction was found in the maximum predicted temperatures.
(a)
(b) Figure 5: Seasonal variability of the bias score and the RMSE for the (a) minimum temperature at 2-m and (b) the maximum temperature at 2-m.
The seasonal distribution of the
statistical scores reveals a cold, up to 1C, bias of the minimum and maximum temperatures on the transient and summer seasons (Fig. 5). The maximum temperatures were overestimated, up to 0.5C on winter, while model forecast error did not indicate any seasonal trend keeping a constant value of 2.7C.
Figure 6: Spatial distribution of the temperature at 2-m bias score for the year 2010.
12th Annual WRF Users’ Event 20-24 June 2011, Boulder CO, USA
4
The spatial distribution of the bias score revealed a systematic underestimation of the near surface temperature (bias<=-2C) at the mountainous stations and over continental northern Africa (Fig. 6). A slight overestimation (1C<bias<=-2C) was also evident over coastal stations in Portugal Morocco and the Balkan Peninsula.
(a)
(b) Figure 7: Average bias score of the (a) minimum temperature at 2m and (b) maximum temperature at 2-m as a function of station elevation.
In order to investigate the impact of the station elevation on the model minimum and maximum temperature forecasts, stations were grouped according to their reference altitude. Figure 7 displays the average minimum and maximum temperature bias for the entire year 2010 as a function of the station elevation. The general trend of temperature underestimation was also evident among the various groups of elevations. In more details, the minimum temperatures
indicated a systematic cold bias up to 0.5C for the stations under the 250 m. This may be attributed to the model domain inadequate representation of terrain characteristics especially in coastal areas with complex sea-land distribution. The maximum temperatures were also underestimated up to 0.5C for the elevations exceeding the 750m during the transient and summer seasons (Fig.5).
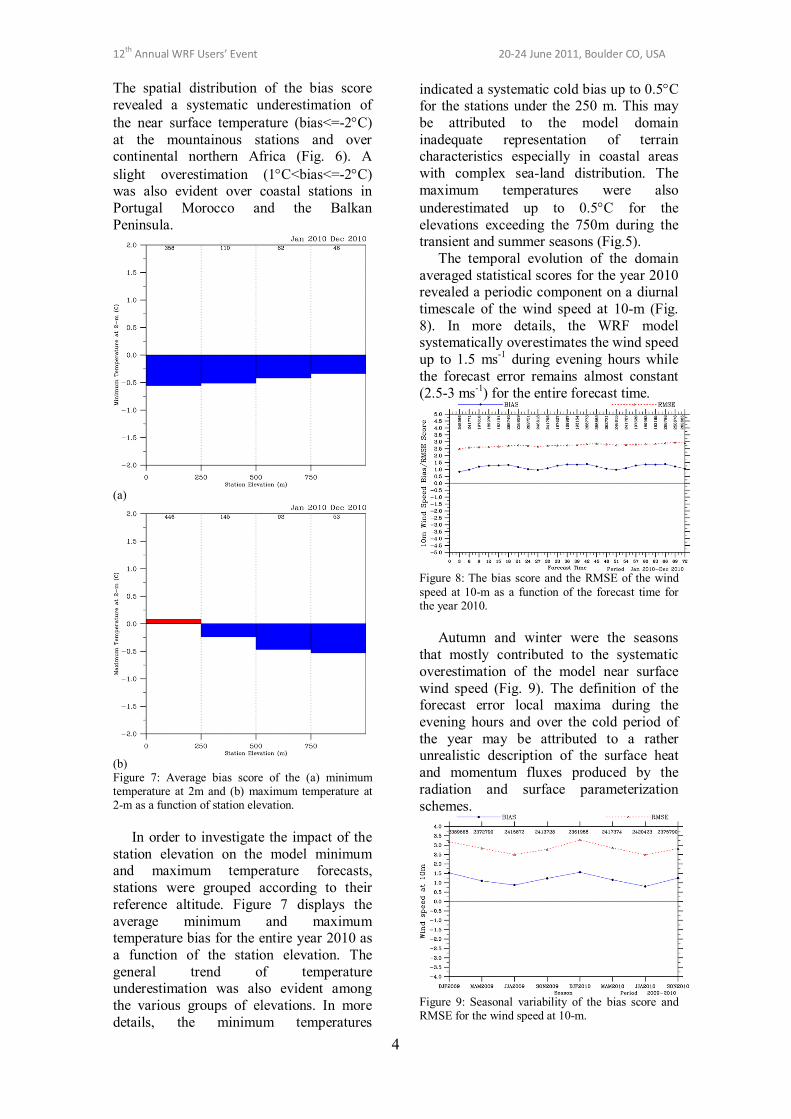
The temporal evolution of the domain averaged statistical scores for the year 2010 revealed a periodic component on a diurnal timescale of the wind speed at 10-m (Fig. 8). In more details, the WRF model systematically overestimates the wind speed up to 1.5 ms-1 during evening hours while the forecast error remains almost constant (2.5-3 ms-1) for the entire forecast time.
Figure 8: The bias score and the RMSE of the wind speed at 10-m as a function of the forecast time for the year 2010.
Autumn and winter were the seasons that mostly contributed to the systematic overestimation of the model near surface wind speed (Fig. 9). The definition of the forecast error local maxima during the evening hours and over the cold period of the year may be attributed to a rather unrealistic description of the surface heat and momentum fluxes produced by the radiation and surface parameterization schemes.
Figure 9: Seasonal variability of the bias score and RMSE for the wind speed at 10-m.

12th Annual WRF Users’ Event 20-24 June 2011, Boulder CO, USA
5
The model overestimates the near
surface wind speed over the most stations in Europe and the northern Africa (Fig. 10). Only over Sahara desert and the Arabic peninsula a moderate underestimation for the entire year 2010 is observed.
Figure 10: Spatial distribution of the 10-m wind speed bias score for the year 2010.
Figure 11: Average bias score of the wind speed at 10-m as a function of station elevation.
Moreover, the stations located at low and moderate altitudes mostly contributed to the wind speed overestimation (Fig. 11). This may in part be related to the discrepancy between the elevation represented in the model domain and the actual elevation at which observations are made.
In addition to the surface parameters, the precipitation was also verified based on the aforementioned methodology for the discrete variables. The time-dependent bias and equitable threat scores based on the contingency table were estimated for the years 2009 and 2010. Figures 12 and 13 present the bias and ET scores for seven thresholds (0.5, 2.0, 4.0, 6.0, 10.0, 16.0 and 24.0 mm) of the 6-h accumulated precipitation for the first and the second day of forecast. The bias score as a function of
the 6-h precipitation thresholds was rapidly decreased from almost 1.75 to 1 for the light to moderate precipitation threshold values and slowly to 0.4 for the heavy precipitation (Fig.12a). This indicated a systematic overestimation of the light-to-moderate (0.5-6 mm) thresholds which was more prominent at the day time (Fig.12b).
Figure 12: The bias score as a function of precipitation thresholds for (a) the entire period and (b) the first 24-h of the 6-h accumulated precipitation.
The medium-to-high thresholds (6-24 mm) were underestimated during almost the entire forecast period. The equitable threat score was continuously decreased with increased precipitation categories and in conjunction with the similar decrease of the bias score, indicate a rapid decay of precipitation predictive skill from light to heavy precipitation (Fig. 13).
Figure 13: The equitable threat score as a function of precipitation thresholds for the year 2010.
4. Conclusions In this study a two-year quantitative
verification statistics of the near surface prognostic variables was performed in the

12th Annual WRF Users’ Event 20-24 June 2011, Boulder CO, USA
6
context of evaluating the WRF model forecast skill. On the basis of traditional objective verification techniques (like bias, RMSE, threat scores) preliminary results showed that the mean sea level pressure is systematically underestimated in a range of 0.1-0.5 hPa. The systematic error of the near surface air temperature indicated a diurnal signal, in which the moderate cold bias of almost -0.7C on evening hours turned to +0.5C warm bias during daytime. The seasonal distribution of the statistical scores revealed a cold, up to 1C, bias of the minimum and maximum temperatures for the transient and summer seasons while the maximum temperatures were overestimated up to 0.5C during winter. Moreover, the minimum temperatures indicated a systematic cold bias up to 0.5C at the stations located under the 250m. This may be attributed to the model domain inadequate representation of terrain characteristics. The maximum temperatures were also underestimated up to 0.5C for the elevations exceeding the 750m during the transient and summer seasons.
Concerning the wind speed forecasts, the WRF model systematically overestimated the wind speed up to 1.5 ms-1 during evening hours while the forecast error remains almost constant (2.5-3 ms-1) for the entire forecast time. However the seasonal variability of the bias score suggested that autumn and winter are the seasons that mostly contributed to the systematic overestimation. The definition of the forecast error local maxima during the evening hours and over the cold period of the year suggests a rather unrealistic description of the near surface heat and momentum fluxes. Additionally, the stations located at low and moderate altitudes mostly contribute to the wind speed overestimation. This may in part be related to the discrepancy between the elevation represented in the model domain and the actual elevation at which observations were made.
The 6-h accumulated precipitation bias score indicated a systematic overestimation of the light-to-moderate (0.5-6 mm) thresholds, which was more prominent at the day time, while the medium-to-high thresholds (6-24 mm) were underestimated for the entire forecast period. The equitable threat score was continuously decreased
with increased precipitation categories. However, domain-average precipitation statistics reveal only part of the model performance, since it has been found substantial spatial variations in precipitation forecast accuracy (Mass et al., 2002).
References Chen, F., and J. Dudhia, 2001: Coupling an advanced
land-surface/hydrology model with the Penn State/NCAR MM5 modeling system. Part I: Model implementation and sensitivity. Monthly Weather Review. 129 (4), 569-585.
Cheng, W.Y.Y., and W.J. Steenburgh, 2005: Evaluation of Surface Sensible Weather Forecasts by the WRF and the Eta Models over the Western United States. Wea. Forecasting, 20, 812–821.
Colle, B. A., K. J. Westrick, and C. F. Mass, 1999: Evaluation of MM5 and Eta-10 precipitation forecasts over the Pacific Northwest during the cool season. Wea. Forecasting, 14, 137–154.
Ferrier, B.S., Y. Jin, Y. Lin, T. Black, E. Rogers, and G. DiMego, 2002: Implementation of a new grid-scale cloud and precipitation scheme in the NCEP Eta model. Preprints, 15th Conf. on Numerical Weather Prediction, San Antonio, TX, Amer. Meteor. Soc., 280-283.
Gallus, W. A., Jr., 1999: Eta Simulations on three extreme precipitation events: Sensitivity to resolution and convective parameterization. Wea. Forecasting, 14, 405–426.
Gozzini B., Bartolini G., Grifoni D., Messeri G., Pasi F., Piani F., Rossi M., Tei C., 2008: Evaluation of Year 2007 Operational WRF-NMM, 9th WRF workshop Boulder, Colorado, 23-27 June 2008.
Janjic, Z.I., 1996: The Mellor-Yamada level 2.5 scheme in the NCEP Eta model. 11th Conf. on Numerical Weather Prediction, Norfolk, VA, 19–23 August 1996; Amer. Meteor. Soc., Boston, MA, 333–334.
Janjic ZI, Gerrity JP and Nickovic S., 2001: An Alternative Approach to Nonhydrostatic Modeling. Monthly Weather Review. 129, 1164-1178.
Mass, C., D. Ovens, K. J. Westrick, and B. A. Colle, 2002: Does increasing horizontal resolution produce better forecasts? The results of two years of real-time numerical weather prediction in the Pacific Northwest. Bull. Amer. Meteor. Soc., 83, 407–430.
Papadopoulos A. and Katsafados P., 2009: Verification of operational weather forecasts from the POSEIDON system across the Eastern Meditarreanean, Natural Hazards and Earth System Sciences, 9, 4, 1299-1306.
Roux G., Y. Liu, L.D. Monache, R.S. Shey and T.T. Warner, 2008: Verification of High Resolution WRF-STFDDA Surface Forecasts over mountains and plains. 9th WRF workshop, Boulder, Colorado, 23-27 June 2008.
Schwarzkopf, M D., and S Fels, 1991: The simplified exchange method revisited: An accurate, rapid method for computation of infrared cooling rates and fluxes. Journal of Geophysical Research, 96(D5), 9075-9096.
Wilks, DS, 1995: Statistical Methods in the Atmospheric Sciences, Academic Press, 233-242.