Embed Size (px)
Citation preview
1
Quantitative Studies of Water and Sanitation Utilities:
A Literature Survey
March 3, 2010
S. Berg*, R. Marques**
* Public Utility Research Center, University of Florida, PO Box 117142 Gainesville,
FL32611-7142, USA
Phone number: +352.392.0132
(E-mail: sberg @ ufl.edu)
** Center of Urban and Regional Systems, Technical University of Lisbon, 1049-001
Lisbon, Portugal
(E-mail: rcmar @ civil.ist.utl.pt)
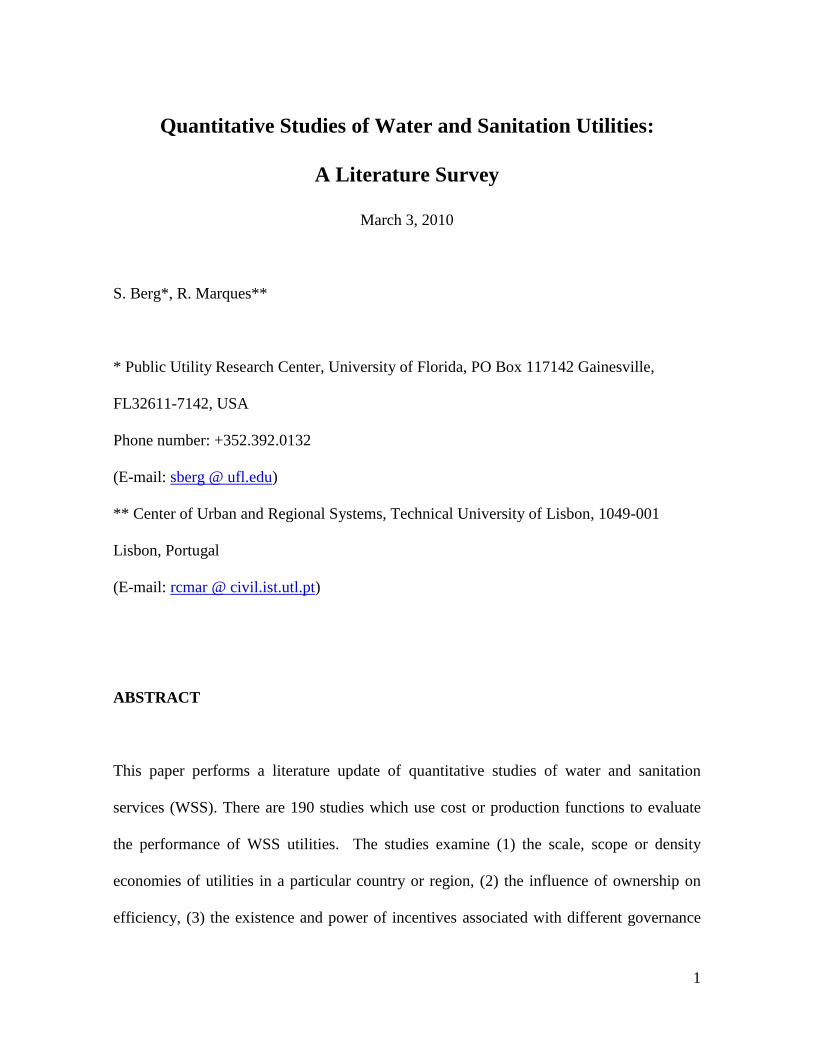
ABSTRACT
This paper performs a literature update of quantitative studies of water and sanitation
services (WSS). There are 190 studies which use cost or production functions to evaluate
the performance of WSS utilities. The studies examine (1) the scale, scope or density
economies of utilities in a particular country or region, (2) the influence of ownership on
efficiency, (3) the existence and power of incentives associated with different governance
2
systems (including external regulation), and (4) performance assessment (benchmarking).
In addition, this paper presents some patterns regarding quantitative methods adopted over
time and major trends in results.
Keywords: benchmarking; water and sanitation utilities; literature survey
1. INTRODUCTION
The water sector is significant in terms of the public policy issues raised by water resource
management and by access to water and sanitation services (WSS), especially in
developing countries. The resources devoted to new investments and operations dwarf
those in most sectors. However, the literature on WSS utilities does not fully reflect the
importance of the sector. Economists and other analysts have tended to focus on
quantitative studies of cost or production functions, with attention growing dramatically in
recent years. However, it is interesting to note that of the 213 researchers publishing the
120 articles identified in this census, two-thirds only authored or co-authored one article.
This pattern suggests that many scholars “dip into” sector, but only a few engage in
sustained research on WSS utilities. The empirical studies by one-time and longer term
researchers generally address related policy issues, like market structure (economies of
scale and scope), the impact of ownership arrangements (public vs. private), and the role of
incentives and governance in promoting efficiency. Some assess the relative performance
3
of utilities, controlling for factors beyond the control of local managers. Such
benchmarking studies are beginning to be utilized more widely in regulatory proceedings.
Most of the other studies also attempt to identify determinants of performance, so these also
have implications for yardstick comparisons. Given the level and mix of research activity
on this sector, it is useful to draw together the studies to better understand when, what, and
where articles have been published and which results are most decision-relevant. Section 2
presents the major features of research appearing in the literature, including the type of
publications, their time pattern, the types of journals, the patterns of co-authorship and
sponsorship and the countries covered. Section 3 focuses on the quantitative techniques
adopted and Section 4 identifies the issues addressed by the studies reviewed. Finally,
Section 5 provides some concluding observations.
2. CHARACTERISTICS OF WATER UTILITY RESEARCH
2.1 Narrative Review
Studies appear in specialized and general journals and in other venues, including Working
Papers, books, reports and dissertations. The former are more readily accessible and have
passed the scrutiny of impartial reviewers, so we will focus on journals. Every field of
study has its own time pattern of publications. As data have become more widely available
(and the policy importance of WSS utilities has increased), researchers have had better
opportunities to test hypotheses regarding the nature of cost or production functions in the
4
water sector. In addition, the types of journals and the countries covered in the empirical
studies show some interesting patterns.
2.2 Where: Types of Publications
We conducted an exhaustive review of the empirical literature (up to January 2009) on
WSS providers. As far as we know, our census includes all the studies published worldwide
in refereed journals, Working Papers Series, Books or Book Chapters, Reports and
Doctoral Dissertations. We do not consider Papers and Proceedings from Conferences or
Masters Theses unless they became books. Usually, the latter have fewer citations and their
quality is not the same as studies falling in the other categories A total of 190 studies were
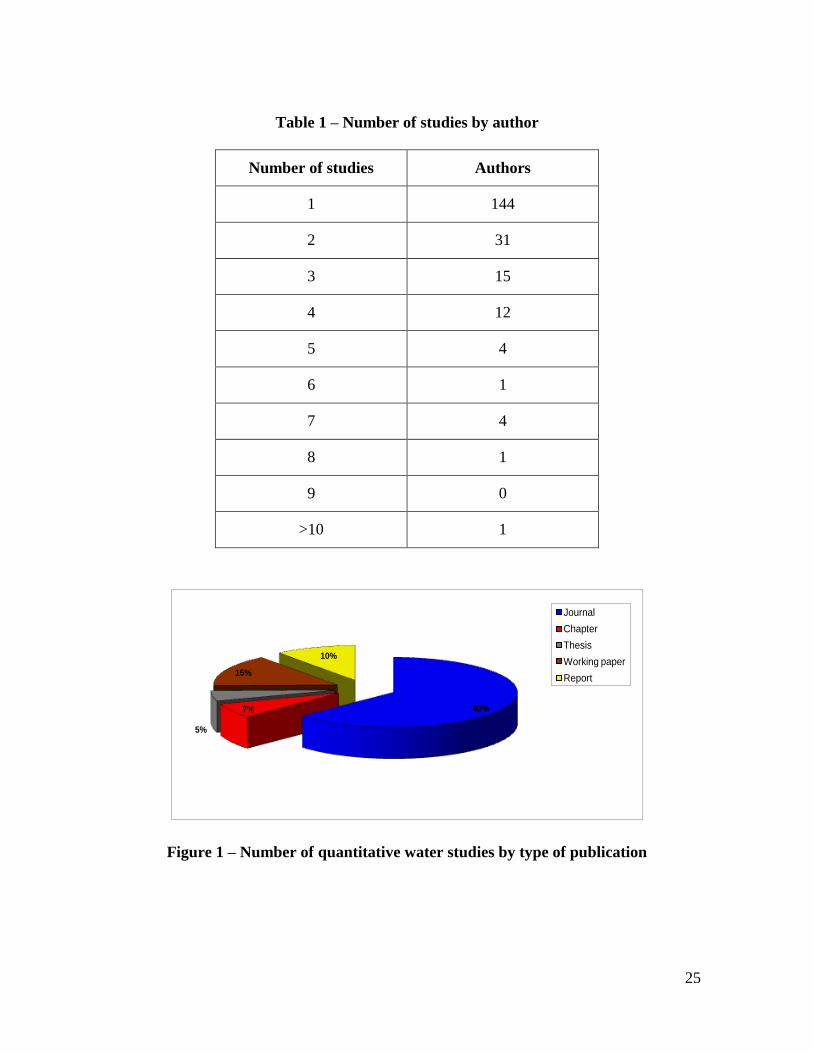
identified, as shown in Figure 1. The majority of these studies were published in academic
or policy journals (63%), followed by Working Papers (about 13%), reports (10%), book
chapters (7%) and the Ph.D. dissertations (5%). Note that some of the journal articles were
previously published as working papers. To avoid double counting, we only included
unpublished Working Papers in that category. Accepted articles published in 2009 (or
forthcoming), were categorized as journal articles or chapters, depending on the outlet.
(Insert Figure 1)
5
2.3 When: the Time Pattern of Publications
The earliest empirical study identified in our census was by Ford and Warford (1969). The
authors tried to find an appropriate specification of the cost function for water utilities in
England and Wales. Based on estimated coefficients, they argued that regionalization (or
further amalgamation of firms) would not necessarily lead to a lowering of average costs
for these state enterprises. In the 1970s and 1980s only two dozen studies were published.
Most of these relate to question of whether ownership (public or private) affected
performance. In the 1990s and the next decade, the number of published studies increased
substantially. Since 2000, 132 studies were added to the overall literature, about 70% of the
total amount to date. This significant increase is likely linked to the increase in regulation
of network industries in the late 90‟s. In particular, regulators began applying incentive
regulation and benchmarking tools to firms delivering water and sanitation services. In
addition, the new public management philosophy promoted more of a market orientation in
the public sector and consequently at greater cost-efficiency for public organizations.1
It should be noted that some of the principles of new public management are utilized in
WSS benchmarking, such as the use of public scrutiny (transparency), rigorous evaluations
of organizational performance, and greater attention to the adoption of incentives.2 No less
important for research in the area was the development of new quantitative techniques and
software allowing for the easy computation of benchmarking models.3
The need for
academic researchers to publish papers for tenure and professional visibility was important
as well. Thus, both demand (by academic departments and regulatory institutions) and
6
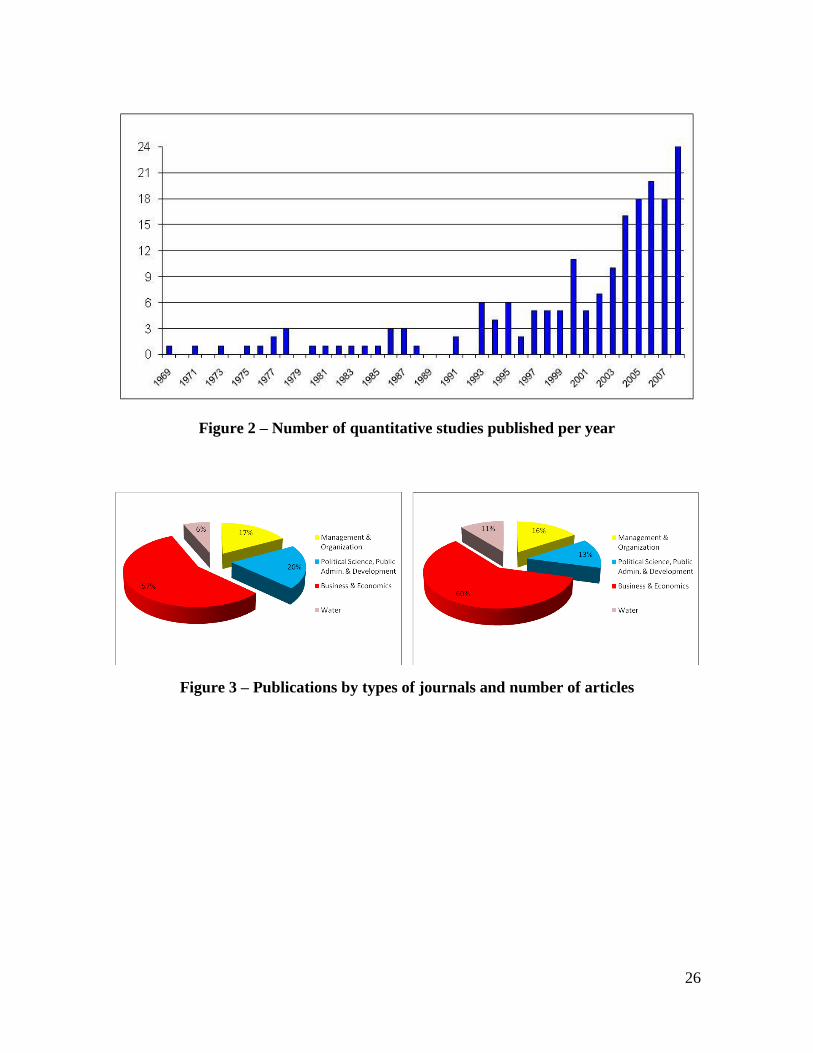
supply (by scholars and consultants) supported an expansion of academic studies. Figure 2
presents the evolution of the number of quantitative studies per year since 1969 until the
end of 2008.
(Insert Figure 2)
2.4 Where: Types of Journals
We identified 120 articles published in academic journals, where these can be classified
into four major groups: (1) Management & Organization, (2) Political Science and Public
Administration (and Development), (3) Business and Economics and (4) Water Journals.
The publication patterns are shown in Figure 3: the left hand side depicts the type of journal
and the right hand side shows the percentage of all articles published in those journals.
Clearly, the category of Business and Economics Journals dominates the results. In addition
to fitting into topics covered by such journals, there are other factors leading to this
outcome. First, the number of journals is very large. Second, a cost study in a general
economic journal can be of interest to non-specialists, especially if the techniques are
powerful and the issues important. Third, this category has the largest audience. Note that
the number of water journals that publish benchmarking studies is small, but this category‟s
importance grows when we consider the total number of studies published (from 6% to
11%).
(Insert Figure 3)
7
To obtain information on Working Papers, we searched several databases, including the
Social Science Research Network (SSRN), IDEAS and EconPapers and university
websites. The actual number of Working Papers using quantitative methods is higher than
the twenty-eight depicted in Figure 1. However, to avoid double-counting we removed
those that were published later (and the ones that would be published in a forthcoming
issue) as Academic Journal articles. Of the 120 journal articles in our census, 43 were
available earlier as Working Papers. With internet access, Working Papers have increased
in importance for both rapid dissemination and early feedback to authors. The articles (in
the highest ranked journals) usually go through a first stage as a Working Paper. Of the 72
articles published since 2001, 41 studies were initially disseminated as Working Papers.
Other sources are less accessible or represent early stages of research. Reports comprise
about ten percent of all the quantitative studies of water utilities; however, many of these
studies are not available to the public. Thus, we have titles but no document that can be
reviewed or critiqued. The existence of nine dissertations on the topic probably
underestimates the volume of graduate student research since many economics dissertations
involve essays, which could include a study of WSS cost or production functions. Books
that include water benchmarking research tend to contain studies of other infrastructure
sectors as well.4 This lack of comprehensive volumes on the topic is not surprising. Recall
the small number of scholars who have published more than three articles on the
performance of WSS utilities. As a sector to be studied, the underlying production
technology is almost as complicated as the institutional and geographic / topological /
hydrological context. Limited availability of data (and problems with estimating the cost of
8
capital for state-owned enterprises) presents problems for researchers—who might choose
to move on to other fields after their first quantitative study of operators in this sector.
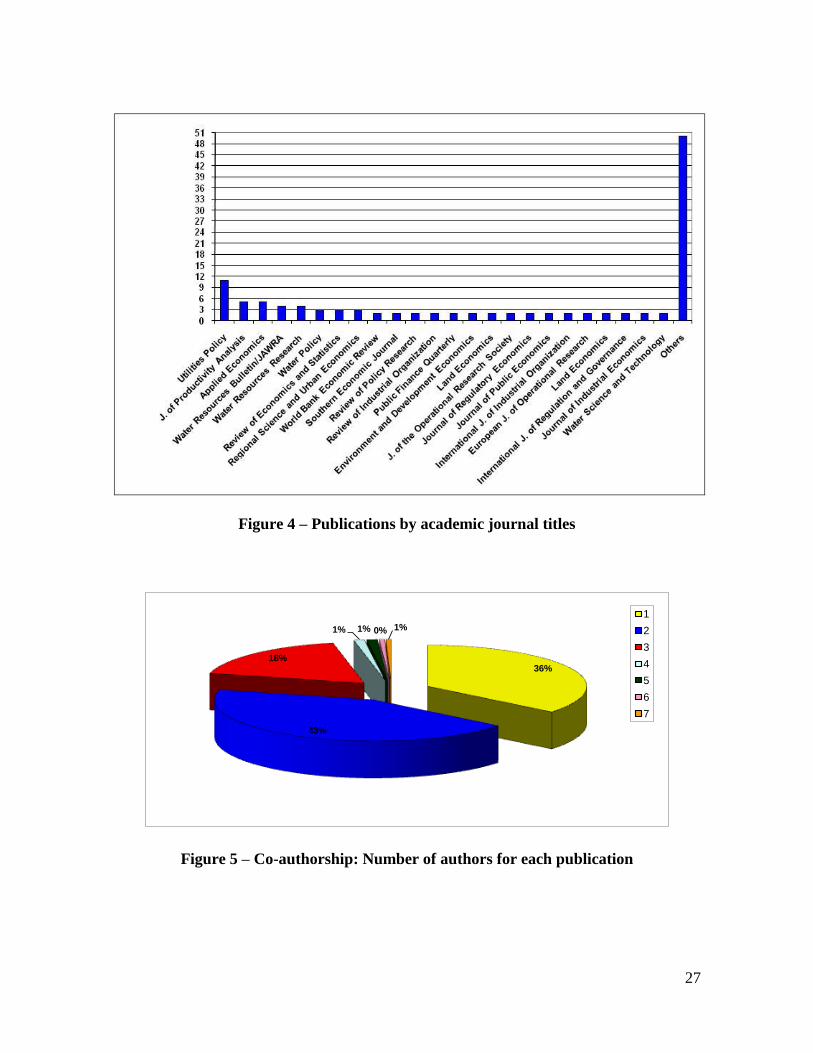
The number of publications appearing in individual journals title is presented in Figure 4.
Utilities Policy has eleven studies, followed by the Journal of Productivity Analysis and
Applied Economics with five studies each. Water Resources Bulletin, now Journal of the
American Water Resources Association (JAWRA), and Water Resources Research are next
with four articles each. The 120 articles appeared in 52 different journals.
More than 90% are indexed in the Scopus database but only about 50% are ISI journals and
indexed by Thompson, although some of them have high impact factors. For example, the
water journals tend to be highly cited in the literature when compared with the Business &
Economics journals, where topics are much more dispersed, given the large number of
general and field journals. The impact factors of more specialized water journals are on
average much higher, though comparing “impact” across disciplines is highly problematic.
(Insert Figure 4)
2.5 Who: Patterns of Co-Authorship and Sponsorship
Careful study of WSS utilities requires expertise in quantitative methods (including model
specification), knowledge of the institutional features facing managers, and an awareness of
the strengths and limitations of available data. Thus, one would expect to find multi-
9
authored studies in this field, since econometricians or specialists in other forms of data
analysis are unlikely to have all the expertise required for comprehensive analyses.
However, over one-third of the studies are single-authored. Slightly over forty percent have
two authors. There are only four studies with more than three authors. Figure 5 presents
these results in graphical form.
(Insert Figure 5)
As noted earlier, of the 213 authors in this census, 144 only authored or co-authored one
article. This pattern suggests that many researchers dip into the field and move on to other
topics. Eleven authors have published more than four studies; only one has more than 10
studies. Table 1 shows the number of studies per author. We considered three types of
author affiliations: Academia, Water-Related Institutions, and International Organizations.
Sometimes there are mixed studies where Academics cooperate with staff from
international organizations and Water-Related Institutions. The largest author category
consists of Academics (86% of the studies), followed by Water-Related Institutions with
11% and International Organizations with 3%. Studies by researchers at Water-Related
Institutions almost always are carried out under the auspices of sector regulators (both in-
house and indirectly, through consultants). International Organizations are basically
financial and donor institutions. Many studies by analysts at Water-Related Institutions are
confidential and/or are not published.
(Insert Table 1)
10
2.6 Countries Covered in Studies
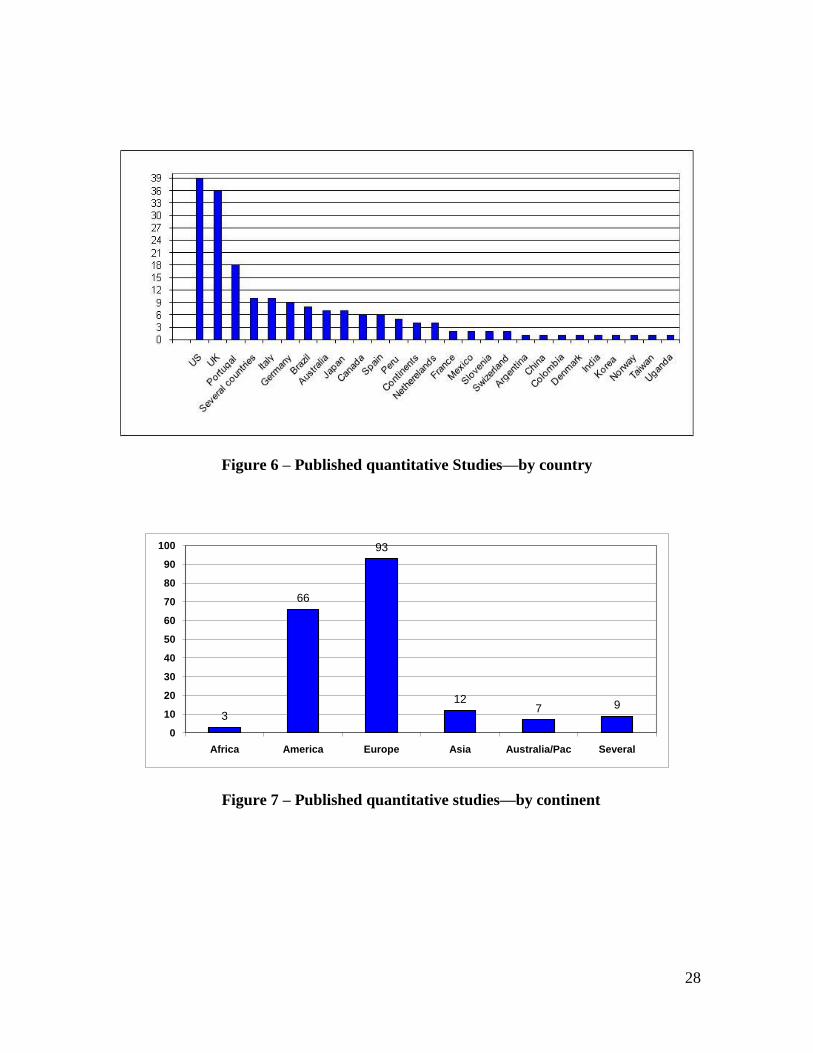
As would be expected, the pattern of countries included in quantitative studies depends on
data availability and intrinsic interest in particular hypothesis-tests and in performance
comparisons. More than one-fifth of the studies relate to the U.S. and/or particular states in
the U.S., followed closely by the U.K. This pattern reflects country size and the number of
university academics and professionals in research institutions and academics. In addition,
the headquarters of many international organizations are in the U.S. The high number of
studies for the U.K. is due to the role of The Water Services Regulation Authority (Ofwat).5
Ofwat pioneered the application of benchmarking studies to regulation. It monitored a
sector whose market structure involved water and wastewater companies that are all
private. Dropping cross-country studies, we found papers on 25 individual countries from
all five continents.6 In some cases, like Portugal or Germany, a specific researcher drove
the country-specific numbers. Figure 6 illustrates the countries examined in quantitative
studies of WSS cost or production functions.
(Insert Figure 6)
Of the 14 cross-country studies, four were limited to comparisons in particular continents.
If we consider single country and cross-country studies by continent, Europe has the
greatest number, with 94 studies, approximately half of the total. The Americas represents
about one-third, with the majority from the U.S. and Canada (81%). The least well-
represented continent is Africa, with only three published quantitative studies. The main
11
reason for the limited number of studies for Africa is data availability. Given the amount of
donor funds that have gone into the region, the lack of careful benchmarking studies is
somewhat surprising. Figure 7 shows the number of studies by continent.
(Insert Figure 7)
The majority of the papers were published in English. The reasons are clear: the U.S. and
U.K. are important countries and most English-language Journals have greater visibility
(circulation) and better reputations (in terms of readership and citations). However, 18
studies are in Portuguese, Spanish, French, Italian, Dutch, Japanese, German, Norwegian or
Danish; for the nine languages, they correspond to 9% of the literature.
3. QUANTITATIVE TECHNIQUES
Murillo-Zamorano (2004), Coelli et al. (2005), Lovell (1993) and Fried et al. (2008a) all
divide cost or production function studies into parametric and non-parametric, whether or
not they use a functional form specification for efficiency estimation.7 In the latter case an
econometric function for the production or cost (profit) technology is adopted. In the
former, mathematical programming is used to define the technology that is formed by the
sample under consideration. In the literature of water quantitative studies, about 58% of
them use parametric methods and 34% non-parametric ones; 8% utilize both methods. It
should be noted that 21 papers are conceptual in nature; they do not use any benchmarking
12
method. Studies can also be classified into deterministic and stochastic, where deterministic
ones include both non-parametric and parametric studies. The latter recognize the stochastic
nature of quantitative modeling (by considering the noise), but they do not separate the
impact of noise (purely random errors) from that of inefficiency. From this perspective,
only 25% of the benchmarking studies found in the literature were stochastic.8
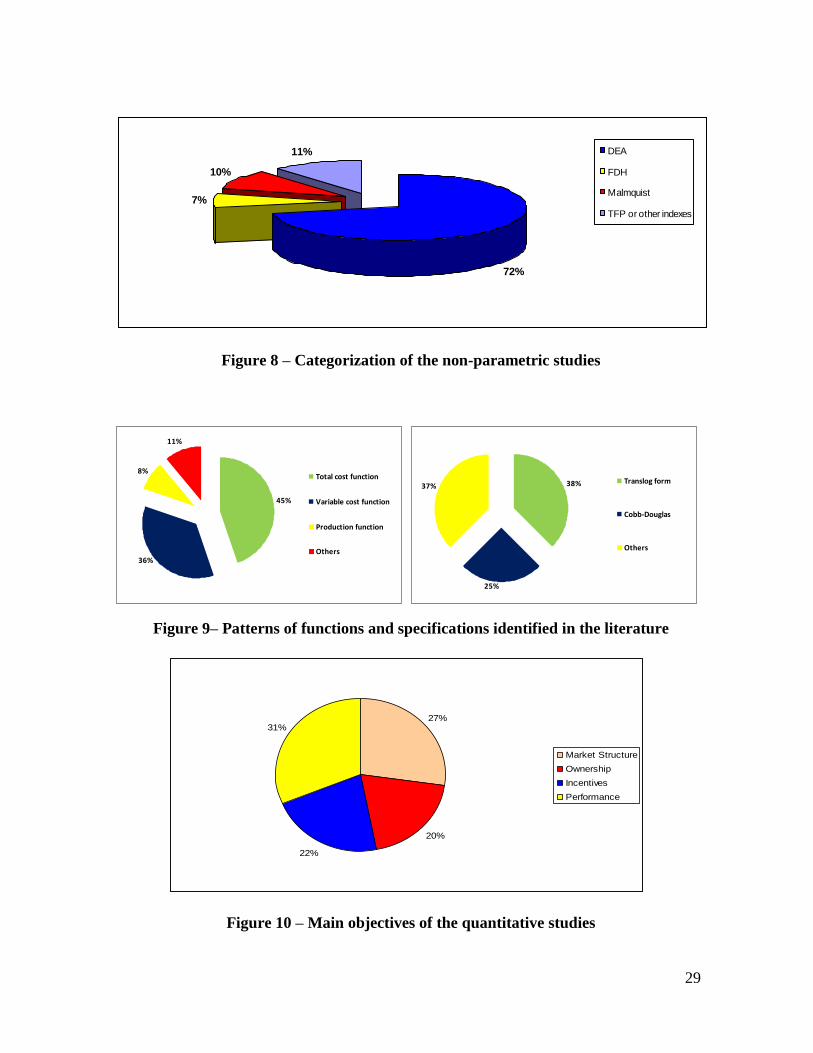
Most of the non-parametric studies use data envelopment analysis (DEA). Only 28% of the
studies correspond to other non-parametric techniques such as the Malmquist productivity
index, the Full Disposal Hull (FDH) or the total factor productivity and partial measures of
productivity. Figure 8 illustrates the categorization of non-parametric studies. Concerning
the 71 non-parametric studies, 15 compute productivity indices, whereas the others
calculate efficiency. Although the DEA-BCC model (assuming variable returns to scale) is
the most used, DEA-CCR is also frequently adopted to estimate scale efficiencies. Seldom
do the models use congestion (see Simões and Marques, 2010) or variables that are proxies
for undesirable outputs (Liu et al., 2009). The most used inputs are labor, operational
expenditures, other operational expenditures, capital expenditures, capital stock and total
cost. Sometimes the mains length is used as a proxy for capital. The most frequent outputs
are the volume of water delivered, the number of customers (water and wastewater), and
treated wastewater.
(Insert Figure 8)
13
About 35% of the non-parametric studies include explanatory factors to take into account
the operational environment of water utilities. The Tobit regression second stage is the most
used procedure. Truncated regression adopted less frequently; more recently, studies have
employed bootstrap regression in the second stage (Simar and Wilson, 2008) and
conditional frontiers (Cazals et al., 2002). Procedures of bootstrap, partial frontiers (order-
m and order ) and conditional frontiers have started to be used in the non-parametric
studies carried out in recent years (see Daraio and Simar, 2007 and Simar and Wilson,
2008). We identified more than twenty explanatory factors used by analysts, including
customer density, proportion of non-residential customers, water source, peak factor, and
water losses (see Renzetti and Dupont, 2009). The water losses variable is used as a proxy
for inadequate maintenance costs. However, it would be more appropriately modeled if it is
included as an undesirable output. Almost all studies use an input oriented model
specification. Few use non-oriented models and no one adopted an output oriented
approach, which is understandable in the case of water utilities.9
Concerning parametric methods, about 45% use total cost, followed by variable cost
functions (36%), other functions (distance functions, allocative cost functions), and
production functions. About 38% use a translog specification, 25% the traditional Cobb-
Douglas specification and 37% use other specifications, encompassing the quadratic, cubic,
Fourier, Symmetric Generalized McFadden (SGM) cost function, composed error function,
and the shadow cost function. Figure 9 illustrates the relative use of the various functions
and specifications adopted. About half of the parametric studies use cross-sectional data for
14
a single year, and the other half panel data. On average, there are four years in a panel for
studies in the census. The estimation methods most often employed are ordinary least
squares (OLS), followed by seemingly unrelated regression (SUR). The inputs, outputs and
explanatory factors are similar to the non-parametric techniques, although it is easier to
incorporate the operational environment into such models, so DEA studies tend to include
more variables.
(Insert Figure 9)
4. ISSUES ADDRESSED BY THE STUDIES
4.1 Categorization
While reviewing the literature, we found some clear patterns in the issues addressed by the
studies: quantitative studies address issues related to market structure, ownership,
incentives and performance. Figure 10 shows the four objectives that tend to be pursued via
studies of cost or production functions. Note that the results correspond to the major aim of
each article, since most of them have more than one objective. The topics and results are
briefly summarized below.
(Insert Figure 10)
15
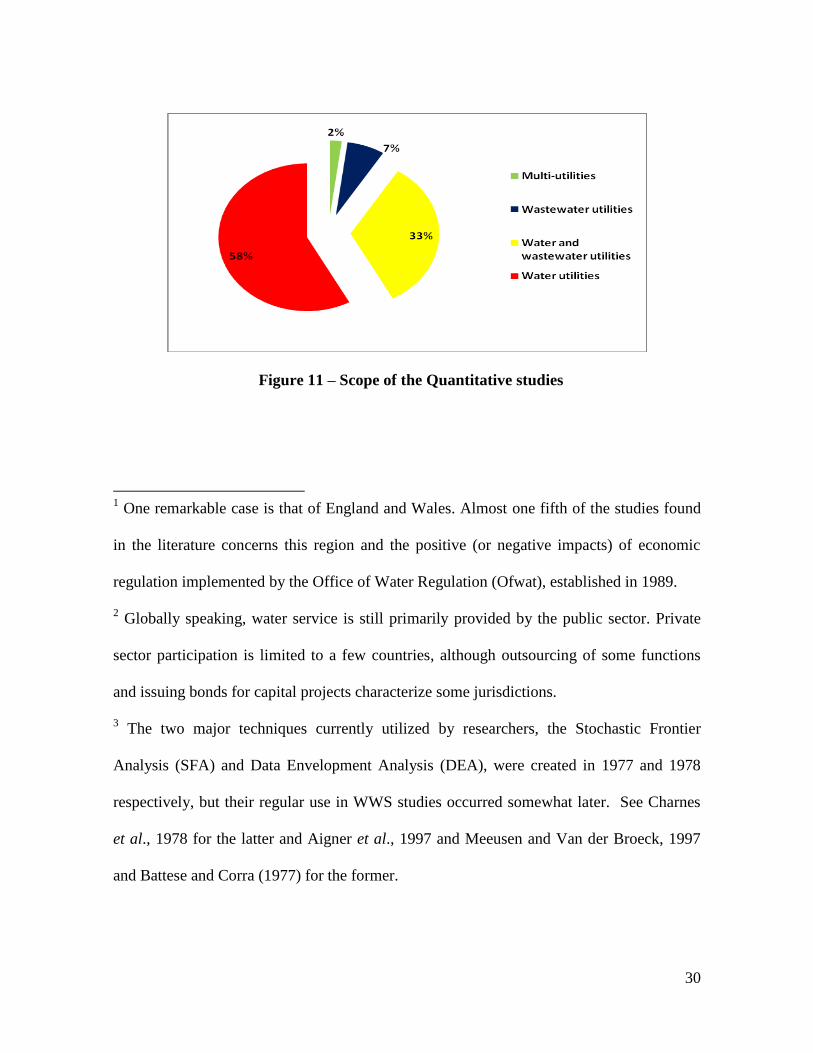
4.2 Market Structure
About 58% of the studies examine only water utilities and about 33% investigate water and
wastewater utilities. Thus, a number of studies examine economies of scope between water
and wastewater. Wastewater utilities correspond to 7% of the studies and multi-utilities
studies, which include the drinking water supply, comprise 2%. Normally these multi-
utility papers involve operators producing gas, electricity and water services. Figure 11
depicts these results.
(Insert Figure 11)
The impact of market structure of the water basically involves determining whether or not
the number of producers and their product mixes maximize efficiency. We identified 61
papers addressing this issue in the literature. The market structure analysis was the first
objective in 51 of these studies. The determination of the existence of economies of scale,
and particularly the optimal size of water utilities, is a classic problem in the water sector.
We found 47 studies addressing this issue. The results are mixed and depend on the average
size of the water utilities in the sample. There is, however, some consensus regarding the
existence of scale economies up to a point, depending on the outputs mix and of a sample
considered.10
Within this theme, it is also interesting to look for efficiency gains associated
with economies of scope. A number of studies examine the existence of savings from the
joint provision of drinking water supply with wastewater or other activities like piped gas,
electricity or urban waste.
16
A related area of investigation involves assessing economies from vertical integration of
water and wastewater utilities: are there advantages in providing simultaneously
“wholesale” and “retail” services in drinking water supply (abstraction, treatment and
transport, on the one hand, and water distribution to the other hand) and wastewater
(respectively, collection and sewer services on the one hand and wastewater treatment on
the other hand). The results here are mixed as well.11
However as far as vertical integration
efficiencies of drinking water supply are concerned, the results suggest some advantages to
vertical integration. We found 21 studies in the literature addressing economies of scope
and from these 7 are related to the verticalization issue. Another issue addressed by analysts
is excess installed capacity and the existence of economies of density. As a rule, water and
water utilities have significant economies of density, both economies of production and
customer density were identified in the literature. There were nine studies in the literature
on this issue: all support the existence of economies of density. The analysis of the water
utilities‟ market structure is mostly based on parametric methods. For example, in the case
of economies of scope (and economies of vertical integration) we found only one study that
applied non-parametric methods.
4.3 Ownership
The second aim of the quantitative studies is to determine the influence of ownership on
efficiency. This issue is a classic problem, leading to a seemingly endless discussion.
Although some economic theories support the superior performance of the private sector,
17
the literature on all sectors is mixed.12
We identified 47 studies in the literature on water
benchmarking: 37 focused exclusively on the ownership issue and the remaining addressed
other issues as well. Within the census, 18 studies concluded that private water utilities
were more efficient than the public ones, 12 find public water utilities to more efficient than
the privates, and 17 reach inconclusive results. On the whole one point seems common
irrespective of the concluding remarks of each research. The private sector tends to improve
labor productivity but often increases capital expenses. However, it is difficult to account
for network expansion mandates and the removal of State-Owned Enterprises (SOE)
subsidies upon privatization. In addition, the public sector tends to under-invest in
infrastructure and has lower labor productivity. Furthermore, service quality is seldom
included in these studies. In the studies that indentified public sector performance as
superior to privately owned utilities, rate base regulation could be causing an excess of
capital being spent and to gold plating practices (A-J effect).
4.4 Incentives
The third objective involves determining the impact of incentives in the water industry. We
found 42 studies addressing this issue. Yardstick comparisons via benchmarking techniques
are often seen as a means to encourage water utilities to become more efficient and
innovative. Thus, benchmarking might be seen as simulating market forces, replacing
competition in or for the market by the competition per comparison (yardstick
competition). Most of these studies are related to the regulation of water utilities and are
18
concerned with the efficacy of regulatory incentives which use benchmarking. We
identified 21 studies related to the regulatory methods actually used (positive studies) or
which should be used (normative studies). Most of the studies conclude that regulation has
improved the efficiency and productivity of water utilities, based on past regulatory
methods. Other studies simulate more strict regulatory methods using benchmarking to set
tariffs or supervise the quality of service, arguing that in this way the public interest is
better protected.
The remaining studies compare the outcomes of different regulatory methods. All these
studies find benefits from using incentive regulation of water industry: 18 studies focus on
the benefits of using benchmarking to enhance value for money in the provision of water
utility services. Although some of these studies seem to be linked to specific regulatory
objectives, this research mainly highlights the role performed (or to be performed) by
benchmarking in the different countries. In some of these countries, like in The Netherlands
for example, there was no sector-specific regulator. As would be expected, all the studies
identified a positive impact from using benchmarking practices—whether or not an
autonomous regulator was overseeing the sector. Finally, 8 studies investigated the effect of
commercialization or corporatization of the water utilities. Surprisingly, most of the studies
of these reforms did not find positive impacts: the inclusion of market rules in the public
provision of water did not seem to improve performance, absent other policy treatments.
Although there could be goods reasons for that, such as the lack of control in the
expenditures of these entities, at least in their initial phase, it is very important to carry out
benchmarking studies so that stakeholders can monitor the outcomes of such reforms.
19
4.5 Benchmarking: Comparisons of Relative Performance
The fourth objective (and the most representative in our literature review) corresponds to
the use of benchmarking to measure the performance of each water utility and identify the
best practices in the sample considered. We found 66 such studies in the literature. Most of
them attempt to determine the relative efficiency of utilities in a particular country, region
or cross-country sample. There are also some studies which propose, apply, or compare
new models. For example, economists have attempted to estimate allocative efficiency, to
apply additive models, and employ bootstrap procedures in the non-parametric techniques.
In some studies, researchers investigated the potential for using rankings to develop
incentives, often taking service quality of service into account (Berg and Lin, 2008). Most
of these papers are carried out by non-academic authors.
The decision-relevance of such rankings is a topic worthy of further investigation. If the
results are not robust to different model specifications or to time periods, the rankings will
be called into question if they are actually used in regulatory proceedings. There seems to
be a creative tension between academics who seek to add “bells and whistles” to
econometric and other quantitative studies and practitioners who must be able to
communicate the results to key stakeholder groups. Studies are fairly limited on topics like
quality of service, financial sustainability, and determinants of economic efficiency.
Similarly, studies relating the economic performance to the environment and water resource
scarcity would fill an important gap. These issues deserve more attention in the future.
20
5. CONCLUDING OBSERVATIONS
This literature survey has examined the number and pace of publications providing
quantitative studies of water utilities, when and where those studies have appeared,
countries and regions investigated, and methodologies utilized in these studies. In addition,
we have summarized the results of studies examining different factors affecting cost: (1)
market structure (economies of scale and scope); (2) ownership arrangements (Public vs.
Private); (3) incentives introduced by changes in regulation, and governance; and (4)
benchmarking in practice. This survey provides an impressionistic overview of the results,
and points to areas for future research.
Furthermore, we wish to underscore three key conclusions:
Few Analysts engage in sustained research in this field: 213 researchers published
the 120 articles identified in this census: two-thirds only authored or co-authored
only one article. This pattern suggests that investigation of water utility performance
is not a high status activity. This observation stands in stark contrast with the
importance of this sector for economic development and social welfare. Certainly,
within the narrow field of water policy, these studies are beginning to find an
interest audience;
Data availability affects the pace and pattern of publication: The growth in
quantitative studies over the past decade is at least partly due to the increased
21
availability of data on inputs and outputs in this sector, facilitating production
function studies. Donor agencies are partly responsible for increased transparency
and access to data for developing countries. As more input price data become
available, rigorous investigation of cost functions are likely to become more
prominent;
Policy importance of WSS utilities increases interest in comprehensive performance
studies: Researchers have an interest in and opportunities for testing hypotheses
regarding the nature of cost or production functions in the sector. Future studies are
likely to include exogenous factors beyond current managements‟ control (topology,
an inherited network, political constraints that limit financial sustainability) since
core variables will be more easily accessed. In addition, scholars will continue to
test for the impacts of alternative public policies (regulatory incentives,
consolidation/decentralization, and governance structures)—given the global
interest in these issues.
Hopefully, this survey will trigger comparable overviews of other quantitative fields. A
key problem in applied economics involves translating analytical constructs into
principles that can be utilized by practitioners. J. von Neumann (1947, p. 146) noted
most eloquently that without closer links between empirical researchers, policy
analysts, and theorists:
22
. . . there is a grave danger that the subject will develop along the lines of least
resistance, that the stream so far from its source will separate into a multitude of
insignificant branches, and that the discipline will become a disorganized mass of
details and complexities. In other words, at a great distance from its empirical
source, or after much abstract inbreeding, a mathematical subject is in danger of
degeneration. At the inception the style is usually classical; when it shows signs of
becoming baroque, then the danger signal is up.
Our reading of the literature is not that danger flags are waving, but the research
community could certainly consider ways that the literature falls short of being decision-
relevant and ways that it shows great promise.
REFERENCES
Aigner, D.; Lovell, K.; Schmidt, P. (1977). Formulation and estimation of stochastic
frontier production function models. Journal of Econometrics. Vol. 6, no. 1, pp. 21-37.
Berg, S. (2010). Water Utility Benchmarking: Measurement, Methodologies, and
Performance, International Water Association Publishing, London.
Berg, S.; Lin, C. (2008). Consistency in performance rankings: the Peru water sector.
Applied Economics. Vol 40, no. 6, pp. 793-805.
Cazals, C.; Florens, J.; Simar, L. (2002). Nonparametric frontier estimation: a robust
approach. Journal of Econometrics, Vol. 106, no.1, pp. 1-15.
23
Charnes, A.; Cooper, W.; Rhodes, E. (1978). Measuring the efficiency of decision making
units. European Journal of Operational Research. Vol. 2, no. 6, pp. 429-444.
Coelli, T.; Prasada, R.; Battese, G. (1998). An Introduction to Efficiency and Productivity
Analysis. Kluwer Academic Publishers, Boston.
Daraio, C.; Simar, L. (2007). Advanced Robust and Nonparametric Methods in Efficiency
Analysis. Methodology and Applications, Springer, New York.
Ford, J.; Warford J. (1969). Cost functions for the water industry. The Journal of Industrial
Economics, Vol. 18, no.1, pp. 53-63.
Fried, H.; Lovell, K.; Schmidt, S. (2008a). Efficiency and productivity. In The
Measurement of Productive Efficiency and Productivity Change. Edited by H. Fried,
K. Lovell e S. Schmidt. Oxford University Press, New York, pp. 3-92.
Fried, H.; Lovell, K.; Schmidt, S. (2008b). The Measurement of Productive Efficiency and
Productivity Change. Oxford University Press, New York.
Liu, W.; Meng, W.; Li, X.; Zhang. D. (2010). DEA models with undesirable inputs and
outputs. Annals of Operations Research. Vol. 173, no. 1, pp. 177-194.
Lovell, K. (1993). Production frontiers and productive efficiency. In The measurement of
productive efficiency: techniques and applications. Edited by H. Fried, K. Lovell e S.
Schmidt. New York (USA: Oxford University Press. pp. 3-67.
Meeusen, W.; Broeck, J. (1977). Efficiency estimation from Cobb-Douglas production
functions with composed error. International Economic Review. Vol. 18, no. 2, pp. 435-
444.
Murillo-Zamorano, L. (2004). Economic efficiency and frontier techniques. Journal of
Economic Surveys, Vol. 18, no. 1, pp. 33-77.
24
Renzetti, S.; Dupont, D. (2009). Measuring the technical efficiency of municipal water
suppliers: the role of environmental factors. Land Economics, Vol. 85, no. 4, pp. 627-
636.
Simar, L.; Wilson, P. (2008). Statistical inference in nonparametric frontier models: Recent
developments and perspectives. In The Measurement of Productive Efficiency and
Productivity Change. Edited by H. Fried, K. Lovell e S. Schmidt. Oxford University
Press, New York, pp. 421-522.
Simões, P.; Marques, R. (2009). Influence of congestion efficiency on the European
seaports performance. Does it matter? Forthcoming in the Transport Reviews.
Vining, A.; Boardman, A. (1992). Ownership versus competition: efficiency in public
enterprise. Public choice. Vol. 73, no. 2, pp. 205-219.
Von Neumann, J. (1947). The mathematician. In The Works of the Mind. Edited by R. B.
Heywood, University of Chicago Press, Chicago.
25
Table 1 – Number of studies by author
Number of studies Authors
1 144
2 31
3 15
4 12
5 4
6 1
7 4
8 1
9 0
>10 1
63%7%
5%
15%
10%
Journal
Chapter
Thesis
Working paper
Report
Figure 1 – Number of quantitative water studies by type of publication
26
Figure 2 – Number of quantitative studies published per year
Figure 3 – Publications by types of journals and number of articles
27
Figure 4 – Publications by academic journal titles
36%
43%
18%
1% 1% 0% 1%
1
2
3
4
5
6
7
Figure 5 – Co-authorship: Number of authors for each publication
28
Figure 6 – Published quantitative Studies—by country
3
66
93
127 9
0
10
20
30
40
50
60
70
80
90
100
Africa America Europe Asia Australia/Pac Several
Figure 7 – Published quantitative studies—by continent
29
72%
7%
11%
10%
DEA
FDH
Malmquist
TFP or other indexes
Figure 8 – Categorization of the non-parametric studies
45%
8%
11%
36%
Total cost function
Variable cost function
Production function
Others
38%37%
25%
Translog form
Cobb-Douglas
Others
Figure 9– Patterns of functions and specifications identified in the literature
27%
20%
22%
31%
Market Structure
Ownership
Incentives
Performance
Figure 10 – Main objectives of the quantitative studies
30
Figure 11 – Scope of the Quantitative studies
1 One remarkable case is that of England and Wales. Almost one fifth of the studies found
in the literature concerns this region and the positive (or negative impacts) of economic
regulation implemented by the Office of Water Regulation (Ofwat), established in 1989.
2 Globally speaking, water service is still primarily provided by the public sector. Private
sector participation is limited to a few countries, although outsourcing of some functions
and issuing bonds for capital projects characterize some jurisdictions.
3 The two major techniques currently utilized by researchers, the Stochastic Frontier
Analysis (SFA) and Data Envelopment Analysis (DEA), were created in 1977 and 1978
respectively, but their regular use in WWS studies occurred somewhat later. See Charnes
et al., 1978 for the latter and Aigner et al., 1997 and Meeusen and Van der Broeck, 1997
and Battese and Corra (1977) for the former.
31
4 Specialized books have examined cost structures and production functions for specific
infrastructure sectors like electricity, telecommunications, and transportation services (such
as airports and seaports).
5 The Water Services Regulation Authority (Ofwat) replaced the Office (Director General)
of Water Services (2006) in 2006.
6 Note that in the first twenty years (until the 90‟s) about 80% of studies were performed in
the U.S. By 2009, this percentage decreased to 20%. There seems to have been a shift away
from Americans to researchers from other regions of the world that are providing cutting-
edge research on the topic.
7 The literature contrasting the strengths and limitations of parametric and non-parametric
methods is vast. For overviews of both methods, see Fried et al. (2008b). Berg (2010)
explains to water sector practitioners how economists approach cost or production function
studies. He proceeds to describe how performance scores can be used to develop incentives
for managers.
8 Sometimes benchmarking studies are classified into frontier and non-frontier, depending
on whether the construction of the technology uses best practice or average values (see
Coelli et al., 2005). For example, the Ordinary Least Squares (OLS) technique uses the
„average‟ points to fit the data whereas Corrected OLS (COLS) uses best practice (by a
translation of the average adjustment of OLS). Recently, frontier methods have been used
almost exclusively by researchers; since these studies have very detailed explanations of the
different methodologies, we do not address related issues here.
32
9 Water utilities have the obligation to provide drinking water (and collect wastewater) for
all household customers; particularly in the developed nations, operators are often subject
to demand-side management policies that do not encourage consumption (output
maximization).
10 WSS utilities in countries like the UK or the Netherlands tend to present diseconomies of
scale (due to the size of their utilities) but in others like the U.S, Switzerland or Portugal the
results support the presence of scale economies.
11 Here, the cost structure of water delivery, which depends on the particular features of
water utilities, is also very important. For example, if administrative costs are high, there
may be economies of scope. In the case of vertical integration, the cost share of each
component might be decisive. When the production of water is relatively costly, there are
likely to be vertical integration economies.
12 The prediction of superior performance of private enterprise has been based on three
different theoretical models (Vining and Boardman, 1992): property rights theory (under
public ownership, managers have no claim on residual savings—reducing incentives for
cost containment or new product introductions), public choice theory (bureaucrats
maximize their own benefits and not the common interest—leading to political patronage
and other problems), and principal agent theory (where information asymmetries lead to the
capture of rents by bureaucrats).