Embed Size (px)
DESCRIPTION
Quantitative Risk Management for Dust and Hybrid Mixture Explosions: Framework and Application
Citation preview

1
Meftah A. ABUSWERa, Paul R. AMYOTTE
a, Faisal I. KHAN
b
& Luke S. MORRISONc
aProcess Engineering & Applied Science, Dalhousie University, Halifax, NS, Canada
bProcess Engineering, Memorial University, St. John’s, NL, Canada
cProfessional Loss Control, Fredericton, NB, Canada
Quantitative Risk Management for Dust and Hybrid Mixture
Explosions: Framework and Application The current research provides guidance on the prevention and mitigation of dust and hybrid
mixture explosions using a Quantitative Risk Management Framework (QRMF). Using
concepts drawn from previous studies, the framework consists of three main steps: (i) a new
combined safety management protocol, (ii) the use of DESC (Dust Explosion Simulation
Code) and FTA (Fault Tree Analysis) to assess explosion consequences and likelihood,
respectively, and (iii) application of the hierarchy of controls (inherent, engineered and
procedural safety). QRMF assessment of an industrial case study showed that the original
process was at high risk. DESC simulations and Probit equations determined the destructive
percentages. FTAs revealed high probabilities of explosion occurrence; in addition, detailed
individual and societal risks calculations were made, before and after the framework was
applied. Based on the hierarchy of controls technique, the framework showed significant risk
reduction to the point where the residual risk was acceptable for the process.
1. INTRODUCTION
To date, while many researchers have attempted to model or predict dust cloud
structures and flame propagation as a first step to mitigating or even preventing dust
explosions, there is still a lack of findings that can provide an adequate explanation of
those hazards (Eckhoff, 2005). Other research has tried to develop robust process
management procedures, techniques, tools, and frameworks with the intention of
mitigating or preventing dust explosion accidents, but there is still more work to be
done.
1.1 Quantitative risk assessment research
There is limited published research in the dust and hybrid mixture explosion
prevention area, mainly due to the complex nature of these phenomena (Markowski,
2007). Khan and Abbasi (1998, 2000) developed the software package MAXCRED
(Maximum Credible Accident Analysis) and TORAP (Tool for Rapid Risk
Assessment in Petroleum Refinery and Petrochemical Industries), respectively, to
conduct rapid quantitative risk studies and comprehensive risk analyses in the
petrochemical industries. Attwood et al. (2006) explained the development of a
quantitative model that can predict accident frequency on offshore platforms. Groen et
al. (2006) developed QRAS (Quantitative Risk Assessment System) software.
1.2 Dust explosion prevention tools
The following selected tools provide effective methodologies to manage, assess, and
analyze risks associated with dust and hybrid mixture releases, and have led to the
development of the QRMF reported here: (i) SCAP – an algorithm for safety

2
management based on input from probabilistic fault tree analysis for credible accident
scenarios (Khan et al., 2001), (ii) a quantitative risk assessment (QRA) methodology
for industrial processes handling dust (van der Voort et al., 2007), which illustrates an
interesting approach to incorporating dust explosion probability and consequence
severity considerations into a QRA tool, (iii) a systematic approach to loss prevention
incorporating the principles of inherently safer design (Amyotte et al., 2003), and (iv)
the CFD-based dust explosion simulation code (DESC) developed by GexCon,
Norway (Skjold, 2007).
2. QUANTITATIVE RISK MANAGEMENT FRAMEWORK The conceptual design and implementation of the QRMF for dust and hybrid mixture
explosion hazards has been presented previously by Abuswer et al. (2011). Here, our
primary purpose is to report on the application of the framework to an industrial case
study.
3. CASE STUDY (IMPERIAL SUGAR REFINERY DUST EXPLOSION)
This section demonstrates the application of the framework to a dust explosion that
occurred in the Imperial Sugar refinery in Port Wentworth, Georgia, US, in 2008. The
case study geometry has been built using the actual dimensions and the DESC pre-
processor CASD, and possible scenarios have then been simulated by DESC. This
case study clearly shows the QRMF’s benefits in reducing the risks to acceptable or
tolerable zones.
The Imperial Sugar refinery is one of the largest sugar refineries and packaging
complexes in the United States. The refinery, as described in the investigation report
of the US Chemical Safety Board (CSB, 2009), consists of three granulated sugar
storage silos (32-m tall and 12.2 m in diameter), a Bosch packing building (for
granulated sugar, packaging machines and packaging supplies), a south packing
building (housing different kinds of manufactured sugar), and other facilities. The
buildings are connected to each other by a complex transportation system that consists
of aero belts, packed elevators, screw conveyors and conveyor belts. Granulated sugar
from the refinery enters Silo no. 3 and is then transported to Silos no. 1 and no. 2 for
special processing (e.g., converting sugar to powdered sugar) and packaging
procedures (CSB, 2009).
3.1 Explosion causes
Prior to the explosion at the Imperial Sugar refinery, the transportation system and
hammer mills produced airborne sugar in the work areas, and the undersized dust
collection system failed to decrease the concentration levels of the dust clouds.
Furthermore, workers had used compressed air to clean the packaging machines. Over
time, thick layers of sugar dust accumulated on elevated surfaces and in narrow
places, in addition to the spilled sugar that built up unnoticed in crevices around the
machines (CSB, 2009). In 2007, the company covered the conveyor belts with
stainless steel panels to protect the sugar from contamination during the
manufacturing process. However, with the movement of the belts and the absence of
any kind of ventilation system inside the enclosure, the sugar dust concentration

3
increased until it surpassed the minimum explosible concentration, MEC (CSB, 2009).
3.2 Explosion event
On February 7, 2008, an unknown ignition source inside the enclosed conveyor belts
contacted the airborne dust, which was within the explosible concentration range, and
a dust explosion took place in the packing building under the silos. The resulting
shock waves sent settled dust throughout the refinery into the air, and resulted in a
secondary dust explosion, which caused a fire and the complete destruction of the
refinery. The explosion killed 14 workers and injured 36 (CSB, 2009). Table 1
summarizes the fatalities, injuries and number of workers on each floor of the refinery.
The total number of workers at the refinery on the night of the accident was 135. All
of the deceased were killed from injuries sustained from the structural damage or from
severe burns (CSB, 2009).
Table 1 Injured, deceased and uninjured workers in the Imperial Sugar refinery explosion.
Floor
No.
Injured
No.
Deceased Uninjured
No.
Total Affected
(%)
Total No.
of
Workers
In
Hospital
On
Site %
1st 8 2 - 6.5 21 32 31
2nd
0 1 2 17 15 17 18
3rd
15 1 1 5 22 44 39
4th
13 2 5 15 27 43 47
Total 36 6 8 10 85 37 135
3.3 Applying the QRMF to the Imperial Sugar refinery
The brief descriptions above clearly show that the Imperial Sugar refinery lacked
effective risk management and the knowledge of how to deal with dust hazards. Use
of this case study shows the effectiveness of the QRMF in reducing the risk of
explosion. The following sections describe the framework steps as applied to the
Imperial sugar refinery incident.
3.3.1 Identify hazard
The CSB (2009) report identified the hazardous material as icing and granulated sugar
dust. Therefore, sugar explosibility characteristics have been determined
experimentally as shown in Table 2, using a Siwek 20-L chamber.
In Table 2, Pm is the maximum explosion pressure (overpressure) and (dP/dt)m is the
maximum rate of pressure rise, each for a given test at a specified concentration.
3.3.2 Understand hazard
The CSB investigators’ scenario was simulated by DESC to find the explosion
pressure (severity of consequences) inside the refinery’s work areas. The probability
of occurrence was determined by FTA (Fault Tree Analysis) using Relex software.
The risk calculations and evaluation are explained in detail in the following sections.

4
Table 2 20-L explosibility data for icing sugar powder.
Concentration
[g/m3]
Pm
[bar(g)]
(dP/dt)m
[bar/s]
125 2.2 51
250 4.3 71
500 6.7 210
750 7.2 344
1000 7.0 305
1250 6.6 237
1500 6.1 166
i) Consequence analysis
DESC simulation
As some details, such as the exact locations of the workers, machines and various
structures at the moment of the explosion, are not available, they are simulated on a
‘best estimate’ basis. Likewise, as the destructive static pressure values of the building
walls and windows are also not available, a fixed value is given for each item. In the
built geometry of DESC, the wall destruction has been simulated as gates (openings)
in the walls. Figure 1 shows some of these gates as groups. Additionally, there are
single gates on the bottom tunnel, at each side of the vertical riser tunnel, and on the
upper tunnel. The gates have been covered by pressure relief panels (PP1 – PP58),
which open at a certain pressure.
Figure 2 shows a side view of the working floors as well as module distribution in the
Imperial Sugar refinery geometry. Research shows that a static overpressure value
Figure 1 CASD image (3D front view) of the refinery with pressure relief panels (PPs).
Pressure relief panels
Group 1
Group 2
Group 3
Group 4

5
Figure 2 Side view of module distribution in the refinery geometry.
ranging from 7 to 70 kPa can cause complete unit destruction (Cozzani & Salzano,
2004). Therefore, the pressure panels were adjusted to be within the destructive
overpressure at 10, 20, and 30 kPa to represent different strengths of the wall
components, as represented in Table 3.
DESC pressure monitoring points (M1 to M80) have been distributed in the building.
In the fuel file prepared from the icing sugar data (Table 2), dust concentration was
500 g/m3 and the ignition energy was 10 kJ.
Table 3 Opening pressure values of pressure panels and their sizes in the refinery.
Pressure
Panel No.
Opening Pressure
( kPa )
Size
( m2 )
PP1 – PP4
P58
P57
30
30
30
68
85
20
PP5 – PP8
PP53 – PP56
30
30
25
20
PP9 – PP12 30 40
Group 1 20 84
Group 2 30 84
Group 3 20 84
Group 4 20 84
Group 5 10 84
Group 6 20 112
Group 7 30 294
Module (1,1)
Module 1,2) Module (1,3)
Module (3,1)
Module (3,2)
Module (3,3)
Module
(2,1)
Module
(2,2)
Module
(2,3)
Module (2,4)

6
Structural damage
No one was killed in the refinery from the explosion impact or explosion shock waves.
However, four workers were fatally burned when trapped under the falling floor, four
workers died at the scene when surrounded by fire and were unable to escape, six
workers died at the hospital due to serious burns, and 36 workers had various kinds of
injuries (13 were severely injured and 23 had minor injuries); 85 workers remained
uninjured during the incident (CSB, 2009). Nevertheless, the dramatic explosions,
numerous fatalities and extensive damage prompted widespread reports of the
accident.
Using the Probit equation (1), the damage that occurred as a result of the maximum
pressure obtained from the DESC simulations can be estimated.
(1)
Figures 3 – 6 show top views of the working floors. DESC pressure simulations of
each work area revealed that the maximum explosion pressure (Pmax) reached inside
the areas during the simulation was 25 kPa, which was reached at 2.6 s of the
simulation. The top-views shown in Figures 3 – 6 define the pressure distribution at
each floor. The areas are bounded with contour lines to designate various pressure
zones (A – R). Each zone has a different color to indicate pressure magnitude.
Figure 3 DESC pressure simulation from a plane view of the first floor, Module (2,1) of the
Imperial Sugar refinery explosion.
Figures 7 – 10 illustrate the development of the explosion pressure, measured at the
monitor points (M1 – M67), with respect to time on each floor. Figure 7 shows two
explosion pressure peaks, which represent the primary explosion pressure inside the
A
B
D
C

7
Figure 4 DESC pressure simulation from a plane view of the second floor, Module (2,2) of
the Imperial Sugar refinery explosion.
Figure 5 DESC pressure simulation from a plane view of the third floor, Module (2,3) of the
Imperial Sugar refinery explosion.
enclosure and the secondary explosion pressure on the first floor, respectively. At 1.2
s, the explosion pressure in the enclosure reached 0.3 bar(g) (30 kPa), which is the
adjusted relief pressure of the vents that represent the enclosure wall strength. Then,
the pressure suddenly decreased to nearly 0 bar(g) because the pressure had been
released into the refinery’s first floor area, which was much larger than the enclosure.
Shortly thereafter, at 1.7 s, the secondary explosion started as a result of the pre-
E
F
G
H
I
K
L
J
M

8
Figure 6 DESC pressure simulation from a plane view of the fourth floor, Module (2,4) of the
Imperial Sugar refinery explosion.
explosion conditions existing on the first floor. An ignition flame from the primary
explosion took effect. The secondary explosion pressure then increased until it reached
0.2 bar(g), which was the panel opening pressure on the refinery walls. The pressure
continued to increase for a few ms longer, reaching 0.25 bar(g) at 2.4 s, as the
explosion pressure rate was significantly higher than the pressure release rate
(venting). Then, the pressure curve dropped off rapidly when the pressure was fully
released. At 3.1 s, the pressure fluctuated for a few seconds (due to some remaining
N
O
R
P
Q
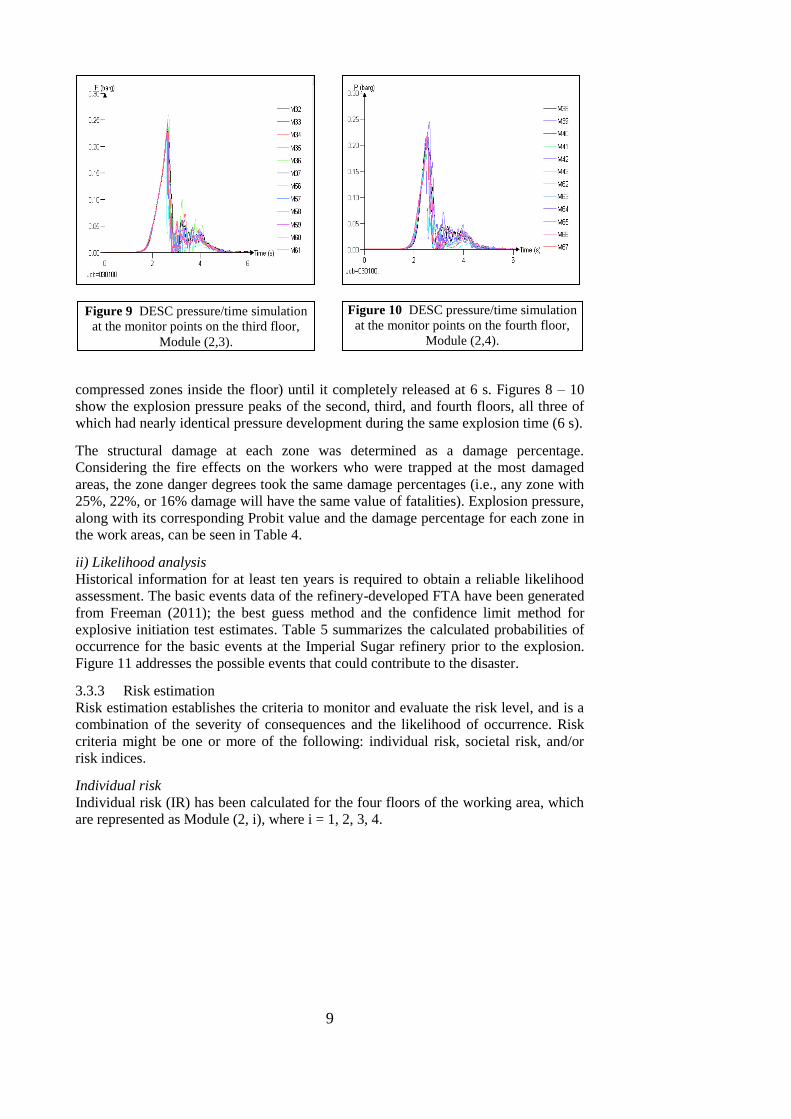
Figure 7 DESC pressure/time simulation
at the monitor points on the first floor,
Module (2,1).
Figure 8 DESC pressure/time simulation
at the monitor points on the second floor,
Module (2,2).
9
compressed zones inside the floor) until it completely released at 6 s. Figures 8 – 10
show the explosion pressure peaks of the second, third, and fourth floors, all three of
which had nearly identical pressure development during the same explosion time (6 s).
The structural damage at each zone was determined as a damage percentage.
Considering the fire effects on the workers who were trapped at the most damaged
areas, the zone danger degrees took the same damage percentages (i.e., any zone with
25%, 22%, or 16% damage will have the same value of fatalities). Explosion pressure,
along with its corresponding Probit value and the damage percentage for each zone in
the work areas, can be seen in Table 4.
ii) Likelihood analysis
Historical information for at least ten years is required to obtain a reliable likelihood
assessment. The basic events data of the refinery-developed FTA have been generated
from Freeman (2011); the best guess method and the confidence limit method for
explosive initiation test estimates. Table 5 summarizes the calculated probabilities of
occurrence for the basic events at the Imperial Sugar refinery prior to the explosion.
Figure 11 addresses the possible events that could contribute to the disaster.
3.3.3 Risk estimation
Risk estimation establishes the criteria to monitor and evaluate the risk level, and is a
combination of the severity of consequences and the likelihood of occurrence. Risk
criteria might be one or more of the following: individual risk, societal risk, and/or
risk indices.
Individual risk
Individual risk (IR) has been calculated for the four floors of the working area, which
are represented as Module (2, i), where i = 1, 2, 3, 4.
Figure 9 DESC pressure/time simulation
at the monitor points on the third floor,
Module (2,3).
Figure 10 DESC pressure/time simulation
at the monitor points on the fourth floor,
Module (2,4).

10
Table 4 Estimated Probit damage percentages caused by explosion overpressure of incident
outcome cases.
Incident
Outcome Case
Pmax
[bar(g)] Y
Damage Percentage
(%)
A 0.22 5.39 65
B 0.25 5.77 78
C 0.23 5.52 70
D 0.16 4.47 30
E 0.25 5.77 78
F 0.22 5.39 65
G 0.16 4.47 30
H 0.16 4.47 30
I 0.10 3.10 03
J 0.22 5.39 65
K 0.25 5.77 78
L 0.16 4.47 30
N 0.22 5.39 65
O 0.25 5.77 78
P 0.16 4.47 30
Q 0.04 0.42 0
R 0.07 2.06 01
The fault tree calculations find the probability (P) of the Imperial Sugar refinery
incident as 3.76 * 10-2
per year. The probability has been assumed to be the same for
all four floors. The following risk estimation measures show the quantitative risk
values in the work areas.
Table 6 shows the frequency of incident outcome at case (fi), probability of fatality
(Pf,i), total risk (fi * Pf,i), number of workers, and estimated number of fatalities (N) (N
= Pf,i * No. of workers) at each defined explosion pressure zone (A – R). The average
individual risk in the exposed population ( ) is determined from equation (2)
(CCPS, 2000).
∑
∑
where: = individual risk at location x,y ( =
= frequency of incident outcome, case (
= probability of fatality, case
= number of people at location .
Location-specific individual risk (LSIR ) ∑ (3)
Individual – specific individual risk (ISIR) (4)
where: = proportion of time an individual spends in a location.

11
Table 5 Failure rates of the explosion basic events at the Imperial Sugar refinery.
Fatal accident rate (FAR) = ⁄ = (Fatalities/108 hours of exposure) (5)
where: = hours of work per year.
Table 7 tabulates the risk calculation results of the above risk measures for the
Imperial sugar refinery explosion. 3.3.4 Identify units and unsafe procedures that could contribute significantly to
probability of top event
the new stainless steel panels that covered the conveyor belts below the tall silos,
using compressed air to clean the packaging machines,
spilled sugar around the working machines, and
insufficient pressure relief vents to release explosion pressure safely.
No. Event
(Gate) Basic Event
Failure Rate
( ) Probability
1
Imp
eria
l S
ug
ar d
ust
exp
losi
on
(AN
D)
Du
st c
lou
d
(AN
D)
Mix
ing
(OR
)
Bagging and filling / FIBCs 0.033 0.0325
2 Dust collecting receivers 0.067 0.065
3
Tra
nsf
er
(OR
)
Silos and bins 0.033 0.0325
4 Cartridge 0.033 0.0325
5 Bag houses 0.033 0.0325
6 Others - 0.0010
7
Tra
nsp
ort
(OR
)
Belt conveyors - 0.2500
8 Elevators - 0.2500
9 Screw conveyors - 0.2500
10 Others - 0.0010
11 Shock waves 0.067 0.0650
12 Others - 0.0010
13
Fu
el
(AN
D)
Combustible material - 0.9900
14 Concentration > MEC - 0.9900
15 Particle size < non-explosible
diameter - 0.2500
16 Oxidant concentration > LOC - 0.8000
17
Ign
itio
n s
ourc
e
(OR
)
Mechanical impact sparks - 0.0650
18 Friction sparks - 0. 0650
19 Flames and direct heat 0.067 0.0650
20 Electrical sparks 0.067 0.0650
21 Static electricity 0.067 0.0650
22 Others - 0.0010
23 Total confinement - 0.9900

12
Figure 11 Fault Tree Analysis flowchart of
the Imperial Sugar refinery explosion.

13
Table 6 Estimated number of fatalities for each incident outcome case.
Incident
Outcome Case
fi
(per year) Pf,i fi * Pf,i
No. of
Workers
Estimated No. of
Fatalities (N)
A 3.764 * 10-2
0.65 2.45 * 10-2
15 10
B 3.764 * 10-2
0.78 2.94 * 10-2
6 5
C 3.764 * 10-2
0.70 2.63 * 10-2
6 4
D 3.764 * 10-2
0.30 1.13 * 10-2
4 1
E 3.764 * 10-2
0.78 2.94 * 10-2
4 3
F 3.764 * 10-2
0.65 2.45 * 10-2
2 1
G 3.764 * 10-2
0.30 1.13 * 10-2
1 0
H 3.764 * 10-2
0.30 1.13 * 10-2
8 2
I 3.764 * 10-2
0.03 1.13 * 10-3
3 0
J 3.764 * 10-2
0.65 2.45 * 10-2
21 14
K 3.764 * 10-2
0.78 2.94 * 10-2
12 9
L 3.764 * 10-2
0.30 1.13 * 10-2
4 1
M 3.764 * 10-2
0.78 2.94 * 10-2
2 2
N 3.764 * 10-2
0.22 8.28 * 10-3
5 1
O 3.764 * 10-2
0.25 9.41 * 10-3
10 3
P 3.764 * 10-2
0.16 6.02 * 10-3
25 4
Q 3.764 * 10-2
0.04 1.51 * 10-3
3 0
R 3.764 * 10-2
0.07 2.63 * 10-3
4 0
Table 7 Summary of risk measure results for the Imperial Sugar refinery explosion before
applying the QRMF.
0.023 0.015 0.025 0.0064 0.016 0.29 36
3.3.5 Apply the risk controls
Responding to the identified units and incorrect actions, the QRMF controls should be
applied to minimize the risk to be at least tolerable.
i) Inherent Safety
Inherent safety principles have been applied in the recommended sequence to control
the expected main causes of the Imperial Sugar refinery explosion, as seen in Table 8.
ii) Engineered Safety
- Passive engineered safety: Add sufficient explosion relief vents that can open to
release sudden explosion pressure.
- Active engineered safety: Add an automatic explosion suppression system.
iii) Procedural Safety
If any modification has been applied to the process units or to the work area cleaning
procedures, review the procedure for the entire refinery design. Review and apply

14
Table 8 Applying inherent safety principles on the units, and wrong actions that
contributed to the Imperial Sugar refinery explosion.
Units or Actions
Contributing to
Explosion Event
Inherent
Safety
Principle
Action
Spilled sugar
around the working
machines
Minimization
- Good housekeeping (dust removal/cleaning) to mitigate
secondary dust explosions and/or prevent primary dust
explosion.
- Keep dust concentrations outside explosible range
(Amyotte & Eckhoff, 2010).
New stainless steel
panels to cover the
conveyor belts
below the tall silos
Simplification
Reduce opportunities for errors by eliminating excessive
add-on safety features and protective devices (Amyotte
et al., 2009) by removing the new stainless steel panels
that cover the conveyor belts below the tall silos.
Using compressed
air to clean the
packaging machines
Substitution
Replace the hazardous cleaning procedure (using
compressed air to clean the packaging machines) with
one that is less hazardous.
certain safety maintenance procedures to reduce any possible ignition source. Also,
review, revise, create, and apply safety procedures for emergency plans and periodic
training procedures regarding safety issues for workers.
3.3.6 Understand the residual hazard
i) Consequence analysis
DESC simulation
Based on the risk controls detailed above, new DESC simulations were run on the
refinery geometry. The simulation parameters that were changed to achieve safer
operations include removal of the steel enclosure, Module (1,1). Module (1,2) and
Module (1,3) pressure panels were unchanged because they cover the transportation
system outside the building. However, pressure panels in groups 1, 3, 4, 5, and 7 were
adjusted to open at 0.05 bar(g) (5 kPa).
The new simulations indicated that the pressure panels shown in Table 3 at the
adjusted opening pressure, are able to release any explosion pressure inside the
refinery before it causes significant damage. Also, the dust concentration in the DESC
simulations was adjusted to 250 g/m3, which can be achieved by applying the inherent
safety principle of minimization (i.e., good housekeeping).
The various colors in Figures 12 – 15 demonstrate the maximum explosion pressure
reached during the DESC simulations. The simulations show that the pressure
distribution is relatively uniform inside the buildings during the explosion. However,
when the venting relief pressure value is reached, different pressure areas arise,
indicated by different shapes and colors. These areas are the consequence of both
pressure release and explosion reaction continuation.

15
Explosion pressure, the corresponding Probit value, and the damage percentage for
each zone are presented in Table 10, which shows that no damage occurred after the
risk controls were applied. This clearly indicates the framework’s validity in assessing
and reducing the potential impact of dust and hybrid mixture explosions.
Figure 12 DESC pressure simulation from plane view of the first floor, Module (2,1), of the
Imperial Sugar refinery explosion (after applying the QRMF).
Figure 13 DESC pressure simulation from plane view of the second floor, Module (2,2), of
the Imperial Sugar refinery explosion (after applying the QRMF).
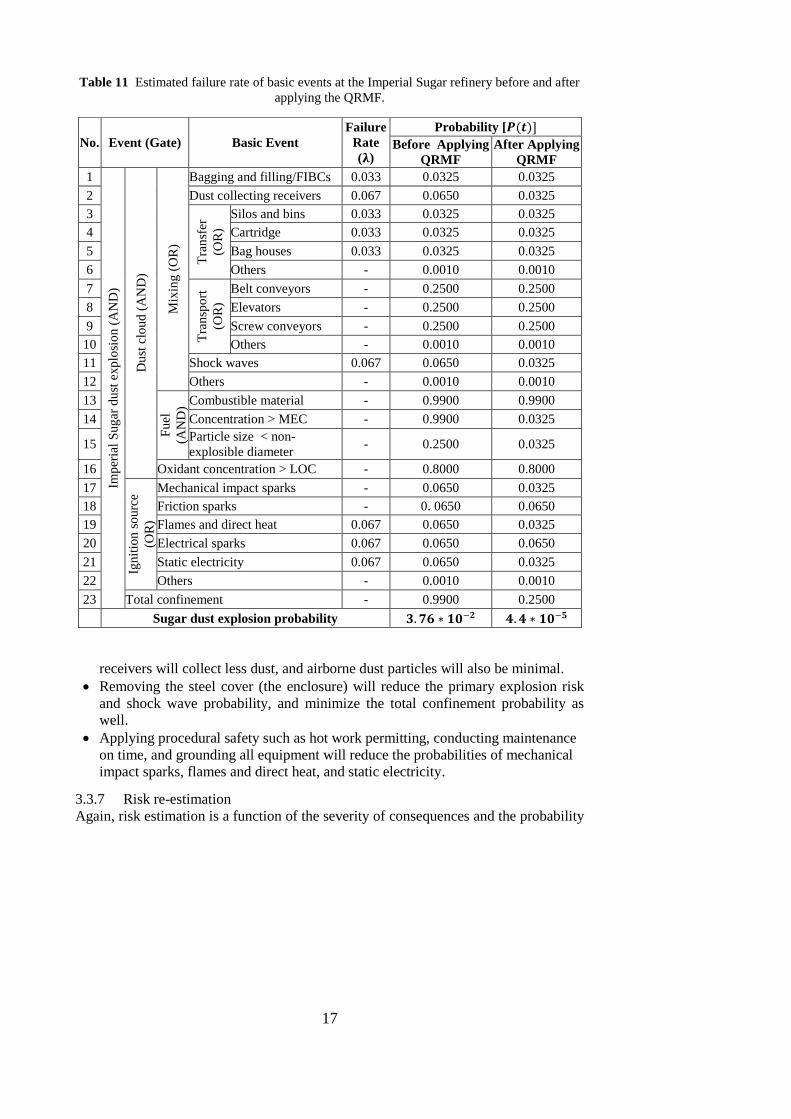
ii) Likelihood analysis
Table 11 compares the probabilities of occurrence of the basic events of the Imperial
Sugar refinery explosion before and after applying the QRMF. Some of the basic
events in the Imperial Sugar fault tree flowchart (Figure 11) have been recalculated to
address the applied safety controls. The modified basic events were generated
according to the following reasoning:
If the dust concentration probability is minimized to 0.0325, the dust collection
A
B
C
D

16
Figure 14 DESC pressure simulation from plane view of the third floor, Module (2,3), of the
Imperial Sugar refinery explosion (after applying the QRMF).
Figure 15 DESC pressure simulation from plane view of the fourth floor, Module (2,4), of the
Imperial Sugar refinery explosion (after applying the QRMF). Table 10 Estimated Probit damage percentages caused by explosion overpressure of incident
outcome cases in the simulated refinery.
Incident
Outcome Case
Pmax
[bar(g)] Y
Damage
Percentage (%)
A 0.055 1.35 0
B 0.060 1.60 0
C 0.060 1.60 0
D 0.055 1.35 0
E 0.060 1.60 0
F 0.055 1.35 0
G 0.040 0.42 0
H 0.030 0 0
I 0.020 0 0
J 0.015 0 0
E
F
G
H
I
J
17
Table 11 Estimated failure rate of basic events at the Imperial Sugar refinery before and after
applying the QRMF.
receivers will collect less dust, and airborne dust particles will also be minimal.
Removing the steel cover (the enclosure) will reduce the primary explosion risk
and shock wave probability, and minimize the total confinement probability as
well.
Applying procedural safety such as hot work permitting, conducting maintenance
on time, and grounding all equipment will reduce the probabilities of mechanical
impact sparks, flames and direct heat, and static electricity.
3.3.7 Risk re-estimation
Again, risk estimation is a function of the severity of consequences and the probability
No. Event (Gate) Basic Event
Failure
Rate
( )
Probability [
Before Applying
QRMF
After Applying
QRMF
1
Imp
eria
l S
ug
ar d
ust
exp
losi
on
(A
ND
)
Du
st c
lou
d (
AN
D)
Mix
ing
(O
R)
Bagging and filling/FIBCs 0.033 0.0325 0.0325
2 Dust collecting receivers 0.067 0.0650 0.0325
3 T
ran
sfer
(OR
) Silos and bins 0.033 0.0325 0.0325
4 Cartridge 0.033 0.0325 0.0325
5 Bag houses 0.033 0.0325 0.0325
6 Others - 0.0010 0.0010
7
Tra
nsp
ort
(OR
)
Belt conveyors - 0.2500 0.2500
8 Elevators - 0.2500 0.2500
9 Screw conveyors - 0.2500 0.2500
10 Others - 0.0010 0.0010
11 Shock waves 0.067 0.0650 0.0325
12 Others - 0.0010 0.0010
13
Fu
el
(AN
D)
Combustible material - 0.9900 0.9900
14 Concentration > MEC - 0.9900 0.0325
15 Particle size < non-
explosible diameter - 0.2500 0.0325
16 Oxidant concentration > LOC - 0.8000 0.8000
17
Ign
itio
n s
ourc
e
(OR
)
Mechanical impact sparks - 0.0650 0.0325
18 Friction sparks - 0. 0650 0.0650
19 Flames and direct heat 0.067 0.0650 0.0325
20 Electrical sparks 0.067 0.0650 0.0650
21 Static electricity 0.067 0.0650 0.0325
22 Others - 0.0010 0.0010
23 Total confinement - 0.9900 0.2500
Sugar dust explosion probability

18
of occurrence. As Table 10 shows, no damage occurred after the QRMF was applied,
and thus the risk estimation will equal zero. Individual and societal risks are likewise
zero.
The probability of occurrence is also very low, at . This means that
a dust explosion might occur once every 22,727 years, which is an acceptable risk.
ALARP
As shown in Figure 16, and according to the HSE (UK Health and Safety Executive),
ALARP (as low as reasonably practicable) ranges from /year
to /year, and the acceptable risk to the public per year is in the region of to
(Mannan, 2005). Therefore, the value of /year, which is the
individual risk at the Imperial Sugar refinery before applying the conceptual
framework, was within the unacceptable range. However, the individual and societal
risks of the given case study after applying the safety controls are completely
acceptable. These values show a significant reduction of the dust explosion
probability, with the refinery becoming substantially safer with the new applied
controls.
Figure 16 HSE framework for tolerability of risk (after IET, 2010).
Table 12 compares the risk measure results obtained before and after applying the
QRMF controls. The values show that the total risk has been reduced for each single
measure: the probability of occurrence has been reduced, and the consequences have
been prevented, along with the IR, the LSIR, the ISIR, and the FAR, which are
(theoretically) completely removed.
4. CONCLUSION
Development of a safety management protocol is urgently required to protect
industries that involve dust/hybrid mixtures in at least one of their stages. The QRMF
developed by Abuswer et al. (2011) can help prevent and mitigate dust and hybrid

19
Table 12 Summary of the individual risk results for the Imperial Sugar refinery explosion.
Probability of
occurrence
Before applying
QRMF
After applying
QRMF
mixture explosions in the process industries and provide an optimal level of safety and
risk management. This is done by conducting quantitative analysis of both explosion
likelihood and consequences and by applying the hierarchy of controls (inherent,
passive engineered, active engineered and procedural safety).
The presented case study (Imperial Sugar refinery explosion in 2008) has been
selected to examine the developed QRMF. DESC was used to simulate the explosion
scenarios in terms of maximum explosion pressure and FTA was used to estimate
explosion likelihood. The structural damage percentage in each affected zone was
determined by means of the Probit equation approach. Risk estimation was conducted,
both before and after application of the QRMF, with the framework showing clear
potential for significant risk reduction.
ACKNOWLEDGEMENTS
The authors gratefully acknowledge the contributions of the Natural Sciences and
Engineering Research Council of Canada to this research in the form of discovery and
strategic grant support. The assistance provided to M. Abuswer by the Government of
Libya is also acknowledged with gratitude, as is the generous support provided by
GexCon in the use of the DESC software.
REFERENCES Abuswer, M., Amyotte, P. R., & Khan, F. (2011). A quantitative risk management framework
for dust and hybrid mixture explosions, Journal of Loss Prevention in the Process
Industries (2011), doi:10.1016/j.jlp.2011.08.010
Amyotte, P., Kahn, F., & Dastidar, A. G. (2003). Reduce dust explosions the inherently safer
way. Chemical Engineering Progress, 99(10), 36-43.
Amyotte, P. R., & Eckhoff, R. K. (2010). Dust explosion causation, prevention and mitigation:
An overview. Journal of Chemical Health and Safety, 17(1), 15-28.
Amyotte, P. R., Pegg, M. J., & Khan, F. I. (2009). Application of inherent safety principles to
dust explosion prevention and mitigation. Process Safety and Environmental Protection, 87(1),
35-39. doi: 10.1016/j.psep.2008.06.007.
Attwood, D., Khan, F., & Veitch, B. (2006). Offshore oil and gas occupational accidents—
What is important? Journal of Loss Prevention in the Process Industries, 19(5), 386-398.
CCPS. (2000). Guidelines for chemical process quantitative risk analysis. 2nd
Edition ed. NY,
USA: Center for Chemical Process Safety/AIChE.
Cozzani, V., & Salzano, E. (2004). The quantitative assessment of domino effects caused by
overpressure: Part I. Probit models. Journal of Hazardous Materials, 107(3), 67-80.
doi:10.1016/j.jhazmat.2003.09.013

20
CSB. (2009). Imperial sugar company dust explosion and fire. Retrieved from
http://www.csb.gov/investigations/detail.aspx?SID=6
Eckhoff, R. K. (2005). Current status and expected future trends in dust explosion research.
Journal of Loss Prevention in the Process Industries, 18(4-6), 225-237.
Freeman, R. (2011). What to do when nothing has happened. American Institute of Chemical
Engineers, Process Safety Progress, 30(3), 204-211. DOI: 10.1002/prs.10463
Groen, F. J., Smidts, C., & Mosleh, A. (2006). QRAS—the quantitative risk assessment
system. Reliability Engineering & System Safety, 91(3), 292-304.
Institute of Engineering and Technology (IET). (2010). Determining the acceptability of risk.
No. 36. Michael Faraday House, Stevenage, Herts, UK: Health and Safety Policy
Advisory Group Secretary, Institute of Engineering and Technology.
Khan, F. I., & Abbasi, S. A. (1998). MAXCRED – a new software package for rapid risk
assessment in chemical process industries. Environmental Modelling and Software,
14(1), 11-25.
Khan, F. I., & Abbasi, S. A. (2000). TORAP — a new tool for conducting rapid risk-
assessments in petroleum refineries and petrochemical industries. Applied Energy, 65(1-
4), 187-210.
Khan, F., I., Iqbal, A., Ramesh, N., & Abbasi, S. A. (2001). SCAP: A new methodology for
safety management based on feedback from credible accident-probabilistic fault tree
analysis system. Journal of Hazardous Materials, 87(1-3), 23-56.
Mannan, S. (2005). Lees' loss prevention in the process industries, volume 1 (3rd Edition ed.).
USA: Elsevier.
Markowski, A. S. (2007). exLOPA for explosion risks assessment. Journal of Hazardous
Materials, 142(3), 669-676.
Skjold, T. (2007). Review of the DESC project. Journal of Loss Prevention in the Process
Industries, 20(4-6), 291-302.
van der Voort, M. M., Klein, A. J. J., deMaaijer, M., van den Berg, A. C., van Deursen, J. R.,
& Versloot, N. H. A. (2007). A quantitative risk assessment tool for the external safety of
industrial plants with a dust explosion hazard. Journal of Loss Prevention in the Process
Industries, 20(4-6), 375-386.