Embed Size (px)
Citation preview
1
Quantitative Risk Analysis of Linear Infrastructure on Permafrost: Arquluk Project Report
H. Brooks, PE
November 2015
1 Problem
Significant areas of northern Canada, including communities and business interests, and
their infrastructure, are underlain by permafrost. Also, business interests for oil and gas
exploration, and mining activities are increasing in the north (Allard et al. 2012).
Additionally, the terrestrial and/or aerial transportation infrastructure is the only, or a
significant piece of, infrastructure supporting communities and development in these
areas. Thus, the impacts of failing infrastructure can be significant and include higher
maintenance costs, performance reductions, and loss or decrease in capacity. Other less
tangible impacts include the decrease of quality of life and the increase in health and safety
risk.
Infrastructure constructed in permafrost areas was and is designed to meet the needs
of the communities and industries, which it connects. The designs are based on the site
conditions expected and the climatic conditions along the alignment, in order to preserve
the permafrost foundation soils supporting the embankment (TCCRE 1996). However,
existing infrastructure is increasingly exposed to climate conditions, which may be warmer
than the infrastructure’s design conditions, leading to increasing maintenance and likely
increased risk and hazards, due to thawing (BCG Engineering, Inc. 2011).
Risk analyses, quantitative or qualitative, are used as a decision tool to design and
manage monies for linear infrastructure. A quantitative risk analysis is conducted by
calculating the probability of failure (P) and the consequences of that failure (C), and
multiplying P and C to determine the risk (R) for each for the analyzed failure mode or
hazard (Baecher and Christian 2003). However, this analysis must be repeated for each of
the expected hazards and all hazards must be identified.
2
Based on a review of the literature of case studies of embankment infrastructure on
permafrost, some of the common problems observed consist of the following:
subsidence, lateral spreading and heaving in areas where subgrade conditions transition from bedrock to ice-rich permafrost or where the new roadway alignment crossed previous alignments (BGC Engineering, Inc. 2011, Lingnau 1985),
settlement and transverse cracking at culvert locations (BGC Engineering, Inc. 2011),
road surface and embankment stability problems in sections adjacent to pooled water in drainage ditches or near creek crossings with bridges or large culverts (BGC Engineering, Inc. 2011),
changed or damaged culvert gradients (BGC Engineering, Inc. 2011), and collapse of “small culverts” in fill sections grater than 5 meters in height (Lingnau
1985).
However, these problems are largely localized to the embankment structure. Additional
problems can impact the roadway from the surrounding area, including:
creep settlement, due to warm permafrost temperatures (M-Lepage, Doré, and Burn 2014),
thermal erosion, due to drainage conditions (M-Lepage, Doré, and Burn 2014), karsting, due to melting of subsurface ice (M-Lepage, Doré, and Burn 2014, Allard
2013), and active layer detachment landslides, due to increased thaw depth (M-Lepage, Doré,
and Burn 2014, Boucher et al. 2012, Trimble 2013).
Additionally, a fatality occurred on the Dempster Highway in North-West Territories
(NWT) in the fall of 1985. Hayley and Bowen (1987) noted “an unfortunate combination of
warm air temperatures, soil temperatures and wheel loading, ultimately resulted in
collapse of the road surface, causing the accident and fatality.”
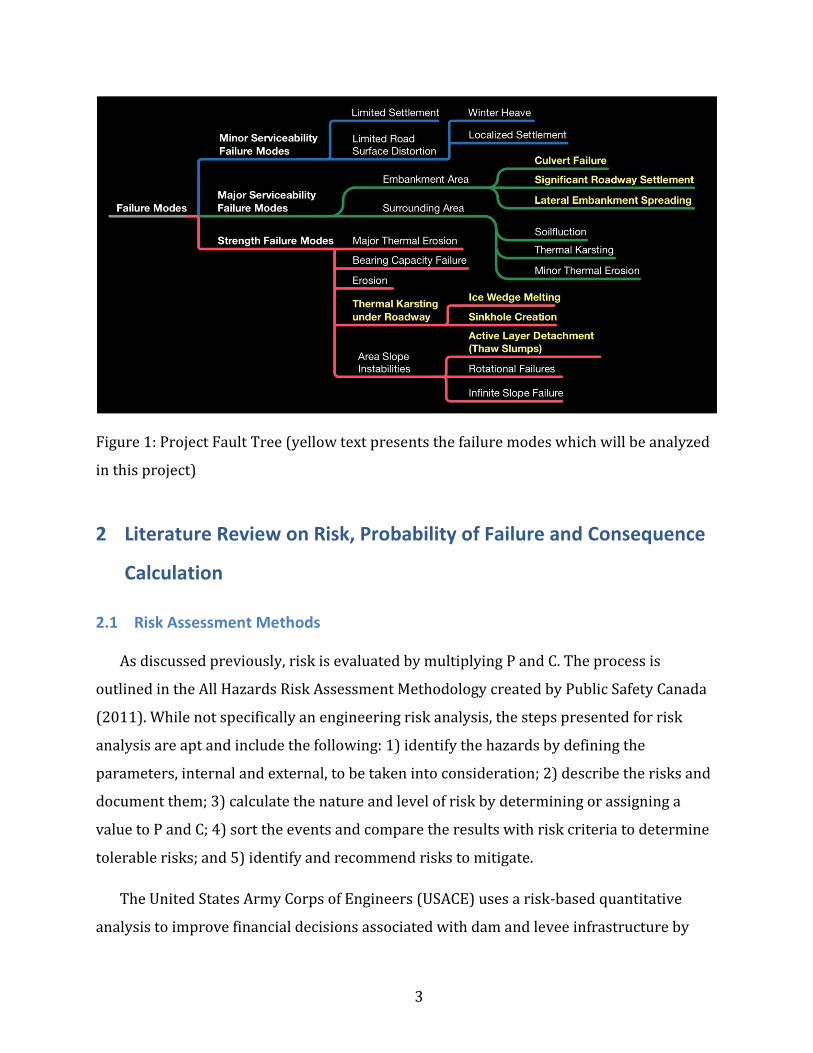
Based on the failure modes observed in the literature, a fault tree for embankments on
permafrost is presented in Figure 1. Since the time allotted for the project is limited, the
project will focus on the failure modes highlighted in yellow. If additional failure modes are
known or are of enough importance to be addressed in the project, please contact the
project team.
3
Figure 1: Project Fault Tree (yellow text presents the failure modes which will be analyzed
in this project)
2 Literature Review on Risk, Probability of Failure and Consequence
Calculation
2.1 Risk Assessment Methods
As discussed previously, risk is evaluated by multiplying P and C. The process is
outlined in the All Hazards Risk Assessment Methodology created by Public Safety Canada
(2011). While not specifically an engineering risk analysis, the steps presented for risk
analysis are apt and include the following: 1) identify the hazards by defining the
parameters, internal and external, to be taken into consideration; 2) describe the risks and
document them; 3) calculate the nature and level of risk by determining or assigning a
value to P and C; 4) sort the events and compare the results with risk criteria to determine
tolerable risks; and 5) identify and recommend risks to mitigate.
The United States Army Corps of Engineers (USACE) uses a risk-based quantitative
analysis to improve financial decisions associated with dam and levee infrastructure by
4
creating an unbiased decision tool in support of planning studies. In order to characterize
and identify the risk events, the method utilizes an event tree, in which each node is an
event with two or more mutually exclusive braches, each with an assigned or calculated
probability of occurrence. The probability of a specific event’s occurrence is determined by
multiplying the probability of occurrence for all of the preceding events along the path of
the event tree (USACE 1999, Baecher and Christian 2003). This USACE guide is largely used
to analyze dam and levee infrastructure, where progressive failures can be of greatest
concern and the P has been determined based on past occurrences. However, the method
recommends First Order Second Moment (FOSM) methods or Monte Carlo simulation for
probability of occurrence calculation in the absence of past data (USACE 1999, Vick 2002).
The Public Infrastructure Engineering Vulnerability Committee (PIEVC) has created,
and validated via cased studies, a standardized protocol for use by engineering
professionals to assess infrastructure vulnerability to climate change (PIEVC 2009). In this
case, vulnerability is defined as “the degree to which a system is susceptible to or unable to
cope with, adverse effects of climate change, including climate variability and extremes,”
and risk is a value that characterizes vulnerability (Engineers Canada 2011). The possible
failure modes are paired with possible impacts from climate change, and each pairing is
analyzed using standard tables presenting P and C. The protocol can be either qualitative or
quantitative, depending on the assessor’s engineering judgment of the available data, and
scheduling and budgetary constraints (PIEVC 2009).
2.2 Permafrost Infrastructure Vulnerability – Case Study
A case study to test the PIEVC methodology was completed to analyze the vulnerability
of a 100 km section of Hwy 3 near Yellowknife, NWT. The highway consists of a gravel
embankment with Bituminous Surface Treatment (BST) over discontinuous permafrost.
The highway was recently reconstructed and the highway was “designed in anticipation
that the permafrost will be sustained to the greatest extent possible… over a 20 year
timeframe” (Arenson 2013). The focus of the project was to determine, how climate change
may impact the highway (BGC Engineering, Inc. 2011). Using the protocol, the analysis
team assessed “more than 1,100 highway infrastructure element-climate change” pairings.
5
The team used the qualitative analysis procedure due to insufficient information (BGC
Engineering, Inc. 2011). The qualitative analysis analyzed the geotechnical subgrade
conditions by classifying them into 5 categories based on the typical subsurface conditions
in the study area and Hwy 3 maintenance records were not “recorded in a structured
format, and therefore, only limited and anecdotal information” was available.
Based on the analysis, the highest risks generally included thermally sensitive
(temperatures near 0°C) ice-rich subgrade soils, and drainage systems sensitive to
changing rainfall conditions. However, five climate properties were generally associated
with the highest risk events. These include “ground and water temperature, average daily
air temperature, thawing index and the number of freeze/thaw cycles” (BGC Engineering,
Inc. 2011). Additional action was suggested to gather further climate data, investigate
subgrade soil conditions, project infrastructure capacity, and analyze operation and
maintenance records (BGC Engineering, Inc. 2011).
Additionally, Arenson (2013) noted that the PIEVC protocol helped identify critical
elements and data gaps need for the analysis. It was also noted that a 100 km section of
highway is a challenging infrastructure to be assessed in a two dimensional matrix (1:
infrastructure element, 2: climate condition). Arenson (2013) recommended the analysis
“include a third dimension in the risk matrix for linear infrastructure on heterogeneous
conditions to identify critical sections.” The “third dimension” in Arenson’s discussion was
to look at the combination of (1) infrastructure element, (2) climate condition, and (3)
subsurface conditions. The subsurface conditions, physical and thermal, vary considerably
in permafrost areas. To accurately identify critical sections, one must consider all the
physical conditions of the infrastructure and specifically incorporate the subsurface
conditions, as the thermal and soil conditions are the greatest driver of failure modes in
permafrost environments.
2.3 Probability of Failure Calculation
To perform a quantitative risk assessment, one must calculate P. This can be completed
two ways: 1) from past occurrence, or 2) using reliability calculations to analyze input
parameter uncertainty compared to a failure point (Duncan 2000, Banerjee and Datta
6
1991). Since little information is available for failure frequencies in permafrost
environments, the second calculation method can be used in permafrost environments.
This second methodology requires that one look at the statistical methods available for
calculating P beginning with the individual parameter uncertainty before aggregating the
uncertainty from multiple parameters in a calculation method. This discussion is presented
in further detail in Brooks, Doré and Lemieux (2015).
2.3.1 Variable Uncertainty
Uncertainty can be categorized into two types, that due to natural variation (aleatory)
and that due to systematic error (epistemic) (Baecher and Christian 2003). Vick (2002)
presented a very good metaphor for aleatory and epistemic uncertainty: “One never rolls
aleatory dice without epistemically believing they aren’t loaded.” Generally, epistemic
uncertainty may be reduced or quantified with the collection of further data, or better
theories or models (Vick 2002, Baecher and Christian 2003). Both types of uncertainty are
present within geotechnical engineering.
If a statistical analysis is performed, the evaluation of the data, the selection of a model
to represent the data, and the difference between the model and reality combine to form
the epistemic uncertainty in the analysis. However, these uncertainties may be based on
decisions made using engineering judgment, such as the layer boundaries used to
determine properties of different strata and borehole and sampling locations, introducing
human bias that can be difficult or impossible to measure (Lacasse and Nadim 1996, Vick
2002).
2.4 Reliability Analysis
New analysis methods have been developed to determine the reliability of FOS and
engineering calculations. These analysis methods utilize 1) input parameter uncertainty to
calculate P for an engineering calculation, and 2) in-depth statistical analysis to determine
P in relation to a critical value. Reliability is defined as the probability of success or unity
minus the probability of failure (Duncan 2000). In some engineering calculations, the
reliability index (β) is used as a measure of reliability, where the reliability index is the
mean value divided by the standard deviation of the parameter of factor of safety (FOS)
7
(Baecher and Christian 2003). Thus, the higher the reliability index, the less the
uncertainty.
2.4.1 Aleatory Uncertainty Analysis
Duncan (2000) proposes utilizing a Taylor series calculation method to determine the
FOS reliability. To use this method, each input parameter within the engineering
calculation requires a most likely value (mean) and a standard deviation. The mean value
for all parameters is used to determine the most likely FOS. The FOS variation is then
calculated by evaluating the FOS at the highest and lowest likely value of each parameter
(calculated by adding and subtracting the parameter’s standard deviation from its mean).
The difference between the two calculated FOS’s for each parameter are determined. The
mean and the standard deviation of the FOS difference for each parameter are calculated.
Using these and the most likely FOS, a reliability index can be determined and from that P,
with the assumption of a common PDF for the FOS. In this paper, Duncan (2000) uses the
lognormal reliability index and the normal distribution to determine P.
Due to the large amounts of statistical data required to accurately calculate the mean
and standard deviation of a parameter, usually more data than is within the scope of an
average geotechnical investigation, Duncan (2000) presents four methods to estimate the
standard deviation; including calculating the standard deviation from a published
coefficient of variation value. However, these published statistical parameters may not be
available for permafrost soils and their specific index and strength properties.
One of the problems in utilizing this method is its focus on only the aleatory
uncertainty. Vick (2002) presented an analysis completed by others researching the model
error and uncertainty in offshore pile design; the model uncertainty “far exceeded the
parameter uncertainty.” He suggests that in cases of extreme model bias, a subjective,
engineering judgment based probability can be used to “quantify” the model’s uncertainty.
However, this type of analysis adds a subjective and potentially inherently biased aspect
into the analysis.
8
2.4.2 Reliability Compared to a Critical Value
In order to include both aleatory and epistemic uncertainty, Banerjee and Datta (1991)
analyzed the reliability of thaw induced pore pressure calculations by Morgenstern and
Nixon (1971). First-order uncertainty analysis of the calculation method was used to
mathematically determine the functions of the total, epistemic and aleatory uncertainty in
the calculation of the excess pore water pressure. Once a total uncertainty function was
determined, the partial derivatives are evaluated with respect to each random variable, and
then each equation is evaluated at the mean value for each variable.
In Morgenstern and Nixon’s (1971) analysis method, the parameter R* denotes the
relationship between the rates of pore water generation and expulsion. Thus, if R* is
greater than unity, there is a potential instability due to excess pore water pressure
generation. The P calculated in their analysis will be the likelihood R* ≥ 1 given the
uncertainty in the calculation method. Banerjee and Datta (1991) validated their
mathematical analysis using a Monte Carlo simulation with 5,000 points for each
parameter. The coefficients of correlation between dependent parameters were assumed
and did not largely impact the final reliability calculation.
In order to utilize this analysis method, the following statistical parameters are
required: mean values for input parameters, coefficients of variation for each input
parameter, coefficients of correlation between parameters, uncertainty measures in the
theoretical relationship between parameters (from the first order uncertainty analysis),
and the nature of the relationship between parameters (Banerjee and Datta 1991).
2.5 Consequence Calculation
In order to allow for a completely quantitative analysis of risk, not only must P be
calculated, C must be determined as well. In some cases, this analysis can be relatively
simple, such as for maintenance activities due to settlement. The consequence in this case
is the calculated cost of materials and time for equipment and labor to re-grade and re-
compact the roadway as necessary. Calculating C gets more complicated when one
attempts to quantify the consequence of human fatalities and injuries, and indirect
economic impacts.
9
If a sudden collapse of the roadway surface occurs while a vehicle is travelling along the
highway, as has happened previously, causing a fatality (Hayley and Bowen 1987), how
does one quantify the loss? “Statistical methods (for risk analysis) may require a cost
function, which in turn may require the calculation of the cost of human life. This is a
difficult problem (Stamatis 2014).” Some suggested sources of information for quantifying
the potential costs due to fatality or injury include: insurance companies, due to their
actuarial information, and case law from similar situations. However, acquiring this
information may be very difficult, if not impossible, due to non-disclosure agreements,
privacy concerns and the potential for loss of competitive advantages between companies,
if the information was released to the public record. In the United States, cost/benefit
analyses are used to determine if Department of Transportation Highway Safety
Improvement Program expenditures are justified. This data may be available but may not
be applicable in Canada.
In the majority of published risk analysis studies reviewed by this author, the
consequence analysis consists of either monetary analysis or a casualty analysis for the
hazard (Lacasse and Nadim 1996, and Public Safety Canada 2011). The combination of
these two consequence analysis methods has not been observed within the engineering
literature. However, further data and studies may be present outside of the engineering
field.
Additional indirect economic impacts might also need to be considered. For example, if
a section of the Dempster Hwy from Dawson City, YT to Inuvik, NWT is closed, goods
normally transported via the highway must be flown. The cost difference between these
two transportation modes can be determined and possibly included in the risk analysis.
However, the amount of detail included in the calculation of the indirect cost depends on
the breadth and resources available for an analysis and should be at the discretion of the
agency or person conducting the risk analysis.
10
3 Project Methodology and Goals
In order for communities and industry to make informed unbiased assessments of their
infrastructure vulnerabilities, an objective risk analysis method is needed. The creation of a
tool to conduct risk analyses for embankment-supported linear infrastructure on
permafrost is the purpose of this project. In order to create a tool, the risk analysis method
must be derived from measureable data such as site conditions, physical and/or empirical
engineering calculations and consequences. Additionally, to address the analysis problem
discussed by Arenson (2013), the tool will focus on analyzing a single landform allowing
subsurface conditions to be analyzed individually and the risk calculated from the site’s
input parameters. Additional analyses can be conducted for the different landforms along
the alignment to create a risk profile.
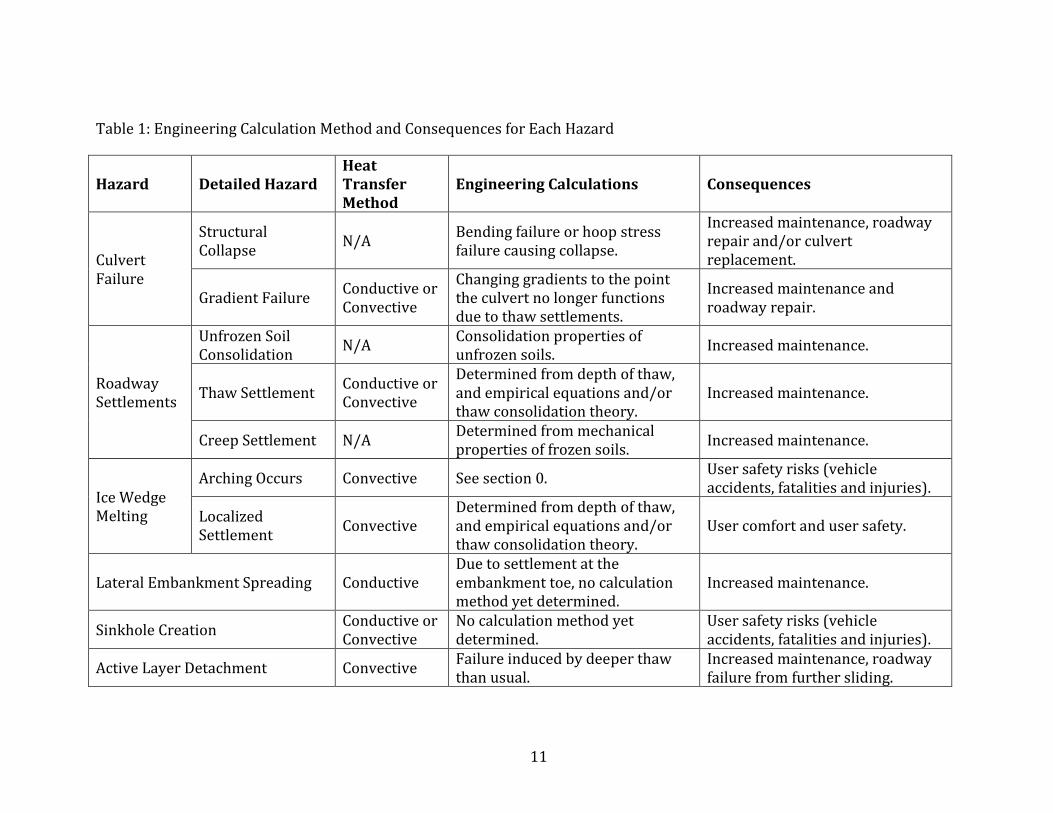
Using the information above, a calculation process will be created for each failure mode
highlighted in Figure 1 (discussed in further detail in Table 1), a reliability analysis (using
First Order Second Moment, FORM, analyses or Monte Carlo Simulation) or other
quantitative metric will be used to determine P, and guidelines will be created to calculate
C from the existing literature review and from additional future multidisciplinary review.
Research still needs to be completed to determine the engineering calculation processes
for arching effects (discussed in further detail in section 0), lateral embankment spreading,
and sinkhole creation. The last two failure mode equations and failure conditions are still
under development by the project team. The engineering calculation of the arching process
requires further study and is discussed in Section 3.1, below.
Once the calculation methods are determined, a tool, likely in an Excel spreadsheet, will
be created to complete the risk analysis. The author has begun work in this regard focusing
on the calculation of thaw depth, an essential piece of many of the failure mode analyses.
The tool will be validated based on information from field data. The field sites will be
existing research sites, where data is readily available and may include sites along the
Dempster Highway, Salluit Airpot Access Road or Iqaluit Airport.
11
Table 1: Engineering Calculation Method and Consequences for Each Hazard
Hazard Detailed Hazard Heat Transfer Method
Engineering Calculations Consequences
Culvert Failure
Structural Collapse
N/A Bending failure or hoop stress failure causing collapse.
Increased maintenance, roadway repair and/or culvert replacement.
Gradient Failure Conductive or Convective
Changing gradients to the point the culvert no longer functions due to thaw settlements.
Increased maintenance and roadway repair.
Roadway Settlements
Unfrozen Soil Consolidation
N/A Consolidation properties of unfrozen soils.
Increased maintenance.
Thaw Settlement Conductive or Convective
Determined from depth of thaw, and empirical equations and/or thaw consolidation theory.
Increased maintenance.
Creep Settlement N/A Determined from mechanical properties of frozen soils.
Increased maintenance.
Ice Wedge Melting
Arching Occurs Convective See section 0. User safety risks (vehicle accidents, fatalities and injuries).
Localized Settlement
Convective Determined from depth of thaw, and empirical equations and/or thaw consolidation theory.
User comfort and user safety.
Lateral Embankment Spreading Conductive Due to settlement at the embankment toe, no calculation method yet determined.
Increased maintenance.
Sinkhole Creation Conductive or Convective
No calculation method yet determined.
User safety risks (vehicle accidents, fatalities and injuries).
Active Layer Detachment Convective Failure induced by deeper thaw than usual.
Increased maintenance, roadway failure from further sliding.
12
The tool created in this project must: 1) be applicable to practicing engineers, 2)
require the user to define the failure criteria for each failure mode, if necessary
(settlement restrictions for a roadway are very different from runways), and 3)
require the user to determine the extent of the consequence analysis. The form and
function of this tool will be based on the author’s discussion with Professor Doré
and input from the project committee.
The project’s final deliverables will include the tool, its background calculations
presented in a report with the validation from the field sites and a user’s guide.
3.1 Arching Effect Analysis
A literature review conducted on arching effects found striking inconsistencies
and a lack of information. Intuitively, the span of an arch or bridge in soils is largely
impacted by the size of the particles, their angularity, friction angle and effective
stress conditions. However, the majority of studies consist of very simple model
soils without cohesive effects (glass beads, aluminum rods or ball bearings) and
arching is observed over a trapdoor at the base of the testing apparatus. In these
studies, the ratio between the width of the trapdoor (B) and the average particle
size (D50) ranges from 4 to 8.5 depending on the analysis method and model
material (Ahamadi and Hosseininia 2013, Chevalier and Otani 2011, Guo and Zhou
2013, Ladanyi and Hoyaux 1969). Only one study was conducted to model soil
movement into thawing ice wedges. It was conducted at a model scale (1/30th) in a
centrifuge at 30g to model full-scale testing. Arching effects were observed and
ratios up to 45 were observed (Harris and Murton 2005, Harris, Murton and Davies
2005). This larger ratio may be due to the generation of pore water pressures lower
than hydrostatic observed within the system during thawing. The author feels that
the volume reduction during the thawing the model ice wedge created these lower
pore pressures.
While the problem of arching over ice wedges has not been thoroughly analyzed,
Kinney and Connor (1987) presented a solution to the hazard of collapse by
analyzing the bridging effects of geosythetics over voids. The presence of
13
geosythetics within the embankment structure can impact the risk by reducing
surface settlement and preventing collapse.
Given a previous fatality due to roadway collapse from arching effects, the
project team feels it is very important that the possibility of embankment collapse
be investigated further. The current ratios for arching potential range from 4 to 45,
based on previous works briefly discussed above. The project team would like to
further investigate this problem by conducting scale laboratory tests under plane
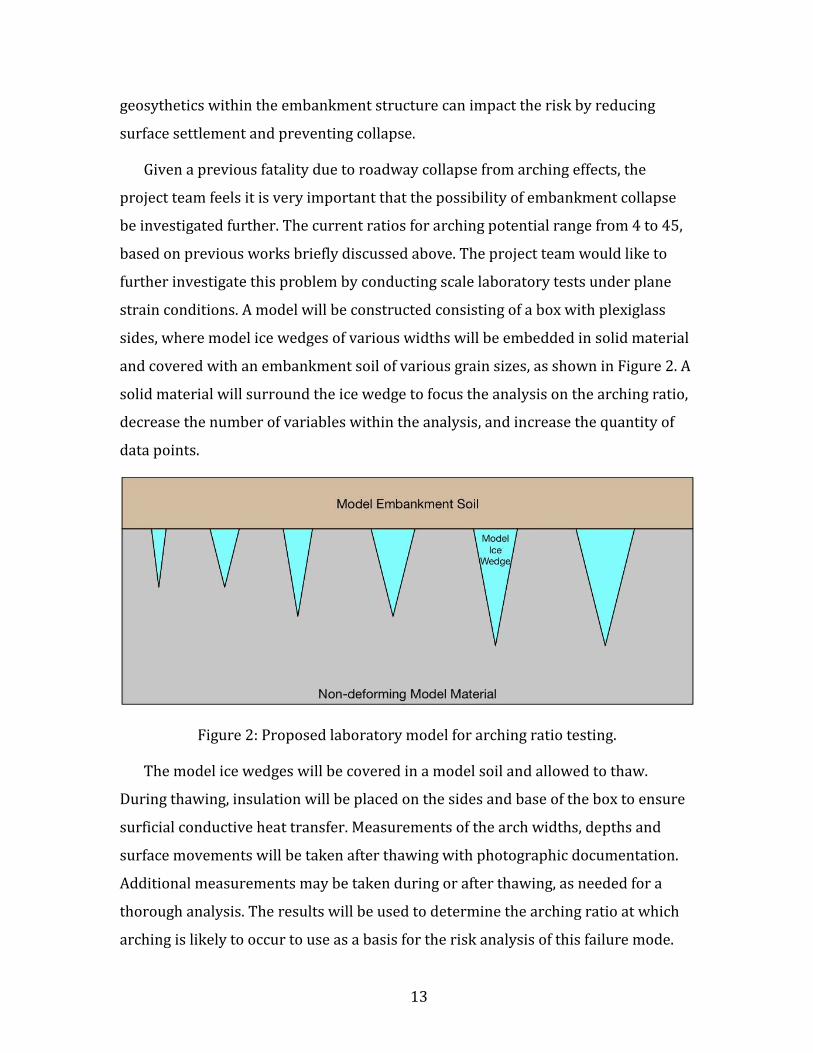
strain conditions. A model will be constructed consisting of a box with plexiglass
sides, where model ice wedges of various widths will be embedded in solid material
and covered with an embankment soil of various grain sizes, as shown in Figure 2. A
solid material will surround the ice wedge to focus the analysis on the arching ratio,
decrease the number of variables within the analysis, and increase the quantity of
data points.
Figure 2: Proposed laboratory model for arching ratio testing.
The model ice wedges will be covered in a model soil and allowed to thaw.
During thawing, insulation will be placed on the sides and base of the box to ensure
surficial conductive heat transfer. Measurements of the arch widths, depths and
surface movements will be taken after thawing with photographic documentation.
Additional measurements may be taken during or after thawing, as needed for a
thorough analysis. The results will be used to determine the arching ratio at which
arching is likely to occur to use as a basis for the risk analysis of this failure mode.
14
The surficial settlement characteristics will be used to determine the amplitude and
wavelengths of settlement areas to help determine the consequences of failure.
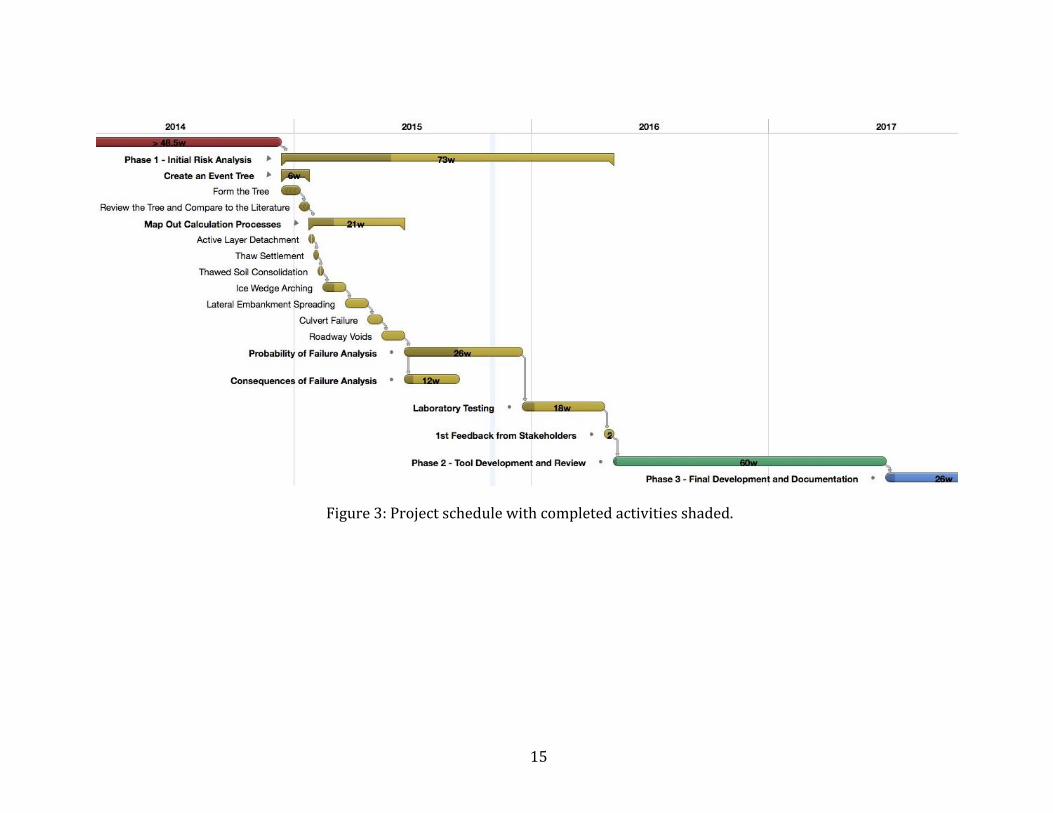
4 Project Schedule
A detailed schedule and list of tasks is presented in Figure 3 with completed
activities shaded in a darker color.
15
Figure 3: Project schedule with completed activities shaded.
16
5 References
Ahmadi, A., and E.S. Hosseininia (2013). “An Experimental Investigating the Width
and Height of a Stable Arch Formed in Granular Materials by Using a New
Developed Trapdoor Apparatus.” International Civil, Structural and
Environmental Engineering Conference, Zurich, Switzerland, October 12-13, pg.
20-24.
Allard, M., Lemay, M., Barrette, C., L'Hérault, E., Sarrazin, D., Bell, T., et al. (2012).
Permafrost and climate change in Nunavik and Nunasiavut: Importance for
municipal and transportation infrastructures. In From Science to Policy. An
Integrated Impact Study (IRIS) of Climate Change and Modernization (Vol.
Chapter 6, pp. 171-197).
Allard, M. (2013). The impacts of Climate Change on Permafrost: Merging Science
and Community Concerns. Presentation at the Pan-Territorial Permafrost
Conference, Yellowknife, NWT, Canada; November.
Arenson, L. (2013). NWT Highway 3 – Climate Change Vulnerability Assessment.
Presentation at the Pan-Territorial Permafrost Workshop, Yellowknife, NWT,
November 7, 2013.
Baecher, G. B., & Christian, J. T. (2003). Reliability and Statistics in Geotechnical
Engineering. Chichester, West Sussex, England: John Wiley & Sons, Ltd.
Banerjee, S., & Ditta, B. (1991). Reliability Analysis of Thaw-Induced Pore Pressures.
Journal of Cold Regions Engineering , 5 (3), 125-141.
BGC Engineering Inc. (2011). Climate Change Vulnerability Assessment for NWT
Highway 3. Final, Government of the Northwest Territories, Department of
Transporation.
Boucher, M., Grondin, G., & Paquet-Bouchard, B. (2012). Landslide in the Permafrost
near a Minitère des Transports du Québec Infrastructure in Salluit and
Stabilization Work. Cold Regions Engineering 2012: Sustainable Infrastructure
Development in a Changing Cold Environment (pp. 779-788). ACSE.
Brooks, H., G. Dore and C. Lemieux (2015). “Quantitative Risk Analysis of Linear
Infrastructure on Permafrost: State-of-the-Practice Literature Review.” Report to
Transport Canada, April 2015.
Chevalier, B. and J. Otani (2011). “Arching Observation in 3D Trapdoor Problem
with X-ray CT and Discrete Element Method.” Soils and Foundations, Japanese
Geotechnical Society, Vol. 51 No. 3, pg. 459-469
17
Duncan, J. M. (2000). Factors of Safety and Reliability in Geotechnical Engineering.
Journal of Geotechnical and Geoenvironmental Engineering , 126 (4), 307-316.
Engineers Canada (2011). Public Infrastructure Engineering Vulnerability Committee
(PIEVC) Engineering Protocol – Part 1, Version 10. Accessed online at
http://www.pievc.com/e/Part_I_-_PIEVC_Engineering_Protocol_-_Revision_10_-
_BETA_-_October_2011.pdf.
Guo, P. and S. Zhou (2013). “Arch in Granular Soils as a Free Surface Problem.”
International Journal for Numerical and Analytical Methods in Geomechanics.
Vol. 37, pg. 1048-1065.
Harris, C. and J.B. Murton (2005). “Experimental Simulation of Ice-Wedge Casting:
processes, products and Palaeoenvironmental Significance.” Cryospheric
Systems: Glaciers and Permafrost, Geologic Society of London, Special
Publication No. 242, pg. 131-143.
Harris, C., J.B. Murton and M.C.R. Davies (2005). “An Analysis of Mechanisms of Ice-
wedge Casting Based on Geotechnical Centrifuge Simulations.” Geomorphology,
Vol. 71, pg. 328-343.
Hayley, D.W. and J.A. Bowen (1987) “Ground Ice in Continuous Permafrost: a Hazard
to Safe Highway Operation.” Report associated with a presentation to Western
Association of Canadian Highway Officials, June 2, 1987, Yellowknife, NWT.
Kinney, T.C. and B. Connor (1987). “Geosynthetics Supporting Embankments Over
Voids.” Journal of Cold Regions Engineering. 1(4) pg. 158-170.
Lacasse, S., & Nadim, F. (1996). Uncertainties in Characterizing Soil Properties.
Uncertainty in the Geologic Environment: From Theory to Practice - Proceedings of
Uncertainty, (pp. 49-75). Madison, WI.
Ladanyi, B. and B. Hoyaux (1969). “A Study of the Trapdoor Problem in a Granular
Mass.” Canadian Geotechnical Journal, Vol. 6 No. 1, pg. 1-14.
Lingnau, B. E. (1985). Observation of the Design and Performance of the Dempster
Highway. Master's Thesis, University of Alberta, Department of Civil Engineering.
M-Lepage , J., Doré, G., & Burn, C. (2014). Advanced Seminar on Permafrost on
Engineering Applied to Transportation Infrastructure: Field Guide - Alaska
Highway. Yukon College .
Morgenstern, N. R., & Nixon, J. F. (1971). One-dimensional Consolidation of Thawing
Soils. Canadian Geotechnical Journal (8), 558-565.
PIEVC. (2009). PIEVC Engineering Protocol for Climate Change Infrastructure
Vulnerability Assessment. Public Infrastructure Engineering Vulnerability
Committee.
18
Public Safety Canada. (2011). All Hazards Risk Assessment - Methodology Guidlines.
Public Safety Canada.
Stamatis, D. H. (2014). Introduction to Risk and Failure. Boca Raton, Florida, USA: CRC
Press by Taylor and Fracis Group, LLC.
TCCRE. (1996). Roads and Airfields in Cold Regions. (T. S. Vinson, Ed.) New York, New
York, USA: ASCE.
Trimble, R. (2013, November). Recent Effects of CLimate Change on Permafrost and
Road Stability Dempster Hwy, NWT/YT. Yellowknife, NWT, Canada.
USACOE. (1999). Risk-Based Analysis in Geotechnical Engineering for Support of
Planning Studies. ETL 1110-2-547, United States Military, Department of the
Army.
Vita, C. L. (1984). Route Geotechnical Characterization and Analysis. Journal of
Geotechnical Engineering , 110 (12), 1715-1734.