Embed Size (px)
Citation preview
Quantitative Research in Support of:
Final Report
July 2009
CONFIDENTIAL & PROPRIETARY INFORMATIONKS&RKS&Rwww.ksrinc.comwww.ksrinc.com 1-888-8KSRINC1-888-8KSRINC

CONFIDENTIAL & PROPRIETARY INFORMATION Page 2
Page
Research Objectives and Methodology 3
Executive Summary 8
Image of Dairy Farming 17
Current Awareness of Dairy Farming Ads 24
Reaction to Coalition PSAs 30
Reaction to Coalition Billboards 44
Preferred Communication Channels 66
Respondent Profile 68
Table of Contents

CONFIDENTIAL & PROPRIETARY INFORMATION Page 3
Research Objectives and MethodologyResearch Objectives and Methodology
CONFIDENTIAL & PROPRIETARY INFORMATION Page 4
Research Objectives
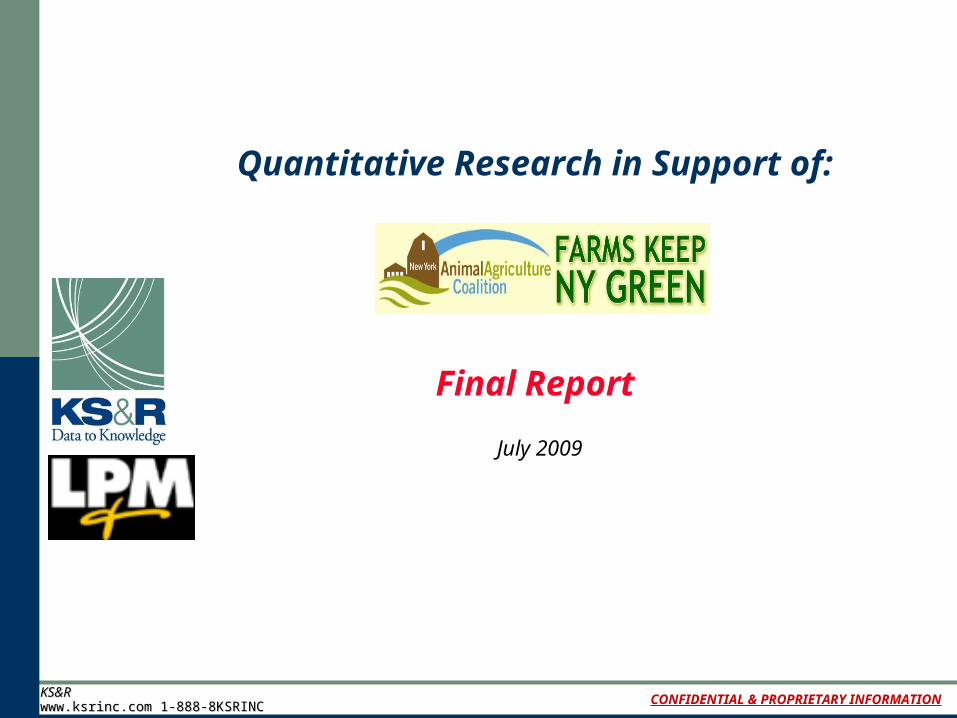
KS&R was commissioned to conduct primary market research for LP&M on behalf of its client, the New York Animal Agriculture Coalition, in order to fully understand consumer attitudes towards neighboring dairy farms.
This research study was designed to develop benchmark measures of consumer knowledge, attitudes and priority issues towards dairy farm “neighbors”. The findings of this study will assist in the development of communications to address key issues and concerns and to better educate consumers regarding the true value of dairy farming and its role and impact on the environment and the food supply.
The specific objectives of the research were to: Determine target New York State consumers’ perceptions of dairy farming – both favorable
and unfavorable – and the key drivers of those perceptions Identify the key issues that impact target consumers’ attitudes towards dairy farming, including:
legacy issues, environmental / green issues, food safety / security, animal welfare and economic development impact
Fully understand target consumers’ reaction to these issues, both positive and negative Determine awareness and effectiveness of the Coalition’s billboard and PSA campaign to
educate target consumers and address key misconceptions about dairy farming, including identifying potential areas of improvement.

CONFIDENTIAL & PROPRIETARY INFORMATION Page 5
An online survey was conducted among New York State residents living within six miles of an active dairy farm. Respondents were heads of household living within six targeted regions: Auburn/Cayuga County, Avon/Batavia, Rochester/Ontario County, Black River/Watertown, Geneva and Albany/Saratoga.
A total of 647 online interviews were completed, lasting approximately 10-15 minutes each. Completes were collected randomly from an approved national panel. Data was weighted to represent the population of New York State residents living within the six targeted regions.
Respondents and survey completions were stratified as follows:
Respondents were screened to verify and ensure:• Head of household• Current address meets regional requirements• Recognize active dairy farm within six miles of residence
Methodology
Region Region Quotas Number of Completed Interviews
Albany/Saratoga 100 125
Auburn/Cayuga County 100 80
Avon/Batavia 100 100
Black River/Watertown 100 100
Geneva 100 100
Rochester/Ontario County 100 142
TOTAL 600 647
The Auburn/Cayuga County quota was not satisfied due to low incidence of qualified respondents in that area. As a result, over sampling was conducted in the Albany/Saratoga and Rochester/Ontario County regions.

CONFIDENTIAL & PROPRIETARY INFORMATION Page 6
Quotas were established in the regions of interest to ensure sufficient sample sizes for analysis. To account for over/under sampling of key regions when reporting totals, weights were applied to bring the proportion of completes into line with actual population proportions.
Weighting
Albany/Saratoga
Auburn/Cayuga County
Avon/BataviaBlack River/Watertown
GenevaRochester/
Ontario County
Completes 125 80 100 100 100 142
Distribution 19% 12% 15% 15% 15% 22%
Weights were applied to bring the proportion of completes into line with actual population proportions.
ACTUAL MARKET DISTRIBUTION(Calculated from Incidence)
DISTRIBUTION OF COMPLETES
Albany/Saratoga
Auburn/Cayuga County
Avon/BataviaBlack River/Watertown
GenevaRochester/
Ontario County
Distribution 26% 10% 6% 10% 11% 38%

CONFIDENTIAL & PROPRIETARY INFORMATION Page 7
Regions
For purposes of interviewing, regions were stratified into counties as follows:
Region Counties Included
Albany/Saratoga Albany, Saratoga
Auburn/Cayuga County Cayuga
Avon/Batavia Genesee, Livingston
Black River/Watertown Jefferson
Geneva Ontario
Rochester/Ontario County Monroe, Ontario

CONFIDENTIAL & PROPRIETARY INFORMATION Page 8
Executive SummaryExecutive Summary

CONFIDENTIAL & PROPRIETARY INFORMATION Page 9
Executive Summary
Image of Dairy Farming
The vast majority of respondents (85%) have a very favorable impression of dairy farming in New York State. Only 3% have an unfavorable impression.
Between 85% and 96% agree that dairy farms have a very positive impact on New York State and provide residents with many benefits. (7% of Avon/Batavia respondents believe dairy farms are causing a number of problems for NYS and are detracting from residents’ quality of life.)
Respondents most often cite availability of local products, providing milk and other dairy products to the community and support for the local economy as specific benefits of dairy farming in New York State.
To the extent concerns emerge they typically involve ground water contamination / pollution, and odor / air quality / pollution.
Between 3% and 18% of respondents perceive dairy farms as smelling bad and dirty. Only about half (54%) of respondents view environmental stewardship as a benefit of dairy
farming.
Respondents identify a range of issues that are top-of-mind and impact their image of dairy farming in New York State:
Positive
• Agricultural/environmental benefits
• Economic development/support
• Role in feeding America’s families (providing local milk/dairy products)
Negative
• Land quality issues (ground water contamination/pollution)
• Air quality issues (odor/air pollution)

CONFIDENTIAL & PROPRIETARY INFORMATION Page 10
Executive Summary
Image of Dairy Farming
Differences among the six regions surveyed include: Avon/Batavia respondents are more concerned about odor / pollution (18% vs. 12% total). A much higher percent of Auburn/Cayuga and Black River/Watertown respondents have an
image of dairy farming that includes “hard work, long hours” and “underpaid, poor farmers.” Those in Black River/Watertown have a less favorable image of dairy farming (74% vs. 85%
total). Those in Auburn/Cayuga County have a more positive perception of dairy farms (96% vs. 91%
total).
Differences between the Farming/Agriculture segment and the “general population” included in the six regions are as follows:
A much higher percent of those in Farming/Ag have an image of dairy farming that includes “hard work, long hours” (31% vs. 15% total).
Farming/Ag respondents are more inclined to have an image of dairy farming that revolves around physical structures (barns, silos, etc.) (16% vs. 6% total).
Farming/Ag respondents are less likely to see dairy farming as essential to the community and local economy (3% vs. 8% total).
Farmer/Ag respondents are more inclined to cite environmental benefits of dairy farming (19% vs. 12% total).
CONFIDENTIAL & PROPRIETARY INFORMATION Page 11
Executive Summary (cont)
Current Awareness of Dairy Farming TV Ads and Billboards
About one-quarter (27%) of respondents indicate that they have previously seen a TV ad or a billboard about dairy farming in New York State.
About three quarters (73%) believe the main message of these ads is to encourage New York State residents to drink milk and consume dairy products.
The majority of respondents (77-87%) who have seen these TV ads and billboards about dairy farming in New York State consider them to be very believable.
The majority of respondents (69-73%) who have seen these TV ads and billboards about dairy farming also indicate that they result in a much more favorable image of dairy farming in New York State for them.
CONFIDENTIAL & PROPRIETARY INFORMATION Page 12
Executive Summary (cont)
Reaction to Coalition PSAsThe Coalition PSAs have low awareness and recall among respondents (6%), across regions. This may be attributable, in part, to the fact that the PSAs were no longer airing when the survey was conducted.
When presented to respondents, there is consensus, across regions, with regard to the main messages of the PSAs:
“Happy Cows”: “Happy / healthy cows produce better products.” “The Land”: “Dairy farming in New York State is environmentally sustainable.” “Feeding Families”: “Farmers providing for New York State families.”
All three PSAs are considered by the majority of respondents (80%-82%) to be very believable. All three PSAs also have a positive impact on respondents’ image of dairy farming in New York State (63%-65% much more favorable).
Generally, respondents attribute their more positive image to messages that convey farmers’ commitment and passion to their work and caring for animals.
Among the PSAs tested, no PSA was most preferred by the majority of respondents. However, there were regional and farming/ag differences:
“The Land” PSA is considered more believable by those in Auburn/Cayuga County (90% vs. 82% total).
Respondents in Auburn/Cayuga County have a more favorable image of dairy farming after seeing the “Happy Cows” PSA (76% vs. 63% total).
Those in Farming/Ag feel that the “Feeding Families” PSA is more believable (89% vs. 82% total).
CONFIDENTIAL & PROPRIETARY INFORMATION Page 13
Executive Summary (cont)
Reaction to Coalition Billboards
The Coalition Billboards have low awareness and recall among most respondents, across regions. This may be attributable, in part, to the fact that the billboards were no longer airing when the survey was conducted.
When presented to respondents, there is consensus, across regions, with regard to the main messages of the Billboards.
“Happy Cows”: “Happy / healthy cows produce better milk.” “The Land”: “New York State dairy farms are good for the environment.” “Feeding Families”: “New York State dairy farms provide fresh, healthy products.” “Family Tradition”: “New York State dairy farms are family or locally owned and operated.” “Strong Communities”: “New York State dairy farms create jobs.”
All five of the Billboards are considered by the majority of respondents (63%-79%) to be very believable. All five Billboards also have a positive impact on respondents’ image of dairy farming in New York State (47%-61% much more favorable).
Generally, respondents attribute their more positive image to messages that relate to the environmental and economic benefits of farming, caring for animals, fresh, healthy dairy products and family owned businesses.
Of the Billboards tested, “Family Tradition” is seen as most believable and results in the most positive images of dairy farming in New York State.
CONFIDENTIAL & PROPRIETARY INFORMATION Page 14
Executive Summary (cont)
Reaction to Coalition Billboards Respondents in Auburn/Cayuga County have a more favorable image of dairy farming after
seeing the “Happy Cows” billboard (61% vs. 49% total). The “Feeding Families” billboard is considered more believable by respondents in Geneva
(85% vs. 77% total). Respondents in Auburn/Cayuga County have a more favorable image of dairy farming as a
result of seeing the “Feeding Families” billboard (57% vs. 49% total). Farming/Ag respondents have higher recall of “The Land” billboard (11% vs. 5% total). Farming/Ag respondents have higher recall of the “Family Tradition” billboard (7% vs. 4% total) The “Strong Communities” billboard is considered more believable by Farming/Ag respondents
(73% vs. 63% total)

CONFIDENTIAL & PROPRIETARY INFORMATION Page 15
Executive Summary (cont)
Preferred Communication Channels
Dairy farmers are identified by half of respondents (46%) as the most preferred communication channel for PSAs and Billboards.
Veterinarians are the least preferred by respondents (55%).
CONFIDENTIAL & PROPRIETARY INFORMATION Page 16
Key FindingsKey Findings
CONFIDENTIAL & PROPRIETARY INFORMATION Page 17
Image of Dairy FarmingImage of Dairy Farming
CONFIDENTIAL & PROPRIETARY INFORMATION Page 18
Images and Perceptions of Dairy Farms
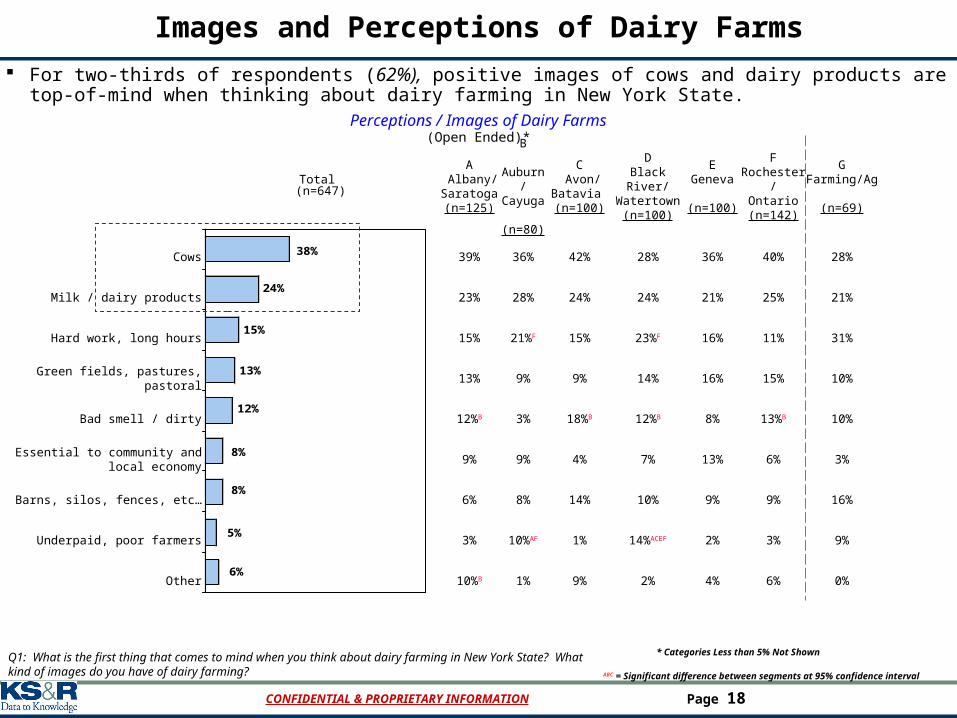
For two-thirds of respondents (62%), positive images of cows and dairy products are top-of-mind when thinking about dairy farming in New York State.
6%
5%
8%
8%
12%
13%
15%
24%
38%
Perceptions / Images of Dairy Farms(Open Ended)*
Q1: What is the first thing that comes to mind when you think about dairy farming in New York State? What kind of images do you have of dairy farming?
Total (n=647)
A Albany/Saratoga(n=125)
B Auburn/Cayuga (n=80)
C Avon/
Batavia (n=100)
DBlack River/Watertown
(n=100)
EGeneva
(n=100)
FRochester/
Ontario(n=142)
GFarming/Ag
(n=69)
Cows 39% 36% 42% 28% 36% 40% 28%
Milk / dairy products 23% 28% 24% 24% 21% 25% 21%
Hard work, long hours 15% 21%F 15% 23%F 16% 11% 31%
Green fields, pastures, pastoral 13% 9% 9% 14% 16% 15% 10%
Bad smell / dirty 12%B 3% 18%B 12%B 8% 13%B 10%
Essential to community and local economy
9% 9% 4% 7% 13% 6% 3%
Barns, silos, fences, etc… 6% 8% 14% 10% 9% 9% 16%
Underpaid, poor farmers 3% 10%AF 1% 14%ACEF 2% 3% 9%
Other 10%B 1% 9% 2% 4% 6% 0%
ABC = Significant difference between segments at 95% confidence interval
* Categories Less than 5% Not Shown
CONFIDENTIAL & PROPRIETARY INFORMATION Page 19
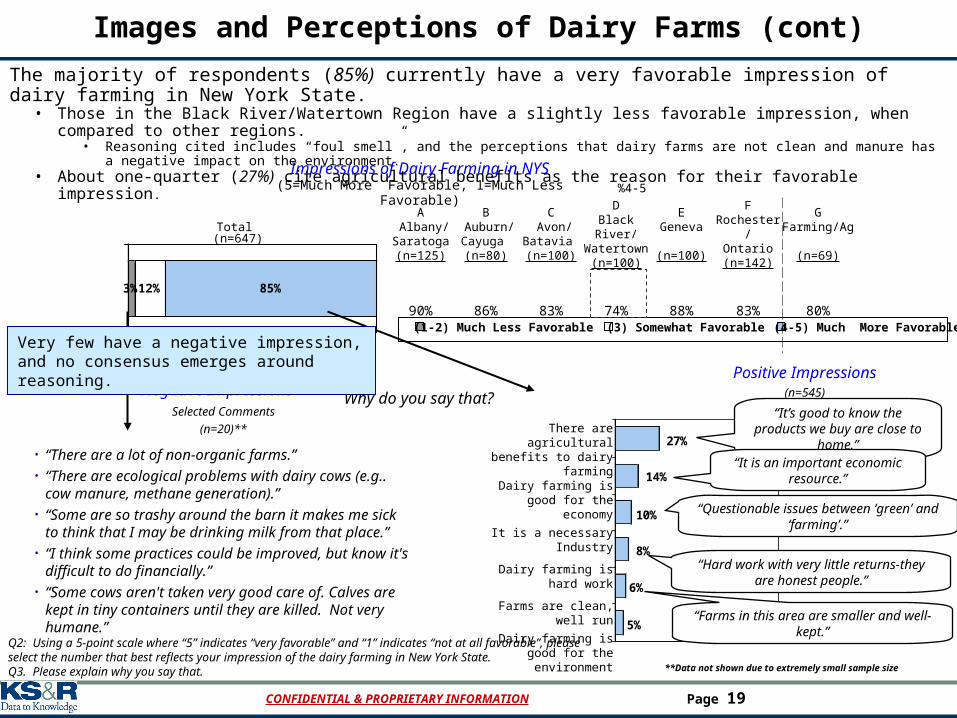
Impressions of Dairy Farming in NYS(5=Much More Favorable, 1=Much Less Favorable)
Q2: Using a 5-point scale where “5” indicates “very favorable” and “1” indicates “not at all favorable”, please select the number that best reflects your impression of the dairy farming in New York State.Q3. Please explain why you say that.
(1-2) Much Less Favorable (3) Somewhat Favorable (4-5) Much More Favorable
3%12% 85%
%4-5
Total (n=647)
A Albany/Saratoga(n=125)
B Auburn/Cayuga (n=80)
C Avon/
Batavia (n=100)
DBlack River/Watertown
(n=100)
EGeneva
(n=100)
FRochester/
Ontario(n=142)
GFarming/Ag
(n=69)
90% 86% 83% 74% 88% 83% 80%
5%
6%
8%
10%
14%
27%
Why do you say that?Selected Comments
(n=20)**
• “There are a lot of non-organic farms.”• “There are ecological problems with dairy cows (e.g..
cow manure, methane generation).”• “Some are so trashy around the barn it makes me sick
to think that I may be drinking milk from that place.”• “I think some practices could be improved, but know it's
difficult to do financially.”• “Some cows aren't taken very good care of. Calves are
kept in tiny containers until they are killed. Not very humane.”
There are agricultural benefits to dairy farming
Dairy farming is good for the economy
It is a necessary Industry
Dairy farming is hard work
Farms are clean, well run
Dairy farming is good for the environment
Images and Perceptions of Dairy Farms (cont)
Positive Impressions(n=545)Negative Impressions
“It’s good to know the products we buy are close to home.”
“It is an important economic resource.”
“Questionable issues between ‘green’ and ‘farming’.”
“Hard work with very little returns-they are honest people.”
“Farms in this area are smaller and well-kept.”
**Data not shown due to extremely small sample size
Very few have a negative impression, and no consensus emerges around reasoning.
The majority of respondents (85%) currently have a very favorable impression of dairy farming in New York State.• Those in the Black River/Watertown Region have a slightly less favorable impression, when compared to other regions.
• Reasoning cited includes “foul smell”, and the perceptions that dairy farms are not clean and manure has a negative impact on the environment. • About one-quarter (27%) cite agricultural benefits as the reason for their favorable impression.
CONFIDENTIAL & PROPRIETARY INFORMATION Page 20
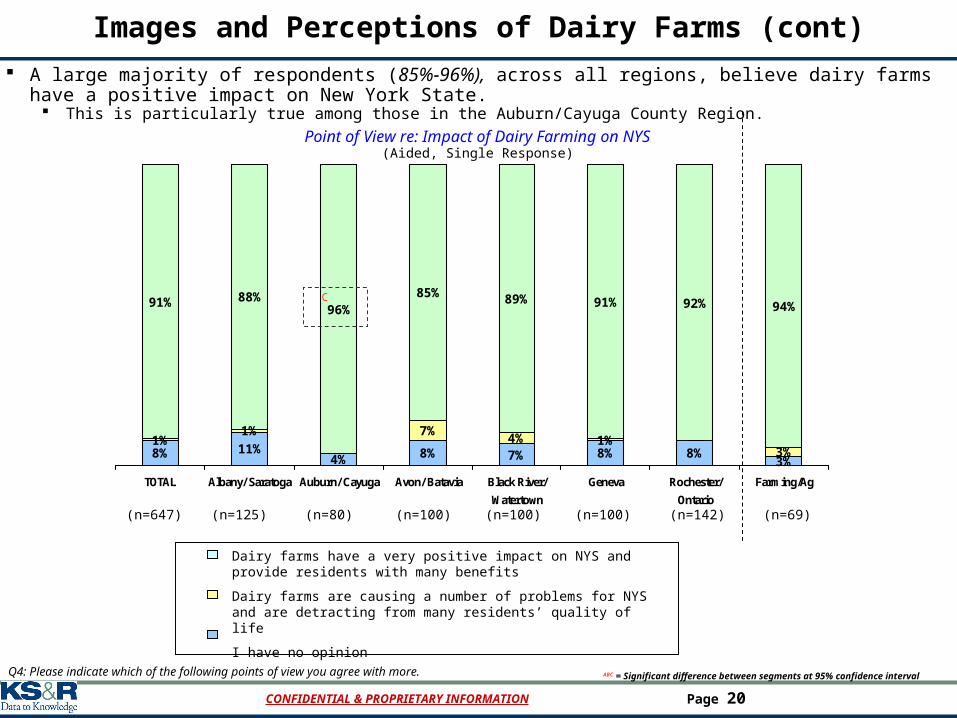
A large majority of respondents (85%-96%), across all regions, believe dairy farms have a positive impact on New York State.
This is particularly true among those in the Auburn/Cayuga County Region.
8% 11%4% 8% 7% 8% 8%
3%
1%1% 7%
4% 1%3%
91% 88%96%
85% 89% 91% 94%92%
TOTAL Albany/ Saratoga Auburn/ Cayuga Avon/ Batavia Black River/
Watertown
Geneva Rochester/
Ontario
Farming/Ag
Point of View re: Impact of Dairy Farming on NYS(Aided, Single Response)
Q4: Please indicate which of the following points of view you agree with more.
(n=647) (n=125) (n=80) (n=100) (n=100) (n=100) (n=142) (n=69)
C
Dairy farms have a very positive impact on NYS and provide residents with many benefits
Dairy farms are causing a number of problems for NYS and are detracting from many residents’ quality of life
I have no opinion
ABC = Significant difference between segments at 95% confidence interval
Images and Perceptions of Dairy Farms (cont)
CONFIDENTIAL & PROPRIETARY INFORMATION Page 21
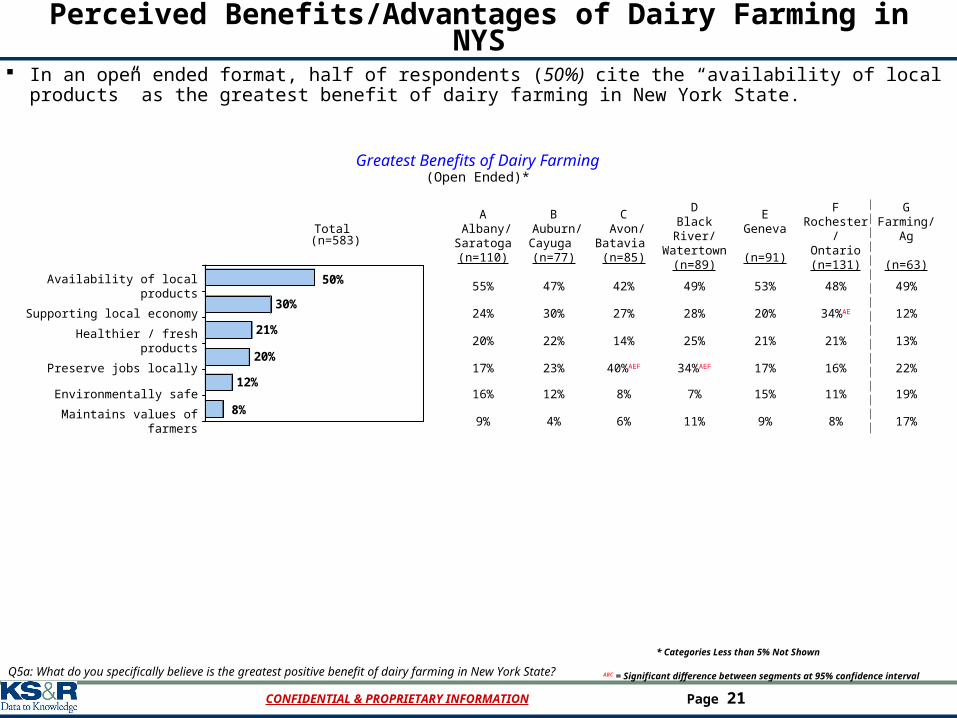
Perceived Benefits/Advantages of Dairy Farming in NYS
In an open ended format, half of respondents (50%) cite the “availability of local products” as the greatest benefit of dairy farming in New York State.
8%
12%
20%
21%
30%
50%
Greatest Benefits of Dairy Farming(Open Ended)*
Q5a: What do you specifically believe is the greatest positive benefit of dairy farming in New York State?
Total (n=583)
A Albany/Saratoga(n=110)
B Auburn/Cayuga (n=77)
C Avon/
Batavia (n=85)
DBlack River/Watertown
(n=89)
EGeneva
(n=91)
FRochester/
Ontario(n=131)
GFarming/Ag
(n=63)
Availability of local products 55% 47% 42% 49% 53% 48% 49%
Supporting local economy 24% 30% 27% 28% 20% 34%AE 12%
Healthier / fresh products 20% 22% 14% 25% 21% 21% 13%
Preserve jobs locally 17% 23% 40%AEF 34%AEF 17% 16% 22%
Environmentally safe 16% 12% 8% 7% 15% 11% 19%
Maintains values of farmers 9% 4% 6% 11% 9% 8% 17%
ABC = Significant difference between segments at 95% confidence interval
* Categories Less than 5% Not Shown

CONFIDENTIAL & PROPRIETARY INFORMATION Page 22
Perceived Benefits/Advantages of Dairy Farming in NYS (cont)
Q5b: Which of the following do you believe are the benefits of dairy farming in New York State?Q5c: And which of these that you have selected do you believe is the primary benefit?
Stated Benefits(Aided)
Providing milk and other dairy products for people
Support local businesses / economy
A better use of land than industrial, commercial or residential uses
Add to the quality of life in Upstate New York
Create jobs
Environmental stewardship
Help young farmers get started in agriculture
Primary Reason (n=566)
All Reasons (n=583)
In a closed-ended format, nearly all (98%) respondents indicate that “providing milk and other dairy products” is a benefit of dairy farming in New York State.
Approximately half (48%) of these respondents believe it is the primary benefit.
A large majority of respondents (85%) also view supporting the “local business / economy” as a benefit.
59%
1%
54%
3%
68%
6%
75%
10%
68%
15%
85%17%
98%
48%
CONFIDENTIAL & PROPRIETARY INFORMATION Page 23
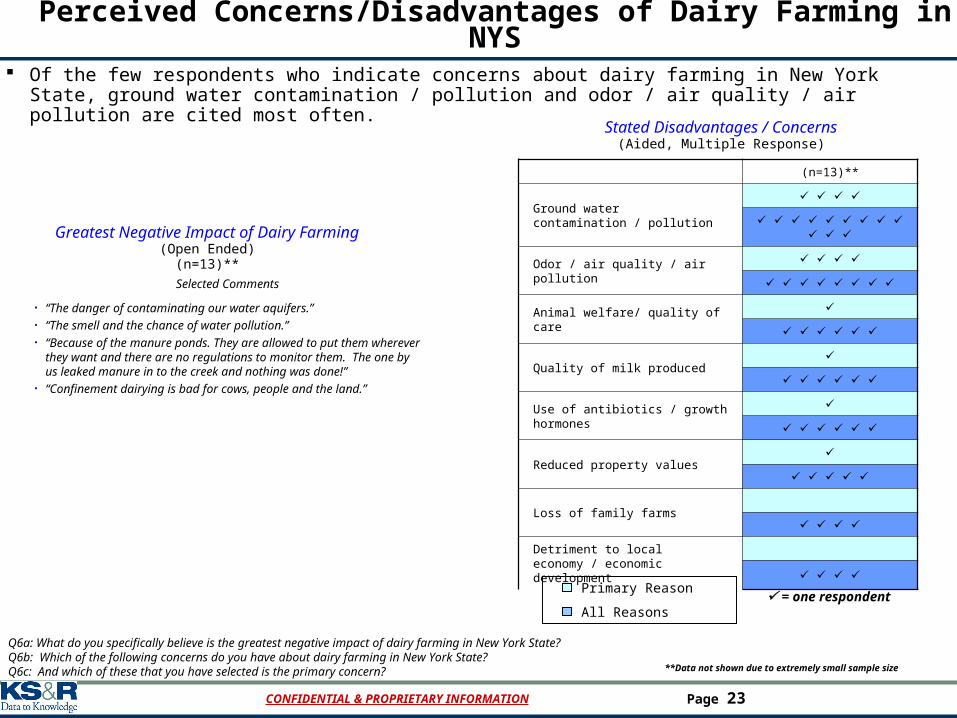
Of the few respondents who indicate concerns about dairy farming in New York State, ground water contamination / pollution and odor / air quality / air pollution are cited most often.
Q6a: What do you specifically believe is the greatest negative impact of dairy farming in New York State?Q6b: Which of the following concerns do you have about dairy farming in New York State?Q6c: And which of these that you have selected is the primary concern?
Stated Disadvantages / Concerns(Aided, Multiple Response)
Primary Reason
All Reasons
Perceived Concerns/Disadvantages of Dairy Farming in NYS
(n=13)**
Ground water contamination / pollution
Odor / air quality / air pollution
Animal welfare/ quality of care
Quality of milk produced
Use of antibiotics / growth hormones
Reduced property values
Loss of family farms
Detriment to local economy / economic development
Greatest Negative Impact of Dairy Farming(Open Ended)
(n=13)**
Selected Comments
• “The danger of contaminating our water aquifers.”• “The smell and the chance of water pollution.”• “Because of the manure ponds. They are allowed to put them
wherever they want and there are no regulations to monitor them. The one by us leaked manure in to the creek and nothing was done!”
• “Confinement dairying is bad for cows, people and the land.”
**Data not shown due to extremely small sample size
= one respondent

CONFIDENTIAL & PROPRIETARY INFORMATION Page 24
Current Awareness of Dairy Farming AdsCurrent Awareness of Dairy Farming Ads
CONFIDENTIAL & PROPRIETARY INFORMATION Page 25
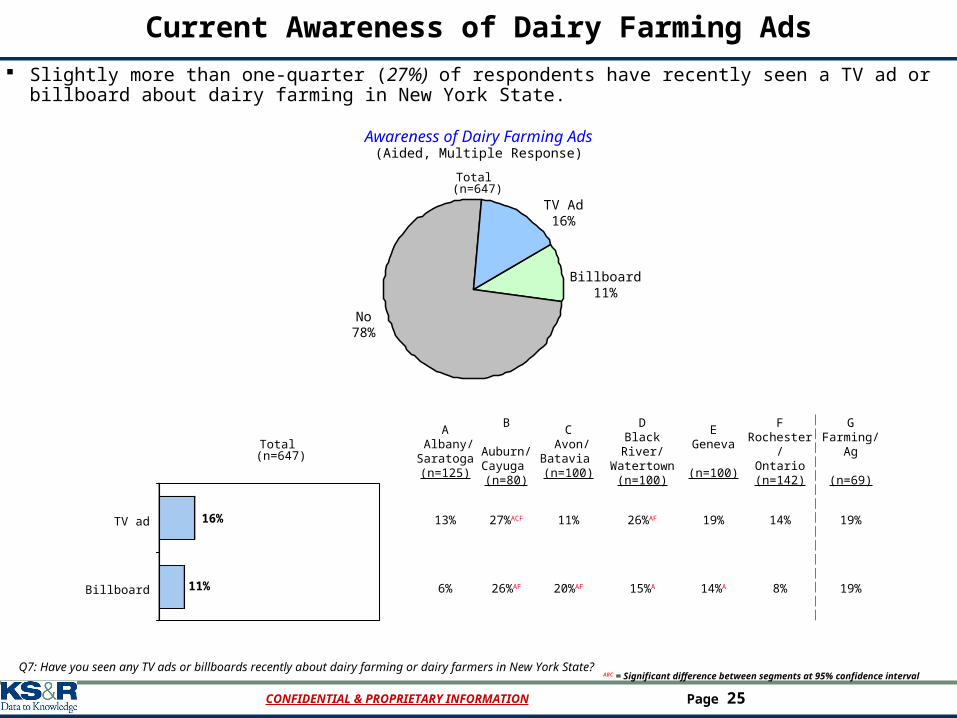
No78%
Billboard11%
Awareness of Dairy Farming Ads(Aided, Multiple Response)
Total (n=647)
TV Ad16%
Current Awareness of Dairy Farming Ads
Q7: Have you seen any TV ads or billboards recently about dairy farming or dairy farmers in New York State?
Total (n=647)
A Albany/Saratoga(n=125)
B Auburn/Cayuga (n=80)
C Avon/
Batavia (n=100)
DBlack River/Watertown
(n=100)
EGeneva
(n=100)
FRochester/
Ontario(n=142)
GFarming/ Ag
(n=69)
TV ad 13% 27%ACF 11% 26%AF 19% 14% 19%
Billboard 6% 26%AF 20%AF 15%A 14%A 8% 19%11%
16%
ABC = Significant difference between segments at 95% confidence interval
Slightly more than one-quarter (27%) of respondents have recently seen a TV ad or billboard about dairy farming in New York State.

CONFIDENTIAL & PROPRIETARY INFORMATION Page 26
Perceived Message of Dairy Farming Ads
Nearly three-quarters (73%) of respondents believe the main message of both the TV ads and billboards about dairy farming in New York State is to encourage New York State residents to drink milk and consume dairy products. Perceived Message of TV Ads
Among those who have seen TV ads(Open Ended)
Q8a: What was the main message?
Total (n=162)
A Albany/Saratoga(n=19)**
B Auburn/Cayuga (n=36)*
C Avon/
Batavia (n=25)*
DBlack River/Watertown
(n=33)*
EGeneva
(n=26)*
FRochester/
Ontario(n=23)**
GFarming/ Ag
(n=22)**
Consume dairy products ** 28% 36% 21% 35% ** **
Support dairy farms ** 44% 32% 18% 23% ** **
Buy local products ** 11% 16% 15% 11% ** **
Conveys why local farms should be supported
** 22% 12% 30% 19% ** **
Don’t remember ** 8% 20% 21% 23% ** **
Total (n=86)
A Albany/Saratoga(n=7)**
B Auburn/Cayuga (n=21)**
C Avon/
Batavia (n=19)**
DBlack River/Watertown(n=15)**
EGeneva
(n=13**)
FRochester/
Ontario(n=11)**
GFarming/ Ag
(n=15)**
Drink milk, it’s healthy ** ** ** ** ** ** **
Support local farmers ** ** ** ** ** ** **
Dairy farming is beneficial ** ** ** ** ** ** **
Awareness of dairy farming ** ** ** ** ** ** **
Don’t remember ** ** ** ** ** ** **
Perceived Message of BillboardsAmong those who have seen billboards
(Open Ended)
13%
19%
24%
26%
34%
14%
6%
15%
21%
39%
*Caution: Small sample size**Data not shown due to extremely small sample size
CONFIDENTIAL & PROPRIETARY INFORMATION Page 27
Dairy Farming Ad Message Believability
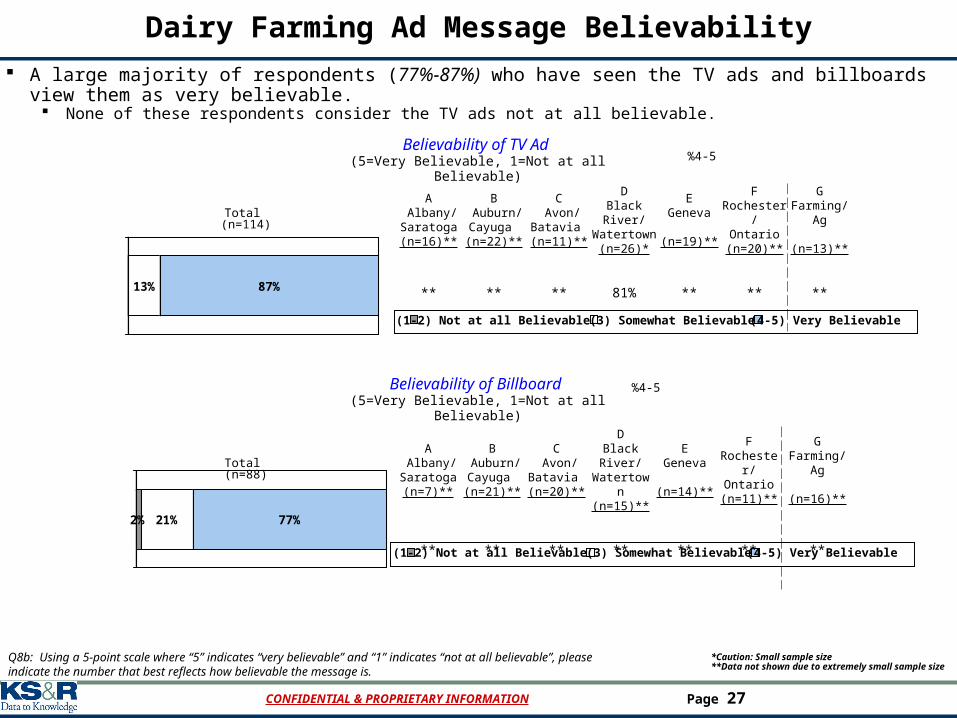
A large majority of respondents (77%-87%) who have seen the TV ads and billboards view them as very believable.
None of these respondents consider the TV ads not at all believable.
Believability of TV Ad (5=Very Believable, 1=Not at all Believable)
Q8b: Using a 5-point scale where “5” indicates “very believable” and “1” indicates “not at all believable”, please indicate the number that best reflects how believable the message is.
(1-2) Not at all Believable (3) Somewhat Believable (4-5) Very Believable
%4-5
Total (n=114)
A Albany/Saratoga(n=16)**
B Auburn/Cayuga (n=22)**
C Avon/
Batavia (n=11)**
DBlack River/Watertown
(n=26)*
EGeneva
(n=19)**
FRochester/
Ontario(n=20)**
GFarming/
Ag
(n=13)**
** ** ** 81% ** ** **13% 87%
*Caution: Small sample size**Data not shown due to extremely small sample size
Believability of Billboard (5=Very Believable, 1=Not at all Believable)
(1-2) Not at all Believable (3) Somewhat Believable (4-5) Very Believable
%4-5
2% 21% 77%
Total (n=88)
A Albany/Saratoga(n=7)**
B Auburn/Cayuga (n=21)**
C Avon/
Batavia (n=20)**
DBlack River/
Watertown(n=15)**
EGeneva
(n=14)**
FRochester/
Ontario(n=11)**
GFarming/ Ag
(n=16)**
** ** ** ** ** ** **
CONFIDENTIAL & PROPRIETARY INFORMATION Page 28
Impact of Dairy Farming TV Ads on Image of Dairy Farming
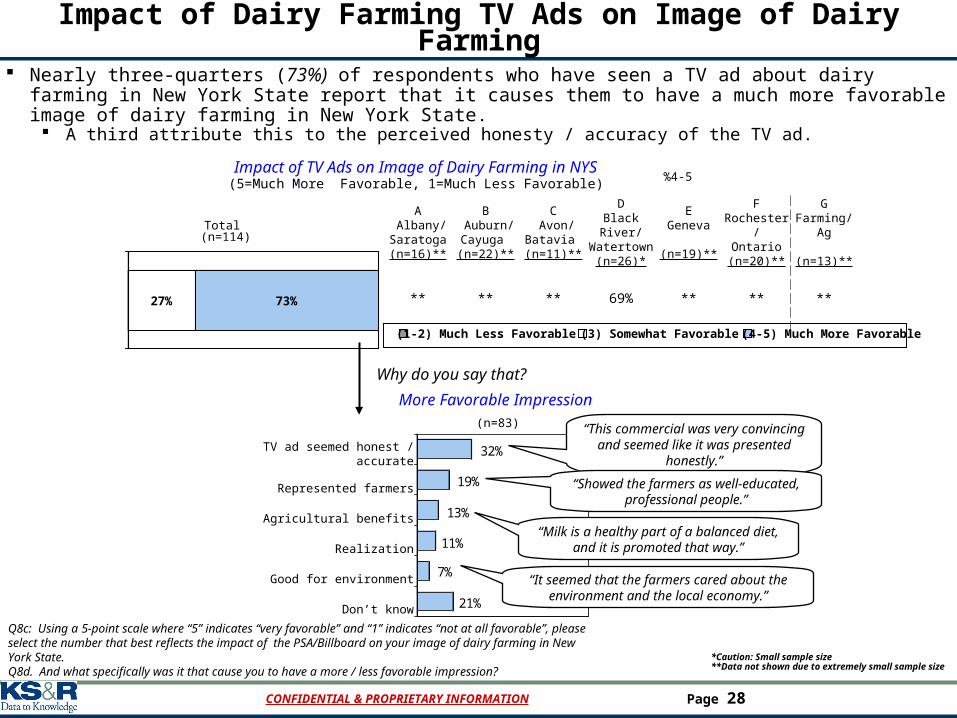
Nearly three-quarters (73%) of respondents who have seen a TV ad about dairy farming in New York State report that it causes them to have a much more favorable image of dairy farming in New York State. A third attribute this to the perceived honesty / accuracy of the TV ad.
Impact of TV Ads on Image of Dairy Farming in NYS(5=Much More Favorable, 1=Much Less Favorable)
Q8c: Using a 5-point scale where “5” indicates “very favorable” and “1” indicates “not at all favorable”, please select the number that best reflects the impact of the PSA/Billboard on your image of dairy farming in New York State.Q8d. And what specifically was it that cause you to have a more / less favorable impression?
(1-2) Much Less Favorable (3) Somewhat Favorable (4-5) Much More Favorable
%4-5
Total (n=114)
A Albany/Saratoga(n=16)**
B Auburn/Cayuga (n=22)**
C Avon/
Batavia (n=11)**
DBlack River/Watertown
(n=26)*
EGeneva
(n=19)**
FRochester/
Ontario(n=20)**
GFarming/ Ag
(n=13)**
** ** ** 69% ** ** **
21%
7%
11%
13%
19%
32%
Why do you say that?
TV ad seemed honest / accurate
Represented farmers
Agricultural benefits
Realization
Good for environment
Don’t know
More Favorable Impression
27% 73%
(n=83)
*Caution: Small sample size**Data not shown due to extremely small sample size
“This commercial was very convincing and seemed like it was presented honestly.”
“Showed the farmers as well-educated, professional people.”
“Milk is a healthy part of a balanced diet, and it is promoted that way.”
“It seemed that the farmers cared about the environment and the local economy.”
CONFIDENTIAL & PROPRIETARY INFORMATION Page 29
Impact of Dairy Farming Billboards on Image of Dairy Farming
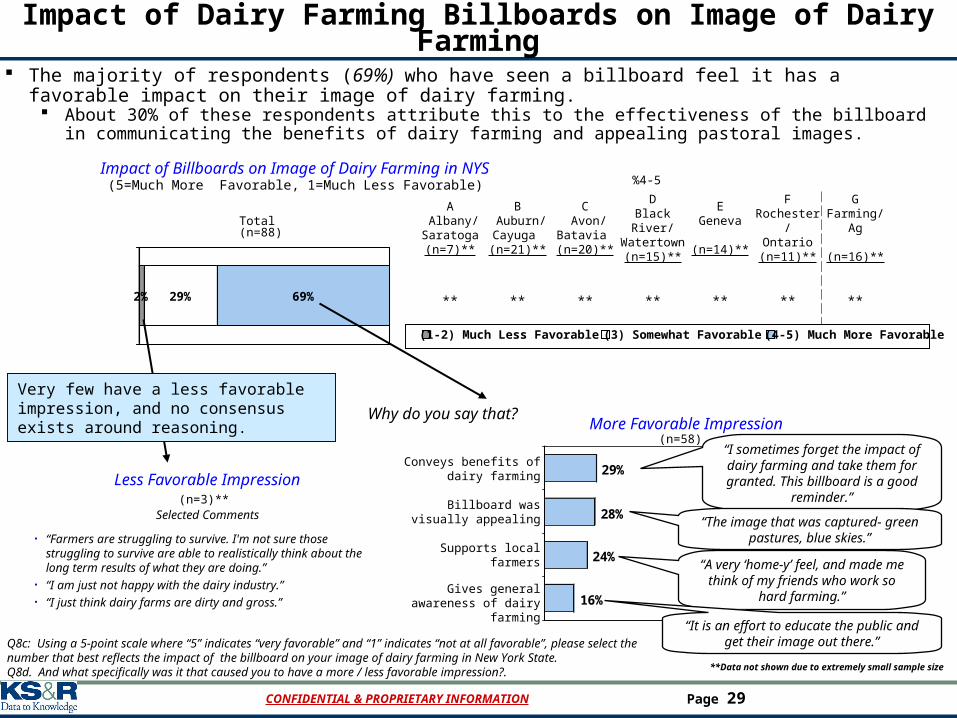
The majority of respondents (69%) who have seen a billboard feel it has a favorable impact on their image of dairy farming. About 30% of these respondents attribute this to the effectiveness of the billboard in communicating the benefits of
dairy farming and appealing pastoral images.
Impact of Billboards on Image of Dairy Farming in NYS(5=Much More Favorable, 1=Much Less Favorable)
Q8c: Using a 5-point scale where “5” indicates “very favorable” and “1” indicates “not at all favorable”, please select the number that best reflects the impact of the billboard on your image of dairy farming in New York State.Q8d. And what specifically was it that caused you to have a more / less favorable impression?. **Data not shown due to extremely small sample size
%4-5
Total (n=88)
A Albany/Saratoga(n=7)**
B Auburn/Cayuga (n=21)**
C Avon/
Batavia (n=20)**
DBlack River/Watertown(n=15)**
EGeneva
(n=14)**
FRochester/
Ontario(n=11)**
GFarming/ Ag
(n=16)**
** ** ** ** ** ** **
16%
24%
28%
29%
Why do you say that?
Conveys benefits of dairy farming
Billboard was visually appealing
Supports local farmers
Gives general awareness of dairy farming
More Favorable Impression
Less Favorable Impression
2% 29% 69%
(1-2) Much Less Favorable (3) Somewhat Favorable (4-5) Much More Favorable
(n=58)
Selected Comments
• “Farmers are struggling to survive. I'm not sure those struggling to survive are able to realistically think about the long term results of what they are doing.”
• “I am just not happy with the dairy industry.”• “I just think dairy farms are dirty and gross.”
“I sometimes forget the impact of dairy farming and take them for granted. This
billboard is a good reminder.”
“The image that was captured- green pastures, blue skies.”
“A very ‘home-y’ feel, and made me think of my friends who work so hard farming.”
“It is an effort to educate the public and get their image out there.”
(n=3)**
Very few have a less favorable impression, and no consensus exists around reasoning.

CONFIDENTIAL & PROPRIETARY INFORMATION Page 30
Reaction to Coalition PSAsReaction to Coalition PSAs
CONFIDENTIAL & PROPRIETARY INFORMATION Page 31
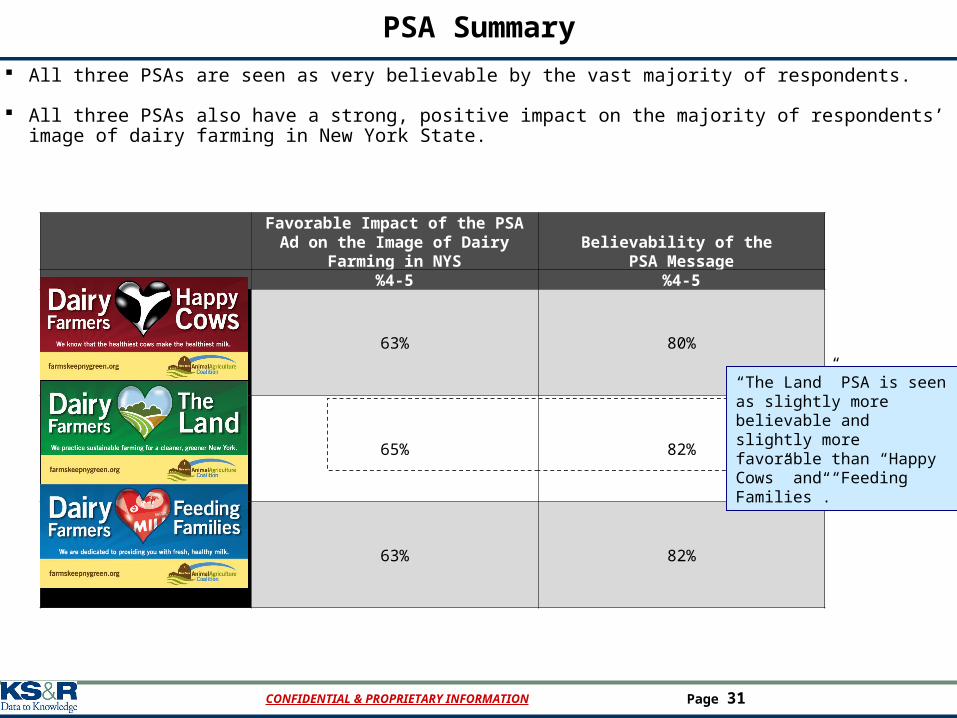
PSA Summary
Favorable Impact of the PSA Ad on the Image of Dairy Farming in NYS
Believability of the PSA Message
%4-5 %4-5
63% 80%
65% 82%
63% 82%
“The Land” PSA is seen as slightly more believable and slightly more favorable than “Happy Cows” and “Feeding Families”.
All three PSAs are seen as very believable by the vast majority of respondents.
All three PSAs also have a strong, positive impact on the majority of respondents’ image of dairy farming in New York State.

CONFIDENTIAL & PROPRIETARY INFORMATION Page 32
PSA – “Happy Cows”
CONFIDENTIAL & PROPRIETARY INFORMATION Page 33
“Happy Cows” Recall and Perceived Message
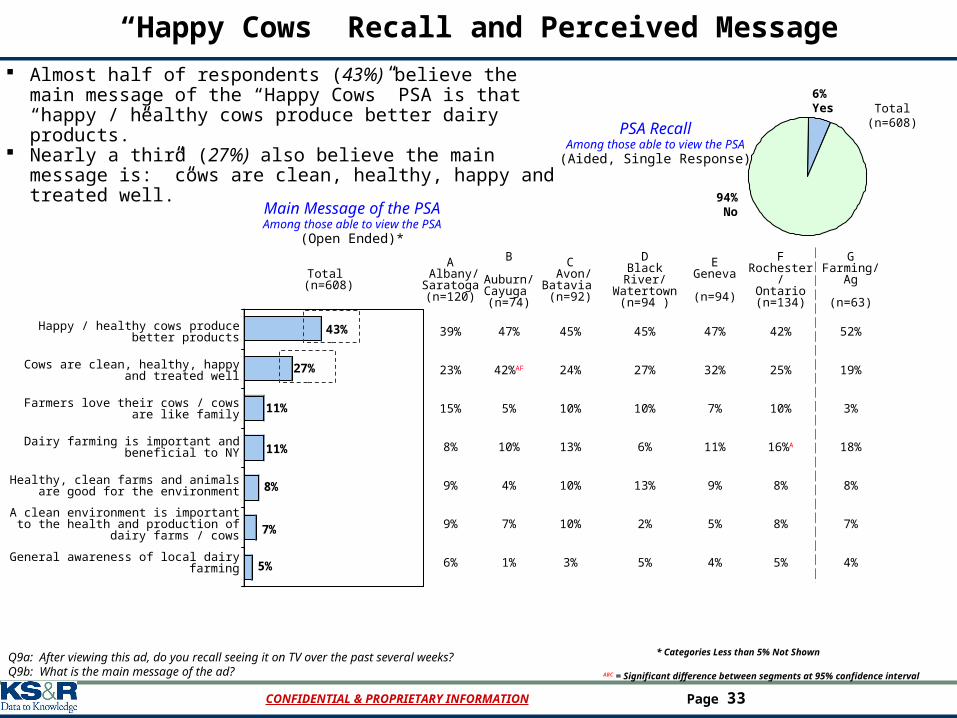
Almost half of respondents (43%) believe the main message of the “Happy Cows” PSA is that “happy / healthy cows produce better dairy products.”
Nearly a third (27%) also believe the main message is: ”cows are clean, healthy, happy and treated well.”
PSA RecallAmong those able to view the PSA
(Aided, Single Response)
Q9a: After viewing this ad, do you recall seeing it on TV over the past several weeks?Q9b: What is the main message of the ad?
Yes6%
No94%
5%
7%
8%
11%
11%
27%
43%
Total (n=608)
A Albany/Saratoga(n=120)
B Auburn/Cayuga (n=74)
C Avon/
Batavia (n=92)
DBlack River/Watertown
(n=94 )
EGeneva
(n=94)
FRochester/
Ontario(n=134)
GFarming/Ag
(n=63)
Happy / healthy cows produce better products 39% 47% 45% 45% 47% 42% 52%
Cows are clean, healthy, happy and treated well 23% 42%AF 24% 27% 32% 25% 19%
Farmers love their cows / cows are like family 15% 5% 10% 10% 7% 10% 3%
Dairy farming is important and beneficial to NY 8% 10% 13% 6% 11% 16%A 18%
Healthy, clean farms and animals are good for the environment 9% 4% 10% 13% 9% 8% 8%
A clean environment is important to the health and production of dairy farms / cows 9% 7% 10% 2% 5% 8% 7%
General awareness of local dairy farming 6% 1% 3% 5% 4% 5% 4%
Main Message of the PSAAmong those able to view the PSA
(Open Ended)*
6% Yes
94% No
Total(n=608)
ABC = Significant difference between segments at 95% confidence interval
* Categories Less than 5% Not Shown
CONFIDENTIAL & PROPRIETARY INFORMATION Page 34
“Happy Cows” Message Believability
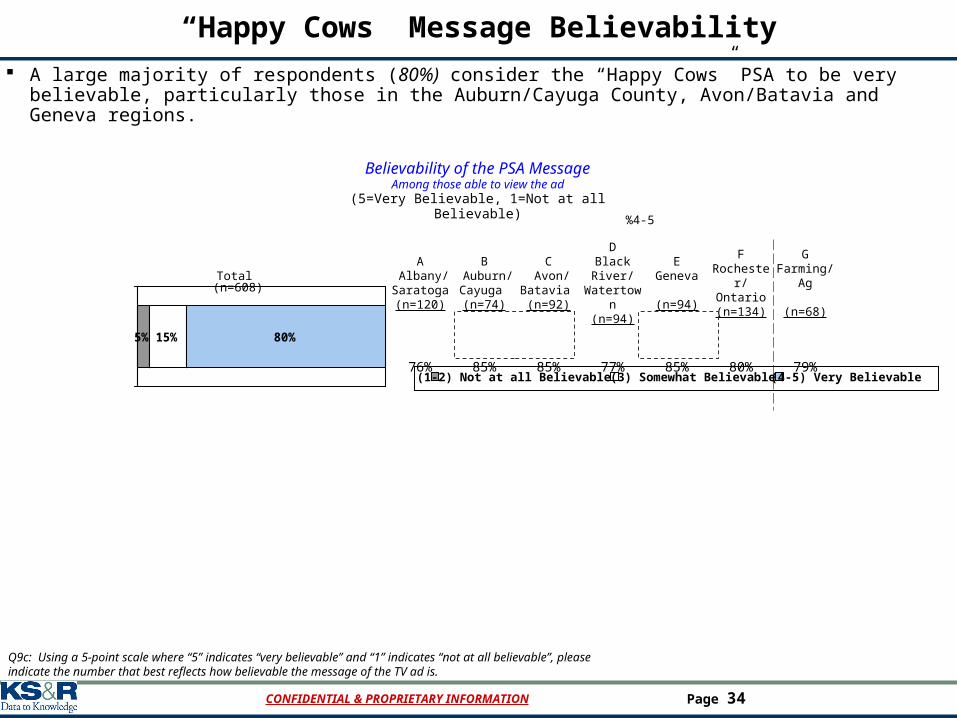
A large majority of respondents (80%) consider the “Happy Cows” PSA to be very believable, particularly those in the Auburn/Cayuga County, Avon/Batavia and Geneva regions.
Believability of the PSA MessageAmong those able to view the ad
(5=Very Believable, 1=Not at all Believable)
Q9c: Using a 5-point scale where “5” indicates “very believable” and “1” indicates “not at all believable”, please indicate the number that best reflects how believable the message of the TV ad is.
(1-2) Not at all Believable (3) Somewhat Believable (4-5) Very Believable
5% 15% 80%
%4-5
Total (n=608)
A Albany/Saratoga(n=120)
B Auburn/Cayuga (n=74)
C Avon/
Batavia (n=92)
DBlack River/
Watertown(n=94)
EGeneva
(n=94)
FRochester/
Ontario(n=134)
GFarming/Ag
(n=68)
76% 85% 85% 77% 85% 80% 79%
CONFIDENTIAL & PROPRIETARY INFORMATION Page 35
Impact of the “Happy Cows” PSA on Dairy Farming
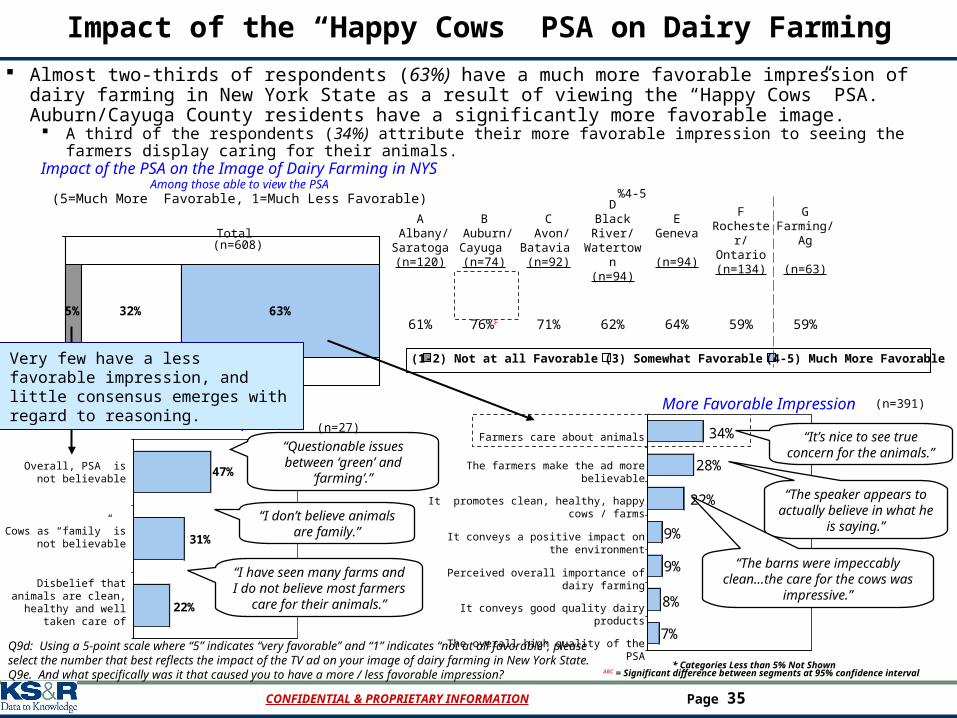
Almost two-thirds of respondents (63%) have a much more favorable impression of dairy farming in New York State as a result of viewing the “Happy Cows” PSA. Auburn/Cayuga County residents have a significantly more favorable image.
A third of the respondents (34%) attribute their more favorable impression to seeing the farmers display caring for their animals.
Impact of the PSA on the Image of Dairy Farming in NYSAmong those able to view the PSA
(5=Much More Favorable, 1=Much Less Favorable)
Q9d: Using a 5-point scale where “5” indicates “very favorable” and “1” indicates “not at all favorable”, please select the number that best reflects the impact of the TV ad on your image of dairy farming in New York State.Q9e. And what specifically was it that caused you to have a more / less favorable impression?
(1-2) Not at all Favorable (3) Somewhat Favorable (4-5) Much More Favorable
5% 32% 63%
%4-5
ABC = Significant difference between segments at 95% confidence interval
Total (n=608)
A Albany/Saratoga(n=120)
B Auburn/Cayuga (n=74)
C Avon/
Batavia (n=92)
DBlack River/
Watertown(n=94)
EGeneva
(n=94)
FRochester/
Ontario(n=134)
GFarming/Ag
(n=63)
61% 76%F 71% 62% 64% 59% 59%
7%
8%
9%
9%
22%
28%
34%Farmers care about animals
The farmers make the ad more believable
It promotes clean, healthy, happy cows / farms
It conveys a positive impact on the environment
Perceived overall importance of dairy farming
It conveys good quality dairy products
The overall high quality of the PSA
More Favorable ImpressionLess Favorable Impression
22%
31%
47%Overall, PSA is not believable
Cows as “family” is not believable
Disbelief that animals are clean, healthy and well
taken care of
“Questionable issues between ‘green’ and ‘farming’.”
“It’s nice to see true concern for the animals.”
“The speaker appears to actually believe in what he is
saying.”
“The barns were impeccably clean…the care for the cows was impressive.”
“I don’t believe animals are family.”
“I have seen many farms and I do not believe most farmers care for
their animals.”
* Categories Less than 5% Not Shown
(n=27)
(n=391)
Very few have a less favorable impression, and little consensus emerges with regard to reasoning.
CONFIDENTIAL & PROPRIETARY INFORMATION Page 36
PSA – “The Land"
CONFIDENTIAL & PROPRIETARY INFORMATION Page 37
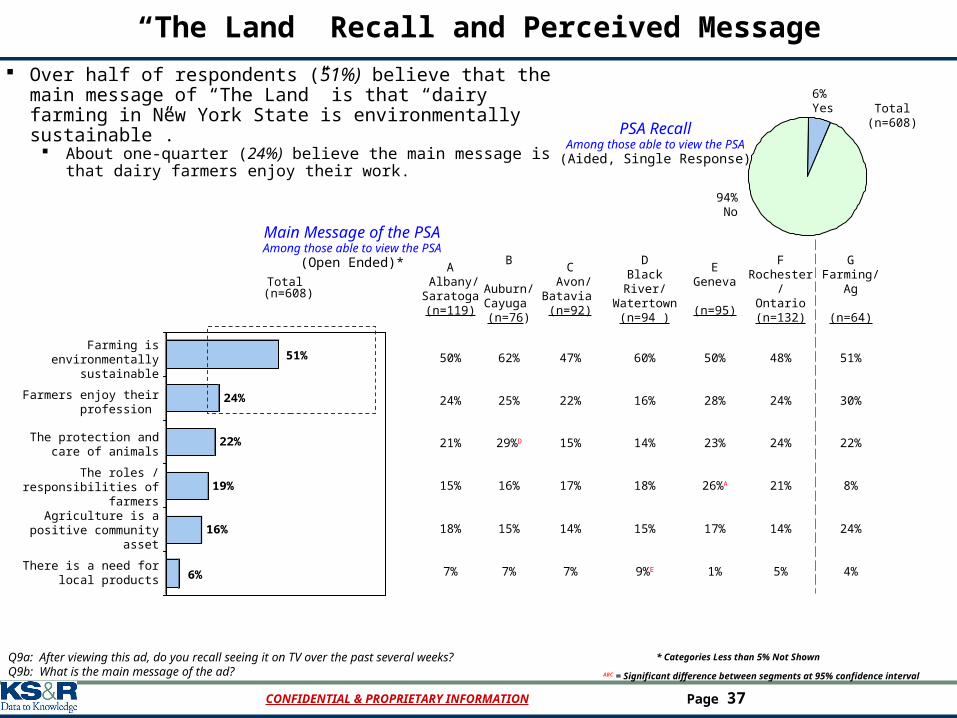
“The Land” Recall and Perceived Message
Over half of respondents (51%) believe that the main message of “The Land” is that “dairy farming in New York State is environmentally sustainable”.
About one-quarter (24%) believe the main message is that dairy farmers enjoy their work.
PSA RecallAmong those able to view the PSA
(Aided, Single Response)
Q9a: After viewing this ad, do you recall seeing it on TV over the past several weeks?Q9b: What is the main message of the ad?
Yes6%
No94%
6%
16%
19%
22%
24%
51%
Total (n=608)
A Albany/Saratoga(n=119)
B Auburn/Cayuga (n=76)
C Avon/
Batavia (n=92)
DBlack River/Watertown
(n=94 )
EGeneva
(n=95)
FRochester/
Ontario(n=132)
GFarming/Ag
(n=64)
Farming is environmentally sustainable
50% 62% 47% 60% 50% 48% 51%
Farmers enjoy their profession
24% 25% 22% 16% 28% 24% 30%
The protection and care of animals
21% 29%D 15% 14% 23% 24% 22%
The roles / responsibilities of farmers
15% 16% 17% 18% 26%A 21% 8%
Agriculture is a positive community asset
18% 15% 14% 15% 17% 14% 24%
There is a need for local products
7% 7% 7% 9%E 1% 5% 4%
Main Message of the PSAAmong those able to view the PSA
(Open Ended)*
6% Yes
94% No
Total(n=608)
ABC = Significant difference between segments at 95% confidence interval
* Categories Less than 5% Not Shown
CONFIDENTIAL & PROPRIETARY INFORMATION Page 38
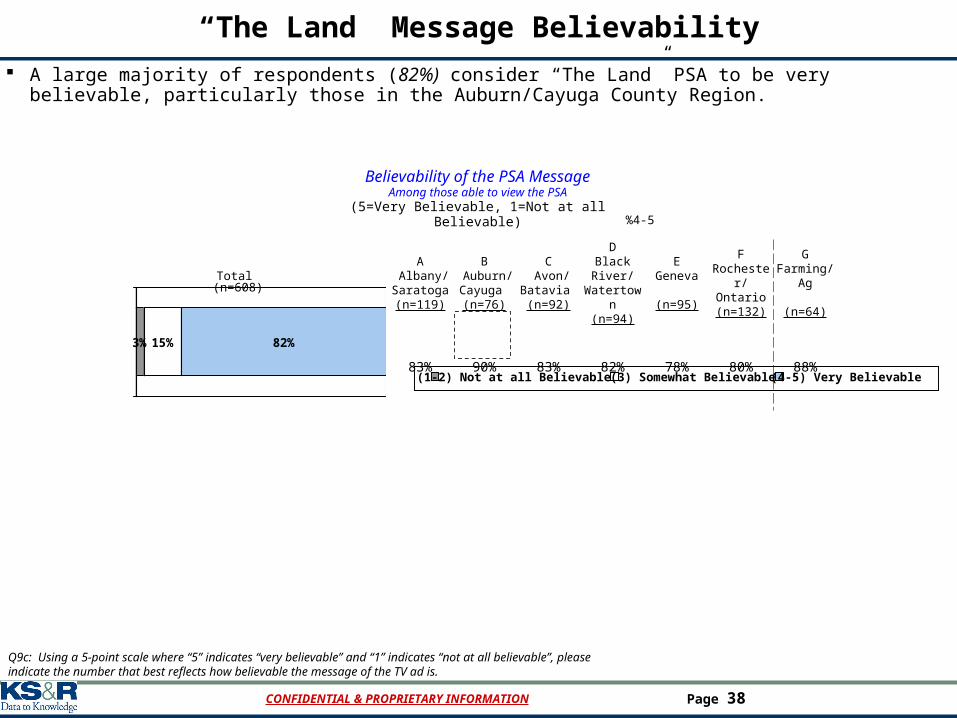
“The Land” Message Believability
A large majority of respondents (82%) consider “The Land” PSA to be very believable, particularly those in the Auburn/Cayuga County Region.
Believability of the PSA MessageAmong those able to view the PSA
(5=Very Believable, 1=Not at all Believable)
Q9c: Using a 5-point scale where “5” indicates “very believable” and “1” indicates “not at all believable”, please indicate the number that best reflects how believable the message of the TV ad is.
(1-2) Not at all Believable (3) Somewhat Believable (4-5) Very Believable
3%15% 82%
%4-5
Total (n=608)
A Albany/Saratoga(n=119)
B Auburn/Cayuga (n=76)
C Avon/
Batavia (n=92)
DBlack River/
Watertown(n=94)
EGeneva
(n=95)
FRochester/
Ontario(n=132)
GFarming/Ag
(n=64)
83% 90% 83% 82% 78% 80% 88%
CONFIDENTIAL & PROPRIETARY INFORMATION Page 39
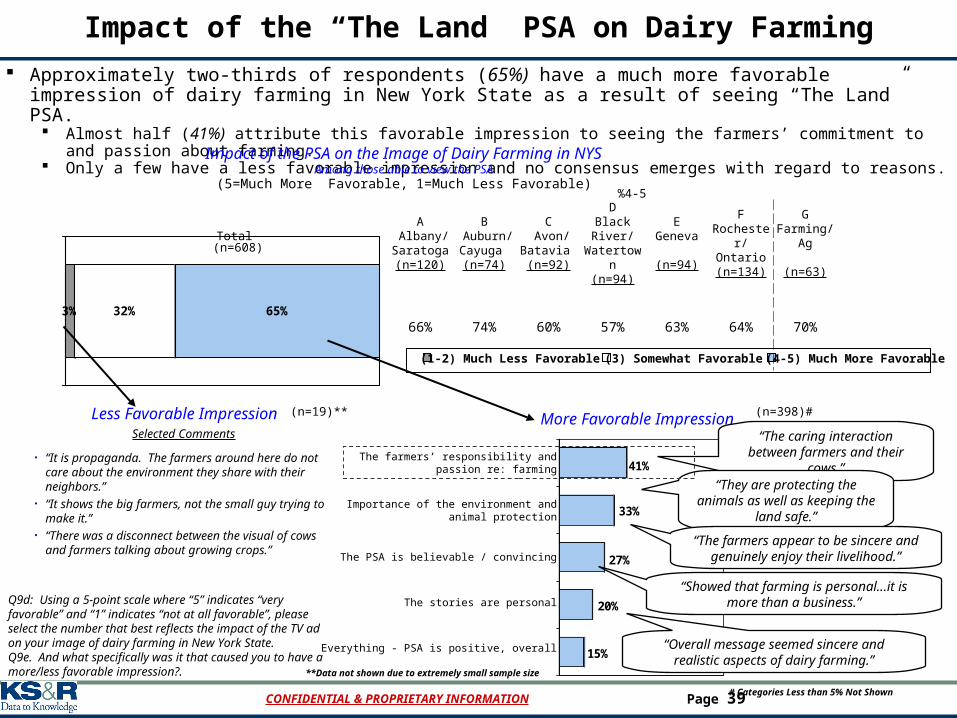
Impact of the “The Land” PSA on Dairy Farming
Approximately two-thirds of respondents (65%) have a much more favorable impression of dairy farming in New York State as a result of seeing “The Land” PSA.
Almost half (41%) attribute this favorable impression to seeing the farmers’ commitment to and passion about farming. Only a few have a less favorable impression and no consensus emerges with regard to reasons.
Impact of the PSA on the Image of Dairy Farming in NYSAmong those able to view the PSA
(5=Much More Favorable, 1=Much Less Favorable)
Q9d: Using a 5-point scale where “5” indicates “very favorable” and “1” indicates “not at all favorable”, please select the number that best reflects the impact of the TV ad on your image of dairy farming in New York State.Q9e. And what specifically was it that caused you to have a more/less favorable impression?.
(1-2) Much Less Favorable (3) Somewhat Favorable (4-5) Much More Favorable
3% 32% 65%
%4-5
Total (n=608)
A Albany/Saratoga(n=120)
B Auburn/Cayuga (n=74)
C Avon/
Batavia (n=92)
DBlack River/
Watertown(n=94)
EGeneva
(n=94)
FRochester/
Ontario(n=134)
GFarming/Ag
(n=63)
66% 74% 60% 57% 63% 64% 70%
15%
20%
27%
33%
41%The farmers’ responsibility and passion re:
farming
Importance of the environment and animal protection
The PSA is believable / convincing
The stories are personal
Everything - PSA is positive, overall
More Favorable ImpressionLess Favorable ImpressionSelected Comments
• “It is propaganda. The farmers around here do not care about the environment they share with their neighbors.”
• “It shows the big farmers, not the small guy trying to make it.”
• “There was a disconnect between the visual of cows and farmers talking about growing crops.”
“The caring interaction between farmers and their cows.”
“They are protecting the animals as well as keeping the land safe.”
“The farmers appear to be sincere and genuinely enjoy their livelihood.”
“Showed that farming is personal…it is more than a business.”
“Overall message seemed sincere and realistic aspects of dairy farming.”
(n=19)** (n=398)#
**Data not shown due to extremely small sample size
# Categories Less than 5% Not Shown
CONFIDENTIAL & PROPRIETARY INFORMATION Page 40
PSA – “Feeding Families”
CONFIDENTIAL & PROPRIETARY INFORMATION Page 41
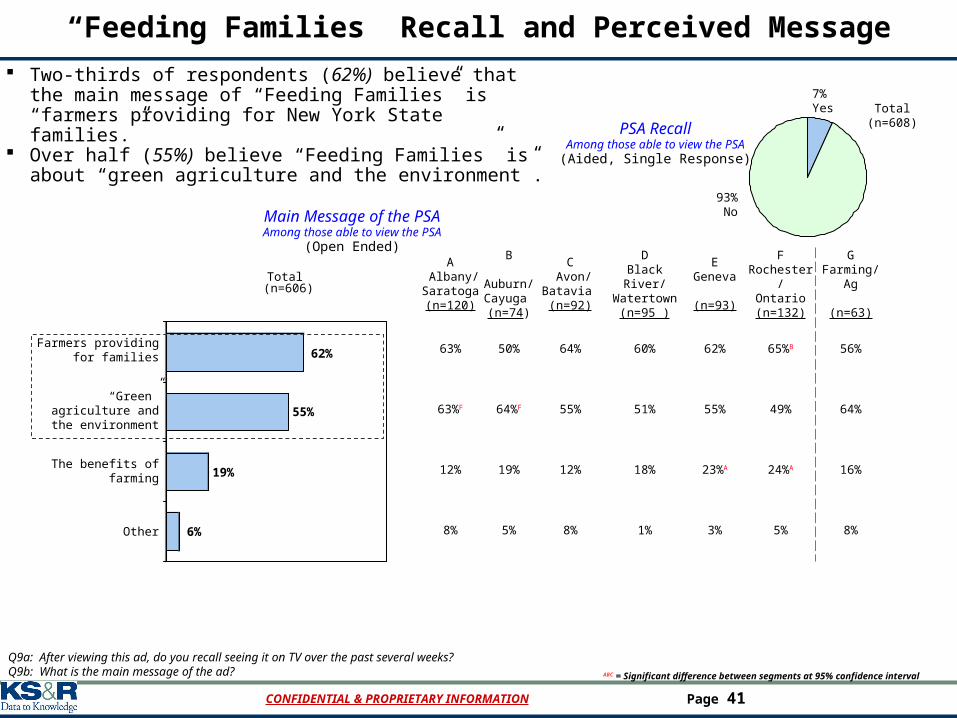
“Feeding Families” Recall and Perceived Message
Two-thirds of respondents (62%) believe that the main message of “Feeding Families” is “farmers providing for New York State families.”
Over half (55%) believe “Feeding Families” is about “green agriculture and the environment”.
PSA RecallAmong those able to view the PSA
(Aided, Single Response)
Q9a: After viewing this ad, do you recall seeing it on TV over the past several weeks?Q9b: What is the main message of the ad?
Yes7%
No93%
6%
19%
55%
62%
Total (n=606)
A Albany/Saratoga(n=120)
B Auburn/Cayuga (n=74)
C Avon/
Batavia (n=92)
DBlack River/Watertown
(n=95 )
EGeneva
(n=93)
FRochester/
Ontario(n=132)
GFarming/Ag
(n=63)
Farmers providing for families
63% 50% 64% 60% 62% 65%B 56%
“Green” agriculture and the environment
63%F 64%F 55% 51% 55% 49% 64%
The benefits of farming 12% 19% 12% 18% 23%A 24%A 16%
Other 8% 5% 8% 1% 3% 5% 8%
Main Message of the PSAAmong those able to view the PSA
(Open Ended)
7% Yes
93% No
Total(n=608)
ABC = Significant difference between segments at 95% confidence interval
CONFIDENTIAL & PROPRIETARY INFORMATION Page 42
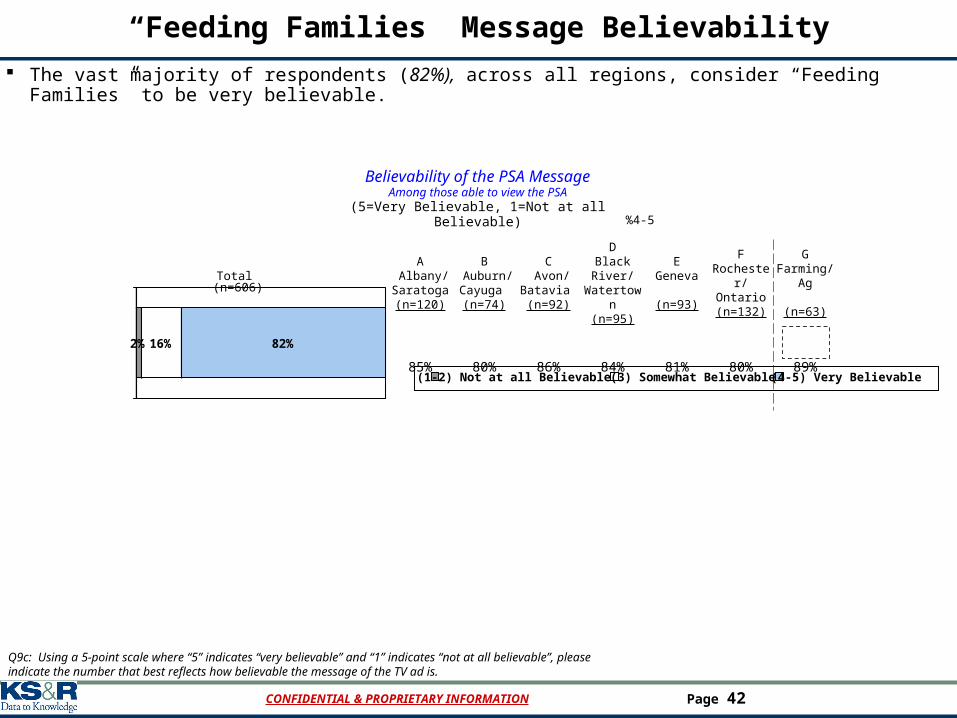
“Feeding Families” Message Believability
The vast majority of respondents (82%), across all regions, consider “Feeding Families” to be very believable.
Believability of the PSA MessageAmong those able to view the PSA
(5=Very Believable, 1=Not at all Believable)
Q9c: Using a 5-point scale where “5” indicates “very believable” and “1” indicates “not at all believable”, please indicate the number that best reflects how believable the message of the TV ad is.
(1-2) Not at all Believable (3) Somewhat Believable (4-5) Very Believable
2%16% 82%
%4-5
Total (n=606)
A Albany/Saratoga(n=120)
B Auburn/Cayuga (n=74)
C Avon/
Batavia (n=92)
DBlack River/
Watertown(n=95)
EGeneva
(n=93)
FRochester/
Ontario(n=132)
GFarming/Ag
(n=63)
85% 80% 86% 84% 81% 80% 89%
CONFIDENTIAL & PROPRIETARY INFORMATION Page 43
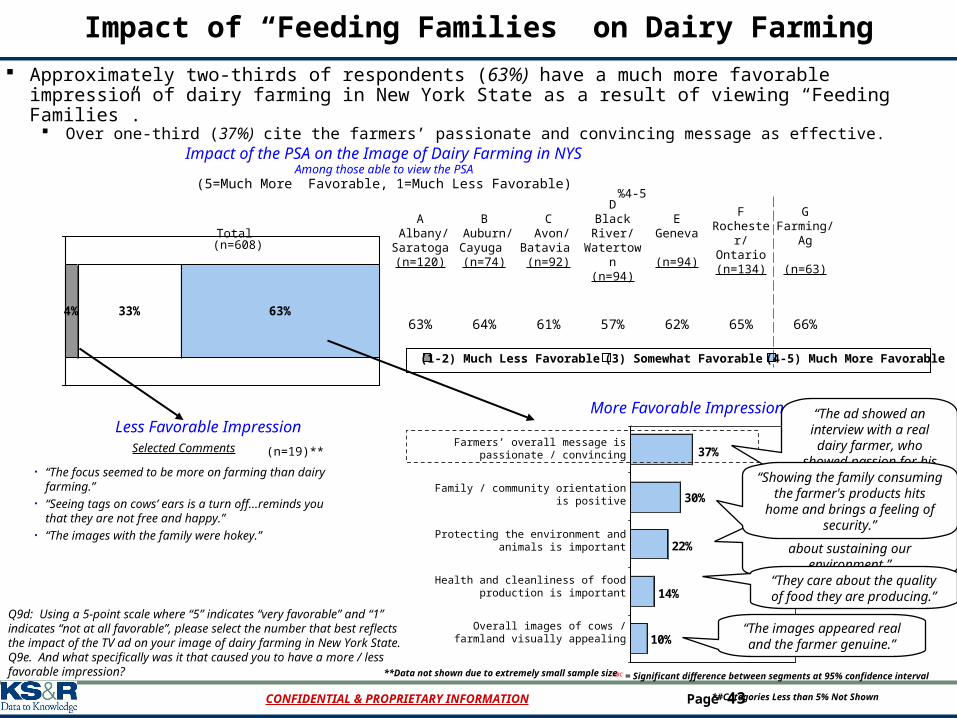
Impact of “Feeding Families” on Dairy Farming
Approximately two-thirds of respondents (63%) have a much more favorable impression of dairy farming in New York State as a result of viewing “Feeding Families”.
Over one-third (37%) cite the farmers’ passionate and convincing message as effective.
Impact of the PSA on the Image of Dairy Farming in NYSAmong those able to view the PSA
(5=Much More Favorable, 1=Much Less Favorable)
Q9d: Using a 5-point scale where “5” indicates “very favorable” and “1” indicates “not at all favorable”, please select the number that best reflects the impact of the TV ad on your image of dairy farming in New York State.Q9e. And what specifically was it that caused you to have a more / less favorable impression?
(1-2) Much Less Favorable (3) Somewhat Favorable (4-5) Much More Favorable
4% 33% 63%
%4-5
ABC = Significant difference between segments at 95% confidence interval
Total (n=608)
A Albany/Saratoga(n=120)
B Auburn/Cayuga (n=74)
C Avon/
Batavia (n=92)
DBlack River/
Watertown(n=94)
EGeneva
(n=94)
FRochester/
Ontario(n=134)
GFarming/Ag
(n=63)
63% 64% 61% 57% 62% 65% 66%
10%
14%
22%
30%
37%Farmers’ overall message is passionate /
convincing
Family / community orientation is positive
Protecting the environment and animals is important
Health and cleanliness of food production is important
Overall images of cows / farmland visually appealing
More Favorable ImpressionLess Favorable Impression
Selected Comments
• “The focus seemed to be more on farming than dairy farming.”
• “Seeing tags on cows’ ears is a turn off…reminds you that they are not free and happy.”
• “The images with the family were hokey.”
(n=19)**
(n=376)#
**Data not shown due to extremely small sample size
*#Categories Less than 5% Not Shown
“We need to be concerned about sustaining our environment.”
“They care about the quality of food they are producing.”
“The ad showed an interview with a real dairy farmer, who
showed passion for his work.”
“Showing the family consuming the farmer's products hits home and
brings a feeling of security.”
“The images appeared real and the farmer genuine.”

CONFIDENTIAL & PROPRIETARY INFORMATION Page 44
Reaction to Coalition BillboardsReaction to Coalition Billboards
CONFIDENTIAL & PROPRIETARY INFORMATION Page 45
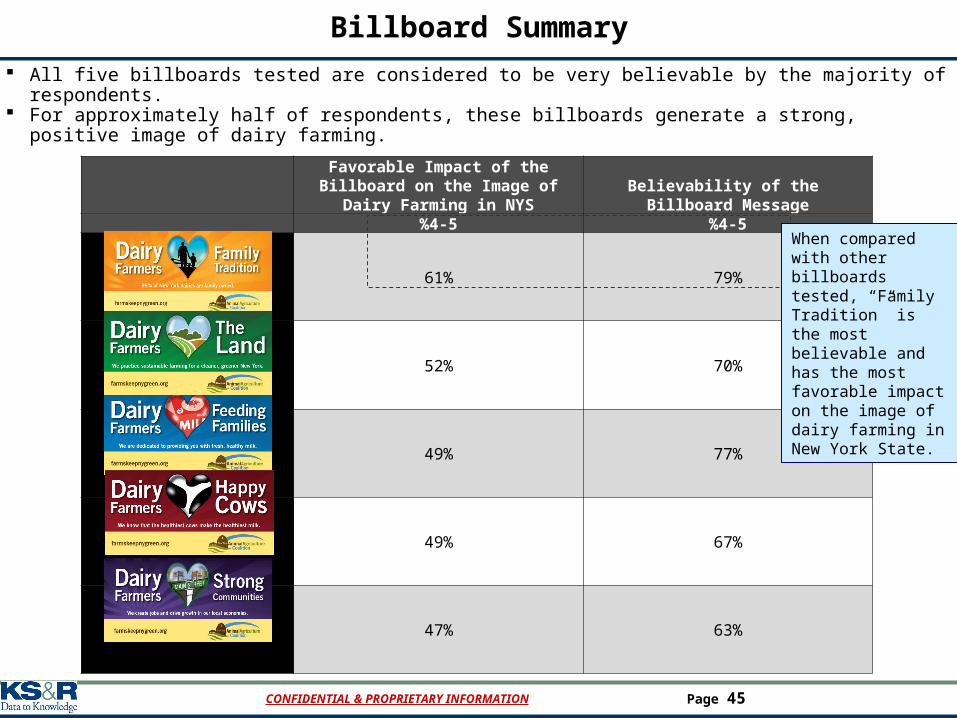
Billboard Summary
Favorable Impact of the Billboard on the Image of Dairy Farming in NYS
Believability of the Billboard Message
%4-5 %4-5
61% 79%
52% 70%
49% 77%
49% 67%
47% 63%
When compared with other billboards tested, “Family Tradition” is the most believable and has the most favorable impact on the image of dairy farming in New York State.
All five billboards tested are considered to be very believable by the majority of respondents. For approximately half of respondents, these billboards generate a strong, positive image of dairy farming.

CONFIDENTIAL & PROPRIETARY INFORMATION Page 46
Billboard – “Happy Cows”
CONFIDENTIAL & PROPRIETARY INFORMATION Page 47
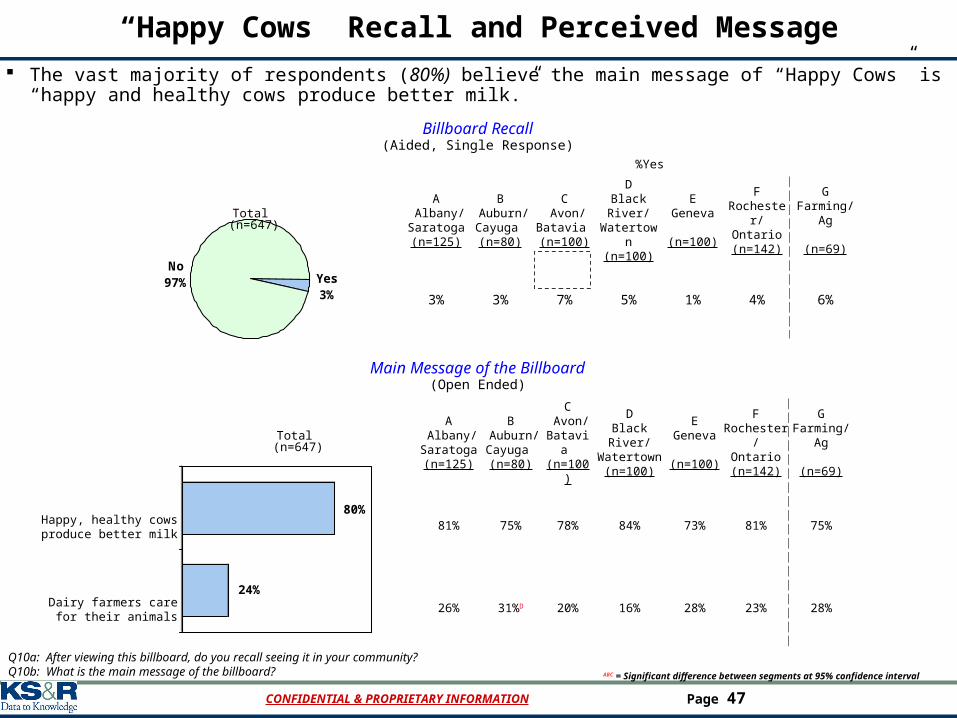
“Happy Cows” Recall and Perceived Message
The vast majority of respondents (80%) believe the main message of “Happy Cows” is “happy and healthy cows produce better milk.”
Billboard Recall(Aided, Single Response)
Q10a: After viewing this billboard, do you recall seeing it in your community?Q10b: What is the main message of the billboard?
Yes3%
No97%
%Yes
Total (n=647)
A Albany/Saratoga(n=125)
B Auburn/Cayuga (n=80)
C Avon/
Batavia (n=100)
DBlack River/
Watertown(n=100)
EGeneva
(n=100)
FRochester/
Ontario(n=142)
GFarming/ Ag
(n=69)
3% 3% 7% 5% 1% 4% 6%
Total (n=647)
A Albany/Saratoga(n=125)
B Auburn/Cayuga (n=80)
C Avon/
Batavia (n=100)
DBlack River/Watertown
(n=100)
EGeneva
(n=100)
FRochester/
Ontario(n=142)
GFarming/
Ag
(n=69)
Happy, healthy cows produce better milk
81% 75% 78% 84% 73% 81% 75%
Dairy farmers care for their animals
26% 31%D 20% 16% 28% 23% 28%
Main Message of the Billboard(Open Ended)
ABC = Significant difference between segments at 95% confidence interval
24%
80%
CONFIDENTIAL & PROPRIETARY INFORMATION Page 48
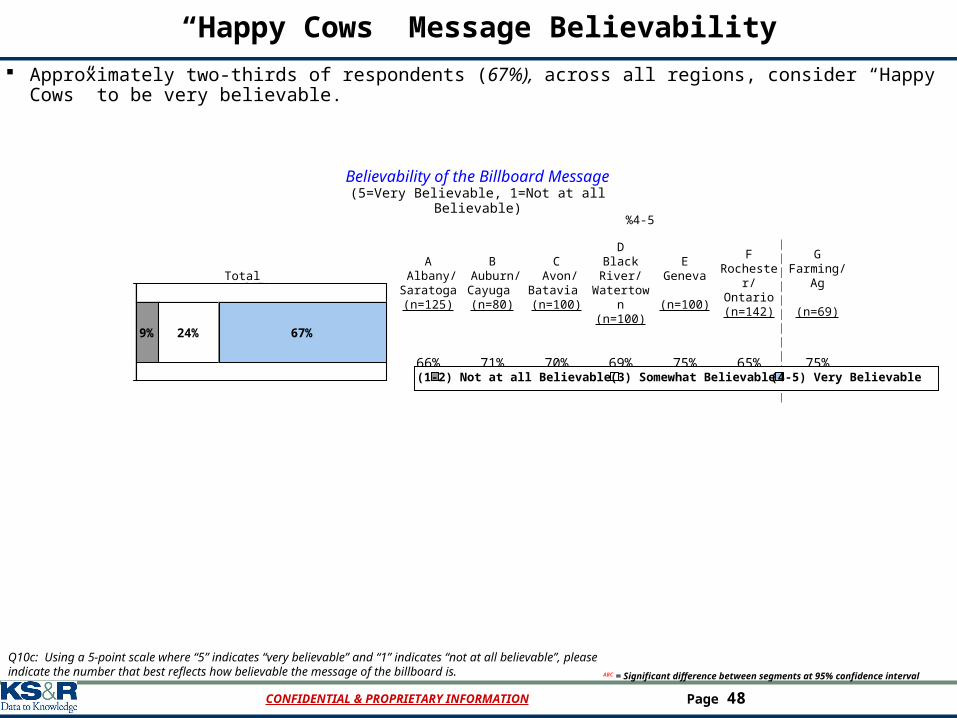
“Happy Cows” Message Believability
Approximately two-thirds of respondents (67%), across all regions, consider “Happy Cows” to be very believable.
Believability of the Billboard Message(5=Very Believable, 1=Not at all Believable)
Q10c: Using a 5-point scale where “5” indicates “very believable” and “1” indicates “not at all believable”, please indicate the number that best reflects how believable the message of the billboard is.
%4-5
Total (n=647)
A Albany/Saratoga(n=125)
B Auburn/Cayuga (n=80)
C Avon/
Batavia (n=100)
DBlack River/
Watertown(n=100)
EGeneva
(n=100)
FRochester/
Ontario(n=142)
GFarming/ Ag
(n=69)
66% 71% 70% 69% 75% 65% 75%
ABC = Significant difference between segments at 95% confidence interval
9% 24% 67%
(1-2) Not at all Believable (3) Somewhat Believable (4-5) Very Believable
CONFIDENTIAL & PROPRIETARY INFORMATION Page 49
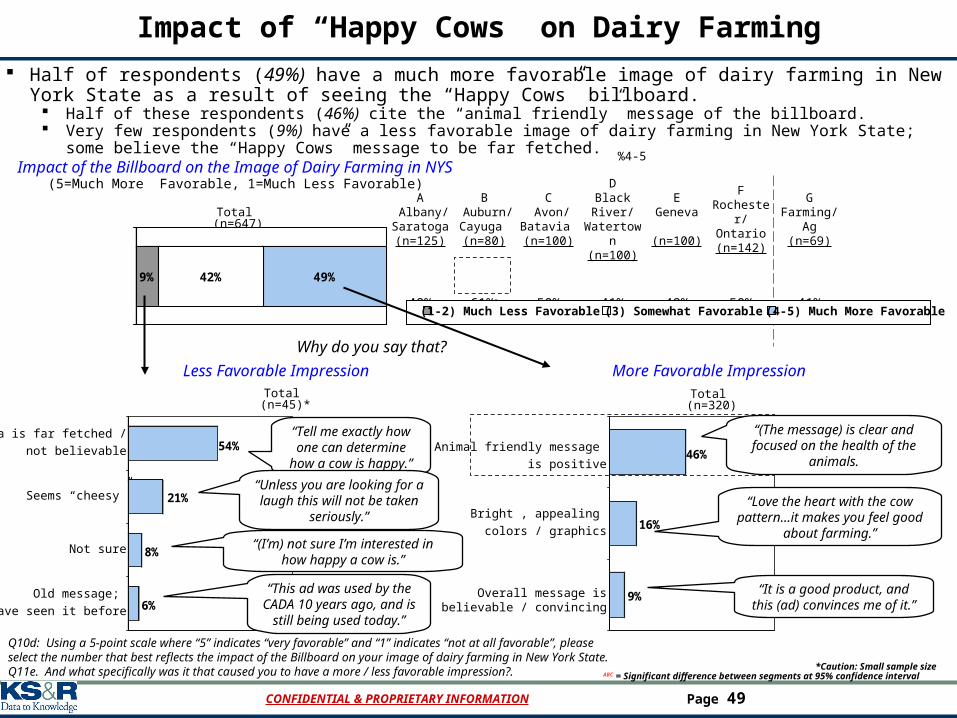
Impact of “Happy Cows” on Dairy Farming
Half of respondents (49%) have a much more favorable image of dairy farming in New York State as a result of seeing the “Happy Cows” billboard.
Half of these respondents (46%) cite the “animal friendly” message of the billboard. Very few respondents (9%) have a less favorable image of dairy farming in New York State; some believe the “Happy Cows”
message to be far fetched.Impact of the Billboard on the Image of Dairy Farming in NYS
(5=Much More Favorable, 1=Much Less Favorable)
*Caution: Small sample size
%4-5
ABC = Significant difference between segments at 95% confidence interval
Total (n=647)
A Albany/Saratoga(n=125)
B Auburn/Cayuga (n=80)
C Avon/
Batavia (n=100)
DBlack River/
Watertown(n=100)
EGeneva
(n=100)
FRochester/
Ontario(n=142)
GFarming/ Ag
(n=69)
48% 61%D 50% 41% 49% 50% 41%9% 42% 49%
(1-2) Much Less Favorable (3) Somewhat Favorable (4-5) Much More Favorable
9%
16%
46%
Why do you say that?
Animal friendly message
is positive
Bright , appealing
colors / graphics
Overall message is believable / convincing
More Favorable ImpressionLess Favorable ImpressionTotal
(n=45)*Total
(n=320)
6%
8%
21%
54%Idea is far fetched /
not believable
Seems “cheesy”
Not sure
Old message;
have seen it before
Q10d: Using a 5-point scale where “5” indicates “very favorable” and “1” indicates “not at all favorable”, please select the number that best reflects the impact of the Billboard on your image of dairy farming in New York State.Q11e. And what specifically was it that caused you to have a more / less favorable impression?.
“Tell me exactly how one can determine how a cow
is happy.”
“Unless you are looking for a laugh this will not be taken seriously.”
“(I’m) not sure I’m interested in how happy a cow is.”
“This ad was used by the CADA 10 years ago, and is still being
used today.”
“(The message) is clear and focused on the health of the animals.
“Love the heart with the cow pattern…it makes you feel good about farming.”
“It is a good product, and this (ad) convinces me of it.”
CONFIDENTIAL & PROPRIETARY INFORMATION Page 50
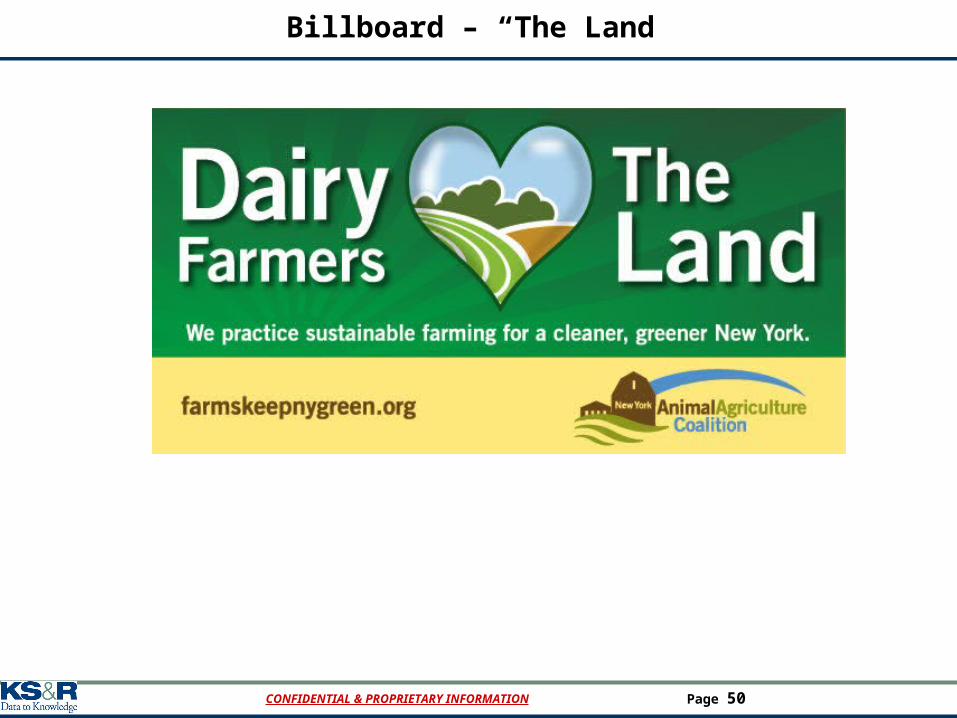
Billboard – “The Land”
CONFIDENTIAL & PROPRIETARY INFORMATION Page 51
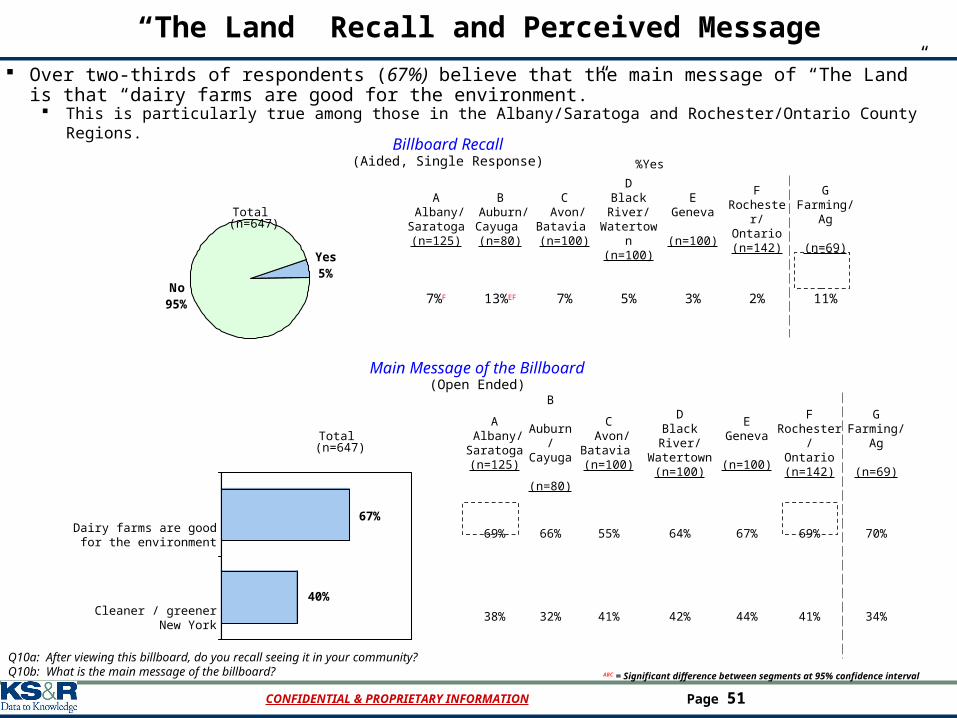
“The Land” Recall and Perceived Message
Over two-thirds of respondents (67%) believe that the main message of “The Land” is that “dairy farms are good for the environment.”
This is particularly true among those in the Albany/Saratoga and Rochester/Ontario County Regions.
Billboard Recall(Aided, Single Response)
Q10a: After viewing this billboard, do you recall seeing it in your community?Q10b: What is the main message of the billboard?
Yes5%
No95%
%Yes
Total (n=647)
A Albany/Saratoga(n=125)
B Auburn/Cayuga (n=80)
C Avon/
Batavia (n=100)
DBlack River/
Watertown(n=100)
EGeneva
(n=100)
FRochester/
Ontario(n=142)
GFarming/ Ag
(n=69)
7%F 13%EF 7% 5% 3% 2% 11%
ABC = Significant difference between segments at 95% confidence interval
Total (n=647)
A Albany/Saratoga(n=125)
B Auburn/Cayuga (n=80)
C Avon/
Batavia (n=100)
DBlack River/Watertown
(n=100)
EGeneva
(n=100)
FRochester/
Ontario(n=142)
GFarming/ Ag
(n=69)
Dairy farms are good for the environment
69% 66% 55% 64% 67% 69% 70%
Cleaner / greener New York
38% 32% 41% 42% 44% 41% 34%
Main Message of the Billboard(Open Ended)
40%
67%

CONFIDENTIAL & PROPRIETARY INFORMATION Page 52
“The Land” Message Believability
Nearly three-quarters (70%) of respondents find the message of “The Land” to be very believable.
Believability of the Billboard Message(5=Very Believable, 1=Not at all Believable)
%4-5
Total (n=647)
A Albany/Saratoga(n=125)
B Auburn/Cayuga (n=80)
C Avon/
Batavia (n=100)
DBlack River/Watertown
(n=100)
EGeneva
(n=100)
FRochester/
Ontario(n=142)
GFarming/
Ag
(n=69)
68% 70% 70% 70%A 73% 71%A 72%
ABC = Significant difference between segments at 95% confidence interval
5% 25% 70%
(1-2) Not at all Believable (3) Somewhat Believable (4-5) Very Believable
Q10c: Using a 5-point scale where “5” indicates “very believable” and “1” indicates “not at all believable”, please indicate the number that best reflects how believable the message of the billboard is.
CONFIDENTIAL & PROPRIETARY INFORMATION Page 53
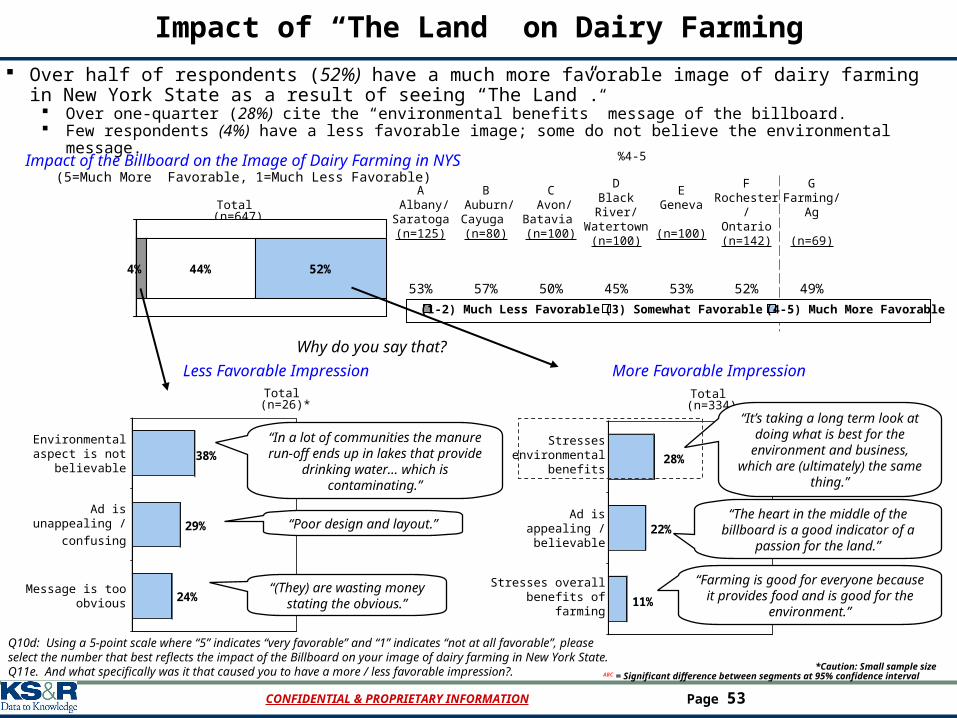
Impact of “The Land” on Dairy Farming
Over half of respondents (52%) have a much more favorable image of dairy farming in New York State as a result of seeing “The Land”.
Over one-quarter (28%) cite the “environmental benefits” message of the billboard. Few respondents (4%) have a less favorable image; some do not believe the environmental message.
Impact of the Billboard on the Image of Dairy Farming in NYS(5=Much More Favorable, 1=Much Less Favorable)
*Caution: Small sample size
%4-5
ABC = Significant difference between segments at 95% confidence interval
Total (n=647)
A Albany/Saratoga(n=125)
B Auburn/Cayuga (n=80)
C Avon/
Batavia (n=100)
DBlack River/Watertown
(n=100)
EGeneva
(n=100)
FRochester/
Ontario(n=142)
GFarming/
Ag
(n=69)
53% 57% 50% 45% 53% 52% 49%4% 44% 52%
(1-2) Much Less Favorable (3) Somewhat Favorable (4-5) Much More Favorable
11%
22%
28%
Why do you say that?
Stresses environmental
benefits
Ad is appealing / believable
Stresses overall benefits of farming
More Favorable ImpressionLess Favorable ImpressionTotal
(n=26)*Total
(n=334)
24%
29%
38%Environmental aspect
is not believable
Ad is unappealing /
confusing
Message is too obvious
Q10d: Using a 5-point scale where “5” indicates “very favorable” and “1” indicates “not at all favorable”, please select the number that best reflects the impact of the Billboard on your image of dairy farming in New York State.Q11e. And what specifically was it that caused you to have a more / less favorable impression?.
“In a lot of communities the manure run-off ends up in lakes that provide drinking water…
which is contaminating.”
“Poor design and layout.”
“(They) are wasting money stating the obvious.”
“It’s taking a long term look at doing what is best for the environment and business, which are (ultimately) the
same thing.”
“The heart in the middle of the billboard is a good indicator of a passion for the land.”
“Farming is good for everyone because it provides food and is good for the environment.”
CONFIDENTIAL & PROPRIETARY INFORMATION Page 54
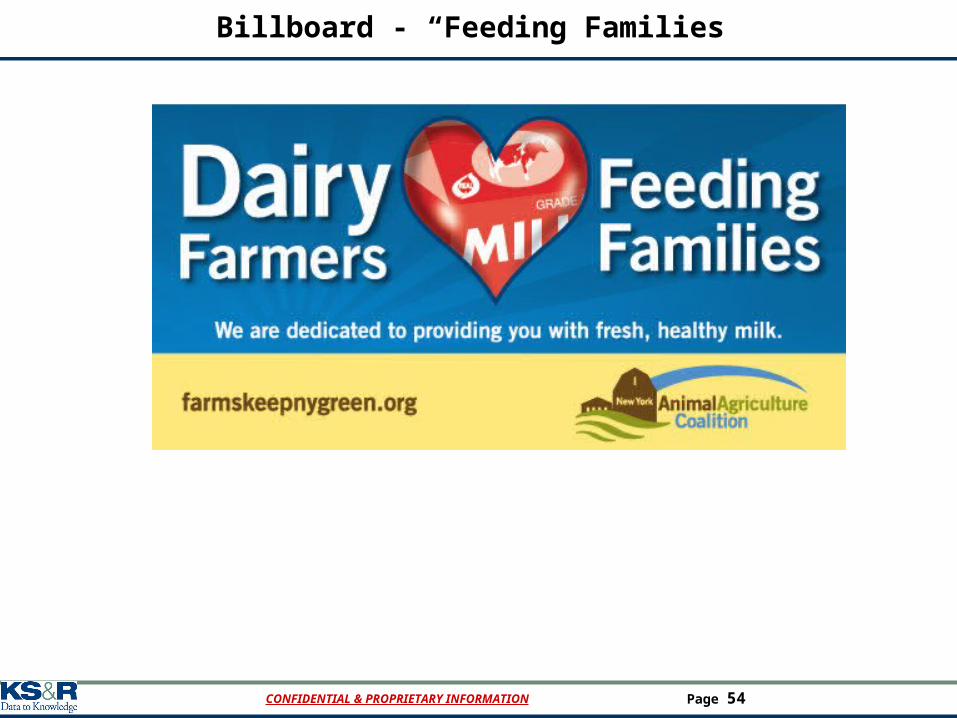
Billboard - “Feeding Families”
CONFIDENTIAL & PROPRIETARY INFORMATION Page 55
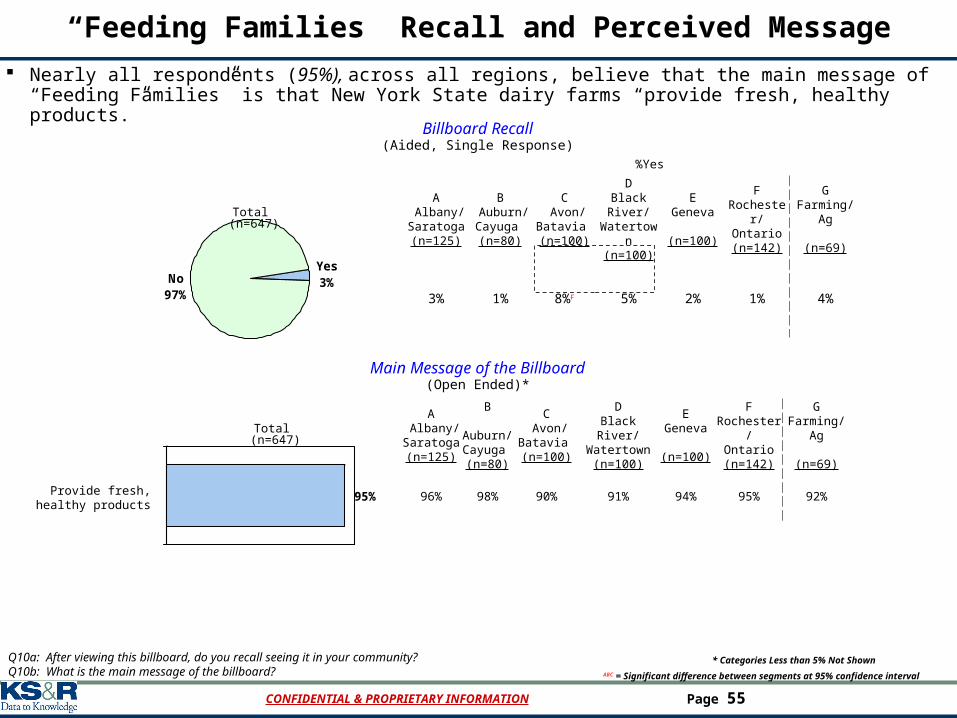
“Feeding Families” Recall and Perceived Message
Nearly all respondents (95%), across all regions, believe that the main message of “Feeding Families” is that New York State dairy farms “provide fresh, healthy products.”
Billboard Recall(Aided, Single Response)
Q10a: After viewing this billboard, do you recall seeing it in your community?Q10b: What is the main message of the billboard?
Yes3%No
97%
%Yes
Total (n=647)
A Albany/Saratoga(n=125)
B Auburn/Cayuga (n=80)
C Avon/
Batavia (n=100)
DBlack River/
Watertown(n=100)
EGeneva
(n=100)
FRochester/
Ontario(n=142)
GFarming/ Ag
(n=69)
3% 1% 8%F 5% 2% 1% 4%
95%
Total (n=647)
A Albany/Saratoga(n=125)
B Auburn/Cayuga (n=80)
C Avon/
Batavia (n=100)
DBlack River/Watertown
(n=100)
EGeneva
(n=100)
FRochester/
Ontario(n=142)
GFarming/ Ag
(n=69)
Provide fresh, healthy products
96% 98% 90% 91% 94% 95% 92%
Main Message of the Billboard(Open Ended)*
ABC = Significant difference between segments at 95% confidence interval
* Categories Less than 5% Not Shown
CONFIDENTIAL & PROPRIETARY INFORMATION Page 56
“Feeding Families” Message Believability
More than three-quarters of respondents (77%) consider “Feeding Families” to be very believable. This is particularly true among those in the Geneva Region.
Believability of the Billboard Message(5=Very Believable, 1=Not at all Believable)
Q10c: Using a 5-point scale where “5” indicates “very believable” and “1” indicates “not at all believable”, please indicate the number that best reflects how believable the message of the billboard is.
(1-2) Not at all Believable (3) Somewhat Believable (4-5) Very Believable
%4-5
Total (n=647)
A Albany/Saratoga(n=125)
B Auburn/Cayuga (n=80)
C Avon/
Batavia (n=100)
DBlack River/
Watertown(n=100)
EGeneva
(n=100)
FRochester/
Ontario(n=142)
GFarming/ Ag
(n=69)
76% 76% 76% 77% 85% 76% 84%3% 20% 77%
CONFIDENTIAL & PROPRIETARY INFORMATION Page 57
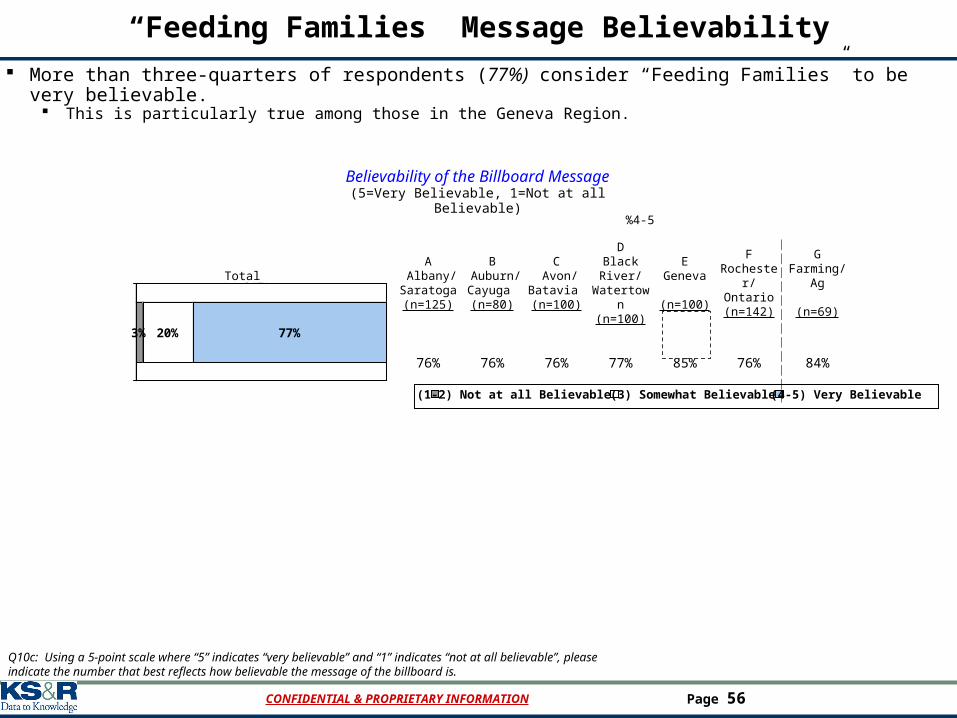
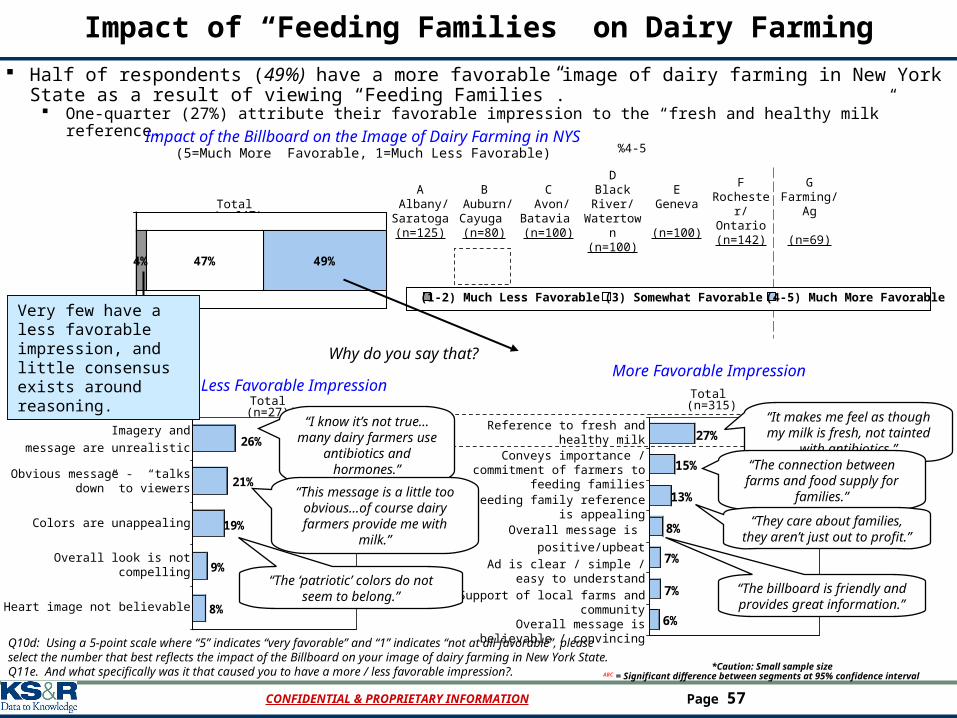
Impact of “Feeding Families” on Dairy Farming
Half of respondents (49%) have a more favorable image of dairy farming in New York State as a result of viewing “Feeding Families”.
One-quarter (27%) attribute their favorable impression to the “fresh and healthy milk” reference.
Impact of the Billboard on the Image of Dairy Farming in NYS(5=Much More Favorable, 1=Much Less Favorable)
Q10d: Using a 5-point scale where “5” indicates “very favorable” and “1” indicates “not at all favorable”, please select the number that best reflects the impact of the Billboard on your image of dairy farming in New York State.Q11e. And what specifically was it that caused you to have a more / less favorable impression?.
%4-5
ABC = Significant difference between segments at 95% confidence interval
Total (n=647)
A Albany/Saratoga(n=125)
B Auburn/Cayuga (n=80)
C Avon/
Batavia (n=100)
DBlack River/
Watertown(n=100)
EGeneva
(n=100)
FRochester/
Ontario(n=142)
GFarming/ Ag
(n=69)
50% 57%D 50% 41% 48% 48% 47%
6%
7%
7%
8%
13%
15%
27%
Why do you say that?
Reference to fresh and healthy milk
Conveys importance / commitment of farmers to feeding families
Feeding family reference is appealing
Overall message is
positive/upbeat
Ad is clear / simple / easy to understand
Support of local farms and community
Overall message is believable / convincing
More Favorable ImpressionLess Favorable Impression
4% 47% 49%
(1-2) Much Less Favorable (3) Somewhat Favorable (4-5) Much More Favorable
Total (n=27)*
Total (n=315)
8%
9%
19%
21%
26%Imagery and
message are unrealistic
Obvious message - “talks down” to viewers
Colors are unappealing
Overall look is not compelling
Heart image not believable
*Caution: Small sample size
“I know it’s not true…many dairy farmers use antibiotics
and hormones.”
“It makes me feel as though my milk is fresh, not tainted with antibiotics.”
“The connection between farms and food supply for families.”
“They care about families, they aren’t just out to profit.”
“The billboard is friendly and provides great information.”
“This message is a little too obvious…of course dairy farmers
provide me with milk.”
“The ‘patriotic’ colors do not seem to belong.”
Very few have a less favorable impression, and little consensus exists around reasoning.

CONFIDENTIAL & PROPRIETARY INFORMATION Page 58
Billboard – “Family Tradition”
CONFIDENTIAL & PROPRIETARY INFORMATION Page 59
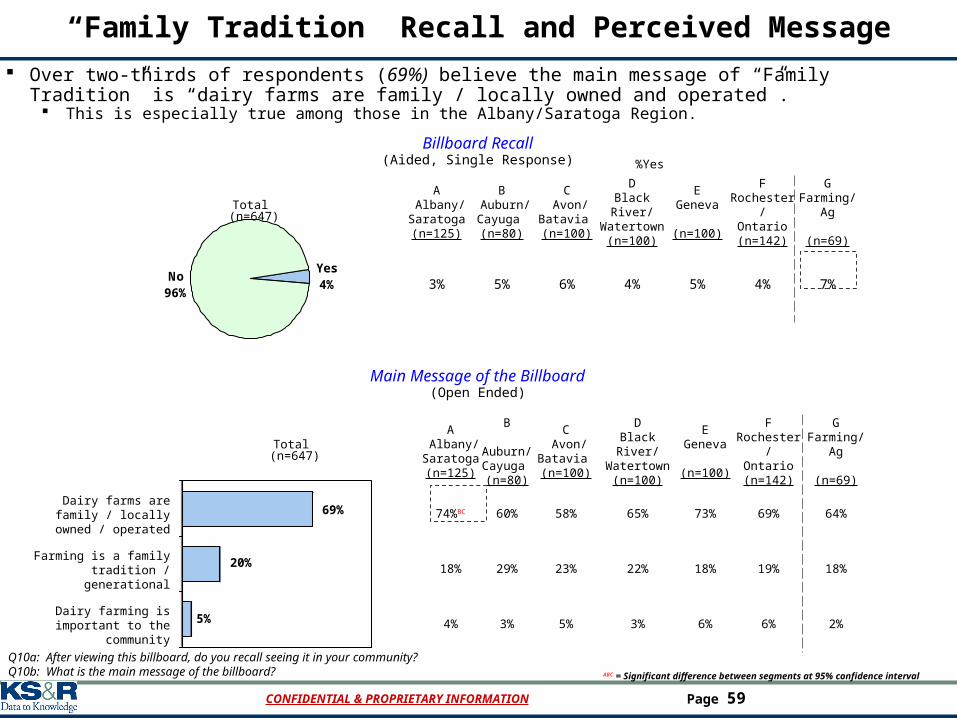
“Family Tradition” Recall and Perceived Message
Over two-thirds of respondents (69%) believe the main message of “Family Tradition” is “dairy farms are family / locally owned and operated”.
This is especially true among those in the Albany/Saratoga Region.
Billboard Recall(Aided, Single Response)
Q10a: After viewing this billboard, do you recall seeing it in your community?Q10b: What is the main message of the billboard?
Yes4%
No96%
%Yes
Total (n=647)
A Albany/Saratoga(n=125)
B Auburn/Cayuga (n=80)
C Avon/
Batavia (n=100)
DBlack River/Watertown
(n=100)
EGeneva
(n=100)
FRochester/
Ontario(n=142)
GFarming/
Ag
(n=69)
3% 5% 6% 4% 5% 4% 7%
ABC = Significant difference between segments at 95% confidence interval
Total (n=647)
A Albany/Saratoga(n=125)
B Auburn/Cayuga (n=80)
C Avon/
Batavia (n=100)
DBlack River/Watertown
(n=100)
EGeneva
(n=100)
FRochester/
Ontario(n=142)
GFarming/ Ag
(n=69)
Dairy farms are family / locally owned / operated
74%BC 60% 58% 65% 73% 69% 64%
Farming is a family tradition / generational
18% 29% 23% 22% 18% 19% 18%
Dairy farming is important to the community
4% 3% 5% 3% 6% 6% 2%
Main Message of the Billboard(Open Ended)
5%
20%
69%
CONFIDENTIAL & PROPRIETARY INFORMATION Page 60
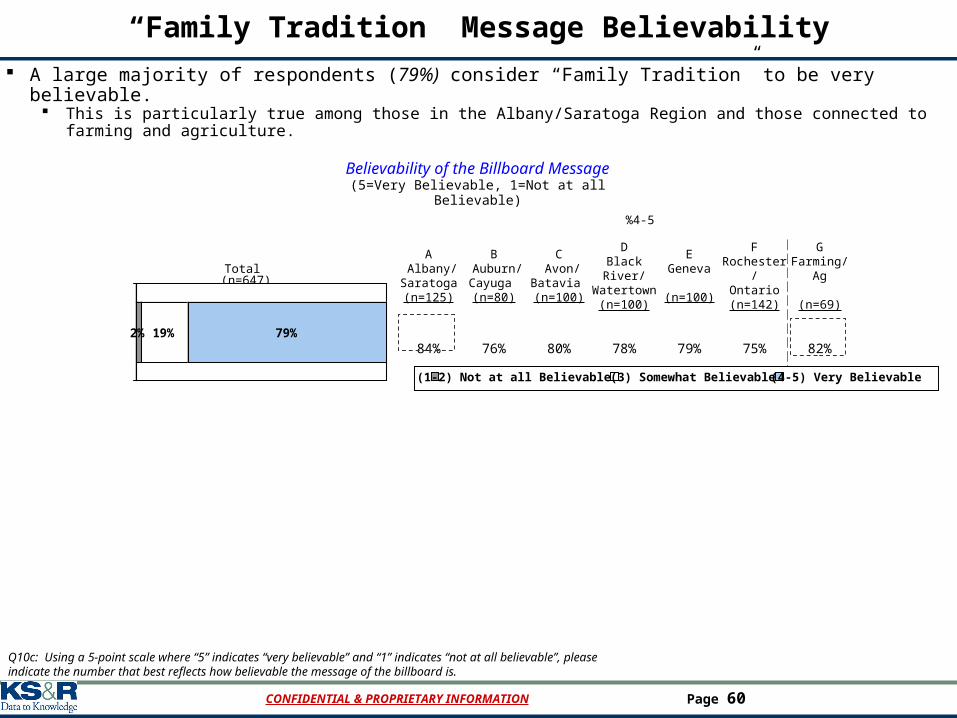
“Family Tradition” Message Believability
A large majority of respondents (79%) consider “Family Tradition” to be very believable. This is particularly true among those in the Albany/Saratoga Region and those connected to farming and agriculture.
Believability of the Billboard Message(5=Very Believable, 1=Not at all Believable)
%4-5
Total (n=647)
A Albany/Saratoga(n=125)
B Auburn/Cayuga (n=80)
C Avon/
Batavia (n=100)
DBlack River/Watertown
(n=100)
EGeneva
(n=100)
FRochester/
Ontario(n=142)
GFarming/
Ag
(n=69)
84% 76% 80% 78% 79% 75% 82%2% 19% 79%
(1-2) Not at all Believable (3) Somewhat Believable (4-5) Very Believable
Q10c: Using a 5-point scale where “5” indicates “very believable” and “1” indicates “not at all believable”, please indicate the number that best reflects how believable the message of the billboard is.
CONFIDENTIAL & PROPRIETARY INFORMATION Page 61
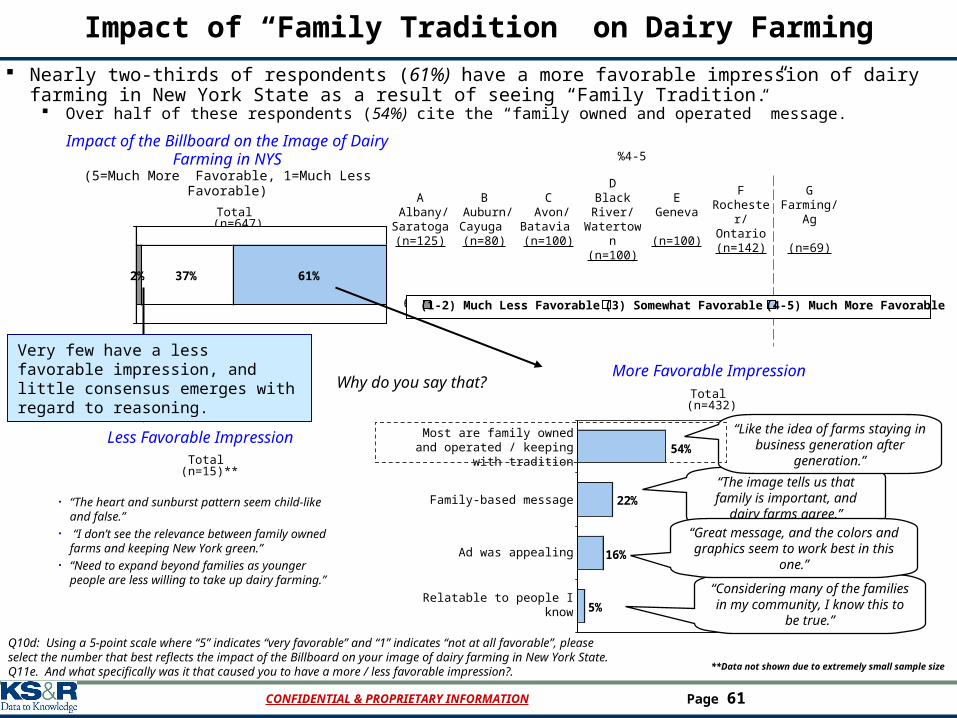
Impact of “Family Tradition” on Dairy Farming
Nearly two-thirds of respondents (61%) have a more favorable impression of dairy farming in New York State as a result of seeing “Family Tradition.”
Over half of these respondents (54%) cite the “family owned and operated” message.
Impact of the Billboard on the Image of Dairy Farming in NYS
(5=Much More Favorable, 1=Much Less Favorable)
**Data not shown due to extremely small sample size
%4-5
Total (n=647)
A Albany/Saratoga(n=125)
B Auburn/Cayuga (n=80)
C Avon/
Batavia (n=100)
DBlack River/
Watertown(n=100)
EGeneva
(n=100)
FRochester/
Ontario(n=142)
GFarming/ Ag
(n=69)
69%CE 67% 54% 55% 55% 56% 64%2% 37% 61%
5%
16%
22%
54%
Why do you say that?
Most are family owned and operated / keeping with
tradition
Family-based message
Ad was appealing
Relatable to people I know
More Favorable Impression
Less Favorable ImpressionTotal
(n=15)**
Total (n=432)
(1-2) Much Less Favorable (3) Somewhat Favorable (4-5) Much More Favorable
Q10d: Using a 5-point scale where “5” indicates “very favorable” and “1” indicates “not at all favorable”, please select the number that best reflects the impact of the Billboard on your image of dairy farming in New York State.Q11e. And what specifically was it that caused you to have a more / less favorable impression?.
“Considering many of the families in my community, I know this to be true.”
“The image tells us that family is important, and dairy farms agree.”
“Great message, and the colors and graphics seem to work best in this one.”
“Like the idea of farms staying in business generation after generation.”
• “The heart and sunburst pattern seem child-like and false.”
• “I don’t see the relevance between family owned farms and keeping New York green.”
• “Need to expand beyond families as younger people are less willing to take up dairy farming.”
Very few have a less favorable impression, and little consensus emerges with regard to reasoning.

CONFIDENTIAL & PROPRIETARY INFORMATION Page 62
Billboard – “Strong Communities”

CONFIDENTIAL & PROPRIETARY INFORMATION Page 63
“Strong Communities” Recall and Perceived Message
Half of respondents (50%) believe the main message of “Strong Communities” is “dairy farming in New York State creates jobs.”
This is particularly true among those in the Geneva and Rochester/Ontario County Regions.Billboard Recall
(Aided, Single Response)
Q10a: After viewing this billboard, do you recall seeing it in your community?Q10b: What is the main message of the billboard?
Yes2%No
98%
%Yes
Total (n=647)
A Albany/Saratoga(n=125)
B Auburn/Cayuga (n=80)
C Avon/
Batavia (n=100)
DBlack River/Watertown
(n=100)
EGeneva
(n=100)
FRochester/
Ontario(n=142)
GFarming/
Ag
(n=69)
4% 1% 5% 1% 2% 1% 4%
ABC = Significant difference between segments at 95% confidence interval
Total (n=644)
A Albany/Saratoga(n=125)
B Auburn/Cayuga (n=79)
C Avon/
Batavia (n=99)
DBlack River/Watertown
(n=100)
EGeneva
(n=99)
FRochester/
Ontario(n=142)
GFarming/ Ag
(n=68)
Promotes creation of jobs 46% 49% 48% 46% 54% 53% 48%
Creates a sense of community / family
41% 37% 34% 44% 32% 34% 31%
Farming stimulates the economy
28% 30% 32% 27% 34% 38%A 45%
Main Message of the Billboard(Open Ended)
33%
37%
50%
CONFIDENTIAL & PROPRIETARY INFORMATION Page 64
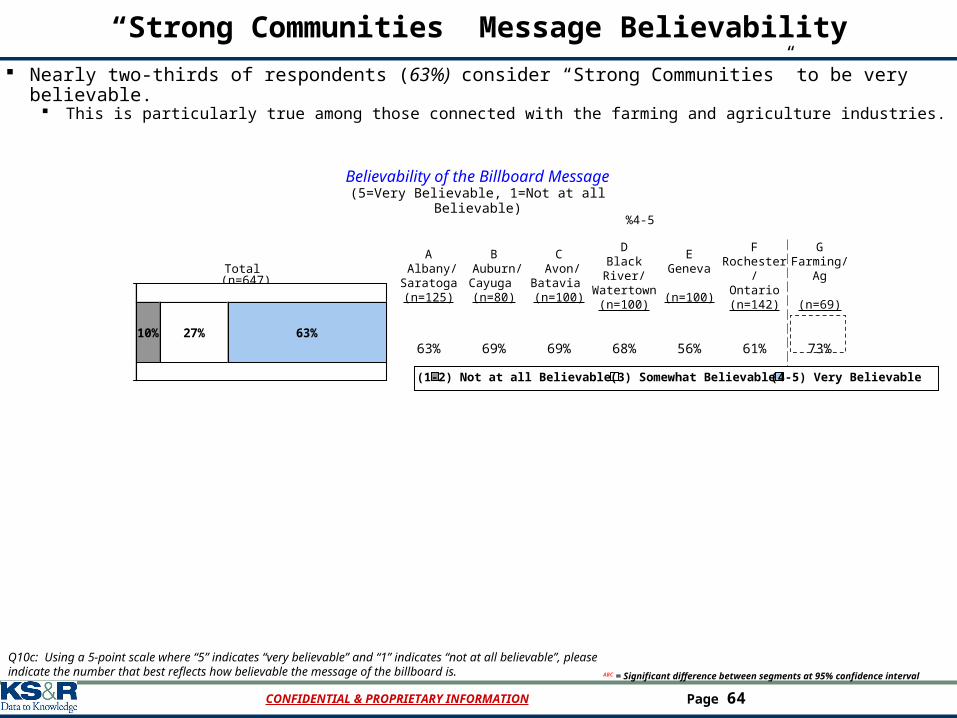
“Strong Communities” Message Believability
Nearly two-thirds of respondents (63%) consider “Strong Communities” to be very believable. This is particularly true among those connected with the farming and agriculture industries.
Believability of the Billboard Message(5=Very Believable, 1=Not at all Believable)
%4-5
Total (n=647)
A Albany/Saratoga(n=125)
B Auburn/Cayuga (n=80)
C Avon/
Batavia (n=100)
DBlack River/Watertown
(n=100)
EGeneva
(n=100)
FRochester/
Ontario(n=142)
GFarming/
Ag
(n=69)
63% 69% 69% 68% 56% 61% 73%
ABC = Significant difference between segments at 95% confidence interval
10% 27% 63%
(1-2) Not at all Believable (3) Somewhat Believable (4-5) Very Believable
Q10c: Using a 5-point scale where “5” indicates “very believable” and “1” indicates “not at all believable”, please indicate the number that best reflects how believable the message of the billboard is.
CONFIDENTIAL & PROPRIETARY INFORMATION Page 65
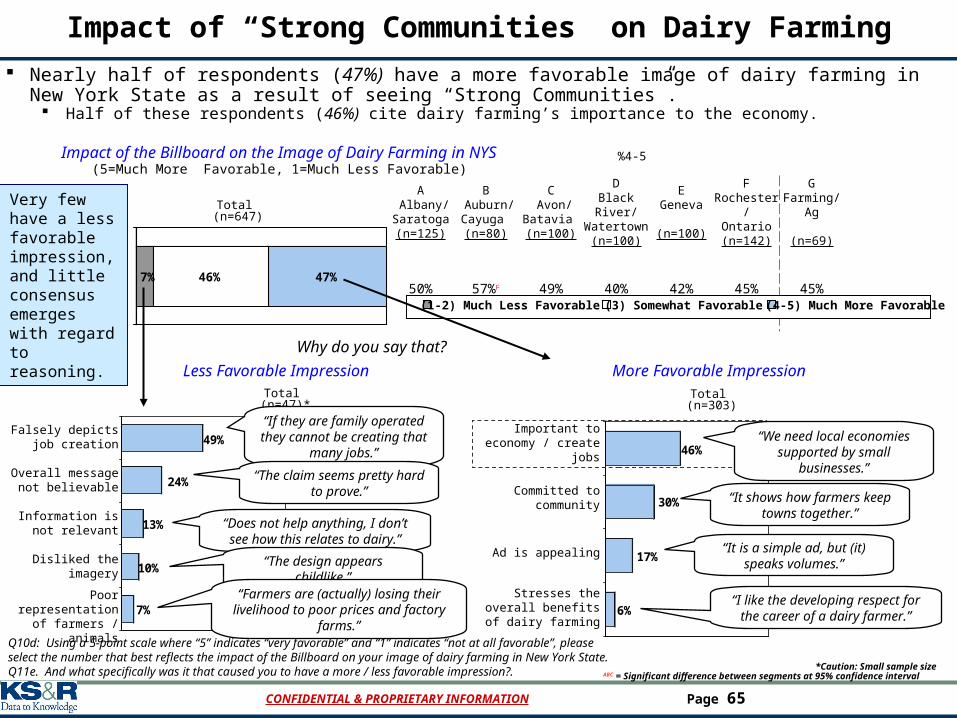
Impact of “Strong Communities” on Dairy Farming
Nearly half of respondents (47%) have a more favorable image of dairy farming in New York State as a result of seeing “Strong Communities”.
Half of these respondents (46%) cite dairy farming’s importance to the economy.
Impact of the Billboard on the Image of Dairy Farming in NYS(5=Much More Favorable, 1=Much Less Favorable)
*Caution: Small sample size
%4-5
ABC = Significant difference between segments at 95% confidence interval
Total (n=647)
A Albany/Saratoga(n=125)
B Auburn/Cayuga (n=80)
C Avon/
Batavia (n=100)
DBlack River/Watertown
(n=100)
EGeneva
(n=100)
FRochester/
Ontario(n=142)
GFarming/
Ag
(n=69)
50% 57%F 49% 40% 42% 45% 45%7% 46% 47%
(1-2) Much Less Favorable (3) Somewhat Favorable (4-5) Much More Favorable
6%
17%
30%
46%
Why do you say that?
Important to economy / create jobs
Committed to community
Ad is appealing
Stresses the overall benefits of dairy farming
More Favorable ImpressionLess Favorable ImpressionTotal
(n=47)*Total
(n=303)
7%
10%
13%
24%
49%Falsely depicts job
creation
Overall message not believable
Information is not relevant
Disliked the imagery
Poor representation of farmers / animals
Q10d: Using a 5-point scale where “5” indicates “very favorable” and “1” indicates “not at all favorable”, please select the number that best reflects the impact of the Billboard on your image of dairy farming in New York State.Q11e. And what specifically was it that caused you to have a more / less favorable impression?.
“We need local economies supported by small businesses.”
“It shows how farmers keep towns together.”
“It is a simple ad, but (it) speaks volumes.”
“I like the developing respect for the career of a dairy farmer.”
“If they are family operated they cannot be creating that many jobs.”
“The claim seems pretty hard to prove.”
“Does not help anything, I don’t see how this relates to dairy.”
“The design appears childlike.”
“Farmers are (actually) losing their livelihood to poor prices and factory farms.”
Very few have a less favorable impression, and little consensus emerges with regard to reasoning.

CONFIDENTIAL & PROPRIETARY INFORMATION Page 66
Preferred Communication ChannelsPreferred Communication Channels

CONFIDENTIAL & PROPRIETARY INFORMATION Page 67
Preferred Communication Channels
Nearly half of respondents (46%) view dairy farmers to be the most preferred / effective vehicle for communicating messages about dairy farming in New York State.
Veterinarians are least preferred (55% of respondents).
Q11: Who do you want to communicate this information to you?
Total
A Albany/Saratoga
B Auburn/Cayuga
C Avon/Batavia
DBlack River/Watertown
EGeneva
FRochester/
Ontario
GFarming/ Ag
Channel (n=647) (n=125) (n=80) (n=100) (n=100) (n=100 (n=142) (n=69)
Dairy Farmers 46% 38% 53% 48% 51% 60% 44% 38%
NYS Department of Agriculture & Markets Representative
29% 35% 28% 24% 26% 23% 29% 31%
Dairy Farm Organization 16% 16% 10% 15% 17% 11% 18% 15%
Veterinarian 2% 2% 3% 3% 0% 0% 3% 1%
County Extension Agent 2% 2% 0% 4% 4% 1% 1% 2%
Other 5% 6% 8% 6% 2% 5% 5% 12%
Most Preferred Channel to Communicate Information
(Aided, Multiple Response)
Channel (n=647) (n=125) (n=80) (n=100) (n=100) (n=100 (n=142) (n=69)
Veterinarian 55% 53% 53% 64% 55% 60% 55% 54%
County Extension Agent 20% 22% 21% 15% 21% 19% 20% 16%
NYS Department of Agriculture & Markets Representative
10% 10% 13% 10% 11% 6% 9% 11%
Dairy Farmers 7% 8% 6% 4% 6% 9% 6% 11%
Dairy Farm Organization 3% 3% 3% 3% 2% 3% 3% 1%
Other 5% 5% 5% 4% 5% 3% 7% 7%
Least Preferred Channel to Communicate Information
(Aided, Multiple Response)
CONFIDENTIAL & PROPRIETARY INFORMATION Page 68
DemographicsDemographics
CONFIDENTIAL & PROPRIETARY INFORMATION Page 69
Total (n=647)
A Albany/Saratoga(n=125)
B Auburn/Cayuga (n=80)
C Avon/
Batavia (n=100)
DBlack River/Watertown
(n=100)
EGeneva
(n=100 )
FRochester/
Ontario(n=142)
GFarming/ Ag
(n=69)
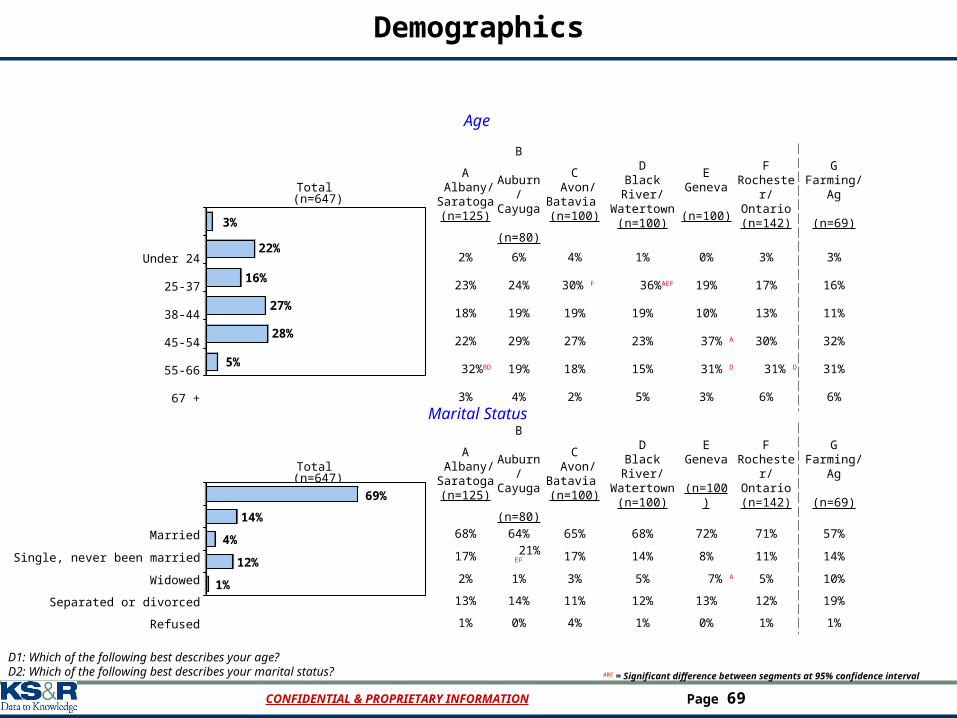
Married 68% 64% 65% 68% 72% 71% 57%
Single, never been married 17% 21% EF 17% 14% 8% 11% 14%
Widowed 2% 1% 3% 5% 7% A 5% 10%
Separated or divorced 13% 14% 11% 12% 13% 12% 19%
Refused 1% 0% 4% 1% 0% 1% 1%
Total (n=647)
A Albany/Saratoga(n=125)
B Auburn/Cayuga (n=80)
C Avon/
Batavia (n=100)
DBlack River/Watertown
(n=100)
EGeneva
(n=100)
FRochester/
Ontario(n=142)
GFarming/ Ag
(n=69)
Under 24 2% 6% 4% 1% 0% 3% 3%
25-37 23% 24% 30% F 36%AEF 19% 17% 16%
38-44 18% 19% 19% 19% 10% 13% 11%
45-54 22% 29% 27% 23% 37% A 30% 32%
55-66 32%BD 19% 18% 15% 31% D 31% D 31%
67 + 3% 4% 2% 5% 3% 6% 6%
Demographics
5%
28%
27%
16%
22%
3%
Age
D1: Which of the following best describes your age?D2: Which of the following best describes your marital status? ABC = Significant difference between segments at 95% confidence interval
1%
12%
4%
14%
69%
Marital Status

CONFIDENTIAL & PROPRIETARY INFORMATION Page 70
Total (n=647)
A Albany/Saratoga(n=125)
B Auburn/Cayuga (n=80)
C Avon/
Batavia (n=100)
DBlack River/Watertown
(n=100)
EGeneva
(n=100)
FRochester/
Ontario(n=142)
GFarming/ Ag
(n=69)
One 14% 9% 10% 14% 11% 15% 17%
Two 40% 37% 41% 37% 39% 44% 37%
Three 14% 20% 23% 18% 19% 20% 22%
Four 20% 26% F 19% 19% 21% 15% 15%
Five 6% 6% 5% 6% 8% 4% 7%
Six or more 4% 1% 1% 5% 2% 0% 1%
Demographics (cont)
2%
5%
19%
19%
41%
14%
Number of People in the Household
D3: Including yourself, how many people currently reside in your household?ABC = Significant difference between segments at 95% confidence interval
CONFIDENTIAL & PROPRIETARY INFORMATION Page 71
Total (n=647)
A Albany/Saratoga(n=125)
B Auburn/Cayuga (n=80)
C Avon/
Batavia (n=100)
DBlack River/Watertown
(n=100)
EGeneva
(n=100)
FRochester/
Ontario(n=142)
GFarming/ Ag
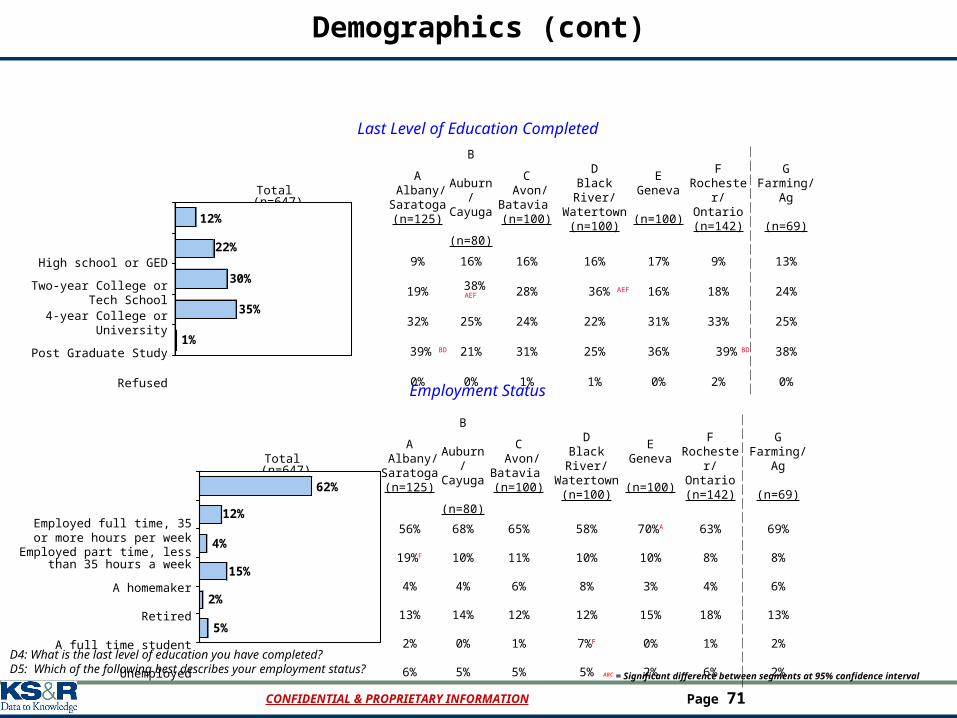
(n=69)Employed full time, 35 or more
hours per week56% 68% 65% 58% 70%A 63% 69%
Employed part time, less than 35 hours a week 19%F 10% 11% 10% 10% 8% 8%
A homemaker 4% 4% 6% 8% 3% 4% 6%
Retired 13% 14% 12% 12% 15% 18% 13%
A full time student 2% 0% 1% 7%F 0% 1% 2%
Unemployed 6% 5% 5% 5% 2% 6% 2%
Total (n=647)
A Albany/Saratoga(n=125)
B Auburn/Cayuga (n=80)
C Avon/
Batavia (n=100)
DBlack River/Watertown
(n=100)
EGeneva
(n=100)
FRochester/
Ontario(n=142)
GFarming/ Ag
(n=69)
High school or GED 9% 16% 16% 16% 17% 9% 13%
Two-year College or Tech School
19% 38% AEF 28% 36% AEF 16% 18% 24%
4-year College or University
32% 25% 24% 22% 31% 33% 25%
Post Graduate Study 39% BD 21% 31% 25% 36% 39% BD 38%
Refused 0% 0% 1% 1% 0% 2% 0%
Demographics (cont)
1%
35%
30%
22%
12%
Last Level of Education Completed
D4: What is the last level of education you have completed?D5: Which of the following best describes your employment status?
ABC = Significant difference between segments at 95% confidence interval
5%
2%
15%
4%
12%
62%
Employment Status

CONFIDENTIAL & PROPRIETARY INFORMATION Page 72
Total (n=647)
A Albany/Saratoga(n=125)
B Auburn/Cayuga (n=80)
C Avon/
Batavia (n=100)
DBlack River/Watertown
(n=100)
EGeneva
(n=100)
FRochester/
Ontario(n=142)
GFarming/ Ag
(n=69)
White/Caucasian 89% 96% 93% 90% 97% A 94% 91%
Hispanic or Latino 2% 3% 2% 2% 0% 1% 5%
Asian 1% 0% 1% 2% 0% 1% 0%
American Indian or Alaska Native
1% 0% 2% 0% 0% 0% 3%
Other 3% 0% 0% 2% 0% 0% 0%
Refused 4% 1% 2% 2% 3% 4% 1%
Demographics (cont)
D7: What is your race or ethnicity?ABC = Significant difference between segments at 95% confidence interval
3%
1%
1%
1%
2%
92%
Race or Ethnicity

CONFIDENTIAL & PROPRIETARY INFORMATION Page 73
Total (n=647)
A Albany/Saratoga(n=125)
B Auburn/Cayuga (n=80)
C Avon/
Batavia (n=100)
DBlack River/Watertown
(n=100)
EGeneva
(n=100)
FRochester/
Ontario(n=142)
GFarming/ Ag
(n=69)
Less than $24,999 5% 4% 5% 4% 0% 0% 6%
$25,000-$34,999 6% 10% 9% 11% 8% 5% 13%
$35,000-$44,999 5% 6% 6% 10% 5% 8% 6%
$45,000-$54,999 5% 19%AEF 18%AEF 11% 6% 8% 6%
$55,000-$74,999 18% 19% 23% 22% 17% 21% 23%
$75,000-$99,999 23% 20% 21% 17% 16% 17% 24%
$100,000 or more 26%CD 17% 8% 11% 30%CD 22%CD 13%
Refused 12% 5% 10% 13% 18% 19% 9%
Demographics (cont)
D9: Which of the following best describes your household’s total annual income?ABC = Significant difference between segments at 95% confidence interval
15%
22%
19%
20%
9%
7%
7%
2%
Annual Household Income

CONFIDENTIAL & PROPRIETARY INFORMATION Page 74
Demographics (cont)
D8: What is your gender?
63%
37%
Gender
Total (n=646)
A Albany/Saratoga(n=125)
B Auburn/Cayuga (n=80)
C Avon/
Batavia (n=100)
DBlack River/Watertown
(n=100)
EGeneva
(n=100)
FRochester/
Ontario(n=142)
GFarming/ Ag
(n=69)
Male
40% 35% 32% 35% 37% 37% 32%
Female 60% 65% 68% 65% 63% 63% 68%