Embed Size (px)
Citation preview
~~
PHYS. MED. BIOL., 1976, VOL. 21, No.4, 560-569. @ 1976
Quantitative Proton Tomography: Preliminary Experiments. '"A. M. CORMACK M.SC. . t -;:i:
tPhysics Department, Tufts University, Medford, MA 02155, U.S.A.
A. M. KOEHLER B.A.
Cyclotron Laboratory, Harvard University, Cambridge, MA 02138, U.S.A. .
Received 14 October 1975
ABSTRACT. An attempt has been made to see whether energetic protons (158 MeV)could be used instead of X-rays in computerized axial tomography to detect densitydifferences of the order of those at which commercial X-ray tomographs cease to beuseful. A circularly symmetrical phantom consisting of Lucite and sugar solutionswas used, and density differences of 0.5% were reconstructed with reasonable accuracyfrom data obtained with very simple equipment. Discontinuities in either density orchemical composition, or both, seem to cause artifacts in the reconstruction. Thesemay be related to the West-Sherwood effect.
1. IntroductionThe quantitative use of the absorption of X-rays in a technique known in
medical circles as Computerized Axial Tomography (CAT) has increasedenormously since commercial devices for the implementation of the techniquecame on the market a few years ago. These devices produce X-ray tomogro.phswhich can reliably detect density differences in -soft tissue of 1 % over regionsof a few square millimetres, and could presumably detect even smaller densitydifferences at the cost of a considerable increase in the radiation dose receivedby the object being examined.
In the first papers on this technique (Cormack 1963, 1964) it was pointed outthat the essential part of the technique, the reconstruction problem, had otherpossible applications such as positron annihilation radiation scanning, andtomography using heavy charged.--parlicles, for example protons. The lattersuggestion, which is the subject of this paper, was not then made with muchforce because of doubts which were subsequently laid to rest by Koehler (1968).He showed that, by using parallel-sided objects with a thickness nearly equalto the range of the incident proton beam, one could record on film radiographsshowing much greater contrast than X-radiographs taken under the same t~conditions. Extension of this technique to the examinations of human material ~has been explored by Stewart and Koehler (1973, 1974). The sharpness of the i :
images in these proton radiographs suggests that the multiple scattering ofprotons by the specimen ma}T not be too much of an impediment to obtaininguseful proton tomographs. Indeed, a successful tomograph has been demon-strated by Crowe, Budinger, Cahoon, Elischer, Huesman and Kanstein (1975)using 910 MeV helium ions, but analysis of their results in terms of the ultimatelimits of the technique is difficult. The problem then is not whether the
;C"'~"ycc,.'".~,-~"7 " - ~
- ,.' -
Quantitative Proton Tomography 561
reconstruction process will produce a proton tomograph, but rather how goodthe tomograph will be, and what advantages and disadvantages a proton tomo-
periments graph will have over an X-ray tomograph because of the difference between theinteractions of protons and X-rays with matter.
The experiment described below has been a first step in investigating theproblems of proton tomography using a simple phantom with density differences
',A. between its components of 1 % or less, roughly the level at which commercialX-ray tomographs cease to be useful. The apparatus used was rudimentary,and its dynamic range was small but sufficient for our purposes. This small
:18, U.S.A. dynamic range is not inherent in proton tomography, and it is easy to imaginequite'different detector systems with large dynamic range.
2. Experimental arrangementODS (158 MeV) . . .
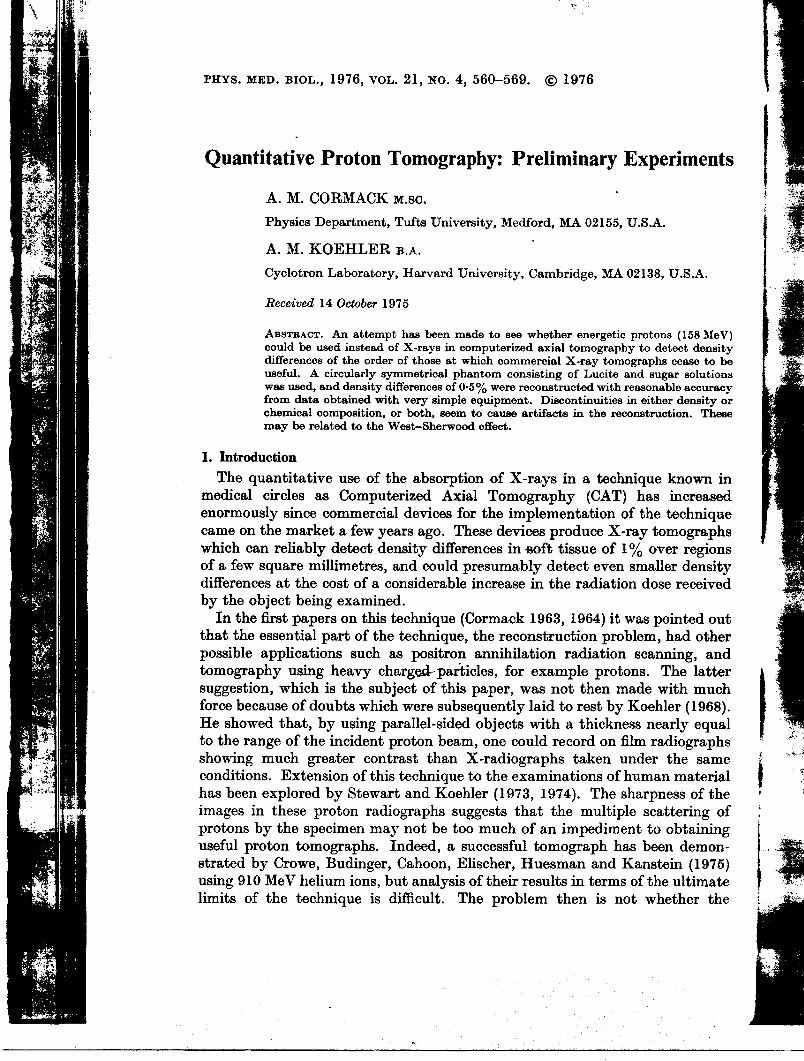
, detect density The arrangement of the eqmpRre"nt IS shown ill fig. 1. The 158 MeV externalIhs cease t~ be beam of the Harvard cyclotron is focused, through a 6 mm hole in collimator A,,jug&rbl solutIons on a lead foil 3.51 g cm-2 thick which scatters the beam so that collimators B, 0Q& e accuracy .ther density or and D define two small beams at an angle of 1.33° above and below the hon-ruction. These zontal. All collimators were made of brass 3.8 cm thick. These beams are
le known in ~ ~ ~~~C1 lS incre~sed ~LAbSOrber
le techni que Id tnCI entomographs P~roton ~ ~ 1 . beam Lead 1cm
I)ver regIons foil T"ller density
~)8e received~ Ab~~rber~phantom pointed out C 2
f-100cm--ilil, had other ~
',tnning, and ABC 0. The latter Fig. I. Incident protons are scattered by the lead foil. Two beams in a vertical plane are, with much defined by holes in collimators B, C and D. The protons are detected by scintillationh counters CI and C2.
'e ler (1968).nearly equal detected by two sodium iodide scintillation counters 01 and 02. The rest of theradiographs scattered proton beam is stopped by the collimators and this results in a beam-
er the same associated background of neutrons and y-rays in the experimental area. Thenan material scintillators were 3.81 cm in diameter and 2.54 cm thick, and they were mountedrpness ~f the on R.0.A.6810A photomultipliers. The currents from the photomultipliers;catter~g. of were fed to two current integrators arranged so that when a predeterminedto obtalrung charge had been accumulated from one (the monitor counter) the cyclotron)ee~ demon- would be turned off and the amount of charge from the other detector measured.lstem \1975) The vertical plane for the proton beams was chosen to minimize the effectsthe ultImate of variation in the position of the primary external beam. These variations\vhether the occur because of small variations in the currents of the main cyclotron magnet
Co
~ .
562 A. M. Cormack and A. M. Koehler
and the bending and focusing magnets along the external beam, and are expectedto be less in the vertical plane than the horizontal. We believe that verticalfluctuations in the position of the primary beam are the main source of thefluctuations in our data. A beam configuration less sensitive to shifts in theincident beam but requiring more detectors than we have at present will beused in further experiments. .
. ]3. Ex.perimental procedure. ... i ~
U smg one counter as a preset mom tor, the voltage on the mtegratmg capacItor ';',
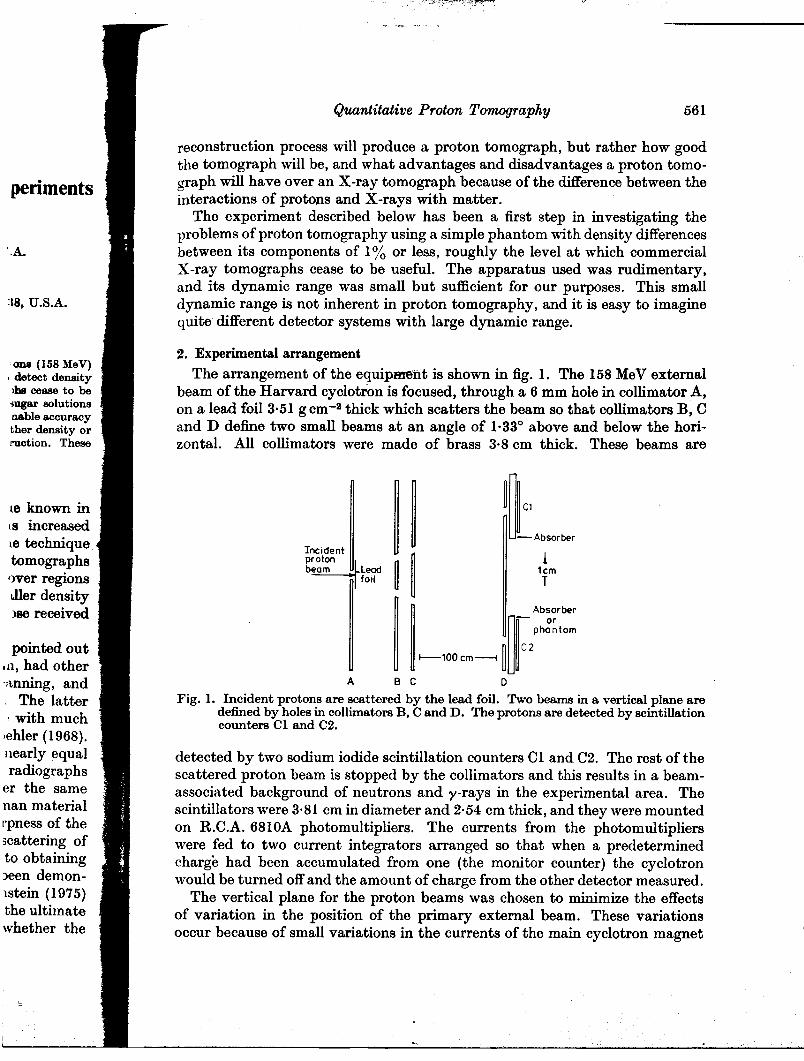
of the other counter was measured as a function of the amount of plasticabsorber (Lucite) placed after collimator D in the 'active' beam. Fig. 2 shows
] 30-0Nu- 100'-.8.g 3.c-ou
C1 1.0.f:"'06-2. 03.f:E0~ 01-06,in
003 11. 15 16 17
Lucile before C2 19 Cm.2)
Fig. 2. Signal from C2 88 a function of absorber thickness before it, for a given chargefrom CI.
a typical result which resembles a range curve for protons. The importantpoint for proton tomography is the very rapid fall off of this curve. It is relatedto the very rapid fall off of th.e.J1Umber-distance curve near the end of the rangeof monoenergetic protons passing through an absorber, but it is not strictlyproportional to it. For our scintillation counters what is measured is the lightoutput of those protons which penetrate the absorber and are stopped in thescintillator which is certainly able to accept the spread of the beam due tomultiple scattering and probably has an unnecessarily large diameter for this I ,
purpose. The scintillators are also unnecessarily thick. Many different and I iprobably better detector systems can be imagined. Each will have its own I ~
characteristically rapid fall off, and the reason in each case will be the rapidfall off of the number-distance curve mentioned above.
Another feature of fig. 2 is the flat region beyond the end of the range, thepedestal. This too will exist in all detector systems we can think of. In our caseit is caused by the dark currents in the photomultipliers (about 25%) and thebackground of neutrons and y-rays in the experimental area. \\Te believe that
Quantitative Proton Tomography 563
, expected the height of the pedestal can be reduced by a better choice of photomultipliers,'1.t vertical scintillators and collimating system.roo of the With a curve such as that shown in fig. 2 obtained for one counter the rolesLfts in the of the counters were interchanged and a similar curve was obtained for thent will be other counter. From these curves a certain amount of absorber was chosen for
each counter so as to put both at points on their response curves which hadnearly the same high slope. The purpose of this procedure was to make thefinal measurements insensitive to small variations in the mean energy of the
, capacitor external proton beam. The amount of absorber before Cl was thereafter held iof plastic constant. Measurements of the response of C2 were then made as a function of~. 2 shows small variations about the amount of absorber before C2 chosen as described
above.
> 'g --- \
U .;"5..;2-u8-0U01S00-GI
.s
Ee."0c:~ .
If) 10.2
Polystyrene before C1 (g cm-2)
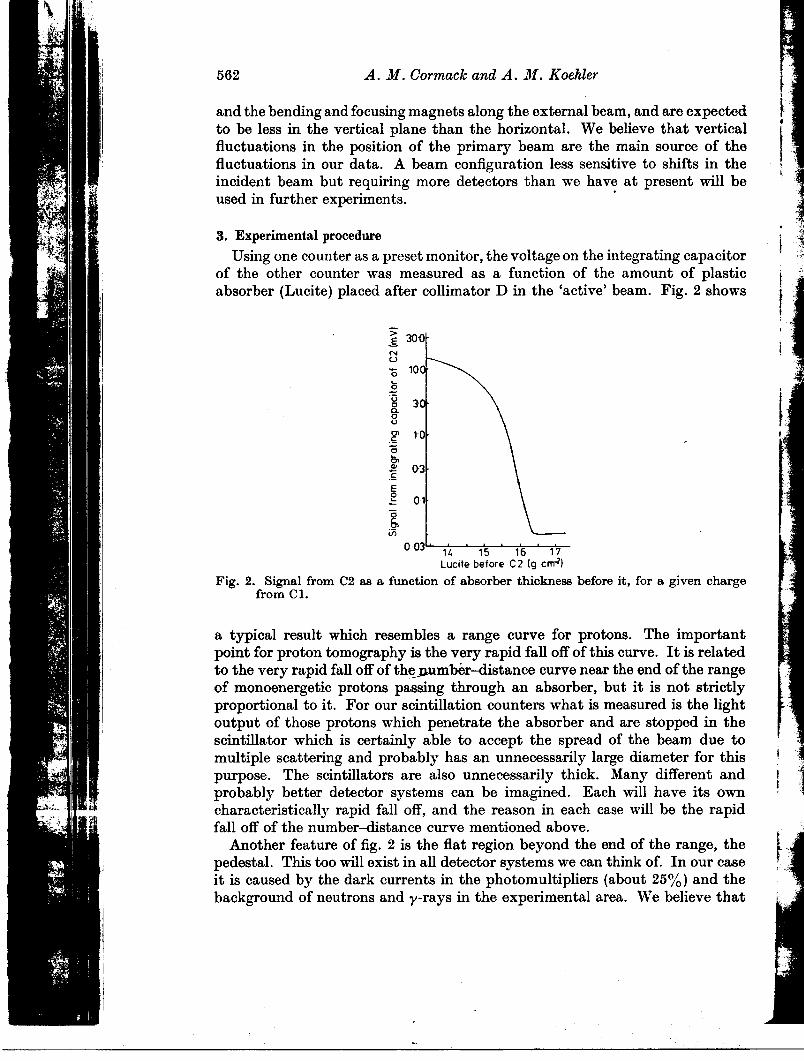
Fig. 3. Calibration curve of C2 with a fixed amount of absorber before CI.
lmportant The resulting calibration curve is shown in fig. 3, which demonstrates thet is related power of the method. The curve is very roughly a straight line on a logarithmic,the range plot. To simulate this curve with X-rays would require the use of X-rays withJt strictly a mass absorption coefficient of about 6.6 cm2 g-l, and these would be attenuated;; the light by a factor of about exp (- 84) in penetrating to a depth of 12.7 cm of Lucite,l)ed in the approximately the amount of absorber before each counter.1m due to Having obtained this calibration curve we replaced the absorber before C2er for this by the phantom. This was an almost parallel-sided block of Lucite 12.70 cm I':erent and wide and 5.08 cm thick with a circular hole and a concentric annular slot cut
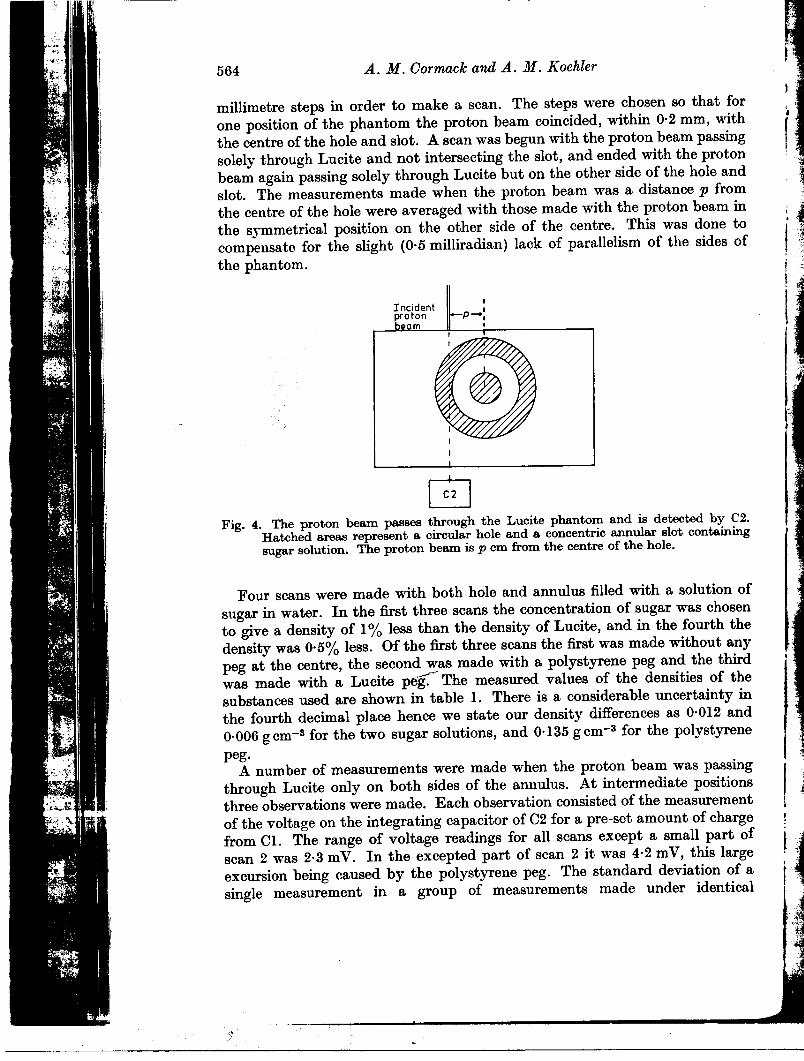
I'e its own into it as shown in fig. 4. The radius of the hole was 1.59 cm, and the inner andthe rapid outer radii of the annular region were 3.18 cm and 4.76 cm. The depths of both
the hole and the slot were 4.76 cm. Provision was made for a peg of diameter trange, the 4,75 mm to be inserted at the centre of the hole. The phantom could be drivenn our case or scanned horizontally in a direction perpendicular to the incident proton;)) and the beam which was defined by a slit in collimator D 2 mm wide horizontally and~lieve that 8 mm high. The phantom was stepped across the proton beam in one or two~
564 A. M. Cormack and A. ~iJf. Koehler ".
)millimetre steps in order to make a scan. The steps were chosen so that for I 'one position of the phantom the proton beam coincided, within 0.2 mm, with r.
the centre of the hole and slot. A scan was begun with the proton beam passingsolely through Lucite and not intersecting the slot, and ended with the proton ! ;'°,
beam again passing solely through Lucite but on the other side of the hole and ,slot. The measurements made when the proton beam was a distance p from ';:
the centre of .the hol~ ~ere averaged with. those made with the ~roton beam in . jthe s)-mmetncal posItIon on the other sIde of the centre. ThIs was done to " ~compensate for the slight (0.5 milliradian) lack of parallelism of the sides of ;~
the phantom. :
I
~nCident I l
I
I
GFig. 4. The proton beam passes through the Lucite phantom and is detected by C2.
Hatched areas represent a circular hole and a concentric annular slot containingsugar solution. The proton beam is p cm from the centre of the hole.
Four scans were made with both hole and annulus filled with a solution ofsugar in water. In the first three scans the concentration of sugar was chosento give a density of 1 % less than the density of Lucite, and in the fourth thedensity was 0'5% less. Of the first three scans the first was made without anypeg at the centre, the second Wf\.S made with a polystyrene peg and the third I
was made with a Lucite peg:-' The measured values of the densities of thesubstances used are shown in table 1. There is a considerable uncertainty inthe fourth decimal place hence we state our density differences as 0.012 and0.006 gcm-a for the two sugar solutions, and 0.135 gcm-a for the polystyrene
peg.A number of measurements were made when the proton beam was passingIthrough Lucite only on both sides of the annulus. At intermediate positions 1
three observations were made. Each observation consisted of the measurement I'.
of the voltage on the integrating capacitor of 02 for a pre-set amount of charge!from 01. The range of voltage readings for all scans except a small part of i 1"' scan 2 was 2.3 m V. In the excepted part of scan 2 it was 4.2 m V, this large' "
excursion being caused by the polystyrene peg. The standard deviation of a . 'c
single measurement in a group of measurements made under identical I:~
:~;~~
vtJ
;'
"r
Quantitative Proton Tomography 565
so that for conditions ranged from 0-05 m V to 0-09 m V- We believe that these variations2 mm, with are primarily due to vertical movements of the primary beam, but smallam passing variations in the dark currents of the phototubes (observed) and in their gainsthe proton (surmised) may also contribute- The photomultiplier dark currents were
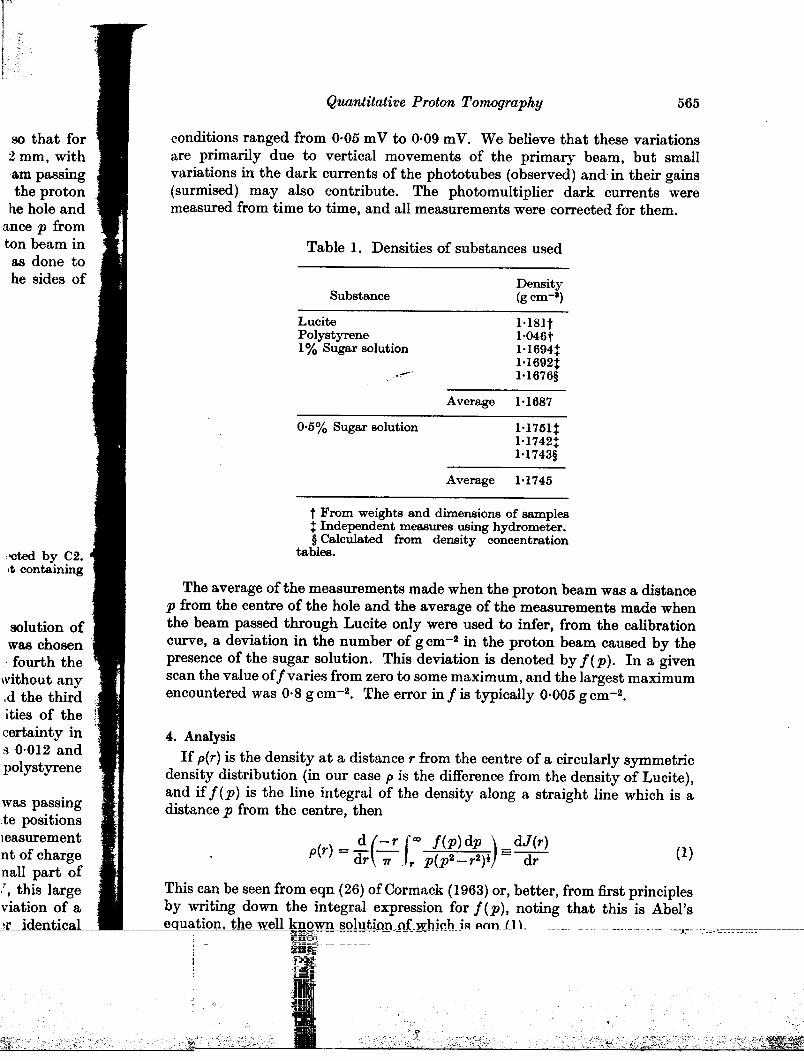
he hole and measured from time to time, and all measurements were corrected for them-ance p fromton beam in Table 1- Densities of substances usedas done tohe sides of Density
Substance (g em-a)
Lucite 1-181tPolystyrene 1.046t1% Sugar solution 1.1694t
1-1692t.,-- 1-1676§
Average 1-1687
0-5% Sugar solution 1.1751t1-1742t1'1743§
Average 1-1745
t From weights and dimensions of samplest Independent measures using hydrometer-§ Calculated from density concentration
tables-
The average of the measurements made when the proton beam was a distancep from the centre of the hole and the average of the measurements made when
solution of the beam passed through Lucite only were u~ed to infer, from the calibrationwas chosen curve, a deviation in the number of g cm-2 in the proton beam caused by the. fourth the presence of the sugar solution- This deviation is denoted byj(p). In a given
\vithout any scan the value ofjvaries from zero to some maximum, and the largest maximum,d the third encountered was 0.8 g cm-2- The error in j is typically 0.005 g cm-2.
ities of the jcertainty in . 4. Analysis
8 0.012 and If p(r) is the density at a distance r from the centre of a circularly symmetric
polystyrene density distribution (in our case p is the difference from the density of Lucite) ,. and if f(p) is the line integral of the density along a straight line which is a
,vas p~s~mg distance p from the centre, thente posItIonsleasurement d (-r [~ j(p) dP ) dJ(r) nt of charge p(r) = dr 7.1,. p(p2-r2)i =~ (1)
naIl part of,T, this large This can be seen from eqn (26) of Cormack (1963) or, better, from first principlesviation of a by writing down the integral expression for j(p), noting that this is Abel's~r identical equation, the well known solution of which is eqn (1)- :
jj
566 A. M. Cormack and A. M. Koehler
From the values ofj(p) found at a number of discrete values of p we calcu-lated the values of J(r) at values of r which are the same as the values of p bynumerical integration of the integral in eqn (1). A linear interpolation betweenneighbouring values ofj(p) was used to evaluate the integral analytically fromthe singular pOUlt p = r to the next value of p at which data had been taken.Simpson's rule was used to evaluate the rest of the integral. From these values
I ofJ(r) its derivative, p(r), was found by numerical differentiation. i £.~.c.H;". ,;~'!'
I '
5. Results !
Running through the above analysis is the idea that density differences areall that matter for proton tomography. We shall continue this fiction a littlelonger for the presentation of the results. These are shown in figs 5 and 6, in
001
. . .000 . ...- .
1 -0.01. .OJ ... .. .. . .2 ... (0)QIOJCQI
~:g 0005~'in . . . . .c .QI 0.000 . . . . .
CJ ....
-0005 ... . (b) . . . . .
ar (cm)
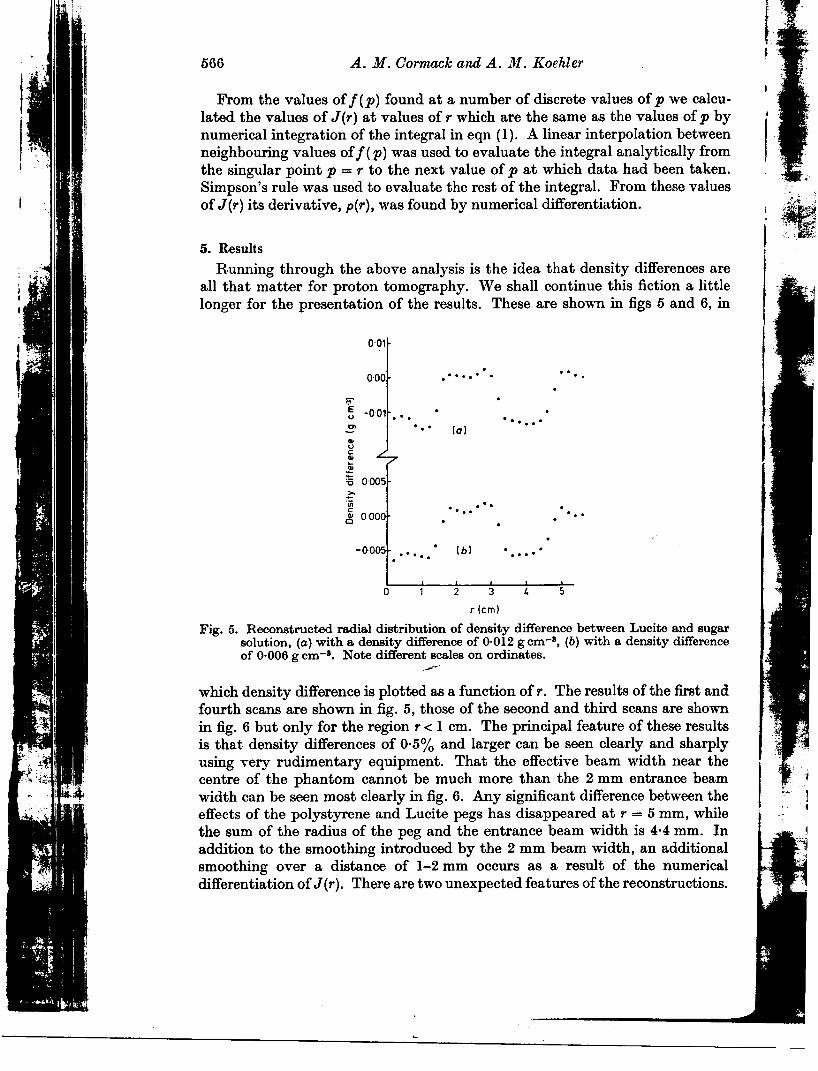
Fig. 5. Reconstructed radial distribution of density difference between Lucite and sugarsolution, (a) with a density difference of 0.012 g cm-s, (b) with a density differenceof 0.006 g cm-s. Note different scales on ordinates.
---
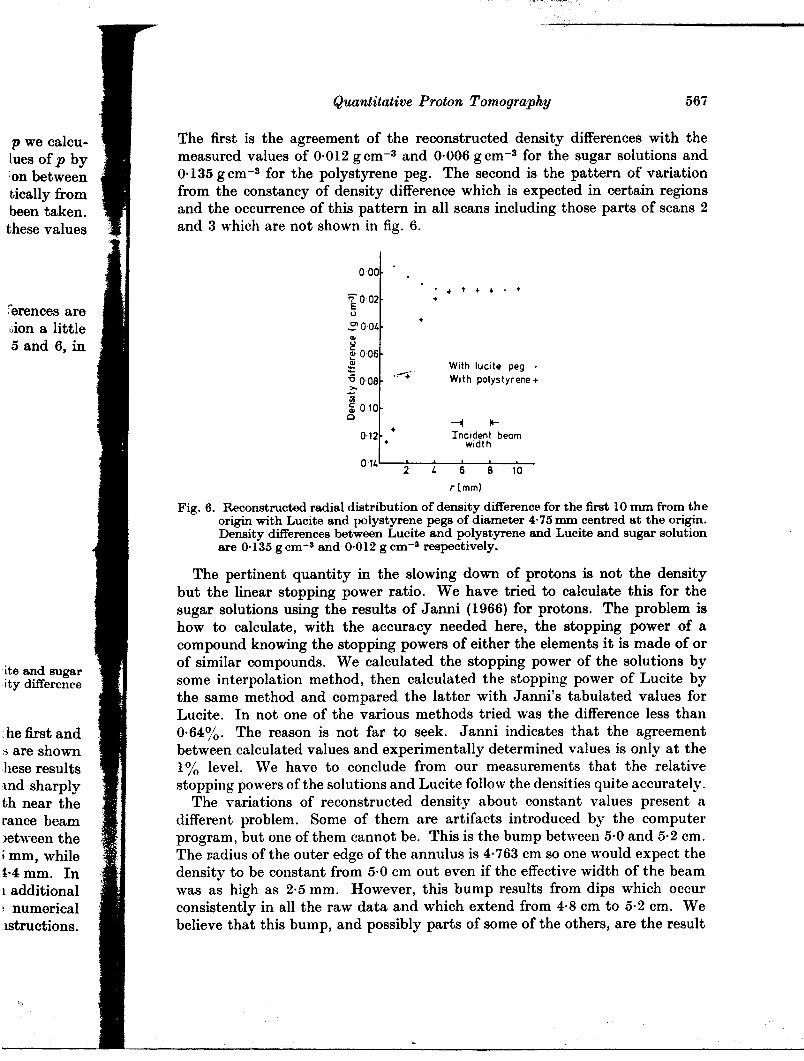
which density difference is plotted as a function of r. The results of the first andfourth scans are shown in fig. 5, those of the second and third scans are shownin fig. 6 but only for the region r < 1 cm. The principal feature of these resultsis that density differences of 0.5% and larger can be seen clearly and sharplyusing \ery rudimentary equipment. That the effective beam width near the I .,' centre of the phantom cannot be much more than the 2 mm entrance beam ! 4
width can be seen most clearly in fig. 6. Any significant difference between the Jeffects of the polystyrene and Lucite pegs has disappeared at r = 5 mm, while I
the sum of the radius of the peg and the entrance beam width is 4.4 mm. Inaddition to the smoothing introduced by the 2 mm beam width, an additionalsmoothing over a distance of 1-2 mm occurs as a result of the numericaldifferentiation of J(r). There are two unexpected features of the reconstructions.
~
0. - ~ ~"-T:~~C~
-
Quantitative Proton Tomography 567
p we calcu- The first is the agreement of the reconstructed density differences with thelues of p by measured values of 0.012 g cm-3 and 0.006 g cm-3 for the sugar solutions andon between' 0.135 g cm-3 for the polystyrene peg. The second is the pattern of variationtically from from the constancy of density difference which is expected in certain regionsbeen taken. and the occurrence of this pattern in all scans including those parts of scans 2these values and 3 which are not shown in fig. 6.
000
.~~ ., 002 +
:erences are ~+
"ion a little ~ 004. QI
5 and 6, ill ~ 006
~ . With lucite peg.'0 008'~ With polystyrene +>.-ijj~ 010c ~ ~
012 + Incident beam+ width
014 2 4 6 8 10
rlmmJ
Fig. 6. Reconstructed radial distribution of density difference for the first 10 mm from theorigin with Lucite and polystyrene pegs of diameter 4.75 mm centred at the origin.Density differences between Lucite and polystyrene and Lucite and sugar solutionare 0.135 gcm-3 and 0.012 g cm-3 respectively.
The pertinent quantity in the slowing down of protons is not the densitybut the linear stopping power ratio. We have tried to calculate this for thesugar solutions using the results of Janni (1966) for protons. The problem ishow to calculate, with the accuracy needed here, the stopping power of acompound knowing the stopping powers of either the elements it is made of or
. of similar compounds. We calculated the stopping power of the solutions by::; ~n;e~~~:~ some interpolation method, then calculated the stopping power of Lucite by
the same method and compared the latter with Janni's tabulated values forLucite. In not one of the various methods tried was the difference less than
che first and 0.64%. The reason is not far to seek. Janni indicates that the agreement..; are shown between calculated values and experimentally determined values is only at thehese results 1 % level. We have to conclude from our measurements that the relativetnd sharply stopping powers of the solutions and Lucite follow the densities quite accurately.th near the The variations of reconstructed density about constant values present arance beam different problem. Some of them are artifacts introduced by the computer)etween the program, but one of them cannot be. This is the bump bet,veen 5.0 and 5.2 cm.i mm, while The I:adius of the outer edge of the annulus is 4.763 cm so one would expect the1.4 mm. In density to be constant from 5.0 cm out even if the effective width of the beam1 additional was as high as 2.5 mm. However, this bump results from dips which occur~ numerical consistently in all the raw data and which extend from 4.8 cm to 5.2 cm. We.lstructions. believe that this bump, and possibly parts of some of the others, are the result
b
11; -
r
568 A. M. Cormack and A. M. KoehlerI ; l of a real physical effect caused by the sharp change in density and chemical
l composition at the outer edge of the annulus. It is possible that this is related Kom~ to the effect discussed by West and Sherwood (1972, 1973) which depends on C~eJIanl
': having a discontinuity in multiple scattering angle in a thin object being'. BMecTO pc
radiograph~d with protons. So. far .we have not been ab~e to ma~e a convincing ~ :~~::HJcase for thIS. Ho\vever, the dIpS III the data are consIstent WIth the pattern i caxapa H
predicted by West and Sherwood if the multiple scattering in Lucite is greater i TO'lHOCTb"
than in the sugar solutions. This will be true if the change in density onl y CTBHe JaKI
Ka)KeTCJI 0]determines the change in multiple scattering. As with the calculation of stopping BecTa-Wepo\ver, neither the theory nor the available data enable us to calculate multiplescattering to the accuracy needed here. "'hether or not the West-Sherwood ;j,~:.;..
!Ii effect is responsible for the dips in the data, they are there consistently and the I;i;~ , only physical cause seems to be the discontinuity at the edge of the annulus. CORMACK
If An effect of this sort might seriously affect the quality of a reconstruction if a ~ ~~~c:11; large discontinuity were present in the sample, for example, the discontinuity K./
between bone and surrounding soft tissue. ~ iANNI, J.; Since it is important for medical applications we mention that the entrance p'. S~~~:
dose received by the phantom in order to determine f(p) for a single value ' STEWARD
of p was 0.35 roo. This is high, but we made no effort to minimize the dose. WW E8T, D.
EST, D.
We would like to thank Dr. Giovanni Di Chiro and Dr. Rodney Brooks forencouraging us to do this experiment. We would also like to thank Robert A.Schmidt and Kristen Johnson for their assistance with the experiment.
'I RESUME
:! Tomographie quantitative des protons: experimentations preliminaires'I
On a essaye de voir si I'on pouvait se servir de protons energetiques (158 MeV) au lieu desrayons X dans la Tomographie Axiale 8. Ordination pour detecter les differences de densites de)'ordre de celles auxquelles les tomographes 8. rayons X du commerce cessent d'etre utiles. UnfantOme circulairement symetrique se composant de solutions de sucre et de Lucite rut utilise etdes differences de densiMs de 0,50;0 furent reconstruites avec une assez bonne pr~ision 8. partir dedonnees obtenues avec un equipement tres simple. Des solutions de continuiM dans soit ladensite ou la composition chimique, ou bien lea deux, semblent causer des artefacts dans lareconstruction. Ils peuvent etre duB al'effet de West-Sherwood.
~..ZUSAMMENFASSUNG ,;,~
Quantitative Protonentomographie: einleitende Experimente
IDie Autoren untersuchen, ob Rontgenstrahlen in computerisierter Axial- Tomographie durchenergetische Protonen (158 MeV) ersetzt werden konnen, urn Dichteunterschiede in dem Bereich Ifestzustellen, in dem kommerzielle Rontgentomographen nicht mehr von Nutzen sind. Verwendet iwurde ein kreissymmetrisches Phantom BUS Lutetium und Zuckerlosungen, und Dichteunter-schiede von 0,5% wurden mit hinreichender Genauigkeit aufgrund von Daten rekonstruiert, die ,.~
mit sehr einfachem Gerat aufgestellt worden waren. Diskontinuitat in Dichte und/oder chemischerZusammensetzung scheinen ktinstliche Erscheinungen in der Rekonstruktion zu verursachen.Dies mag mit dem West-Sherwood-Effekt in Verbindung stehen.
~ -..,.
~
,~
Quantitative Proton Tomography 569
1 chemical Pe31OMe.; is related KOJlHlfecTBeHHaR TOMorpa<!>HR C nOMOU(bfO npOTOHOB' npe~BapHTeJlbHble 3KcnepHMeHTbI
epends on C~eJlaJIH nOIlbITKY YCTaHOBHTb MOJKHO JlH HCnOJlb30BaTb 3HepreTHlfecKHe npOTOHbl (158 M3B)ect bein BMecTO peHTreHOBCKHX JlY'IeA B ToMorpa<!>HH no OCR C nOMO~bfO 3BM JJ.JlJl 06HapYJKeHHJI PaJ-
.I . . g HOCTeA B fIJlOTHOCTH TaKoro nopR~Ka, npH KOTOpbIX KOMMep'lecKHe peHTreHOBCKHe TOMorpa<!>bI
,'onvmcmg HenpHMeHHMbI. MCnOJlb30BaJlH nepH<!>epHAHo CHMMeTpH'IeCKHit <!>aHTOM, Co~epJKa~HA paCTBopbI
the pattern caxapa H JlfOCHTa H BocnpOH3BOD.HJlHCb pa3HOCTH fIJlOTHOCTH 0,5% C OTHOCHTeJlbHO BbICOKOK"e is 'Zreater TO'lHOCTbfO Ha OCHOBe D.aHHbIX, nOJlY'IeHHbIX C nOMO~bfO O'leHb npOCToro o60PYD.OBaHHJI. OTCYT-. 0 CTBHe 3aKOHOMepHOCTeii B fIJlOTHOCTH HJlH B XHMH'IecKOM COCTaBe, HJIH B 060HX nOKa3aTeJlRX
,1Slty only KaJKeTCR DpH'lHHOil apTe<!>aKToB B BOCCTaHOBJleHHH. 3TH apTe<!>aKTbI BO3MOJKHO CBR3aHbI C 3<!><!>eKTOM
If stopping BecTa-lIIepBy~a.
e multipleSherwood REFERENCESIy and the, annulus CORMACK, A. M., 1963, J. Appl. Phys., 34, 2722., . . . CORMACK, A. M., 1964, J. Appl. Phys., 35, 2908.uctlon if a CROW, K. M., BUDINGER, T. F., CAHgDN, J. L., ELISCHER, V. P., HUESMAN, R. H., andcontinuity KANSTEIN, L. L., 1975, Lawrence Berkeley Laboratory Report LBL-3812.
JANNI, J. F., 1966, U.S. Air Force Weapons Laboratory Report AFWL-TR66-150.KOEHLER, A. M., 1968, Science, N.Y., 160, 303.
) entrance STEWARD, V. W., and KOEHLER, A. M., 1973, Nature, Lond., 245, 38.'1gle value STEWARD, V. W., and KOEHLER, A. M., 1974, Radiology, 110, 217.e dose WEST, D., and SHERWOOD, A. C., 1972, Nature, Lond., 239, 157.l. WEST, D., and SHERWOOD, A. C., 1973, Non-destructive Testing, 6, 249.
Jrooks forRobert A.at.
au lieu des. densiws de,) utiles. Un
. rut utilise eton 8. partir de l'
dans soit la'"acts dans la
~raphie durchl dem Bereichd. Verwendet .Dichteunter.
mstruiert, dieer chemischerverursachen.


![StatisticalIterativeReconstruction forX-Ray …web.eecs.umich.edu/~fessler/book/deman-10-sir.pdfThe first X-ray computed tomography (CT) prototypes by Cormack [1,2],Ambrose [3], and](https://img.pdfslide.us/doc/110x75/5f3c30d45abedc25a95200eb/statisticaliterativereconstruction-forx-ray-webeecsumichedufesslerbookdeman-10-sirpdf.jpg)