Embed Size (px)
Citation preview
Quantitative Proteomics
Liwen Zhang
Mass Spectrometry and Proteomics Facility
The Ohio State University
Summer Workshop 2016
Quantitative ProteomicsQuantitation in proteomics has become a popular area in recent proteomics research with the development of quantitation techniques such as DIGE, SILAC, ICAT, iTRAQ and Label Free.
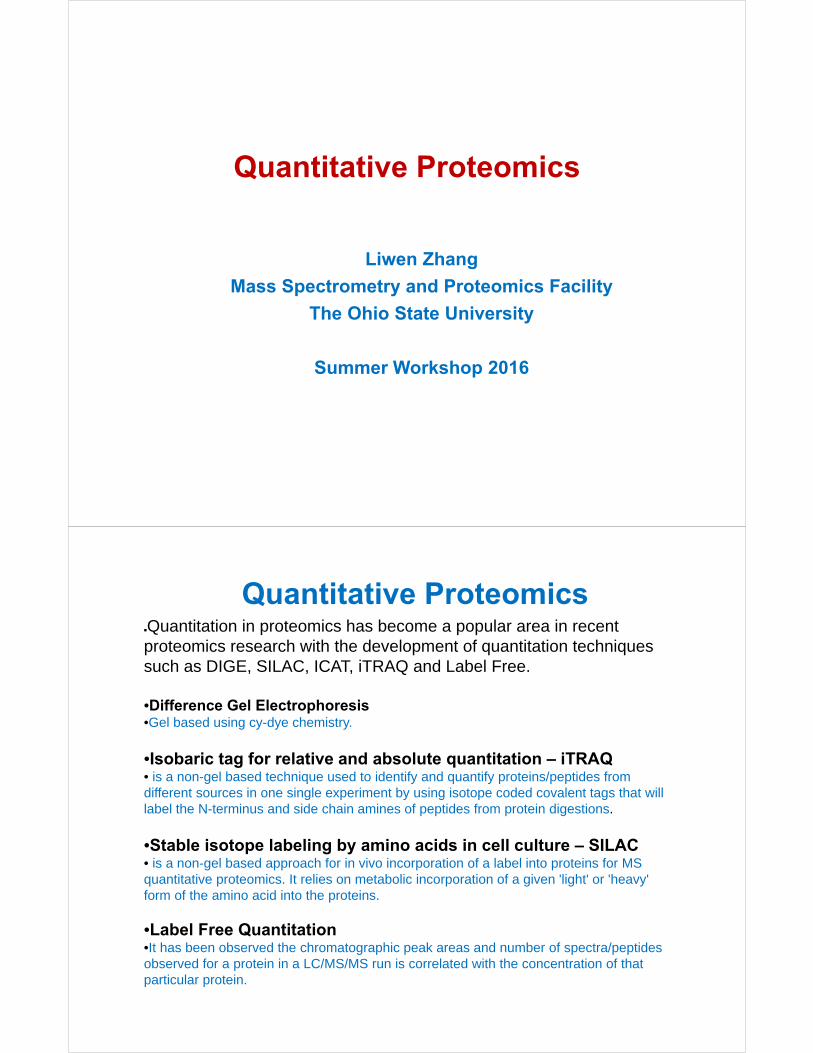
•Difference Gel Electrophoresis•Gel based using cy-dye chemistry.
•Isobaric tag for relative and absolute quantitation – iTRAQ• is a non-gel based technique used to identify and quantify proteins/peptides from different sources in one single experiment by using isotope coded covalent tags that will label the N-terminus and side chain amines of peptides from protein digestions.
•Stable isotope labeling by amino acids in cell culture – SILAC• is a non-gel based approach for in vivo incorporation of a label into proteins for MS quantitative proteomics. It relies on metabolic incorporation of a given 'light' or 'heavy' form of the amino acid into the proteins.
•Label Free Quantitation•It has been observed the chromatographic peak areas and number of spectra/peptides observed for a protein in a LC/MS/MS run is correlated with the concentration of that particular protein.
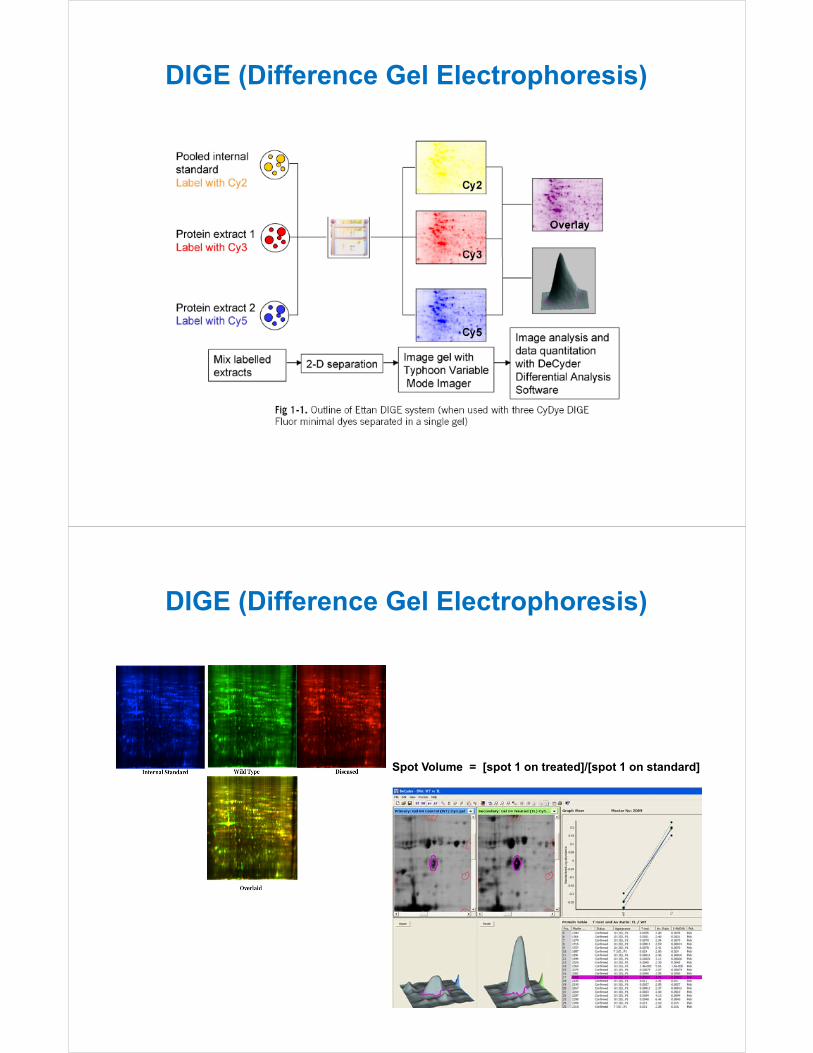
DIGE (Difference Gel Electrophoresis)
Spot Volume = [spot 1 on treated]/[spot 1 on standard]
DIGE (Difference Gel Electrophoresis)
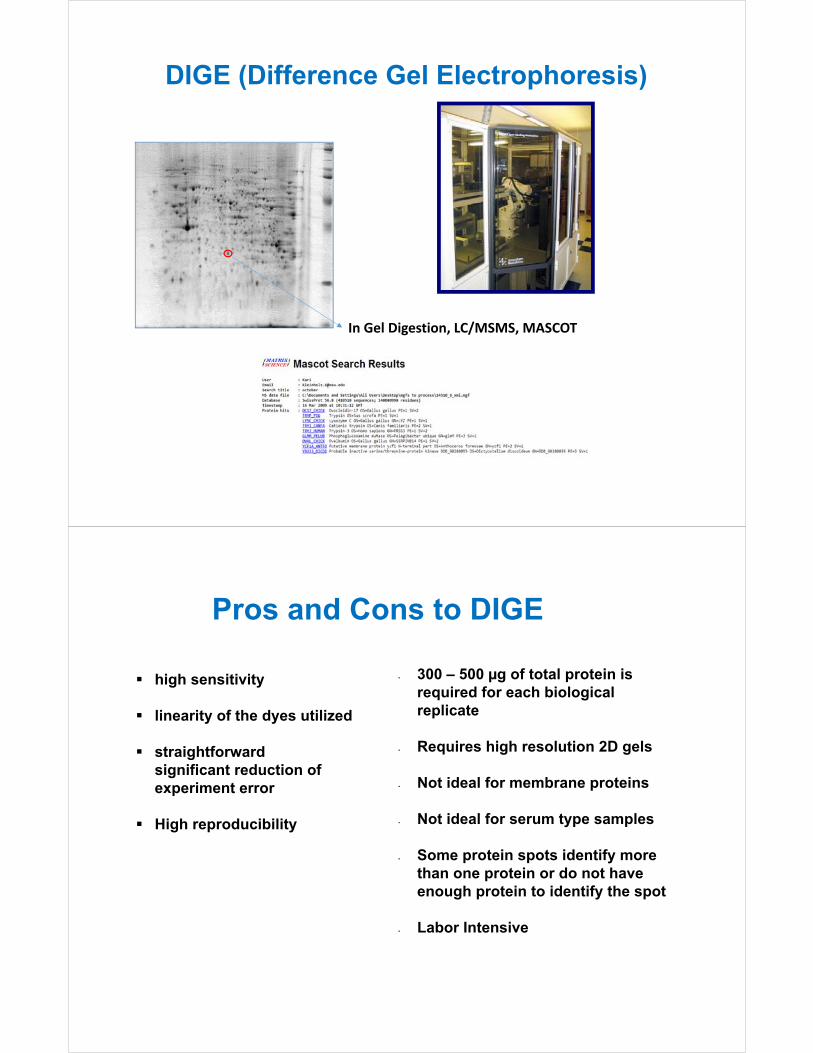
In Gel Digestion, LC/MSMS, MASCOT
DIGE (Difference Gel Electrophoresis)
high sensitivity
linearity of the dyes utilized
straightforward significant reduction of experiment error
High reproducibility
Pros and Cons to DIGE
300 – 500 µg of total protein is required for each biological replicate
Requires high resolution 2D gels
Not ideal for membrane proteins
Not ideal for serum type samples
Some protein spots identify more than one protein or do not have enough protein to identify the spot
Labor Intensive
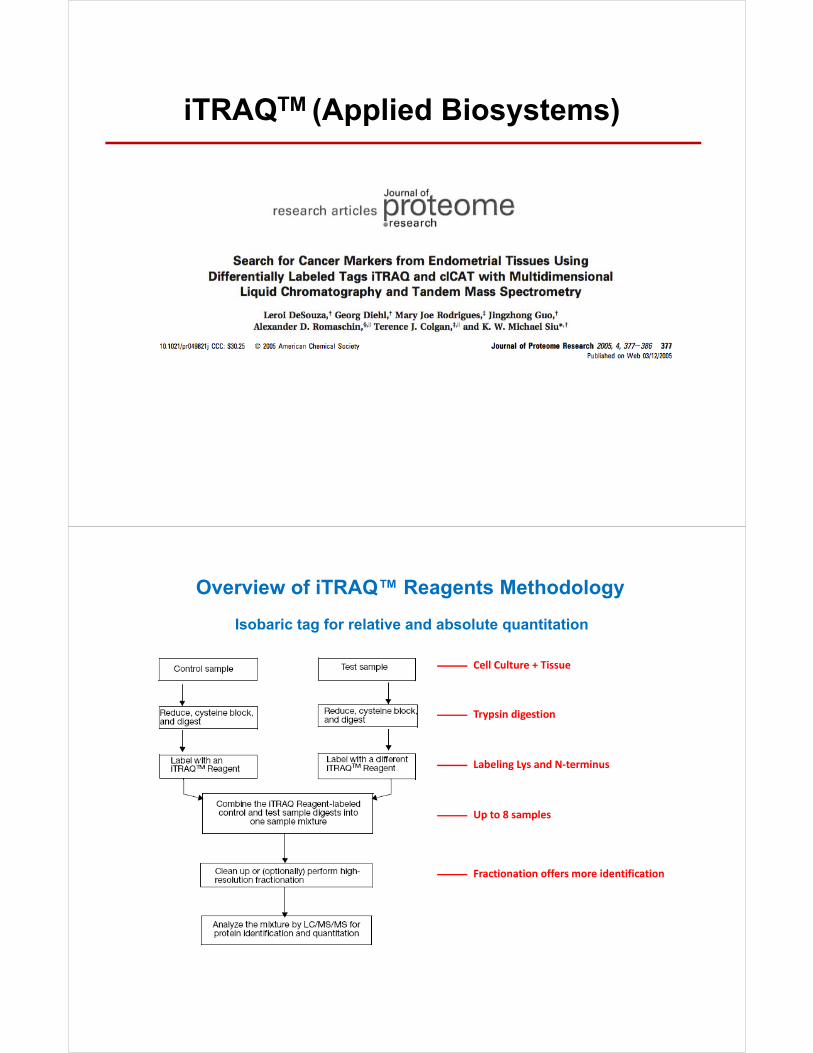
iTRAQTM (Applied Biosystems)
Overview of iTRAQ™ Reagents Methodology
Labeling Lys and N‐terminus
Up to 8 samples
Fractionation offers more identification
Trypsin digestion
Cell Culture + Tissue
Isobaric tag for relative and absolute quantitation
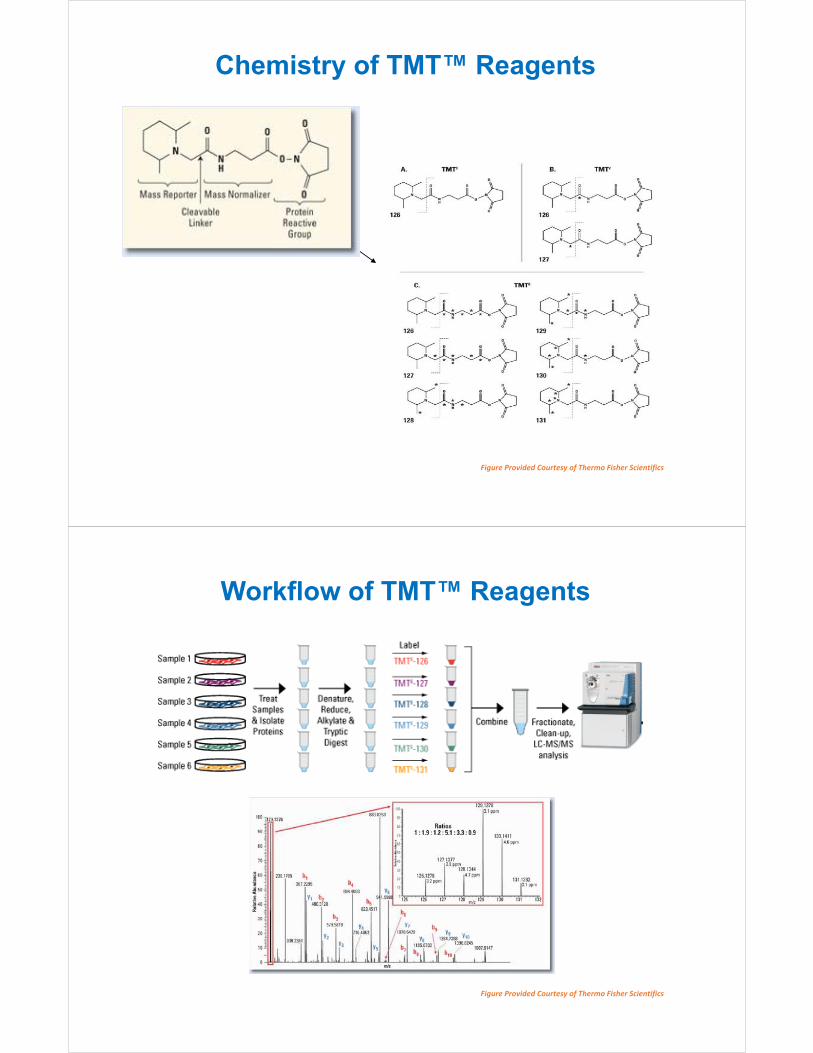
Chemistry of TMT™ Reagents
Figure Provided Courtesy of Thermo Fisher Scientifics
Figure Provided Courtesy of Thermo Fisher Scientifics
Workflow of TMT™ Reagents
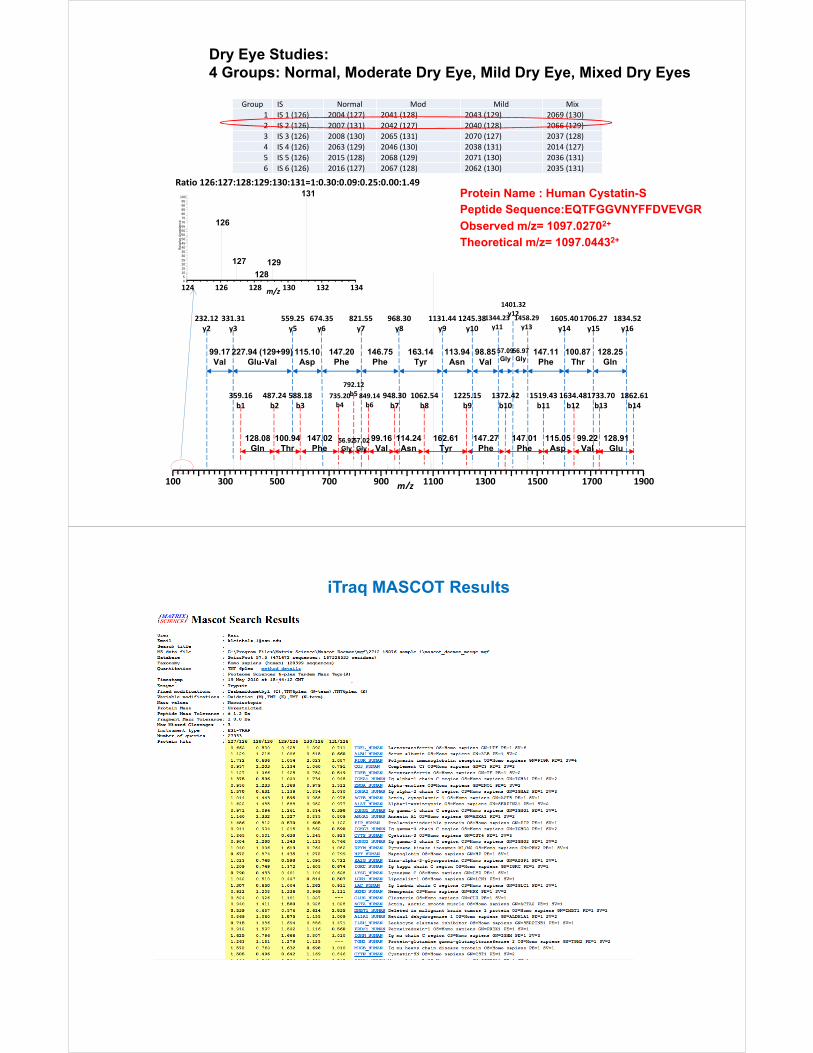
Group IS Normal Mod Mild Mix
1 IS 1 (126) 2004 (127) 2041 (128) 2043 (129) 2069 (130)
2 IS 2 (126) 2007 (131) 2042 (127) 2040 (128) 2066 (129)
3 IS 3 (126) 2008 (130) 2065 (131) 2070 (127) 2037 (128)
4 IS 4 (126) 2063 (129) 2046 (130) 2038 (131) 2014 (127)
5 IS 5 (126) 2015 (128) 2068 (129) 2071 (130) 2036 (131)
6 IS 6 (126) 2016 (127) 2067 (128) 2062 (130) 2035 (131)
Dry Eye Studies: 4 Groups: Normal, Moderate Dry Eye, Mild Dry Eye, Mixed Dry Eyes
100 300 500 700 900 1100 1300 1500m/z 19001700
232.12y2
331.31y3
559.25y5
674.35y6
821.55y7
968.30y8
1131.44y9
1245.38y10
1344.23y11
1401.32y121458.29y13
1605.40y14
1706.27y15
1834.52y16
487.24b2
588.18b3
792.12b5 849.14
b6948.30b7
1062.54b8
1225.15b9
1372.42b10
1519.43b11
1634.48b12
1733.70b13
1862.61b14
735.20b4
359.16b1
Peptide Sequence:EQTFGGVNYFFDVEVGRProtein Name : Human Cystatin-S
Observed m/z= 1097.02702+
Theoretical m/z= 1097.04432+
124 126 128 130 132 134m/z
05
101520253035404550556065707580859095
100
Rel
ativ
e A
yund
ance 126
127 129
128
131Ratio 126:127:128:129:130:131=1:0.30:0.09:0.25:0.00:1.49
99.17Val
227.94 (129+99)Glu-Val
115.10Asp
147.20Phe
146.75Phe
163.14Tyr
113.94Asn
98.85Val
57.09Gly
56.97Gly
147.11Phe
100.87Thr
128.25Gln
99.22Val
115.05Asp
147.01Phe
147.27Phe
162.61Tyr
114.24Asn
99.16Val
56.92Gly
57.02Gly
147.02Phe
100.94Thr
128.08Gln
128.91Glu
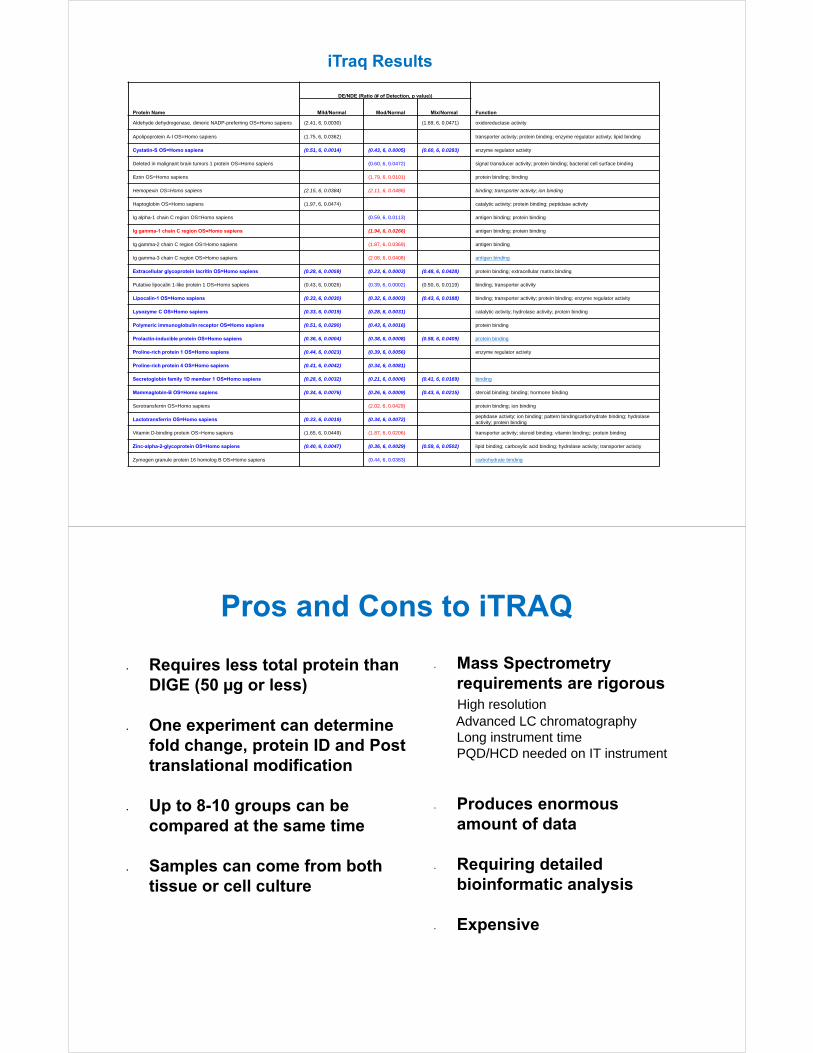
iTraq MASCOT Results
Protein Name
DE/NDE (Ratio (# of Detection, p value))
FunctionMild/Normal Mod/Normal Mix/Normal
Aldehyde dehydrogenase, dimeric NADP-preferring OS=Homo sapiens (2.41, 6, 0.0030) (1.69, 6, 0.0471) oxidoreductase activity
Apolipoprotein A-I OS=Homo sapiens (1.75, 6, 0.0362) transporter activity; protein binding; enzyme regulator activity; lipid binding
Cystatin-S OS=Homo sapiens (0.51, 6, 0.0014) (0.43, 6, 0.0005) (0.60, 6, 0.0283) enzyme regulator activity
Deleted in malignant brain tumors 1 protein OS=Homo sapiens (0.60, 6, 0.0472) signal transducer activity; protein binding; bacterial cell surface binding
Ezrin OS=Homo sapiens (1.79, 6, 0.0101) protein binding; binding
Hemopexin OS=Homo sapiens (2.15, 6, 0.0384) (2.11, 6, 0.0486) binding; transporter activity; ion binding
Haptoglobin OS=Homo sapiens (1.97, 6, 0.0474) catalytic activity; protein binding; peptidase activity
Ig alpha-1 chain C region OS=Homo sapiens (0.59, 6, 0.0113) antigen binding; protein binding
Ig gamma-1 chain C region OS=Homo sapiens (1.94, 6, 0.0266) antigen binding; protein binding
Ig gamma-2 chain C region OS=Homo sapiens (1.87, 6, 0.0369) antigen binding
Ig gamma-3 chain C region OS=Homo sapiens (2.08, 6, 0.0408) antigen binding
Extracellular glycoprotein lacritin OS=Homo sapiens (0.28, 6, 0.0059) (0.23, 6, 0.0003) (0.48, 6, 0.0428) protein binding; extracellular matrix binding
Putative lipocalin 1-like protein 1 OS=Homo sapiens (0.43, 6, 0.0026) (0.39, 6, 0.0002) (0.50, 6, 0.0119) binding; transporter activity
Lipocalin-1 OS=Homo sapiens (0.33, 6, 0.0030) (0.32, 6, 0.0003) (0.43, 6, 0.0188) binding; transporter activity; protein binding; enzyme regulator activity
Lysozyme C OS=Homo sapiens (0.33, 6, 0.0019) (0.28, 6, 0.0031) catalytic activity; hydrolase activity; protein binding
Polymeric immunoglobulin receptor OS=Homo sapiens (0.51, 6, 0.0290) (0.43, 6, 0.0016) protein binding
Prolactin-inducible protein OS=Homo sapiens (0.36, 6, 0.0004) (0.38, 6, 0.0008) (0.58, 6, 0.0409) protein binding
Proline-rich protein 1 OS=Homo sapiens (0.44, 6, 0.0023) (0.39, 6, 0.0056) enzyme regulator activity
Proline-rich protein 4 OS=Homo sapiens (0.41, 6, 0.0042) (0.34, 6, 0.0081)
Secretoglobin family 1D member 1 OS=Homo sapiens (0.28, 6, 0.0032) (0.21, 6, 0.0006) (0.41, 6, 0.0169) binding
Mammaglobin-B OS=Homo sapiens (0.34, 6, 0.0076) (0.26, 6, 0.0009) (0.43, 6, 0.0215) steroid binding; binding; hormone binding
Serotransferrin OS=Homo sapiens (2.02, 6, 0.0429) protein binding; ion binding
Lactotransferrin OS=Homo sapiens (0.33, 6, 0.0019) (0.34, 6, 0.0072)peptidase activity; ion binding; pattern bindingcarbohydrate binding; hydrolase activity; protein binding
Vitamin D-binding protein OS=Homo sapiens (1.65, 6, 0.0449) (1.87, 6, 0.0206) transporter activity; steroid binding; vitamin binding;: protein binding
Zinc-alpha-2-glycoprotein OS=Homo sapiens (0.40, 6, 0.0047) (0.36, 6, 0.0029) (0.59, 6, 0.0502) lipid binding; carboxylic acid binding; hydrolase activity; transporter activity
Zymogen granule protein 16 homolog B OS=Homo sapiens (0.44, 6, 0.0383) carbohydrate binding
iTraq Results
Pros and Cons to iTRAQ
Requires less total protein than DIGE (50 µg or less)
One experiment can determine fold change, protein ID and Post translational modification
Up to 8-10 groups can be compared at the same time
Samples can come from both tissue or cell culture
• Mass Spectrometry requirements are rigorousHigh resolutionAdvanced LC chromatographyLong instrument timePQD/HCD needed on IT instrument
• Produces enormous amount of data
• Requiring detailed bioinformatic analysis
• Expensive
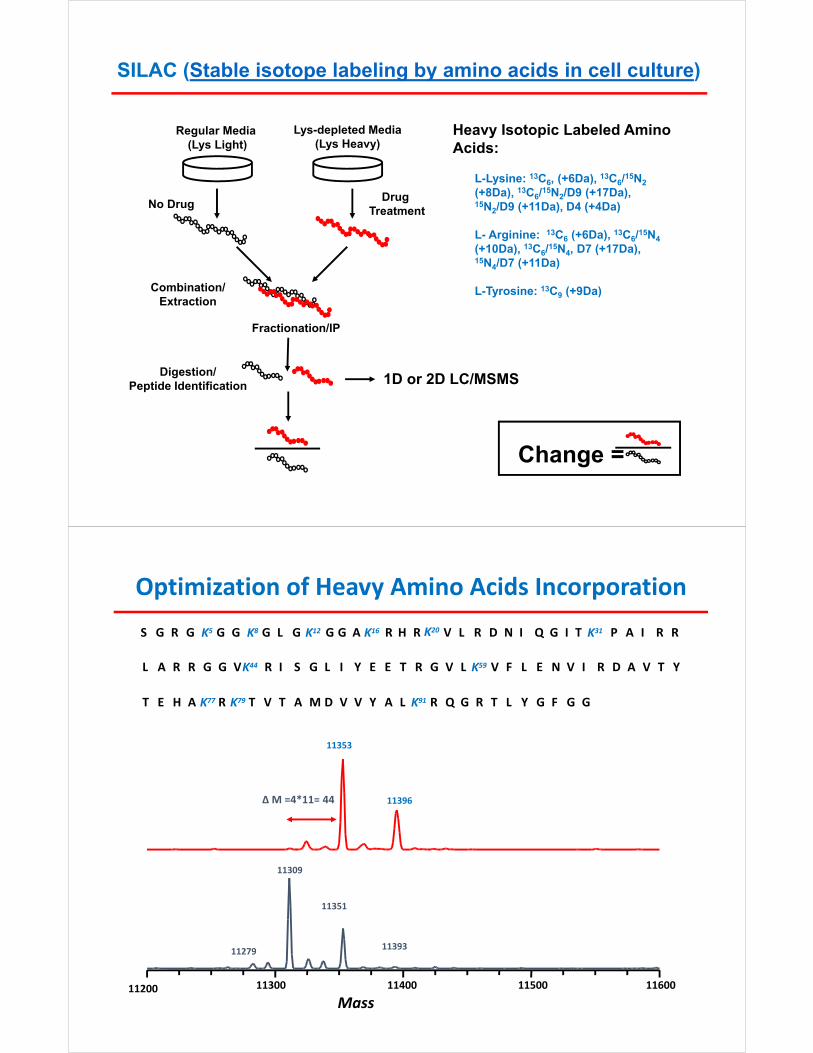
SILAC (Stable isotope labeling by amino acids in cell culture)
Regular Media (Lys Light)
No Drug
Lys-depleted Media(Lys Heavy)
Drug Treatment
Combination/Extraction
Change =
Digestion/Peptide Identification
Fractionation/IP
Heavy Isotopic Labeled Amino Acids:
L-Lysine: 13C6, (+6Da), 13C6/15N2
(+8Da), 13C6/15N2/D9 (+17Da), 15N2/D9 (+11Da), D4 (+4Da)
L- Arginine: 13C6 (+6Da), 13C6/15N4
(+10Da), 13C6/15N4, D7 (+17Da),15N4/D7 (+11Da)
L-Tyrosine: 13C9 (+9Da)
1D or 2D LC/MSMS
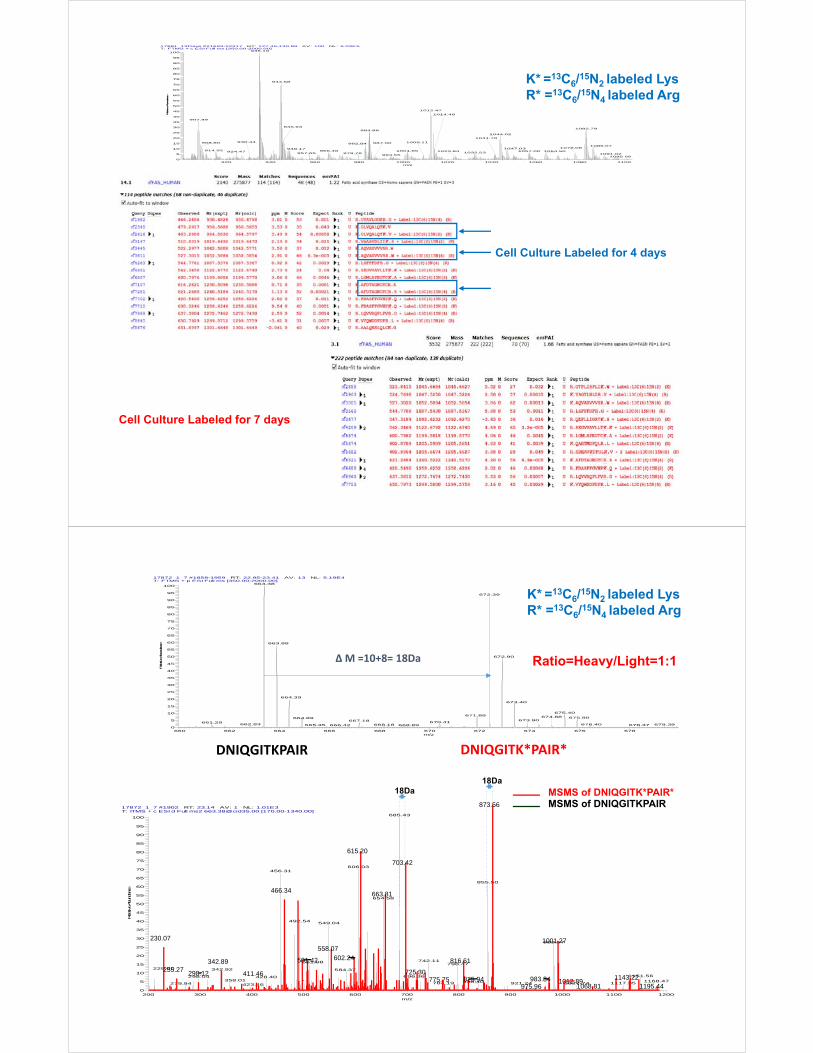
Optimization of Heavy Amino Acids Incorporation
S G R G K5 G G K8 G L G K12 G G A K16 R H R K20 V L R D N I Q G I T K31 P A I R R
L A R R G G VK44 R I S G L I Y E E T R G V L K59 V F L E N V I R D A V T Y
T E H A K77 R K79 T V T A M D V V Y A L K91 R Q G R T L Y G F G G
∆ M =4*11= 44
11353
11396
11309
11279
11351
11393
11200 11300 11400 11500 11600
Mass
17881_13Days #21693-22317 RT: 127.45-130.89 AV: 100 NL: 6.03E5T: FTMS + c ESI Full ms [350.00-2000.00]
920 940 960 980 1000 1020 1040 1060 1080 1100m/z
0
5
10
15
20
25
30
35
40
45
50
55
60
65
70
75
80
85
90
95
100
Relative Abundance
935.19
944.68
1012.47
907.49
1082.79984.88
1044.02
945.93
982.84908.80
1086.07
1014.48
1047.03948.171001.85966.48 1057.00 1064.50924.47914.92
1032.53
1078.08
1041.70
957.65 979.78 1091.02
930.44 1009.11
1023.84
994.55
987.00
1095.56
K* =13C6/15N2 labeled LysR* =13C6/15N4 labeled Arg
Cell Culture Labeled for 4 days
Cell Culture Labeled for 7 days
17872_1_7 #1858-1959 RT: 22.95-23.41 AV: 13 NL: 5.19E4T: FTMS + p ESI Full ms [350.00-2000.00]
660 662 664 666 668 670 672 674 676 678m/z
0
5
10
15
20
25
30
35
40
45
50
55
60
65
70
75
80
85
90
95
100
Relative Abundance
663.38
672.39
663.88
672.90
664.39
673.40
675.40671.89
675.90664.89673.90667.18 670.41661.29
674.88
662.83 676.40 679.39668.18665.35 678.37666.42 668.89
18Da18Da
∆ M =10+8= 18Da
DNIQGITKPAIR DNIQGITK*PAIR*
K* =13C6/15N2 labeled LysR* =13C6/15N4 labeled Arg
17872_1_7 #1902 RT: 23.14 AV: 1 NL: 1.01E3T: ITMS + c ESI d Full ms2 [email protected] [170.00-1340.00]
200 300 400 500 600 700 800 900 1000 1100 1200m/z
0
5
10
15
20
25
30
35
40
45
50
55
60
65
70
75
80
85
90
95
100
Relative Abundance
685.43
606.03456.31
855.50
654.58
492.54549.04
983.57
742.11511.08798.47
229.90 342.92 584.37
1151.56696.36298.04 428.40358.01 1168.47838.40784.19 1117.35921.24 1027.74279.94 423.46
873.56
615.20
703.42
663.81466.34
1001.27230.07
558.07
602.24501.42 816.61342.89
725.301143.22
255.27
983.84825.94775.75 1012.89298.12 411.46
1068.81 1195.44975.96
MSMS of DNIQGITK*PAIR* MSMS of DNIQGITKPAIR
Ratio=Heavy/Light=1:1
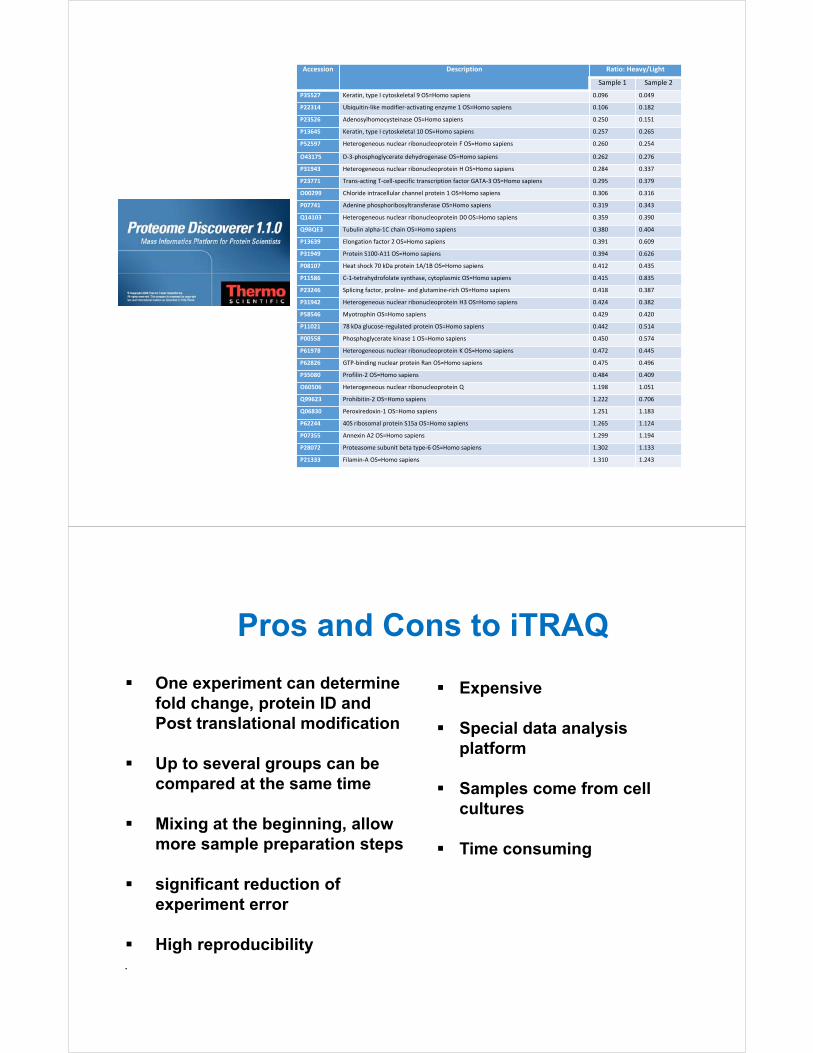
Accession Description Ratio: Heavy/Light
Sample 1 Sample 2
P35527 Keratin, type I cytoskeletal 9 OS=Homo sapiens 0.096 0.049
P22314 Ubiquitin‐like modifier‐activating enzyme 1 OS=Homo sapiens 0.106 0.182
P23526 Adenosylhomocysteinase OS=Homo sapiens 0.250 0.151
P13645 Keratin, type I cytoskeletal 10 OS=Homo sapiens 0.257 0.265
P52597 Heterogeneous nuclear ribonucleoprotein F OS=Homo sapiens 0.260 0.254
O43175 D‐3‐phosphoglycerate dehydrogenase OS=Homo sapiens 0.262 0.276
P31943 Heterogeneous nuclear ribonucleoprotein H OS=Homo sapiens 0.284 0.337
P23771 Trans‐acting T‐cell‐specific transcription factor GATA‐3 OS=Homo sapiens 0.295 0.379
O00299 Chloride intracellular channel protein 1 OS=Homo sapiens 0.306 0.316
P07741 Adenine phosphoribosyltransferase OS=Homo sapiens 0.319 0.343
Q14103 Heterogeneous nuclear ribonucleoprotein D0 OS=Homo sapiens 0.359 0.390
Q9BQE3 Tubulin alpha‐1C chain OS=Homo sapiens 0.380 0.404
P13639 Elongation factor 2 OS=Homo sapiens 0.391 0.609
P31949 Protein S100‐A11 OS=Homo sapiens 0.394 0.626
P08107 Heat shock 70 kDa protein 1A/1B OS=Homo sapiens 0.412 0.435
P11586 C‐1‐tetrahydrofolate synthase, cytoplasmic OS=Homo sapiens 0.415 0.835
P23246 Splicing factor, proline‐ and glutamine‐rich OS=Homo sapiens 0.418 0.387
P31942 Heterogeneous nuclear ribonucleoprotein H3 OS=Homo sapiens 0.424 0.382
P58546 Myotrophin OS=Homo sapiens 0.429 0.420
P11021 78 kDa glucose‐regulated protein OS=Homo sapiens 0.442 0.514
P00558 Phosphoglycerate kinase 1 OS=Homo sapiens 0.450 0.574
P61978 Heterogeneous nuclear ribonucleoprotein K OS=Homo sapiens 0.472 0.445
P62826 GTP‐binding nuclear protein Ran OS=Homo sapiens 0.475 0.496
P35080 Profilin‐2 OS=Homo sapiens 0.484 0.409
O60506 Heterogeneous nuclear ribonucleoprotein Q 1.198 1.051
Q99623 Prohibitin‐2 OS=Homo sapiens 1.222 0.706
Q06830 Peroxiredoxin‐1 OS=Homo sapiens 1.251 1.183
P62244 40S ribosomal protein S15a OS=Homo sapiens 1.265 1.124
P07355 Annexin A2 OS=Homo sapiens 1.299 1.194
P28072 Proteasome subunit beta type‐6 OS=Homo sapiens 1.302 1.133
P21333 Filamin‐A OS=Homo sapiens 1.310 1.243
Pros and Cons to iTRAQ
Expensive
Special data analysis platform
Samples come from cell cultures
Time consuming
One experiment can determine fold change, protein ID and Post translational modification
Up to several groups can be compared at the same time
Mixing at the beginning, allow more sample preparation steps
significant reduction of experiment error
High reproducibility
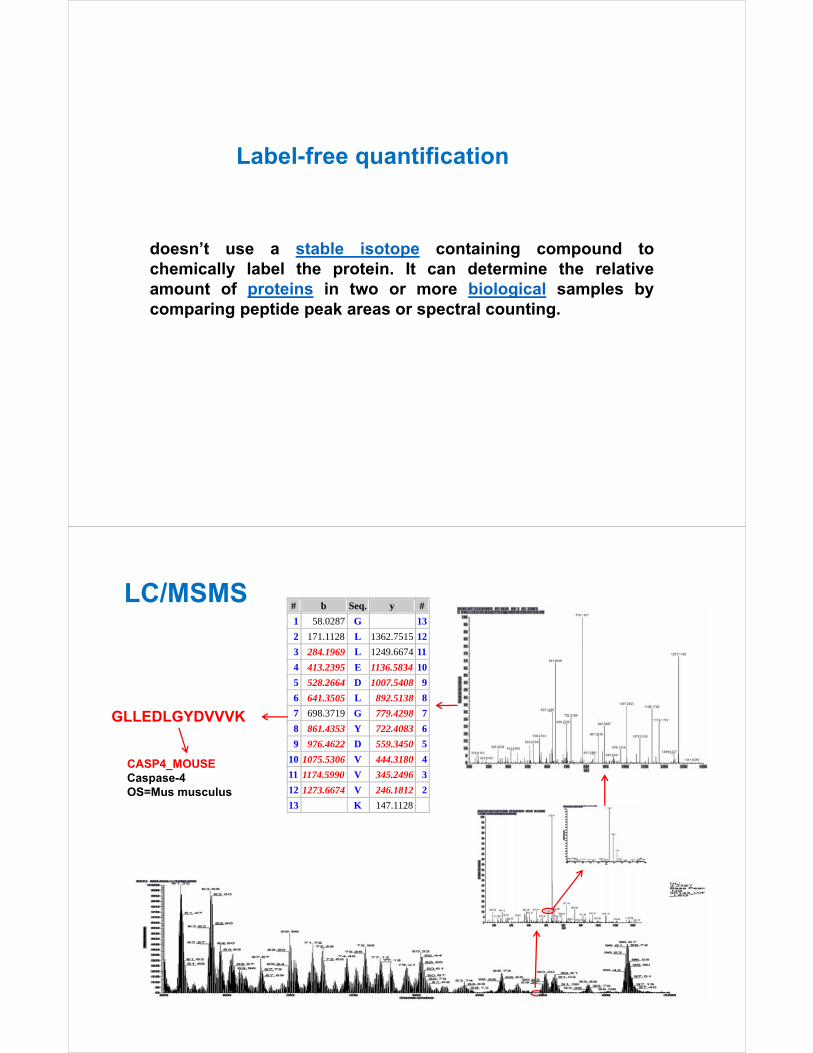
doesn’t use a stable isotope containing compound tochemically label the protein. It can determine the relativeamount of proteins in two or more biological samples bycomparing peptide peak areas or spectral counting.
Label-free quantification
# b Seq. y #
1 58.0287 G 13
2 171.1128 L 1362.7515 12
3 284.1969 L 1249.6674 11
4 413.2395 E 1136.5834 10
5 528.2664 D 1007.5408 9
6 641.3505 L 892.5138 8
7 698.3719 G 779.4298 7
8 861.4353 Y 722.4083 6
9 976.4622 D 559.3450 5
10 1075.5306 V 444.3180 4
11 1174.5990 V 345.2496 3
12 1273.6674 V 246.1812 2
13 K 147.1128
GLLEDLGYDVVVK
CASP4_MOUSECaspase-4OS=Mus musculus
LC/MSMS
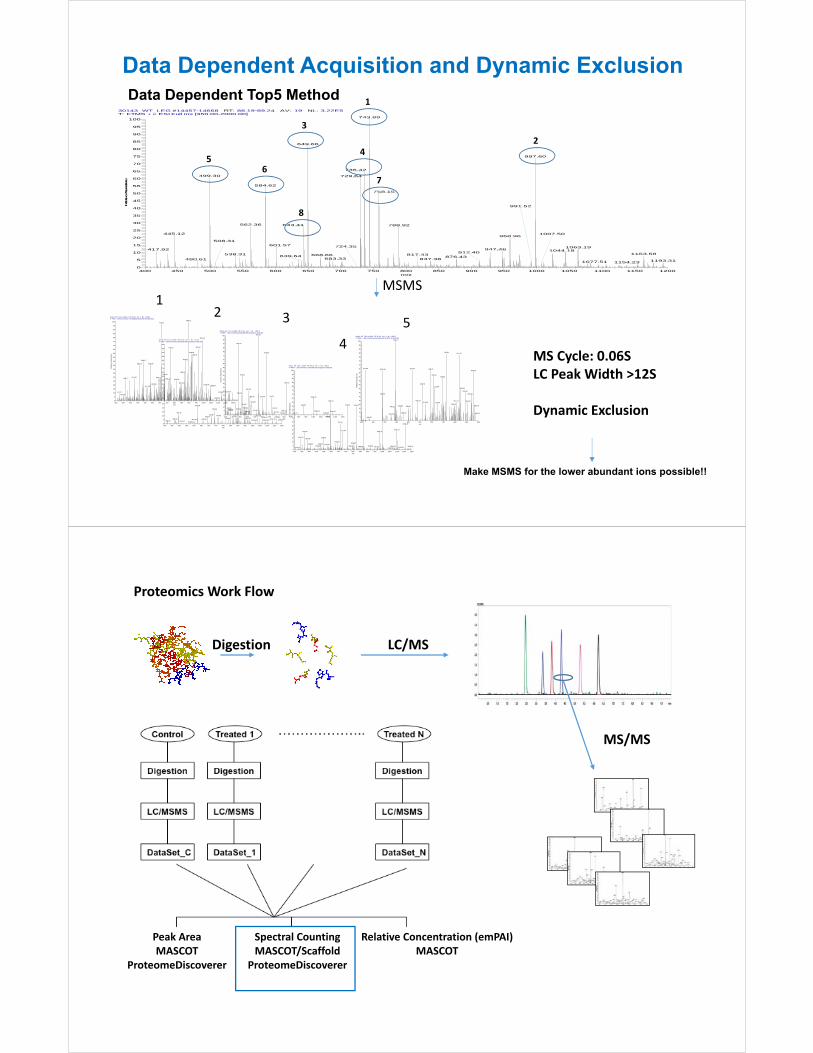
Data Dependent Top5 Method
Data Dependent Acquisition and Dynamic Exclusion
30143_WT_LEG #14457-14668 RT: 88.19-89.24 AV: 19 NL: 3.22E5T: FTMS + c ESI Full ms [350.00-2000.00]
400 450 500 550 600 650 700 750 800 850 900 950 1000 1050 1100 1150 1200m/z
0
5
10
15
20
25
30
35
40
45
50
55
60
65
70
75
80
85
90
95
100
Relative Abundance
743.89
649.66
997.60
736.42
499.30 729.64
584.62
758.15
562.36 643.41 788.92
445.12958.96
601.571063.19
947.46417.92 1044.181163.58538.31 668.66
876.43683.33
991.52
837.38480.61639.64
912.40817.43
1007.50
1193.31
508.31
1077.51 1154.23
724.35
1
3
2
54
67
8
MSMS
30143_WT_LEG #14664 RT: 89.25 AV: 1 NL: 1.39E3T: ITMS + c ESI d Full ms2 [email protected] [190.00-2000.00]
400 450 500 550 600 650 700 750 800 850 900 950 1000 1050 1100 1150 1200m/z
0
5
10
15
20
25
30
35
40
45
50
55
60
65
70
75
80
85
90
95
100
Re
lativ
e A
bu
nda
nce
898.13712.51
991.16
962.47776.52
918.39
926.34
878.32589.17
638.90560.70
869.18
734.69
525.26 693.22468.12 766.40 816.38
850.10660.95 1019.05
1048.37617.69
1167.301120.23424.27
454.82
1092.28
30143_WT_LEG #14306 RT: 87.35 AV: 1 NL: 7.47E2T: ITMS + c ESI d Full ms2 [email protected] [260.00-2000.00]
400 450 500 550 600 650 700 750 800 850 900 950 1000 1050 1100 1150 1200m/z
0
5
10
15
20
25
30
35
40
45
50
55
60
65
70
75
80
85
90
95
100
Re
lativ
e A
bu
nda
nce
907.18
945.07624.99
738.98 850.52950.34
497.15722.80 767.95 1037.29898.17693.97 1167.831066.54
963.19833.56468.92 1136.33668.46601.35 1196.351022.35 1101.94418.44 511.27 579.50
30143_WT_LEG #14360 RT: 87.64 AV: 1 NL: 1.09E3T: ITMS + c ESI d Full ms2 [email protected] [140.00-1660.00]
400 450 500 550 600 650 700 750 800 850 900 950 1000 1050 1100 1150 1200m/z
0
5
10
15
20
25
30
35
40
45
50
55
60
65
70
75
80
85
90
95
100
Re
lativ
e A
bu
nda
nce
622.91
679.63
515.34
819.15
557.39
510.16
715.31651.39566.39 1001.25
466.65574.64
932.45
540.92409.65 724.31501.05
420.13 611.22 809.47 1019.31 1132.30737.84 1100.22793.33 873.75
30143_WT_LEG #14467 RT: 88.20 AV: 1 NL: 4.03E3T: ITMS + c ESI d Full ms2 [email protected] [190.00-1485.00]
400 450 500 550 600 650 700 750 800 850 900 950 1000 1050 1100 1150 1200m/z
0
5
10
15
20
25
30
35
40
45
50
55
60
65
70
75
80
85
90
95
100
Re
lativ
e A
bu
nda
nce
1002.30
648.24
761.20 824.14
644.32
874.36711.34
1158.45
1097.28727.35984.16470.06
442.20 598.03487.98
693.59805.93
580.22509.03 622.06562.69 919.63795.91 1193.021080.75868.80 967.13 1118.91424.11 1068.94
30143_WT_LEG #14359 RT: 87.63 AV: 1 NL: 3.35E2T: ITMS + c ESI d Full ms2 [email protected] [215.00-2000.00]
400 450 500 550 600 650 700 750 800 850 900m/z
0
5
10
15
20
25
30
35
40
45
50
55
60
65
70
75
80
85
90
95
100
Re
lativ
e A
bu
nda
nce
546.11
762.93817.42
417.30 617.37 696.97878.39
706.20746.46
660.79
711.89822.64
842.66
489.08 869.10
641.63 807.75 854.16674.05 725.63
799.31881.19566.84 599.46540.10
580.62 886.21526.61
432.28
12 3
4
5
MS Cycle: 0.06SLC Peak Width >12S
Dynamic Exclusion
Make MSMS for the lower abundant ions possible!!
Digestion LC/MS
MS/MS
Proteomics Work Flow
Peak AreaMASCOT
ProteomeDiscoverer
Spectral CountingMASCOT/Scaffold
ProteomeDiscoverer
Relative Concentration (emPAI)MASCOT
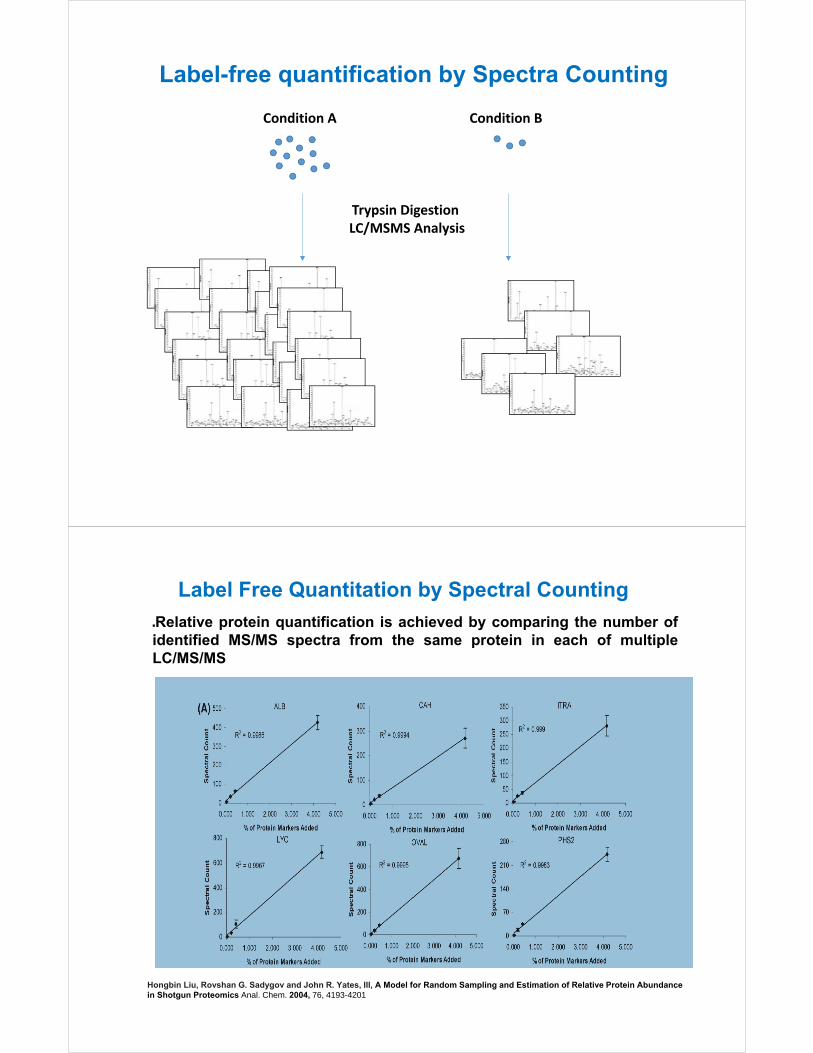
Label-free quantification by Spectra Counting
Condition A Condition B
Trypsin Digestion LC/MSMS Analysis
Label Free Quantitation by Spectral Counting
Relative protein quantification is achieved by comparing the number ofidentified MS/MS spectra from the same protein in each of multipleLC/MS/MS
Hongbin Liu, Rovshan G. Sadygov and John R. Yates, III, A Model for Random Sampling and Estimation of Relative Protein Abundance in Shotgun Proteomics Anal. Chem. 2004, 76, 4193-4201
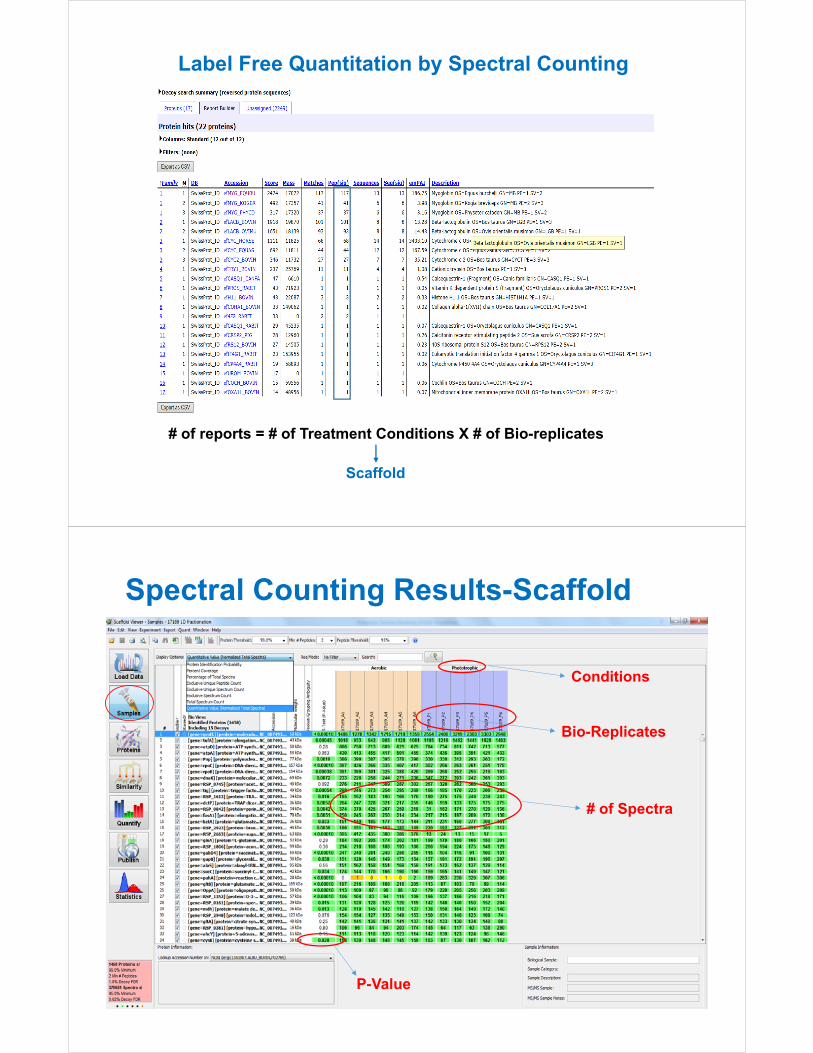
# of reports = # of Treatment Conditions X # of Bio-replicates
Scaffold
Label Free Quantitation by Spectral Counting
Spectral Counting Results-Scaffold
Conditions
Bio-Replicates
P-Value
# of Spectra
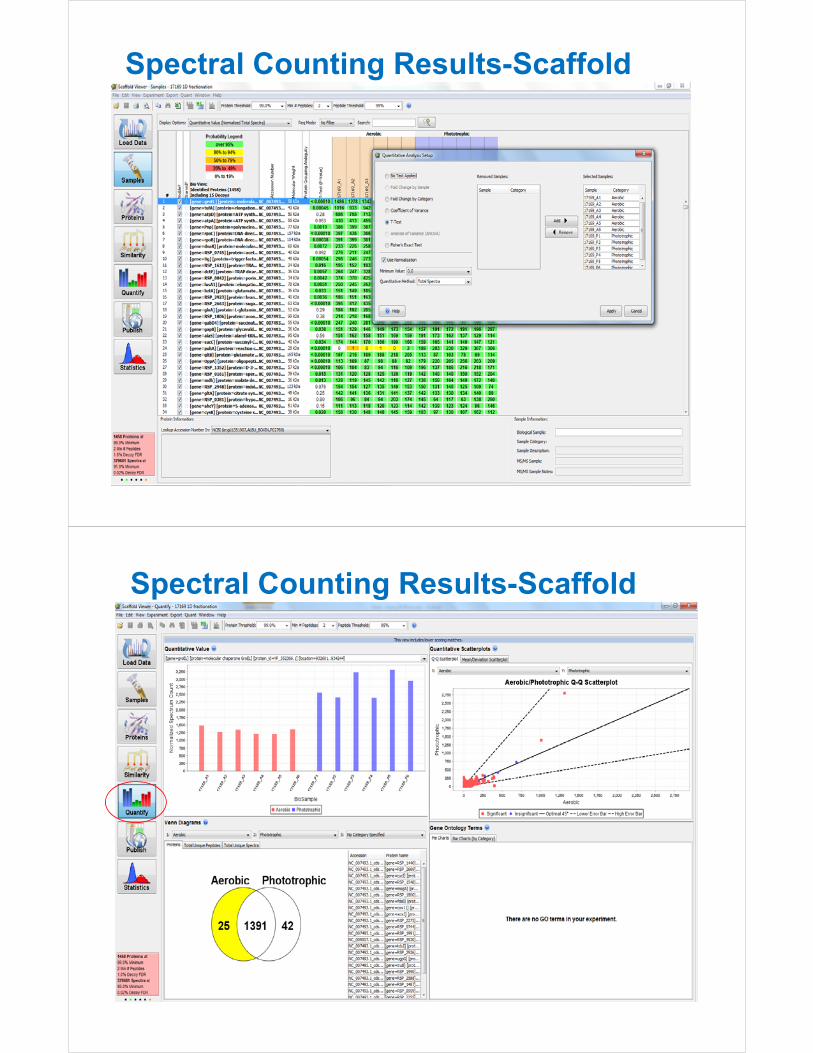
Spectral Counting Results-Scaffold
Spectral Counting Results-Scaffold
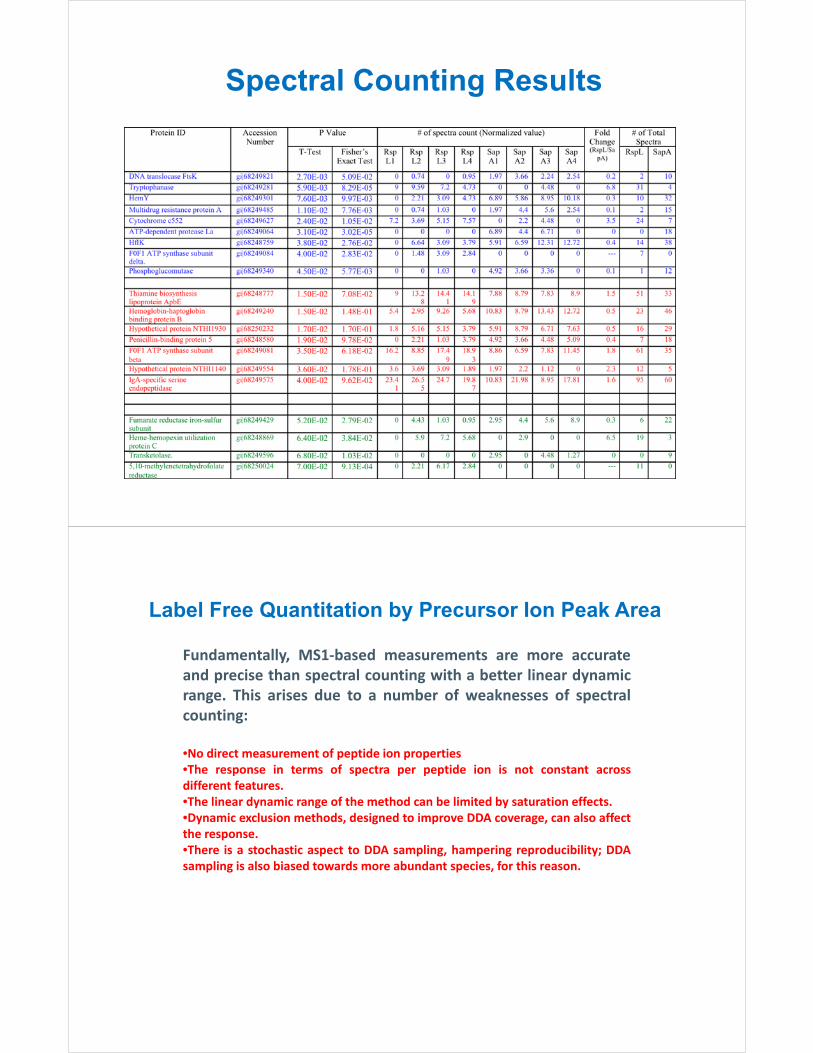
Spectral Counting Results
Fundamentally, MS1‐based measurements are more accurateand precise than spectral counting with a better linear dynamicrange. This arises due to a number of weaknesses of spectralcounting:
•No direct measurement of peptide ion properties•The response in terms of spectra per peptide ion is not constant acrossdifferent features.•The linear dynamic range of the method can be limited by saturation effects.•Dynamic exclusion methods, designed to improve DDA coverage, can also affectthe response.•There is a stochastic aspect to DDA sampling, hampering reproducibility; DDAsampling is also biased towards more abundant species, for this reason.
Label Free Quantitation by Precursor Ion Peak Area
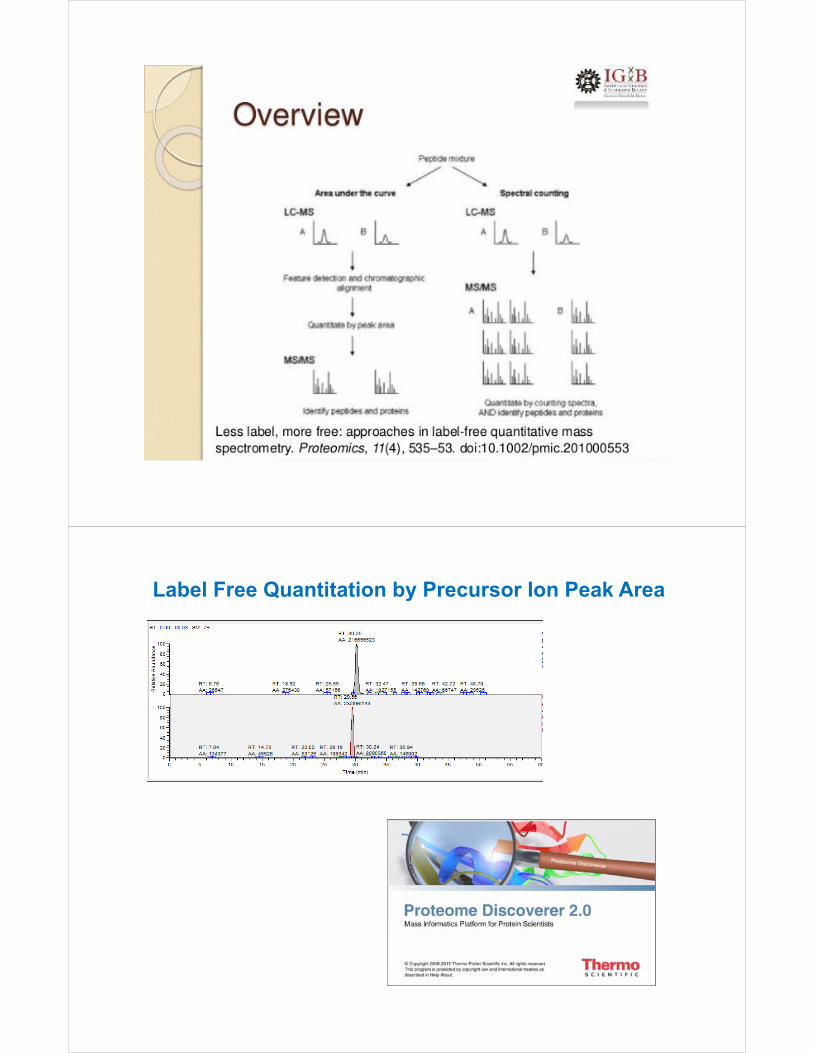
Label Free Quantitation by Precursor Ion Peak Area
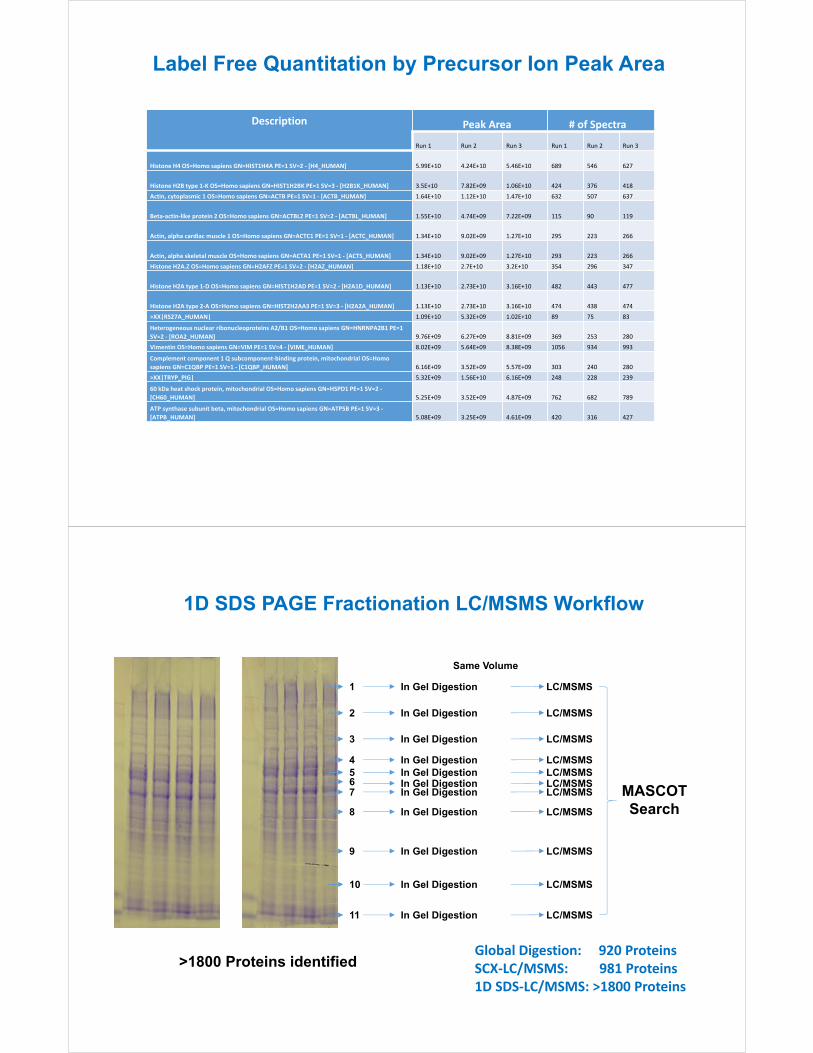
Description Peak Area # of Spectra
Run 1 Run 2 Run 3 Run 1 Run 2 Run 3
Histone H4 OS=Homo sapiens GN=HIST1H4A PE=1 SV=2 ‐ [H4_HUMAN] 5.99E+10 4.24E+10 5.46E+10 689 546 627
Histone H2B type 1‐K OS=Homo sapiens GN=HIST1H2BK PE=1 SV=3 ‐ [H2B1K_HUMAN] 3.5E+10 7.82E+09 1.06E+10 424 376 418
Actin, cytoplasmic 1 OS=Homo sapiens GN=ACTB PE=1 SV=1 ‐ [ACTB_HUMAN] 1.64E+10 1.12E+10 1.47E+10 632 507 637
Beta‐actin‐like protein 2 OS=Homo sapiens GN=ACTBL2 PE=1 SV=2 ‐ [ACTBL_HUMAN] 1.55E+10 4.74E+09 7.22E+09 115 90 119
Actin, alpha cardiac muscle 1 OS=Homo sapiens GN=ACTC1 PE=1 SV=1 ‐ [ACTC_HUMAN] 1.34E+10 9.02E+09 1.27E+10 295 223 266
Actin, alpha skeletal muscle OS=Homo sapiens GN=ACTA1 PE=1 SV=1 ‐ [ACTS_HUMAN] 1.34E+10 9.02E+09 1.27E+10 293 223 266
Histone H2A.Z OS=Homo sapiens GN=H2AFZ PE=1 SV=2 ‐ [H2AZ_HUMAN] 1.18E+10 2.7E+10 3.2E+10 354 296 347
Histone H2A type 1‐D OS=Homo sapiens GN=HIST1H2AD PE=1 SV=2 ‐ [H2A1D_HUMAN] 1.13E+10 2.73E+10 3.16E+10 482 443 477
Histone H2A type 2‐A OS=Homo sapiens GN=HIST2H2AA3 PE=1 SV=3 ‐ [H2A2A_HUMAN] 1.13E+10 2.73E+10 3.16E+10 474 438 474
>XX|RS27A_HUMAN| 1.09E+10 5.32E+09 1.02E+10 89 75 83
Heterogeneous nuclear ribonucleoproteins A2/B1 OS=Homo sapiens GN=HNRNPA2B1 PE=1
SV=2 ‐ [ROA2_HUMAN] 9.76E+09 6.27E+09 8.81E+09 369 253 280
Vimentin OS=Homo sapiens GN=VIM PE=1 SV=4 ‐ [VIME_HUMAN] 8.02E+09 5.64E+09 8.38E+09 1056 934 993
Complement component 1 Q subcomponent‐binding protein, mitochondrial OS=Homo
sapiens GN=C1QBP PE=1 SV=1 ‐ [C1QBP_HUMAN] 6.16E+09 3.52E+09 5.57E+09 303 240 280
>XX|TRYP_PIG| 5.32E+09 1.56E+10 6.16E+09 248 228 239
60 kDa heat shock protein, mitochondrial OS=Homo sapiens GN=HSPD1 PE=1 SV=2 ‐
[CH60_HUMAN] 5.25E+09 3.52E+09 4.87E+09 762 682 789
ATP synthase subunit beta, mitochondrial OS=Homo sapiens GN=ATP5B PE=1 SV=3 ‐
[ATPB_HUMAN] 5.08E+09 3.25E+09 4.61E+09 420 316 427
Label Free Quantitation by Precursor Ion Peak Area
1
2
3
4567
8
9
10
11
In Gel Digestion
In Gel Digestion
In Gel Digestion
In Gel DigestionIn Gel DigestionIn Gel DigestionIn Gel Digestion
In Gel Digestion
In Gel Digestion
In Gel Digestion
In Gel Digestion
Same Volume
LC/MSMS
LC/MSMS
LC/MSMS
LC/MSMSLC/MSMSLC/MSMSLC/MSMS
LC/MSMS
LC/MSMS
LC/MSMS
LC/MSMS
MASCOT Search
1D SDS PAGE Fractionation LC/MSMS Workflow
>1800 Proteins identifiedGlobal Digestion: 920 ProteinsSCX‐LC/MSMS: 981 Proteins1D SDS‐LC/MSMS: >1800 Proteins
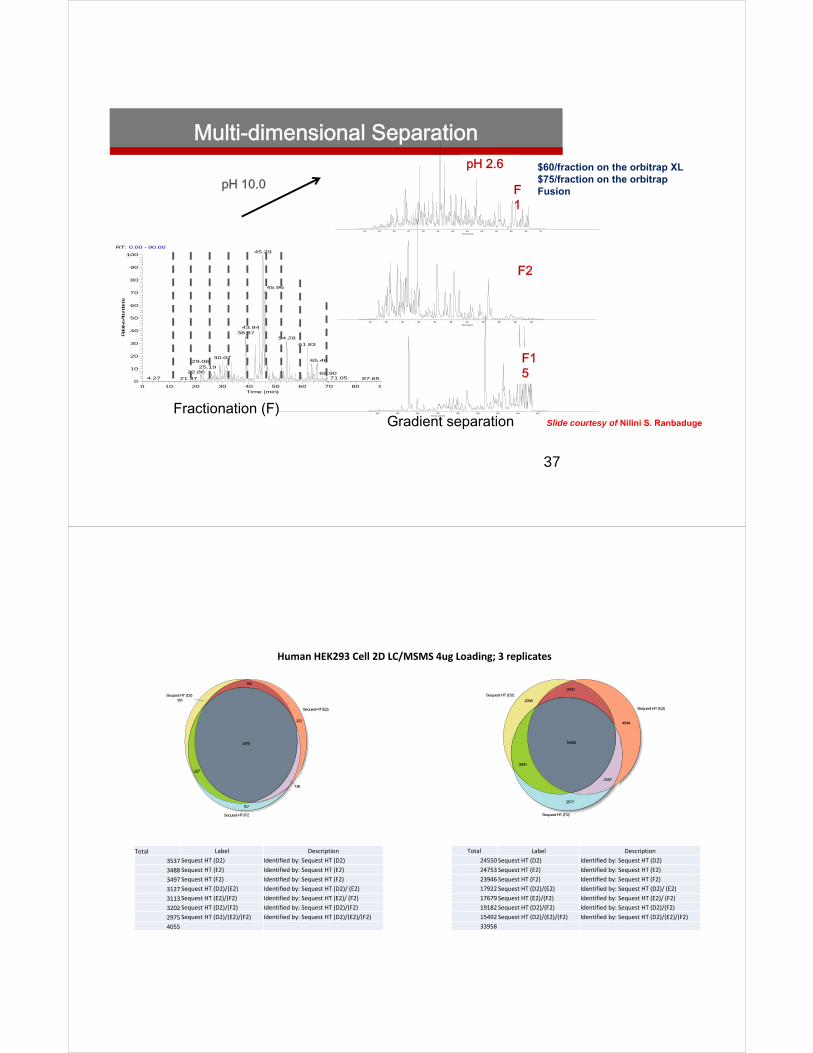
Multi-dimensional Separation
Fractionation (F)
pH 10.0
Gradient separation
pH 2.6
37
RT: 0.00 - 90.00
0 10 20 30 40 50 60 70 80 9Time (min)
0
10
20
30
40
50
60
70
80
90
100
Relative Abu
ndanc
e
45.29
45.96
43.9438.87
54.28
61.83
30.0765.4629.06
25.1922.86 68.90
71.054.27 21.37 87.65
10 15 20 25 30 35 40 45 50 55 60 65 70Time (min)
10 15 20 25 30 35 40 45 50 55 60Time (min)
25 30 35 40 45 50 55 60 65Time (min)
F1
F2
F15
Slide courtesy of Nilini S. Ranbaduge
$60/fraction on the orbitrap XL$75/fraction on the orbitrapFusion
Sequest HT (D2)
2938
Sequest HT (E2)
4644
Sequest HT (F2)
2577
2430
2187
3690
15492
Sequest HT (D2)183
Sequest HT (E2)
223
Sequest HT (F2)
157
152
138
227
2975
Total Label Description
3537 Sequest HT (D2) Identified by: Sequest HT (D2)
3488 Sequest HT (E2) Identified by: Sequest HT (E2)
3497 Sequest HT (F2) Identified by: Sequest HT (F2)
3127 Sequest HT (D2)/(E2) Identified by: Sequest HT (D2)/ (E2)
3113 Sequest HT (E2)/(F2) Identified by: Sequest HT (E2)/ (F2)
3202 Sequest HT (D2)/(F2) Identified by: Sequest HT (D2)/(F2)
2975 Sequest HT (D2)/(E2)/(F2) Identified by: Sequest HT (D2)/(E2)/(F2)
4055
Total Label Description
24550 Sequest HT (D2) Identified by: Sequest HT (D2)
24753 Sequest HT (E2) Identified by: Sequest HT (E2)
23946 Sequest HT (F2) Identified by: Sequest HT (F2)
17922 Sequest HT (D2)/(E2) Identified by: Sequest HT (D2)/ (E2)
17679 Sequest HT (E2)/(F2) Identified by: Sequest HT (E2)/ (F2)
19182 Sequest HT (D2)/(F2) Identified by: Sequest HT (D2)/(F2)
15492 Sequest HT (D2)/(E2)/(F2) Identified by: Sequest HT (D2)/(E2)/(F2)
33958
Human HEK293 Cell 2D LC/MSMS 4ug Loading; 3 replicates
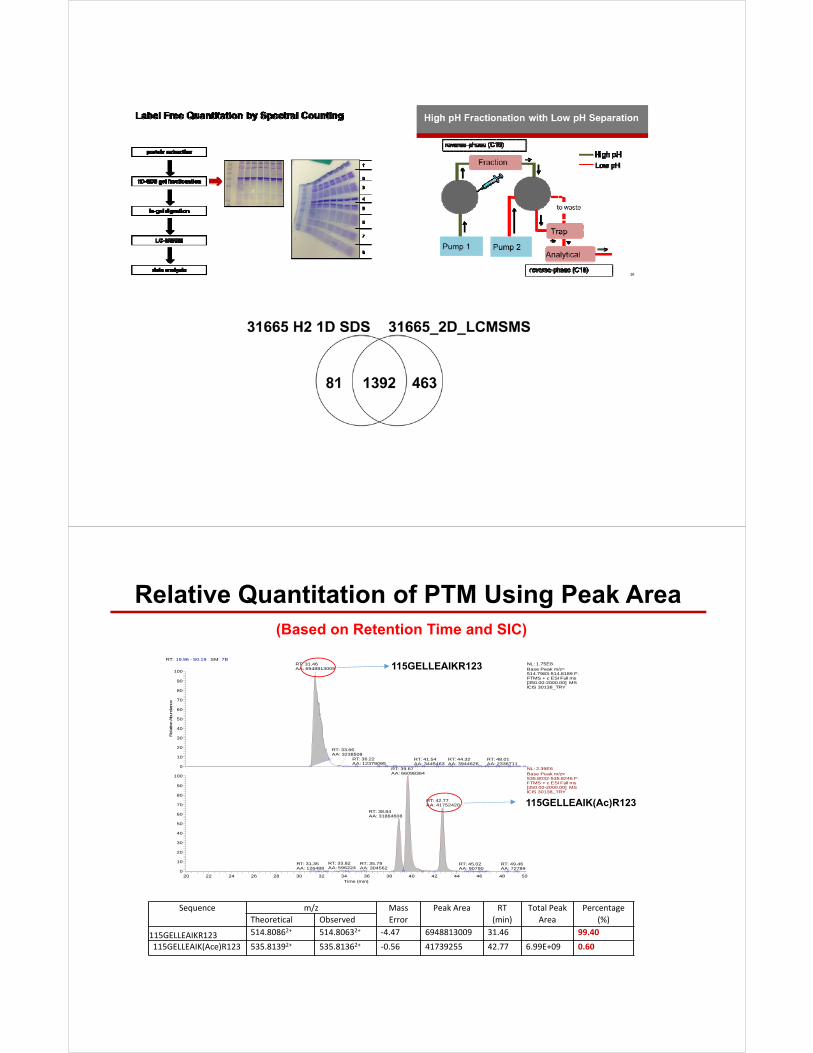
Relative Quantitation of PTM Using Peak Area
RT: 19.96 - 50.19 SM: 7B
20 22 24 26 28 30 32 34 36 38 40 42 44 46 48 50Time (min)
0
10
20
30
40
50
60
70
80
90
100
0
10
20
30
40
50
60
70
80
90
100
Rela
tive A
bunda
nce
RT: 31.46AA: 6948813009
RT: 36.22AA: 12379095
RT: 33.66AA: 3238508
RT: 41.54AA: 3445463
RT: 44.32AA: 3944626
RT: 48.01AA: 2336711
RT: 39.67AA: 66098364
RT: 42.77AA: 41752420
RT: 38.84AA: 31864608
RT: 33.82AA: 596224
RT: 35.79AA: 304562
RT: 31.35AA: 126488
RT: 45.02AA: 90790
RT: 49.46AA: 72789
NL: 1.75E8Base Peak m/z= 514.7983-514.8189 F: FTMS + c ESI Full ms [350.00-2000.00] MS ICIS 30138_TRY
NL: 2.39E6Base Peak m/z= 535.8032-535.8246 F: FTMS + c ESI Full ms [350.00-2000.00] MS ICIS 30138_TRY
Sequence m/z Mass
Error
Peak Area RT
(min)
Total Peak
Area
Percentage
(%)Theoretical Observed
115GELLEAIKR123 514.80862+ 514.80632+ ‐4.47 6948813009 31.46 99.40
115GELLEAIK(Ace)R123 535.81392+ 535.81362+ ‐0.56 41739255 42.77 6.99E+09 0.60
115GELLEAIKR123
115GELLEAIK(Ac)R123
(Based on Retention Time and SIC)
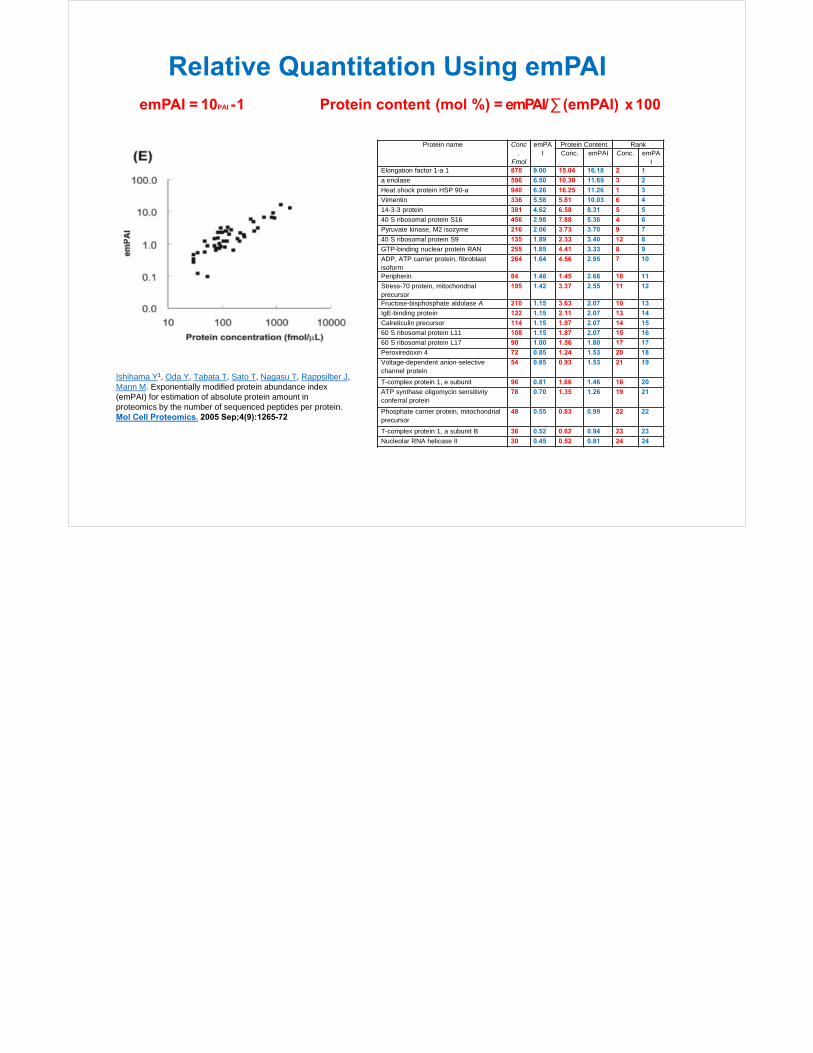
emPAI = 10PAI -1 Protein content (mol %) = emPAI/ ∑ (emPAI) x 100
Protein name Conc.
Fmol
emPAI
Protein Content RankConc. emPAI Conc. emPA
IElongation factor 1-a 1 870 9.00 15.04 16.18 2 1
a enolase 596 6.50 10.30 11.69 3 2
Heat shock protein HSP 90-a 940 6.26 16.25 11.26 1 3
Vimentin 336 5.58 5.81 10.03 6 4
14-3-3 protein 381 4.62 6.58 8.31 5 5
40 S ribosomal protein S16 456 2.98 7.88 5.36 4 6
Pyruvate kinase, M2 isozyme 216 2.06 3.73 3.70 9 7
40 S ribosomal protein S9 135 1.89 2.33 3.40 12 8
GTP-binding nuclear protein RAN 255 1.85 4.41 3.33 8 9
ADP, ATP carrier protein, fibroblast isoform
264 1.64 4.56 2.95 7 10
Peripherin 84 1.48 1.45 2.66 18 11
Stress-70 protein, mitochondrial precursor
195 1.42 3.37 2.55 11 12
Fructose-bisphosphate aldolase A 210 1.15 3.63 2.07 10 13
IgE-binding protein 122 1.15 2.11 2.07 13 14
Calreticulin precursor 114 1.15 1.97 2.07 14 15
60 S ribosomal protein L11 108 1.15 1.87 2.07 15 16
60 S ribosomal protein L17 90 1.00 1.56 1.80 17 17
Peroxiredoxin 4 72 0.85 1.24 1.53 20 18
Voltage-dependent anion-selective channel protein
54 0.85 0.93 1.53 21 19
T-complex protein 1, e subunit 96 0.81 1.66 1.46 16 20
ATP synthase oligomycin sensitivity conferral protein
78 0.70 1.35 1.26 19 21
Phosphate carrier protein, mitochondrial precursor
48 0.55 0.83 0.99 22 22
T-complex protein 1, a subunit B 36 0.52 0.62 0.94 23 23
Nucleolar RNA helicase II 30 0.45 0.52 0.81 24 24
Relative Quantitation Using emPAI
Ishihama Y1, Oda Y, Tabata T, Sato T, Nagasu T, Rappsilber J, Mann M. Exponentially modified protein abundance index (emPAI) for estimation of absolute protein amount in proteomics by the number of sequenced peptides per protein.Mol Cell Proteomics. 2005 Sep;4(9):1265-72

![A Phytophthora infestans Cystatin-Like Protein Targets a · A Phytophthora infestans Cystatin-Like Protein Targets a Novel Tomato Papain-Like Apoplastic Protease1[W][OA] Miaoying](https://img.pdfslide.us/doc/110x75/5e0144a4c3c9354e4912bcaa/a-phytophthora-infestans-cystatin-like-protein-targets-a-a-phytophthora-infestans.jpg)