Embed Size (px)
Citation preview
Quantitative-phase-contrast imaging of a two-level surface described as a 2D linear filtering
process
Luděk Lovicar,* Jiří Komrska, and Radim Chmelík
Institute of Physical Engineering, Faculty of Mechanical Engineering, Brno University of Technology, Technická 2, 616 69 Brno, Czech Republic
Abstract: The paper deals with quantitative phase imaging of two-height-level surface reliefs. The imaging is considered to be a linear system and, consequently, the Fourier transform of the image is the product of the Fourier transform of a 2D function characterizing the surface and a specific 2D coherent transfer function. The Fourier transform of functions specifying periodic surface reliefs is factorized into two functions similar to lattice and structure amplitudes in crystal structure analysis. The approach to the imaging process described in the paper enables us to examine the dependence of the phase image on the surface geometry. Theoretical results are verified experimentally by means of a digital holographic microscope.
©2010 Optical Society of America
OCIS codes: (120.3180) Interferometry; (120.5050) Phase measurement; (120.6650) Surface measurements, figure; (180.3170) Microscopy: Interference microscopy.
References and links
1. T. Wilson, and C. J. R. Sheppard, Theory and practice of scanning optical microscopy (Academic Press, 1984). 2.J. T. Sheridan, and C. J. R. Sheppard, “Modelling of images of square-wave gratings and isolated edges using
rigorous diffraction theory,” Opt. Commun. 105(5-6), 367–378 (1994). 3.J. T. Sheridan, and C. J. R. Sheppard, “Coherent imaging of periodic thick fine isolated structures,” J. Opt. Soc.
Am. A 10(4), 614–632 (1993). 4.M. Gu, and C. J. R. Sheppard, “Effects of defocus and primary spherical aberrations on images of a straight edge in
confocal microscopy,” Appl. Opt. 33(4), 625–630 (1994). 5.J. Kühn, F. Charrière, T. Colomb, E. Cuche, F. Montfort, Y. Emery, P. Marquet, and C. Depeursinge, “Axial sub-
nanometer accuracy in digital holographic microscopy,” Meas. Sci. Technol. 19(7), 074007 (2008). 6. S. D. Nicola, P. Ferraro, A. Finizio, S. Grilli, G. Coppola, M. Iodice, P. D. Natale, and M. Chiarini, “Surface
topography of microstructures in lithium niobate by digital holographic microscopy,” Meas. Sci. Technol. 15(5), 961–968 (2004).
7.Y. Emery, E. Cuche, F. Marquet, S. Bourquin, P. Marquet, J. Kühn, N. Aspert, M. Botkin, and Ch. Depeursinge, “Digital Holographic Microscopy (DHM): Fast and Robust 3D measurements with interferometric resolution for industrial inspection,” in Fringe 2005 – New Optical Sensors and Measurement Systems (Springer, (2006), pp. 667-671.
8.Y. Emery, E. Cuche, F. Marquet, N. Aspert, P. Marquet, J. Kühn, M. Botkine, T. Colomb, F. Montfort, F. Charrière, Ch. Depeursinge, P. Debergh, and R. Conde, “Digital Holographic Microscopy (DHM) for metrology and dynamic characterization of MEMS and MOEMS,“ Proc. SPIE 6186, art. no. 61860N (2006).
9.R. Chmelík, “Three–dimensional scalar imaging in high–aperture low–coherence interference and holographic microscopes,” J. Mod. Opt. 53(18), 2673–2689 (2006).
10.R. Chmelik, H. Uhlirova, P. Kolman, and P. Vesely, “Wide Range Coherence Digital Holographic Microscope,” in Digital Holography and Three-Dimensional Imaging, Technical Digest (CD) (Optical Society of America, 2010), paper DTuA6. http://www.opticsinfobase.org/abstract.cfm?URI=DH-2010-DTuA6
11.J. Komrska, “ The Fourier transform of lattices,” in Proceedings of the International Summer School 27th May – 5th June 1991, Chlum u Třeboně, Czechoslovakia, L. Eckertová and T. Růžička, eds. (Institute of Physics Publishing, Bristol and Philadephia), pp. 87–113.
12.R. Bracewell, The Fourier Transform and Its Applications (McGraw-Hill, 1965), Chap. 6. 13.M. von Laue, and E. H. Wagner, Röntgenstrahl-Interferenzen (Akademische Verlagsgesellschaft, 1960), Chap. 3. 14. www.Luxpop.com: Thin film and bulk index of refraction and photonics calculations. 15. M. Born, and E. Wolf, Principles of Optics. 7th ed. (Cambridge University Press, 2002), Chap. 1.
#132151 - $15.00 USD Received 22 Jul 2010; revised 4 Sep 2010; accepted 5 Sep 2010; published 14 Sep 2010(C) 2010 OSA 27 September 2010 / Vol. 18, No. 20 / OPTICS EXPRESS 20585
16. J. Komrska, “Algebraic expressions of shape amplitudes of polygons and polyhedra,” Optik (Stuttg.) 80, 171–183 (1988).
17. J. Komrska, “Simple derivation of formulas for Fraunhofer diffraction at polygonal apertures,” J. Opt. Soc. 72(10), 1382–1384 (1982).
18. R. Chmelík and Z. Harna, “Parallel-mode confocal microscope,” Opt. Eng. 38, 1635–1639 (1999). 19.E. N. Leith, and J. Upatnieks, “Holography with Achromatic-Fringe Systems,” J. Opt. Soc. Am. A 57(8), 975–980
(1967).
1. Introduction
Microscopic imaging of relief surfaces has been analyzed theoretically especially in connection with confocal imaging and surface metrology by various methods including rigorous diffraction theory for deep-relief analysis and accurate edge detection [1–3]. Effect of defocus and primary spherical aberration on images of a straight edge in confocal microscopy has been analyzed as well [4]. Image intensity was calculated in all these cases.
Quantitative phase contrast imaging by phase-shifting interferometry (PSI) and particularly digital holographic microscopy (DHM) allows subnanometer accuracy of surface relief height measurement [5–8]. Height data are considered to be proportional to the phase differences in the phase image of a surface. These optical techniques are excellent alternative to various local-probe scanning methods (STM, AFM, SNOM) for surface measurement in z-axis and inspection of shallow reliefs, e.g. microstructures and thin-films. The advantage of high frame rate and wide field of DHM is balanced by the drawback of lower lateral resolution. When approaching the resolution limit, the phase image as well as the surface height map is deteriorated by the absence of sufficiently high spatial frequencies.
The aim of the paper was to derive a mathematical description of phase imaging of shallow binary surface reliefs, which are frequent in practice, e.g. in thin film technologies.
The description should correctly account for the effect related to the limited lateral resolution and simultaneously include a wide range of possible surface geometries.
In the section 2 of this paper we propose theoretical analysis of quantitative phase imaging by DHM. We restricted our analysis to shallow reliefs of two depth levels (binary surfaces) with vertical distance of levels under λ/4. Then the interaction of light with a surface can be approximated by a single-scattering process within the scalar theory. As binary we assume such a surface which can be separated into regions the mean height of which acquires only two values. The dispersion of height values inside one region should be comparable with the RMS error of DHM height measurement. In our case this error is in units of nanometers. We supposed that the effect of low lateral resolution exceeds possible deviations of the phase distribution caused by the adopted approximation. Imaging process is described by the linear-systems theory. Doing these simplifications we acquired the theoretic result simply depending on the 2D geometry of a surface relief. In the case of periodic reliefs our description is similar to the kinematic theory of diffraction by 2D crystal lattices. Periodically repeated part of a surface relief is then equivalent to a unit cell of a crystal lattice; the whole surface relief corresponds to the crystal lattice.
In the section 3 the theoretical phase image of a model binary surface relief is compared with the measurement done by means of DHM with quasimonochromatic extended (spatially incoherent) source of light.
2. Theory
2.1 Imaging process description
The theoretical description of DHM overall imaging process is based on analysis presented in Ref [9]. Suppose that DHM consists of two optically equivalent arms containing microscope imaging systems with the Köhler illumination. The image planes of objective lenses intersect one another at nonzero angle thus forming an off-axis image-plane hologram. Its dynamic digital record is on-line numerically processed by Fourier methods to obtain the resulting complex amplitude described by the formula
#132151 - $15.00 USD Received 22 Jul 2010; revised 4 Sep 2010; accepted 5 Sep 2010; published 14 Sep 2010(C) 2010 OSA 27 September 2010 / Vol. 18, No. 20 / OPTICS EXPRESS 20586
( , , ) ( , , ) ( , , ) exp[2 i( )] d d d ,i i i i i i i
u x y z T m n s c m n s mx ny sz m n sπ∞
= + +∫∫∫ (1)
where xi, y
i are the Cartesian coordinates of the point in the object plane conjugated to the
image point, zi is the defocus of a specimen measured positively towards the objective lens
and the variables m, n, s are spatial frequencies in the Cartesian coordinate system. The
integrations are carried out over intervals (-∞, ∞). The 3D coherent transfer function (CTF) of DHM c(m, n, s) depends on the numerical
aperture NA = n sinα of objective lenses (α is their angular aperture, n immersion medium refractive index), and on the coherence of the illumination. In accord with the experimental setup we suppose temporally coherent (quasimonochromatic) but spatially incoherent (broad) source in this paper. This choice seems to be the optimum for quantitative phase measurement [10], because coherence noise is effectively suppressed, lateral resolution is enhanced by factor 2 with respect to spatially coherent illumination and phase shift is simply related to the defocus by Eq. (6). If the optical system of DHM or the coherence characteristics differ from the supposed ones (for example if the imaging system absents in the reference arm or the source is completely coherent), CTF must be recalculated.
The function T(m, n, s) is the Fourier transform of 3D scattering potential t(x, y, z) of the specimen
( , , ) ( , , ) exp[ 2 i( )] d d d ,T m n s t x y z mx ny sz x y zπ∞
= − + +∫∫∫ (2)
where x, y are the Cartesian coordinates in the object plane, z-axis is oriented from the objective lens.
2.2 Imaging of a plane surface
Scattering potential of a homogeneous plane surface is approximated by the function [9]
( , , ) ( ),t x y z zδ= (3)
where δ is the Dirac distribution. The complex amplitude of the image of the t(x, y, z) is expressed by means of the Eqs. (1), (2) by the 1D Fourier transform
0 ( , , ) (0,0, )exp(2 i )d .i i i i i
u x y z c s sz sπ∞
−∞
= ∫ (4)
For low and medium NA objective lenses (NA < 0.5) we can use the following approximation [9]
0( , , ) exp[ (1 cos ) ]sinc[ (1 cos ) ],
i i i i i i
u x y z C ik z k zα α= − + − (5)
where k = 2π/λ, λ is the wavelength of the illumination, C is a constant and sinc x = (sin x)/x. The sinc function describes optical sectioning effect induced by the spatial incoherence of the source. If its spatial extent is reduced, the angular aperture α of the objective lens must be replaced by a smaller effective aperture of the source which results in enlarged thickness of the optical section. With a point source DHM exhibits no sectioning and, simultaneously, the argument of the exponential function in Eq. (5) is replaced by –2ikz
i.
Image phase φ (xi, y
i, z
i) is generally the argument of the complex function u
i(x
i, y
i, z
i),
numerically computed using the four-quadrants inverse tangent to obtain values on interval (–π, π). Then, within the principal-maximum region of the function sinc in Eq. (5), the image
phase φ is proportional to the defocus zi. In the case of broad monochromatic source the
relation is
( , , ) (1 cos )i i i ix y z k zϕ α= − + (6)
#132151 - $15.00 USD Received 22 Jul 2010; revised 4 Sep 2010; accepted 5 Sep 2010; published 14 Sep 2010(C) 2010 OSA 27 September 2010 / Vol. 18, No. 20 / OPTICS EXPRESS 20587
and in the case of a point monochromatic source the proportionality coefficient is replaced by –2k.
2.3 Imaging of a binary relief surface
Assume a surface relief to have two levels, one of zero height (z = 0) and the second of the positive height h (z = z1 = –h). Then, according to Eq. (3), we can approximate its scattering potential by δ(z) for zero height (z = 0) regions and by δ(z – z1) for regions of z = z1. We introduce the function tbin specifying the binary surface relief
1
0 for regions where 0( , )
1 for regions where bin
zt x y
z z
==
=
…
…
(7)
to obtain 3D scattering potential expressed by the function
[ ]1 1 0( , , ) ( , ) ( ) 1 ( , ) ( ),
bin bint x y z t x y r z z t x y r zδ δ= − + − (8)
where r0, r1 are reflection coefficients of bottom and top surface regions, respectively, the angular dependence of which is neglected with respect to supposed low values of the objective lenses NA.
The Fourier transform (2) of the adjusted scattering potential (8) acquires the form
1 1 0 0
( , , ) ( , )[ exp( 2 ) ] ( ) ( ),bin
T m n s T m n r isz r r m nπ δ δ= − − + (9)
where Tbin (m, n) is the 2D Fourier transform (spatial frequency spectrum) of tbin (x, y). The insertion of Eq. (9) into Eq. (1) provides the complex amplitude u
i in the form of the sum
0
( , , ) ( , , ) ( , , ),i i i i i i i i i i i i
binu x y z u x y z u x y z= + (10)
where ui0 is (4) multiplied by r0 and approximated by Eq. (5) with C = r0. The complex
amplitude uibin is expressed by the inverse 2D Fourier transform
1( , , ) ( , ) ( , ; , ) exp[2 i( )] d d ,i i i i i i i
bin bin binu x y z T m n c m n z z mx ny m nπ∞
= +∫∫ (11)
where Tbin is the spectrum of tbin and cbin is CTF of the microscope for the case of the binary surface and is obtained from the 3D CTF [9] of the microscope in the form
{ }1 1 1 0( , ; , ) ( , , ) exp[2 i ( )] exp(2 i ) d .i i i
binc m n z z c m n s r s z z r sz sπ π∞
= − −∫ (12)
This transfer function can be calculated numerically or we can derive an approximate analytic formula for cbin dependent on z
i replacing c(m, n, s) in Eq. (12) by the function which
is unit on the support of c(m, n, s) and zero outside it and by the integration of (12). The formula (11) formally reduces imaging of a 3D binary surface to the imaging of 2D
surface. Calculation of Tbin by the Fourier transform of the function tbin characterizing the surface is the common problem solved in the Fraunhofer diffraction theory and by the mathematical apparatus of structure analysis [11]. The solution is found in an analytical form in many cases, or such a solution is found that considerably reduces the amount of numerical computing.
The example of such a solution is a frequent case of a periodic surface relief. Assuming formally the relief as a periodic crystal lattice and the periodically repeated motif as a crystallographic unit cell enables us to use the mathematical apparatus of structure analysis for the calculation of the function Tbin. Detailed explanation of both concepts correspondence is given in the Table 1. Structure analysis describes a periodic crystal lattice tbin by a regular repetition of a motif fU (unit cell). Mathematically crystal lattice tbin is the convolution of the unit cell fU (x, y) and the lattice function l(x, y) [11]
#132151 - $15.00 USD Received 22 Jul 2010; revised 4 Sep 2010; accepted 5 Sep 2010; published 14 Sep 2010(C) 2010 OSA 27 September 2010 / Vol. 18, No. 20 / OPTICS EXPRESS 20588
( , ) ( , ) ( , ),bin U
t x y f x y l x y= ∗ (13)
where * represents 2D convolution. Using the convolution theorem [12] the 2D Fourier transform of tbin (x, y) is of the following form
( , ) ( , ) ( , ),bin U
T m n F m n L m n= (14)
where FU(m,n), L(m,n) are the Fourier transforms of fU(x, y) and l(x, y), respectively. For a finite 2D square lattice with Nx × Ny lattice points and a lattice parameter a, the lattice function has the form
1 1
( , ) ( ) ( )yx
x y
NN
x y
n n
l x y x n a y n aδ δ= =
= − −∑∑ (15)
and its 2D Fourier transform may be expressed as follows
{ }sin( )sin( )
( , ) exp i [( 1) ( 1) .sin( )sin( )
x y
x y
aN m aN nL m n a N m N n
am an
π ππ
π π= − − + − (16)
Function L(m,n) is named the lattice amplitude in crystal structure analysis [13]. Having the analytical expression for FU(m,n) the spectrum Tbin(m,n) can be completely expressed analytically.
Table 1. Correspondence of a Periodic Relief Description with That of a Periodic Crystal Lattice
Periodic relief: lattice function motif periodic relief
Crystal lattice: lattice function unit cell crystal lattice
Notation: l(x, y) fu(x, y) tbin (x, y) = fu(x, y) *l(x, y)
Scheme:
2.4 Models of surface relief
We chose part of a surface relief of a calibration standard for Atomic Force Microscopy (AFM) APCS-0099 for experimental verification of the theory. According to manufacturer’s data, scanning electron microscope (SEM) and AFM observations, the surface relief is close to a binary one formed by protrusions of blocks with rounded edges placed in points of a square lattice (see Fig. 1a, 1b). We proposed two theoretical models of this relief, both with the square symmetrical lattice function l, but with different unit cells fU – blocks shape with rounded edges (MB model, Fig. 1c) and a cylinder shape (MC model, Fig. 1d). Geometric parameters depicted in Fig. 1 used for calculation according to manufacturer’s data, SEM and AFM measurement were: radius of edge roundness ρ = 632 nm, shift of its centre d = 495 nm, lattice constant a = 3.0 µm, relief height h = 107 nm (protrusions top bases are placed closer to the objective lens). Parameter r for the MC model was set to r = 1228 nm to obtain the same base area of a protrusion.
Material of a substrate is silicon (complex refractive index nSi = 4.138 + i0.014 [14]); its reflectivity r0 = 0.611 + i0.001 has been computed with help of the Fresnel formula for normal incidence [15].
#132151 - $15.00 USD Received 22 Jul 2010; revised 4 Sep 2010; accepted 5 Sep 2010; published 14 Sep 2010(C) 2010 OSA 27 September 2010 / Vol. 18, No. 20 / OPTICS EXPRESS 20589
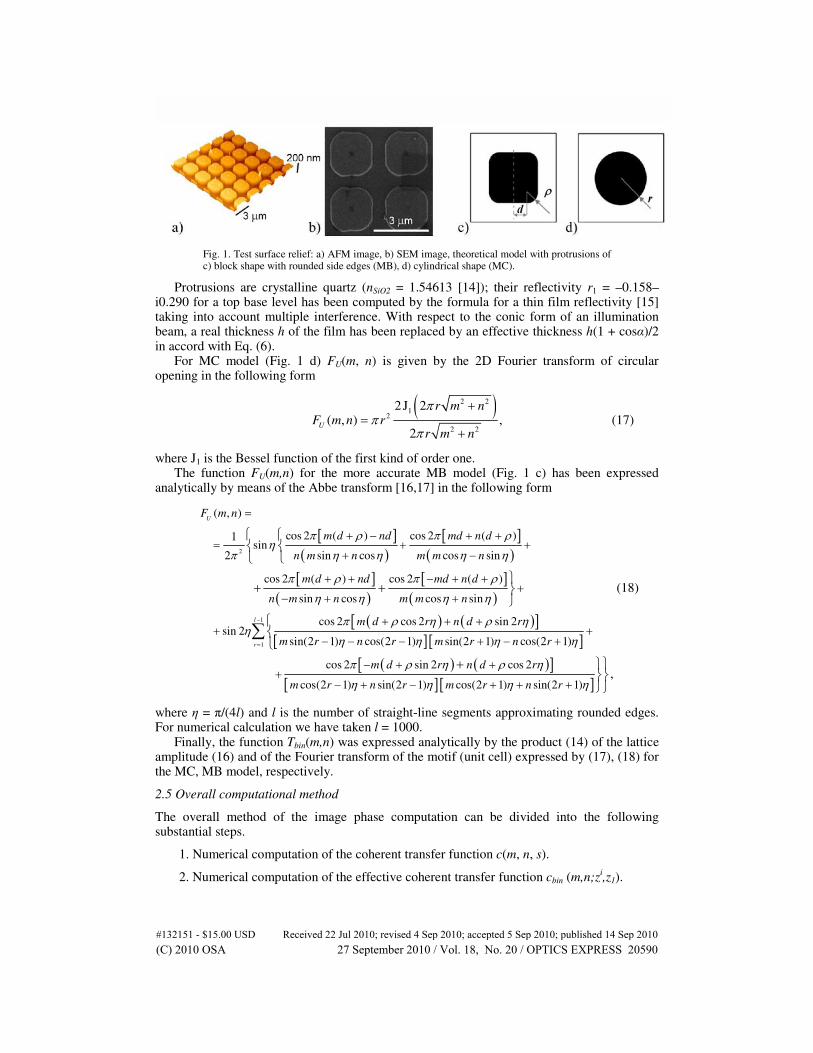
Fig. 1. Test surface relief: a) AFM image, b) SEM image, theoretical model with protrusions of c) block shape with rounded side edges (MB), d) cylindrical shape (MC).
Protrusions are crystalline quartz (nSiO2 = 1.54613 [14]); their reflectivity r1 = –0.158–i0.290 for a top base level has been computed by the formula for a thin film reflectivity [15] taking into account multiple interference. With respect to the conic form of an illumination beam, a real thickness h of the film has been replaced by an effective thickness h(1 + cosα)/2 in accord with Eq. (6).
For MC model (Fig. 1 d) FU(m, n) is given by the 2D Fourier transform of circular opening in the following form
( )2 2
12
2 2
2J 2( , ) ,
2U
r m nF m n r
r m n
ππ
π
+=
+ (17)
where J1 is the Bessel function of the first kind of order one. The function FU(m,n) for the more accurate MB model (Fig. 1 c) has been expressed
analytically by means of the Abbe transform [16,17] in the following form
[ ]( )
[ ]( )
[ ]( )
[ ]( )
( ) ( )[ ][ ]
2
( , )
cos 2 ( ) cos 2 ( )1sin
sin cos cos sin2
cos 2 ( ) cos 2 ( )
sin cos cos sin
cos 2 cos 2 sin 2sin 2
sin(2 1) cos(2 1) sin(2
UF m n
m d nd md n d
n m n m m n
m d nd md n d
n m n m m n
m d r n d r
m r n r m r
π ρ π ρη
η η η ηπ
π ρ π ρ
η η η η
π ρ η ρ ηη
η η
=
+ − + += + +
+ −
+ + − + ++
− + +
+ + ++
− − − +
+ +
[ ]( ) ( )[ ]
[ ] [ ]
1
1 1) cos(2 1)
cos 2 sin 2 cos 2
cos(2 1) sin(2 1) cos(2 1) sin(2 1),
l
r n r
m d r n d r
m r n r m r n r
η η
π ρ η ρ η
η η η η
−
=
+− +
− + ++
− + − + + +
+
∑
(18)
where η = π/(4l) and l is the number of straight-line segments approximating rounded edges. For numerical calculation we have taken l = 1000.
Finally, the function Tbin(m,n) was expressed analytically by the product (14) of the lattice amplitude (16) and of the Fourier transform of the motif (unit cell) expressed by (17), (18) for the MC, MB model, respectively.
2.5 Overall computational method
The overall method of the image phase computation can be divided into the following substantial steps.
1. Numerical computation of the coherent transfer function c(m, n, s).
2. Numerical computation of the effective coherent transfer function cbin (m,n;zi,z1).
#132151 - $15.00 USD Received 22 Jul 2010; revised 4 Sep 2010; accepted 5 Sep 2010; published 14 Sep 2010(C) 2010 OSA 27 September 2010 / Vol. 18, No. 20 / OPTICS EXPRESS 20590
3. Mathematical description of a surface relief by the functions tbin (x, y), fu(x, y), l(x, y), FU(m,n), L(m,n) and Tbin(m,n).
4. Numerical computation of the complex amplitude uibin(x
i, y
i, z
i) and of the final
complex amplitude ui(x
i, y
i, z
i).
5. Numerical computation of the image phase φ and (if necessary) of the height of binary surface relief.
Theoretical and experimental data can be fitted by repeating this computational loop in order to find unknown surface relief parameters.
3. Experimental setup and method
The first experimental verification of the theory has been done by observation of the AFM standard. DHM used in this experiment was designed as a coherence-controlled holographic microscope (CCHM) the setup of which allows illumination with almost arbitrary state of coherence. Coherence of light then can be used as a tool for image characteristics adjustment [10]. Spatially and/or temporally incoherent illumination induces optical sectioning similar to that of confocal microscope. With respect to this capability the instrument was classified as a “parallel-mode confocal microscope” in the previous publication [18].
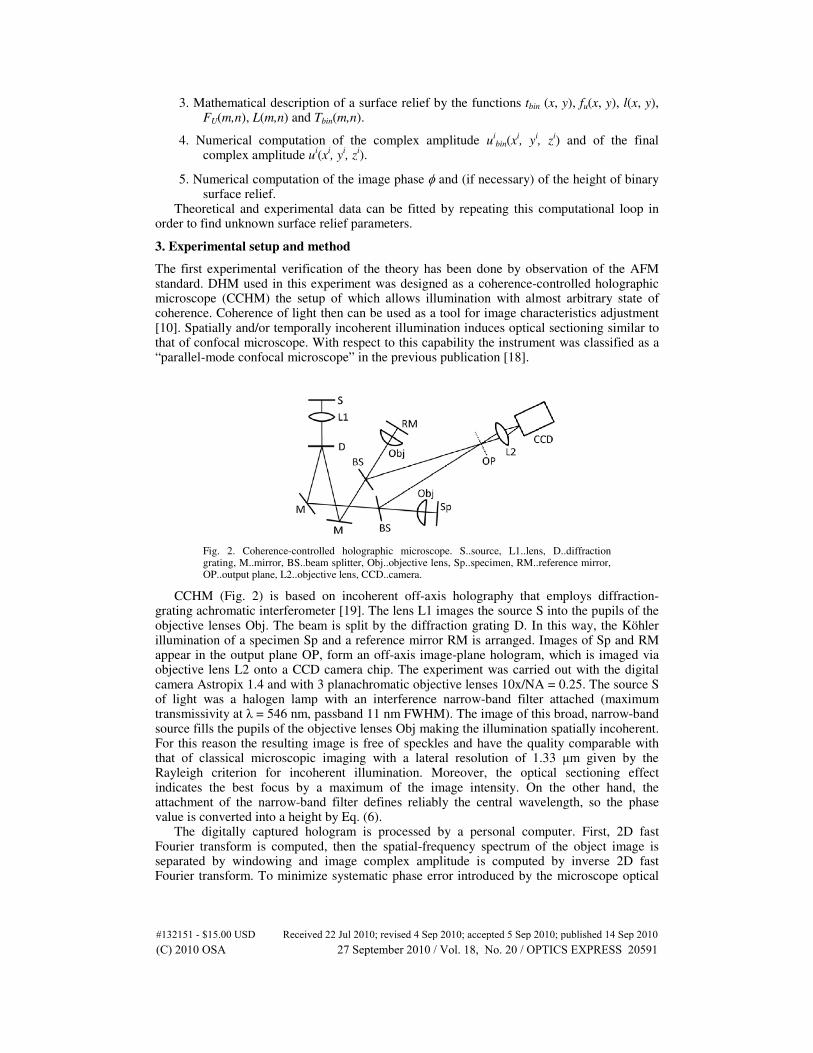
Fig. 2. Coherence-controlled holographic microscope. S..source, L1..lens, D..diffraction grating, M..mirror, BS..beam splitter, Obj..objective lens, Sp..specimen, RM..reference mirror, OP..output plane, L2..objective lens, CCD..camera.
CCHM (Fig. 2) is based on incoherent off-axis holography that employs diffraction-grating achromatic interferometer [19]. The lens L1 images the source S into the pupils of the objective lenses Obj. The beam is split by the diffraction grating D. In this way, the Köhler illumination of a specimen Sp and a reference mirror RM is arranged. Images of Sp and RM appear in the output plane OP, form an off-axis image-plane hologram, which is imaged via objective lens L2 onto a CCD camera chip. The experiment was carried out with the digital camera Astropix 1.4 and with 3 planachromatic objective lenses 10x/NA = 0.25. The source S of light was a halogen lamp with an interference narrow-band filter attached (maximum transmissivity at λ = 546 nm, passband 11 nm FWHM). The image of this broad, narrow-band source fills the pupils of the objective lenses Obj making the illumination spatially incoherent. For this reason the resulting image is free of speckles and have the quality comparable with that of classical microscopic imaging with a lateral resolution of 1.33 µm given by the Rayleigh criterion for incoherent illumination. Moreover, the optical sectioning effect indicates the best focus by a maximum of the image intensity. On the other hand, the attachment of the narrow-band filter defines reliably the central wavelength, so the phase value is converted into a height by Eq. (6).
The digitally captured hologram is processed by a personal computer. First, 2D fast Fourier transform is computed, then the spatial-frequency spectrum of the object image is separated by windowing and image complex amplitude is computed by inverse 2D fast Fourier transform. To minimize systematic phase error introduced by the microscope optical
#132151 - $15.00 USD Received 22 Jul 2010; revised 4 Sep 2010; accepted 5 Sep 2010; published 14 Sep 2010(C) 2010 OSA 27 September 2010 / Vol. 18, No. 20 / OPTICS EXPRESS 20591
elements residual aberrations, the background phase image of the high quality surface plane mirror is recorded and subsequently subtracted from the phase image of the measured specimen.
4. Results
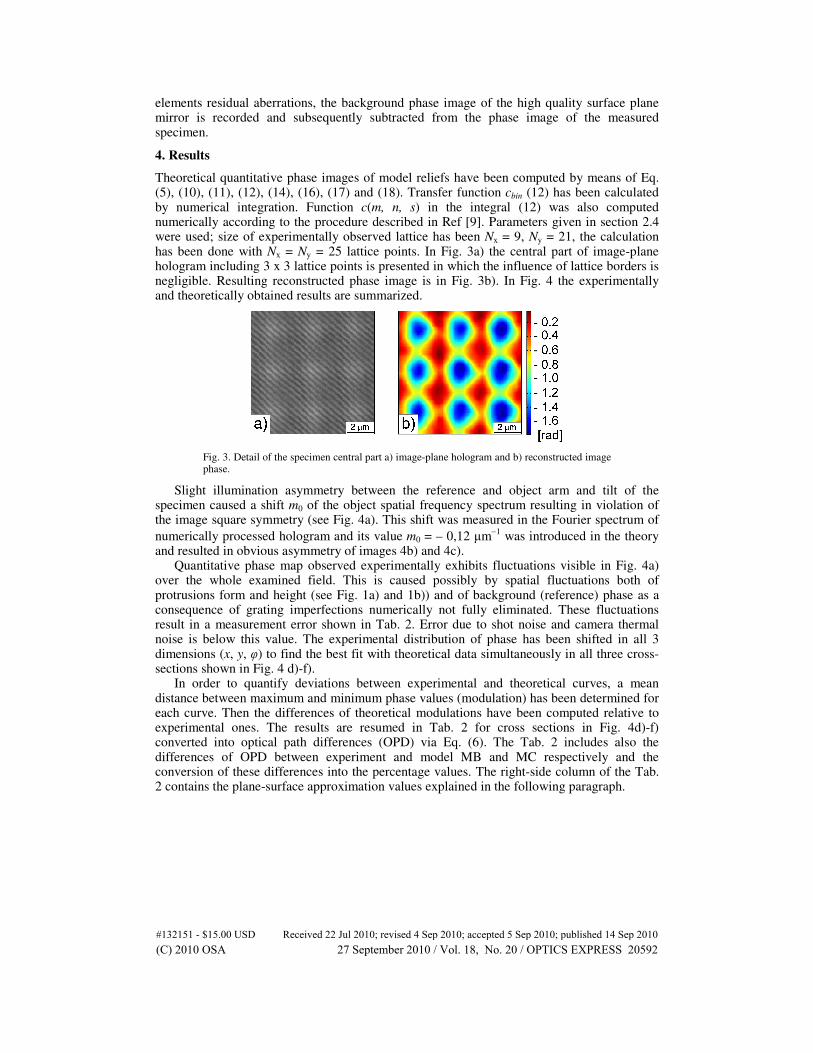
Theoretical quantitative phase images of model reliefs have been computed by means of Eq. (5), (10), (11), (12), (14), (16), (17) and (18). Transfer function cbin (12) has been calculated by numerical integration. Function c(m, n, s) in the integral (12) was also computed numerically according to the procedure described in Ref [9]. Parameters given in section 2.4 were used; size of experimentally observed lattice has been Nx = 9, Ny = 21, the calculation has been done with Nx = Ny = 25 lattice points. In Fig. 3a) the central part of image-plane hologram including 3 x 3 lattice points is presented in which the influence of lattice borders is negligible. Resulting reconstructed phase image is in Fig. 3b). In Fig. 4 the experimentally and theoretically obtained results are summarized.
Fig. 3. Detail of the specimen central part a) image-plane hologram and b) reconstructed image phase.
Slight illumination asymmetry between the reference and object arm and tilt of the specimen caused a shift m0 of the object spatial frequency spectrum resulting in violation of the image square symmetry (see Fig. 4a). This shift was measured in the Fourier spectrum of
numerically processed hologram and its value m0 = – 0,12 µm−1
was introduced in the theory and resulted in obvious asymmetry of images 4b) and 4c).
Quantitative phase map observed experimentally exhibits fluctuations visible in Fig. 4a) over the whole examined field. This is caused possibly by spatial fluctuations both of protrusions form and height (see Fig. 1a) and 1b)) and of background (reference) phase as a consequence of grating imperfections numerically not fully eliminated. These fluctuations result in a measurement error shown in Tab. 2. Error due to shot noise and camera thermal noise is below this value. The experimental distribution of phase has been shifted in all 3 dimensions (x, y, φ) to find the best fit with theoretical data simultaneously in all three cross-sections shown in Fig. 4 d)-f).
In order to quantify deviations between experimental and theoretical curves, a mean distance between maximum and minimum phase values (modulation) has been determined for each curve. Then the differences of theoretical modulations have been computed relative to experimental ones. The results are resumed in Tab. 2 for cross sections in Fig. 4d)-f) converted into optical path differences (OPD) via Eq. (6). The Tab. 2 includes also the differences of OPD between experiment and model MB and MC respectively and the conversion of these differences into the percentage values. The right-side column of the Tab. 2 contains the plane-surface approximation values explained in the following paragraph.
#132151 - $15.00 USD Received 22 Jul 2010; revised 4 Sep 2010; accepted 5 Sep 2010; published 14 Sep 2010(C) 2010 OSA 27 September 2010 / Vol. 18, No. 20 / OPTICS EXPRESS 20592
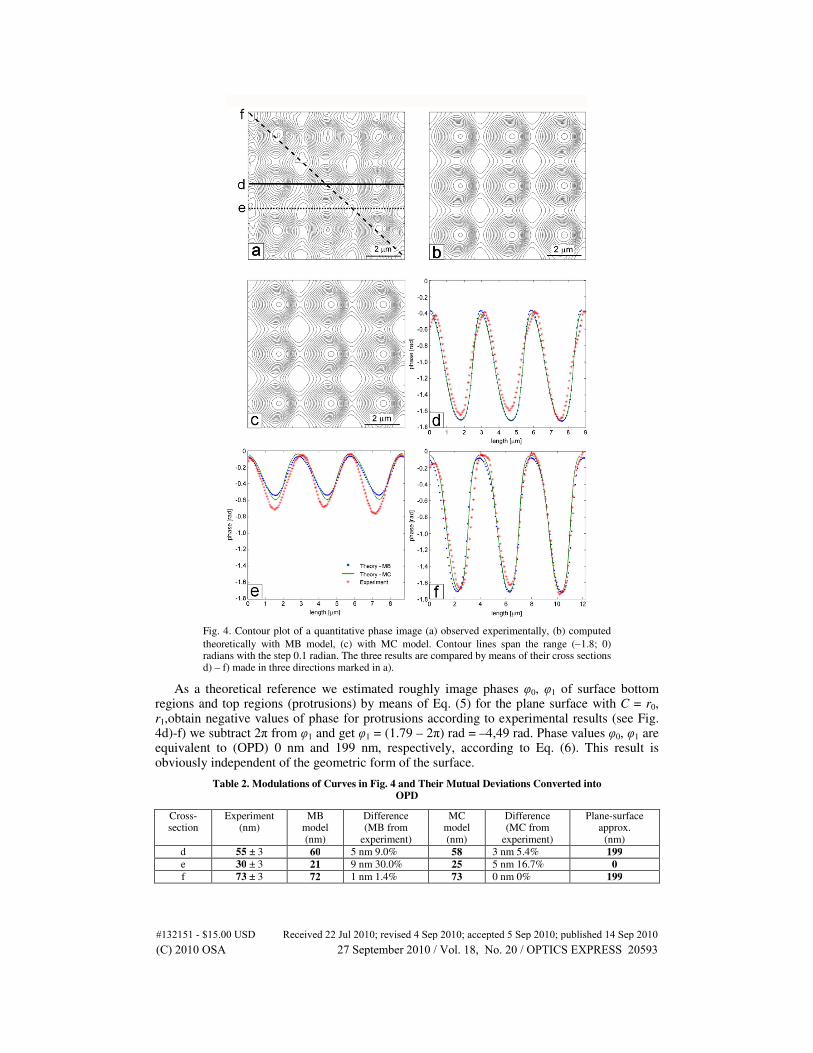
Fig. 4. Contour plot of a quantitative phase image (a) observed experimentally, (b) computed
theoretically with MB model, (c) with MC model. Contour lines span the range (−1.8; 0) radians with the step 0.1 radian. The three results are compared by means of their cross sections d) – f) made in three directions marked in a).
As a theoretical reference we estimated roughly image phases φ0, φ1 of surface bottom regions and top regions (protrusions) by means of Eq. (5) for the plane surface with C = r0, r1,obtain negative values of phase for protrusions according to experimental results (see Fig. 4d)-f) we subtract 2π from φ1 and get φ1 = (1.79 – 2π) rad = –4,49 rad. Phase values φ0, φ1 are equivalent to (OPD) 0 nm and 199 nm, respectively, according to Eq. (6). This result is obviously independent of the geometric form of the surface.
Table 2. Modulations of Curves in Fig. 4 and Their Mutual Deviations Converted into OPD
Cross-section
Experiment (nm)
MB model (nm)
Difference (MB from
experiment)
MC model (nm)
Difference (MC from
experiment)
Plane-surface approx.
(nm)
d 55 ± 3 60 5 nm 9.0% 58 3 nm 5.4% 199
e 30 ± 3 21 9 nm 30.0% 25 5 nm 16.7% 0
f 73 ± 3 72 1 nm 1.4% 73 0 nm 0% 199
#132151 - $15.00 USD Received 22 Jul 2010; revised 4 Sep 2010; accepted 5 Sep 2010; published 14 Sep 2010(C) 2010 OSA 27 September 2010 / Vol. 18, No. 20 / OPTICS EXPRESS 20593
This result is substantially different from the experiment and demonstrates complete inadequacy of a plane-surface approximation (5) in this case (see Tab. 2). On the other hand both MB & MC model results are in a good agreement with experimental data. Unexpectedly, simpler MC model is in slightly better agreement with experiment.
5. Conclusions
Basic assumption of the theoretical approach developed in this paper is surface relief of two levels. Hence the results are limited to this class of reliefs which are on the other hand very frequent in practice, e.g. in thin film technologies. The 3D imaging problem was transformed into a 2D linear-system. The Fourier transform Tbin (14) of a surface-relief function tbin (13) plays the role of a 2D signal filtered by a specific 2D CTF (12) which depends among others on a relief depth h. The Fourier transform Tbin of the function tbin is analytically expressed by means of the Fraunhofer diffraction mathematical apparatus (e.g. the Abbe transform and the Abbe theorem) and the kinematic diffraction theory known in a structure analysis. It allows us to simulate simply phase imaging of a huge variety of binary surface relief geometries and to solve inverse problems (from image to relief-geometry reconstruction). The CTF dependent on a relief depth h may be analytically approximated thus giving us a tool for relief-depth estimation from observed phase images.
The theory describes well quantitative phase imaging of shallow surface reliefs (depth under λ/4) for which waveguide and vectorial effects may be neglected. Contrary to the plane-surface approximation, the theory gives precise results also for reliefs with principal spatial frequencies close to the optical system cut-off frequency. The reason is a correct description of a spatial-frequency filtering process which is a dominant effect determining imaging in this case. The theory has been tested by quantitative phase imaging of a surface relief of a calibration AFM standard. Experimental and theoretical results obtained for two (MC, MB) models were in a relatively good agreement whilst the commonly used plane-surface approximation proved to be completely inapplicable.
Differences between theory and experiment (see Table 2 column 4 and 6) may have at least two sources:
• models are not in a perfect agreement with a real surface relief (see Fig. 1) – a real motif is not of a square symmetry, surface is not strictly binary, surface form varies locally and so the parameters used in a numerical calculation are just mean values;
• experimental phase map is deformed (see Fig. 4a) especially due to the diffraction grating imperfections that are not completely numerically eliminated.
Presented method is suitable for a description of quantitative phase imaging by reflected-light digital holographic or phase shifting microscopes. Quantitative phase images of constant-reflectivity surfaces may be converted by Eq. (6) into a height distribution of a surface relief.
This method with small corrections can be used also for a description of quantitative phase imaging of transparent binary specimens.
Furthermore, the presented method can be extended for multi-layer problem solution by introducing of one characteristic function for each surface layer. In this way, 3D problem of n-layer specimen imaging is divided into n 2D imaging problems.
Acknowledgements
This work has been supported by the Czech Science Foundation project No. 202/08/0590 and by the Ministry of Education, Youth and Sport project No. 0021630508.
#132151 - $15.00 USD Received 22 Jul 2010; revised 4 Sep 2010; accepted 5 Sep 2010; published 14 Sep 2010(C) 2010 OSA 27 September 2010 / Vol. 18, No. 20 / OPTICS EXPRESS 20594


![H2E: A Privacy Provisioning Framework for Collaborative Filtering … · 2019-09-10 · collaborative filtering, content-based filtering, and hybrid filtering [3]. Content-based filtering,](https://img.pdfslide.us/doc/110x75/5f2811153d39b70bb31af3b8/h2e-a-privacy-provisioning-framework-for-collaborative-filtering-2019-09-10-collaborative.jpg)