Embed Size (px)
Citation preview
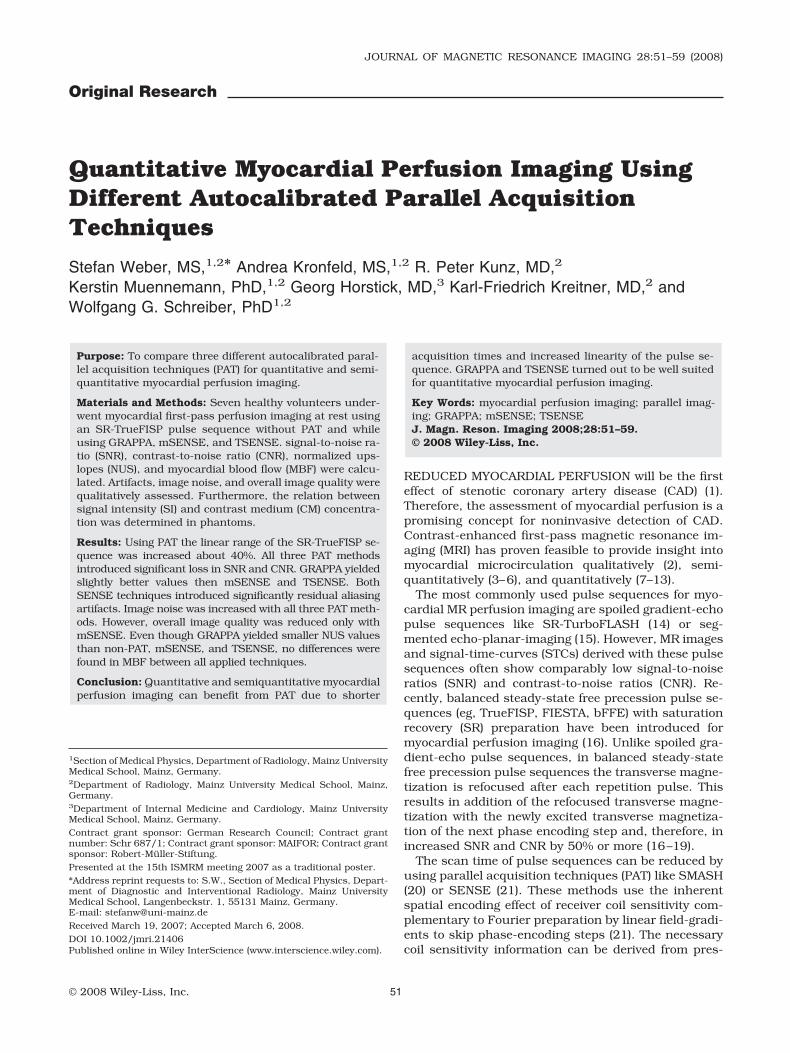
Original Research
Quantitative Myocardial Perfusion Imaging UsingDifferent Autocalibrated Parallel AcquisitionTechniques
Stefan Weber, MS,1,2* Andrea Kronfeld, MS,1,2 R. Peter Kunz, MD,2
Kerstin Muennemann, PhD,1,2 Georg Horstick, MD,3 Karl-Friedrich Kreitner, MD,2 andWolfgang G. Schreiber, PhD1,2
Purpose: To compare three different autocalibrated paral-lel acquisition techniques (PAT) for quantitative and semi-quantitative myocardial perfusion imaging.
Materials and Methods: Seven healthy volunteers under-went myocardial first-pass perfusion imaging at rest usingan SR-TrueFISP pulse sequence without PAT and whileusing GRAPPA, mSENSE, and TSENSE. signal-to-noise ra-tio (SNR), contrast-to-noise ratio (CNR), normalized ups-lopes (NUS), and myocardial blood flow (MBF) were calcu-lated. Artifacts, image noise, and overall image quality werequalitatively assessed. Furthermore, the relation betweensignal intensity (SI) and contrast medium (CM) concentra-tion was determined in phantoms.
Results: Using PAT the linear range of the SR-TrueFISP se-quence was increased about 40%. All three PAT methodsintroduced significant loss in SNR and CNR. GRAPPA yieldedslightly better values then mSENSE and TSENSE. BothSENSE techniques introduced significantly residual aliasingartifacts. Image noise was increased with all three PAT meth-ods. However, overall image quality was reduced only withmSENSE. Even though GRAPPA yielded smaller NUS valuesthan non-PAT, mSENSE, and TSENSE, no differences werefound in MBF between all applied techniques.
Conclusion: Quantitative and semiquantitative myocardialperfusion imaging can benefit from PAT due to shorter
acquisition times and increased linearity of the pulse se-quence. GRAPPA and TSENSE turned out to be well suitedfor quantitative myocardial perfusion imaging.
Key Words: myocardial perfusion imaging; parallel imag-ing; GRAPPA; mSENSE; TSENSEJ. Magn. Reson. Imaging 2008;28:51–59.© 2008 Wiley-Liss, Inc.
REDUCED MYOCARDIAL PERFUSION will be the firsteffect of stenotic coronary artery disease (CAD) (1).Therefore, the assessment of myocardial perfusion is apromising concept for noninvasive detection of CAD.Contrast-enhanced first-pass magnetic resonance im-aging (MRI) has proven feasible to provide insight intomyocardial microcirculation qualitatively (2), semi-quantitatively (3–6), and quantitatively (7–13).
The most commonly used pulse sequences for myo-cardial MR perfusion imaging are spoiled gradient-echopulse sequences like SR-TurboFLASH (14) or seg-mented echo-planar-imaging (15). However, MR imagesand signal-time-curves (STCs) derived with these pulsesequences often show comparably low signal-to-noiseratios (SNR) and contrast-to-noise ratios (CNR). Re-cently, balanced steady-state free precession pulse se-quences (eg, TrueFISP, FIESTA, bFFE) with saturationrecovery (SR) preparation have been introduced formyocardial perfusion imaging (16). Unlike spoiled gra-dient-echo pulse sequences, in balanced steady-statefree precession pulse sequences the transverse magne-tization is refocused after each repetition pulse. Thisresults in addition of the refocused transverse magne-tization with the newly excited transverse magnetiza-tion of the next phase encoding step and, therefore, inincreased SNR and CNR by 50% or more (16–19).
The scan time of pulse sequences can be reduced byusing parallel acquisition techniques (PAT) like SMASH(20) or SENSE (21). These methods use the inherentspatial encoding effect of receiver coil sensitivity com-plementary to Fourier preparation by linear field-gradi-ents to skip phase-encoding steps (21). The necessarycoil sensitivity information can be derived from pres-
1Section of Medical Physics, Department of Radiology, Mainz UniversityMedical School, Mainz, Germany.2Department of Radiology, Mainz University Medical School, Mainz,Germany.3Department of Internal Medicine and Cardiology, Mainz UniversityMedical School, Mainz, Germany.Contract grant sponsor: German Research Council; Contract grantnumber: Schr 687/1; Contract grant sponsor: MAIFOR; Contract grantsponsor: Robert-Muller-Stiftung.Presented at the 15th ISMRM meeting 2007 as a traditional poster.*Address reprint requests to: S.W., Section of Medical Physics, Depart-ment of Diagnostic and Interventional Radiology, Mainz UniversityMedical School, Langenbeckstr. 1, 55131 Mainz, Germany.E-mail: [email protected] March 19, 2007; Accepted March 6, 2008.DOI 10.1002/jmri.21406Published online in Wiley InterScience (www.interscience.wiley.com).
JOURNAL OF MAGNETIC RESONANCE IMAGING 28:51–59 (2008)
© 2008 Wiley-Liss, Inc. 51
cans before the parallel acquisition as in the originalSMASH and SENSE or from a self calibration scheme asin GRAPPA (22) and mSENSE (22,23), where a smallnumber of extra lines in the center of k-space (ie, refer-ence lines) are acquired. In GRAPPA, a self-calibratedk-space-based reconstruction, the additionally ac-quired reference lines are used to reconstruct missingk-space lines before image reconstruction. In mSENSE(modified sensitivity encoding), an image-based recon-struction similar to SENSE, coil sensitivity maps arederived from the non-undersampled center of k-space.Other techniques like TSENSE (24,25) were designedespecially for dynamic imaging. In these techniques theparallel acquisition strategy is combined with time-in-terleaved k-space acquisition as in UNFOLD (26). Inthis particular implementation a 2-fold acceleration isachieved by alternating between even and odd k-spacelines from acquisition to acquisition. Therefore, coilsensitivity maps needed for the SENSE-reconstructioncan be derived from the data itself without needing aprescan or reference lines. Furthermore, additionaltemporal filtering of the finally reconstructed imagescan be used for further suppression of SENSE artifacts(24).
The purpose of this study was to test and comparethree different autocalibrated parallel acquisition tech-niques (GRAPPA, mSENSE, and TSENSE) for quantita-tive and semiquantitative myocardial perfusion imag-ing. Measurements were performed with a low contrastmedium dose for adequate quantitative perfusion anal-ysis. The relation between SI and CM concentration,SNR and CNR, normalized upslopes (NUS) of the SIincrease in the myocardium as well as the myocardialblood flow (MBF) were determined. Furthermore, arti-facts, image noise and overall image quality were qual-itatively assessed by two experienced observers.
MATERIALS AND METHODS
Imaging Protocol
Images were acquired at 1.5T (Sonata, Siemens MedicalSolutions, Erlangen, Germany) equipped with high-performance gradients (maximum amplitude, 40mT/m; slew rate 200 T/m s–1). For signal reception, thescanner’s standard six-element phased-array cardiaccoil was used in combination with two elements of thespine array built in the patient table of the scanner.Therefore, a total of eight independent receiver coilswere used for PAT reconstruction. Perfusion imageswere obtained using an SR-TrueFISP pulse sequencewith the following sequence parameters: time of repeti-tion (TR) � 2.2 msec, echo time (TE) � 1.1 msec, flip-angle � 50°, bandwidth � 1300 Hz/Px, saturation time(TI, ie, time from the preparation pulse to the readout ofk-space center) � 125 msec without and 85 msec withPAT, linear Cartesian k-space order. The image acqui-sition matrix size was 128 � 96 (interpolated to 256 �192 using zero-filling). With a field of view (FOV) of380 � 285 mm2, the resulting in-plane spatial resolu-tion was 2.97 � 2.97 mm2.
All three PAT methods were used with an accelerationfactor R of two, ie, skipping every second phase-encod-
ing step. Only vendor equipment and reconstructionswere used in this work. No additional filtering or regu-larization was applied. For GRAPPA and mSENSE, 24reference lines for coil sensitivity calibration were used,ie, acquisition of 12 additional k-space lines in the cen-ter of k-space. In the case of GRAPPA, the referencelines could further be used to increase the SNR of thefinal images since GRAPPA works in k-space. This isnot the case for image-based mSENSE and, therefore,could not be performed with mSENSE. BecauseGRAPPA and mSENSE used the same acquisitionscheme, images could be reconstructed from the sameraw dataset without need for an additional perfusionmeasurement. The acquisition time for the SR-True-FISP pulse sequence without PAT was 231 msec, withGRAPPA/mSENSE 151 msec, and with TSENSE 138msec. With TSENSE the TI and, therefore, the totalacquisition time could have been further decreased.However, it was kept equal for all techniques to enablea systematic comparison of the three PAT methods.Furthermore, no additional temporal filtering of the re-constructed images was applied with TSENSE.
Phantom Studies
In semiquantitative and quantitative analysis of myo-cardial perfusion, a linear relation between signal in-tensity (SI) and the contrast medium (CM) concentra-tion is preferable to easily convert from signalintensities to CM concentrations (10,11,16). However,the relation between measured SI and CM concentra-tion in tissue is not linear. Rather, it is a complexexponential function particularly determined by thesignal equation of the respective pulse sequence. Equa-tion 1 shows the signal equation for the SR-TrueFISPpulse sequence used in this work (18):
STrueFISP � M0 � �1 � exp� � TI/T1�� � �1 � E1� � exp
� � TE/T*2� � sin �/�1 � �E1 � E2� � cos � � E1 � E2�, [1]
where TI is the saturation time, � is the flip angle, andM0 is the equilibrium magnetization; E1 � exp(–TR/T1)and E2 � (exp(–TE/T2). However, for low CM concen-trations and a short saturation time of the pulse se-quence the relation between SI and CM concentrationcan be assumed to be almost linear. Recent work re-vealed an extended linear range of about 40% for dif-ferent myocardial perfusion imaging pulse sequenceswhen using TSENSE (27) if compared with an unaccel-erated pulse sequence.
The relation between SI and CM concentration for theSR-TrueFISP pulse sequence was determined withoutusing PAT and while using GRAPPA, mSENSE, andTSENSE as described in previous work using blood-and tissue-equivalent phantoms (27). The linear rangeof the SR-TrueFISP pulse sequence was defined from 0mM/l to the point where the difference between truerelation (S(C)) and the assumed linear relation (Slin(C))remained below 10%.
52 Weber et al.
Volunteer Studies
Seven healthy volunteers (six male, one female, meanage 27 � 5 years) underwent first-pass myocardial per-fusion imaging at rest. Written consent was obtainedfrom all volunteers before MR examination and thestudy protocol was approved by the local ethics com-mittee. Each volunteer underwent three perfusion mea-surements using non-PAT, GRAPPA/mSENSE, andTSENSE, respectively. The time between two perfusionstudies was at least 30 minutes to minimize systematicerrors through CM still present from the previous per-fusion study. For determination of the proper short axisslices, cine studies were obtained in horizontal andvertical long-axis orientation using a segmented True-FISP pulse sequence (TR 3.2 msec, TE 1.6 msec, flipangle 60°, bandwidth 930 Hz per pixel). Based on theseimages, the ECG-triggered perfusion study was per-formed in short-axis orientation while 2 mL of gadolin-ium diethylenetriamine pentaacetic acid (Gd-DTPA,Magnevist; Schering, Berlin, Germany) (�0.015 �0.002 mmol/kg of body weight) followed by a 20-mLflush of 0.9% NaCl were injected in an antecubital vein(injection rate 8 mL/sec). For each perfusion measure-ment, 40 images with two slices per heartbeat wereacquired during a single breath-hold. With PAT moreslices could have been acquired, but a constant numberof slices were chosen for systematic comparison to thenon-PAT measurements.
Analysis of Volunteer Data
SNR, CNR, Normalized Upslopes (NUS)
SNR values were calculated in each slice from signal-time-curves (STCs) before contrast enhancement(SNRpre � SIbaseline/STDbasline) and during maximum CMconcentration (SNRpeak � SImax/STDbaseline) in four myo-cardial segments (in anterior, septal, inferior, and lat-eral position) with at least 92 pixels. CNR values werecalculated from pre- and peak-SNR (CNR � SNRpeak –SNRpre). It should be noted here that the SNR and CNRvalues calculated from STCs may be different from SNRand CNR obtained in regions-of-interest in an image.However, they present a method to judge the data qual-ity entering subsequent numerical and/or MBF analy-sis, and it is insensitive to variations of the noisedistribution that is observed in parallel imaging tech-niques (28).
As a semiquantitative perfusion parameter, NUS val-ues were calculated as follows: all signal intensity val-ues were normalized to the mean signal of the precon-trast data points of the STCs (about 10 data points).Upslopes of the SIs in the myocardium were calculatedby linear fitting the SI increase in the normalized STCs.The fit range was between the first data point of signalincrease and the point of the maximum resulting up-slope (at least 5 data points). Finally, the calculatedupslopes were normalized to the upslopes in the leftventricular cavity to correct for arterial input functioneffects. Data analysis was performed using in-housedeveloped software based on the PV-Wave Softwarepackage (v. 8.50, Visual Numerics, Stuttgart, Ger-many).
Myocardial Blood Flow (MBF)
For absolute quantification of MBF, XSIM software (v.3.13; National Simulation Resource, University ofWashington, Seattle) was used with the MMID4 model(29). MBF values were calculated from normalizedSTCs, in that case additionally subtracted by one(equals (SI-SIbaseline)/SIbaseline). The parameters of themodel were set to values described in previous studiesof MMID4 (7,10,29,30) as follows: regional dispersion(RD) in all vessels, including arteries, arterioles,venules, and veins � 0.48; volume of the arteries (Vart) �0.02 mL/g; volume of the arterioles (Vartl) � 0.03 mL/g;interstitial volume (Visf) � 0.35 mL/g; volume of thevenules (Vvenl) � 0.03 mL/g; and volume of the veins(Vven) � 0.02 mL/g. In our analysis, regional heteroge-neity was modeled using 20 pathways assuming aslightly right-skewed lagged normal density function(31) with RD � 0.55 (29). It was assumed that the CMGd-DTPA distributes only in the intravascular spaceand the extracellular space (ie, a two-region model). Tofit the model curves to the measured STCs the fittingalgorithm SENSOP (32) of the XSIM software was usedwhich is based on the Levenberg–Marquardt algorithm.The left ventricular STC was used as an estimate for thearterial input function. Data fitting was performed withthe four free parameters: the MBF (limits � 0 and 7mL/min/g), the permeability surface area (PS) product(limits � 0.25 and 8 mL/min/g), the delay between CMinflow in the LV and the myocardium (limits � �1 and3 sec), and the plasma volume of the capillaries Vp
(limits � 0.04 and 0.09 mL/g). All other values for thedistribution volumes of the CM were kept fixed.
Artifacts, Image Noise, Overall Image Quality
In addition, all perfusion measurements were qualita-tively evaluated by two experienced observers blindedto the employed technique. Presence of residual arti-facts of the PAT reconstruction (PAT artifacts), dark-rimartifacts in the myocardium while CM flow through theventricles, and the impression of image noise were sub-jectively classified on a 4-point scale as defined in Table1. Also, the degradation in overall image quality wasgraded with a score from 1 to 5: 1 � imperceptible, 2 �mild, 3 � moderate, 4 � severe, 5 � nondiagnostic.Mean values from scores of both observers were com-pared. Data are given as mean, minimum, and maxi-mum score unless otherwise stated.
Statistical Analysis
For all statistics in this work software SigmaStat (v.3.10 for Windows, Systat Software, Richmond, CA) wasused. All comparisons were performed intraindividuallyusing a Wilcoxon signed-rank test. P values 0.05 wereconsidered statistically significant.
RESULTS
Phantom Study
Figure 1 shows the SI and normalized SI as a functionof the Gd-DTPA concentration in blood equivalent
Myocardial Perfusion Imaging Using PAT 53

phantoms for SR-TrueFISP without PAT and while us-ing GRAPPA, mSENSE, and TSENSE, respectively (R �2). For low CM concentrations the SI increased almostlinearly with increasing CM concentration, while forhigher CM concentrations the signals started to show acurved shape. Figure 2 shows the deviation from anassumption of a linear relation between SI and CMconcentration. Using PAT the linear range for the SR-TrueFISP pulse sequence was extended about 40%. Thedifferences between GRAPPA, mSENSE, and TSENSEwere negligible.
Volunteer Study
Figure 3 shows images of one volunteer using SR-True-FISP without PAT and while using GRAPPA, mSENSE,and TSENSE.
SNR, CNR, NUS
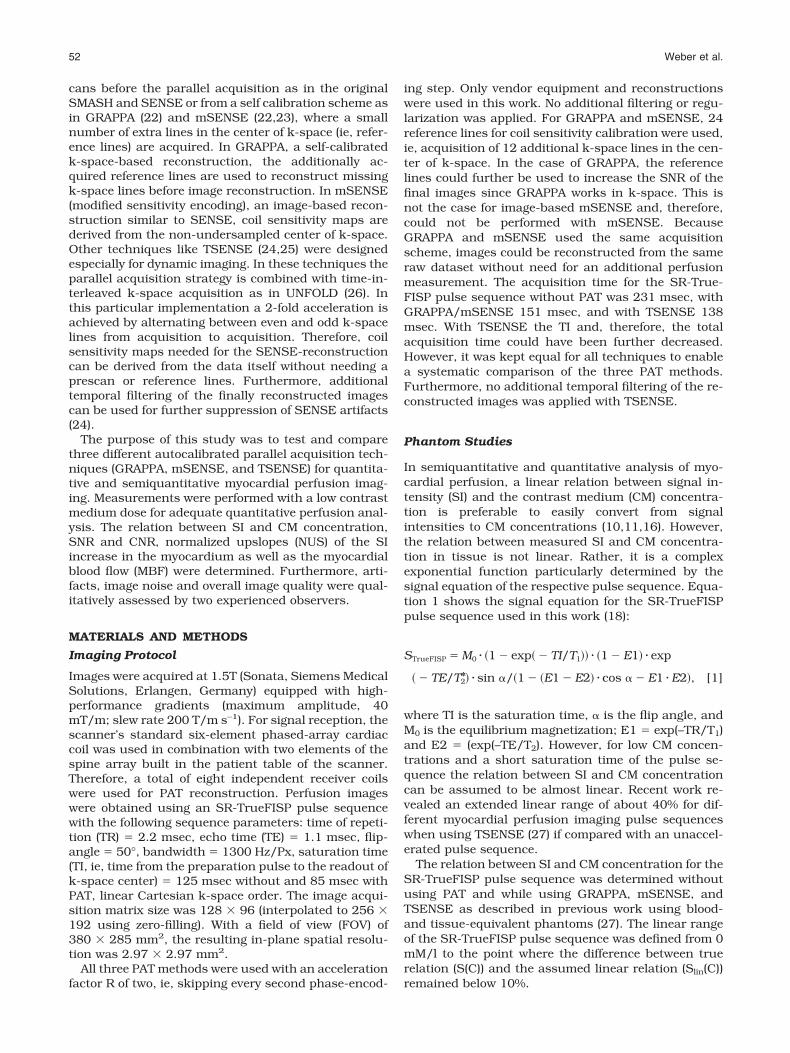
Figure 4 shows myocardial SNRpre, SNRpeak, and CNRvalues of the SR-TrueFISP pulse sequence without PATand while using GRAPPA, mSENSE, and TSENSE. Incomparison with the non-PAT measurements, all threePAT methods introduced a significant loss in SNR andCNR (P 0.001 in all cases). GRAPPA yielded somewhatbut significantly higher values than mSENSE andTSENSE. No significant differences were found betweenmSENSE and TSENSE.
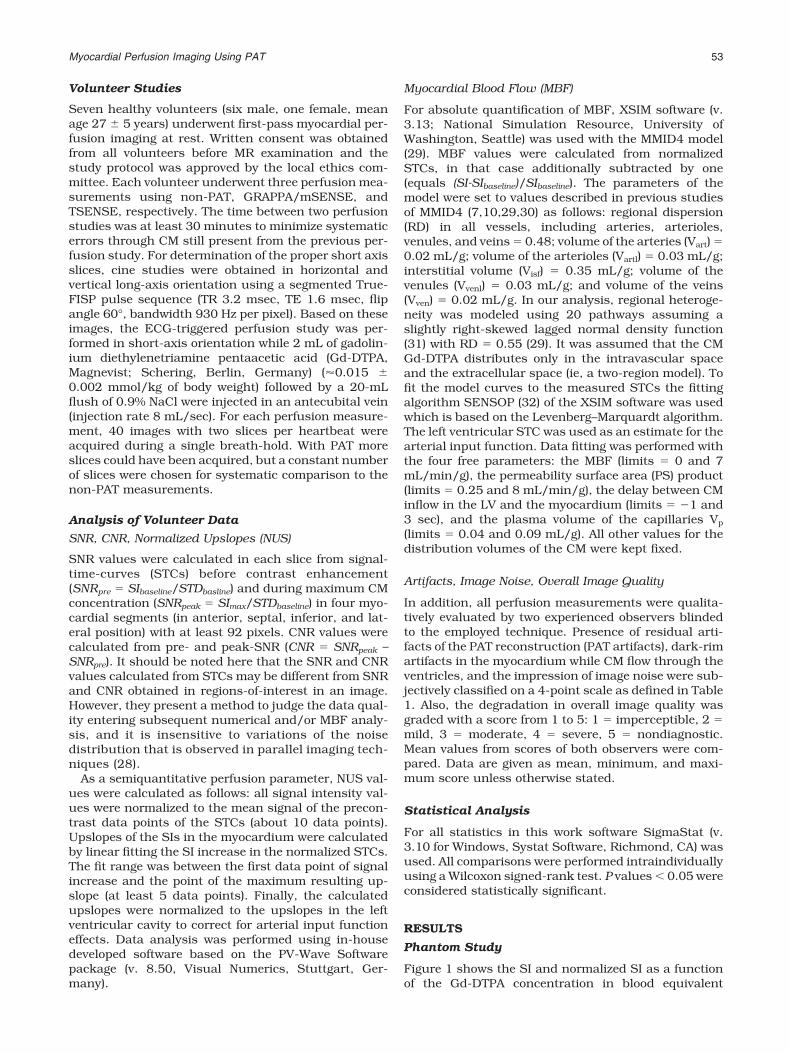
Figure 5a shows normalized upslopes for SR-True-FISP with and without PAT. GRAPPA yielded signifi-cantly different NUS values compared to non-PAT (me-dian value of 0.0484 with GRAPPA vs. 0.0568 withoutPAT, P 0.05), mSENSE (median value of 0.0481, P 0.001), and nearly significant compared to TSENSE
Table 1Scoring System Used for Qualitative Evaluation of the Perfusion Studies
Score 1 2 3 4
PAT Artifacts No artifacts Small artifact, not impairingdiagnostic quality
Considerable artifact, affectingimage interpretation
Severe artifact, hardly oreven not diagnostic
Dark rim No artifacts Short duration (4images), smalldimension
Short duration (4 images),large dimension
Long duration (�4 images),large dimension
Image noise Hardly any imagenoise
Little noise, not impairingdiagnostic quality
Considerable noise, affectingthe interpretation
Strong image noise, difficultimage interpretation
Figure 1. SI as a function of Gd-DTPA concentration in bloodequivalent phantoms. SI (a) and normalized SI (b) of the SR-TrueFISP pulse sequence without PAT and while usingGRAPPA, mSENSE, and TSENSE with an acceleration factor of2, respectively.
Figure 2. Percentage deviation from the assumption of a lin-ear relationship between SI and CM concentration for SR-TrueFISP without PAT and while using GRAPPA, mSENSE,and TSENSE, respectively (R � 2). With PAT the linear range ofSR-TrueFISP was increased compared to the acquisition with-out PAT. A deviation about 10% from a linear relation occurredfirst at a 40% higher CM concentration with all three PATmethods.
54 Weber et al.

(median value of 0.0568, P � 0.07). No differences werefound between non-PAT and mSENSE (P � 0.66) as wellas between non-PAT and TSENSE (P 0.30).
MBF
Figure 5b shows the calculated MBF values in all vol-unteers. No differences in MBF were found between allapplied techniques (P 0.13 in all comparisons). Figure6 shows STCs and corresponding MMID4-fits in onevolunteer in one segment for the SR-TrueFISP acquisi-tions without PAT and while using GRAPPA, mSENSE,and TSENSE. The median MBF in mL/g/min for non-PAT, GRAPPA, mSENSE, and TSENSE was 1.00 (inter-quartile range, 0.82–1.23), 1.08 (interquartile range,0.93–1.16), 1.05 (interquartile range, 0.89–1.18) and1.07 (interquartile range, 0.96–1.26), respectively. In-terestingly, the interquartile ranges were smaller withPAT than without PAT, particularly with mSENSE andTSENSE.
Artifacts, Image Noise, Overall Image Quality
The results of the qualitative evaluation of the SR-True-FISP images can be seen in Fig. 7. Between the twoobservers no significant differences in qualitativescores of artifacts, image noise, and overall image qual-ity were found.
Without PAT no artifacts related to the image recon-struction were observed (mean score 1.0). WithmSENSE and TSENSE significant residual PAT arti-facts occurred compared to non-PAT (mSENSE, 1.80;P 0.05; TSENSE, 1.86; P 0.01). With GRAPPA noresidual PAT artifacts occurred (GRAPPA, 1.07; P �1.0).
With all applied techniques, dark-rim artifacts oc-curred in the SR-TrueFISP images. No statistically sig-
nificant differences were found between acquisitionswithout PAT and with GRAPPA, mSENSE, or TSENSE(mean scores: non-PAT, 2.93; GRAPPA, 2.79, P � 0.375;mSENSE, 2.79, P � 0.50; TSENSE, 2.86, P � 0.07).
With all three PAT methods the image noise signifi-cantly increased (mean scores: non-PAT, 1.14;GRAPPA, 1.57, P 0.05; mSENSE, 1.70, P 0.05;TSENSE, 1.71, P 0.05). GRAPPA yielded a betterscore than mSENSE and TSENSE. However, no signif-icant differences were found between all three PATmethods.
The mean score in degradation of overall image qual-ity for the SR-TrueFISP images without PAT was 1.71.With GRAPPA and TSENSE no significant differenceswere found compared to non-PAT (mean scores:GRAPPA, 1.93, P � 0.50; TSENSE, 2.07, P � 0.25). Onlywith mSENSE was the overall image quality signifi-cantly reduced compared to non-PAT (mean score,2.20; P 0.05). No differences were found between allthree PAT methods.
DISCUSSION
Parallel acquisition techniques have been introduced toMRI to accelerate image acquisition. However, thesetechniques are accompanied by inhomogeneous noisedistribution, residual aliasing artifacts, and a reducedSNR. In myocardial perfusion imaging, SNR and CNRare already low, particularly with regard to the use ofvery low CM doses for quantitative and semiquantita-tive perfusion analysis. The aim of this work was toinvestigate the use of PAT with an acceleration factor oftwo for quantitative and semiquantitative myocardialperfusion imaging and to compare three autocalibratedPAT strategies, namely, GRAPPA, mSENSE, andTSENSE. Phantom measurements were accomplished
Figure 3. Comparison of SR-TrueFISP imagesin one volunteer without using PAT and whileusing GRAPPA, mSENSE, and TSENSE.Shown are different phases before CM injec-tion (pre-CM), during peak signal intensity inthe right ventricular cavity (peak-CM RV) andin the left ventricular cavity (peak-CM LV), andduring peak signal intensity in the myocar-dium. All images share the same grayscalewindow.
Myocardial Perfusion Imaging Using PAT 55
to analyze the relation of SI and CM concentration andrevealed an increased linear range of the SR-TrueFISPpulse sequence used with PAT. In volunteers, all threePAT methods introduced significant loss in SNR andCNR, whereas GRAPPA yielded slightly better resultsthan both SENSE techniques. GRAPPA yielded signifi-cant different NUS values than all other techniquestested. However, no differences were found in absolutemyocardial blood flow between all three PAT methodsand the non-PAT acquisition. TSENSE and mSENSEboth introduced residual aliasing artifacts. However,overall image quality was only reduced with mSENSE.
In quantitative and semiquantitative analysis of myo-cardial perfusion, a linear relation between SI and CMconcentration is of advantage to easily convert mea-sured SIs to actual CM concentrations in tissue. Due tothe shortened TI and fewer phase-encoding steps withPAT (16), the linear range of the SR-TrueFISP pulsesequence was extended by 40%. A similar finding wasmade for several myocardial perfusion pulse sequencesusing TSENSE in (27). This might improve accuracy ofquantification of myocardial perfusion. On the otherhand, this could be used to increase the CM dosage topartly compensate CNR-loss caused by PAT.
A major drawback of PAT is loss in SNR and CNR.Using a 2-fold acceleration the SNR decreases theoret-ically by at least �2 due to the reduced number ofphase-encoding steps and is further decreased by thegeometry factor g (21). In addition to PAT-related SNR-reduction, SNR also decreases when shortening the TIof SR-prepared pulse sequences. In this work the me-dian loss in SNR was 27%, 34%, and 30% withGRAPPA, mSENSE, and TSENSE, respectively. The me-dian loss in CNR was 35%, 36%, and 40%, respectively.GRAPPA yielded slightly better values than mSENSEand TSENSE due to the use of the additional referencelines for image reconstruction.
Another potential drawback of PAT is the occurrenceof residual aliasing artifacts. In this work, both SENSEtechniques introduced significant residual aliasing ar-tifacts into the perfusion images. However, these arti-facts were classified with a mean score smaller than 2,meaning small artifacts din not impair the diagnosticquality of the perfusion images. With TSENSE furtherartifact suppression would be expected when using ad-ditional temporal filtering of the reconstructed images(24). However, this was not accomplished in this work.With GRAPPA no significant occurrence of residual
Figure 4. Comparison of SNRpre (a), SNRpeak (b), and CNR (c)between SR-TrueFISP acquisition without PAT and while usingGRAPPA, mSENSE, and TSENSE. All three PAT methods in-troduced significant loss in SNR and CNR. GRAPPA yieldedsignificantly better results when compared to mSENSE andTSENSE.
Figure 5. Normalized ups-lopes (a) and myocardial bloodflow (b) for the SR-TrueFISPpulse sequence without PATand while using GRAPPA,mSENSE, and TSENSE.
56 Weber et al.

aliasing artifacts was observed. It has to be mentionedhere that in this work considerations were made toavoid aliasing artifacts in the full-FOV images. How-ever, in the clinical routine such aliasing artifacts oftenoccur in double-oblique short-axis slice orientation.This can lead to erroneous coil sensitivity maps in themSENSE reconstruction. In that case, residual artifacts
could appear in the middle of the finally reconstructedimages and could lead to nondiagnostic images. In con-trast to mSENSE, GRAPPA and TSENSE are hardlysensitive for aliasing artifacts in the full FOV images.This could be used to further decrease the FOV whenusing GRAPPA or TSENSE to improve the spatial reso-lution.
In this study, where only young healthy volunteerswere examined, hardly any problems occurred with re-spiratory motion. However, this could be an issue inpatients. Here, strong respiratory motion could lead toresidual aliasing artifacts when using TSENSE.
A phenomenon often seen in myocardial perfusionimaging is the dark rim (also called dark-banding) arti-fact in the myocardium during the passage of the CMbolus through the ventricles. Several reasons for thesedark-rim artifacts are discussed, such as susceptibilityeffects (33), bulk motion (34), limited spatial resolution(35), and/or an interaction of these effects. In this workdark-rim artifacts occurred in all SR-TrueFISP imageseries. No significant differences were found betweenconventional and PAT acquisitions. Although dark-rimartifacts are mostly easy to identify in qualitative per-fusion analysis, in quantitative and semiquantitativeanalysis they can cause differences in estimated flowparameters by either changing the upslope or baseline(35). Therefore, erroneous perfusion parameters (ie,myocardial blood flow) could be calculated.
Figure 6. Signal-time-curves and corresponding MMID4-fits in one volunteer in one segment for the SR-TrueFISP acquisitionwithout PAT and while using GRAPPA, mSENSE, and TSENSE.
Figure 7. Quality scores of SR-TrueFISP images without PATand while using GRAPPA, mSENSE, and TSENSE. Shown aremean, minimum, and maximum score for residual PAT arti-facts, dark-rim artifacts, and image noise (score from 1 to 4,respectively) as well as the overall image quality (score from 1to 5).
Myocardial Perfusion Imaging Using PAT 57

In this study semiquantitative perfusion analysis re-sulted in statistically significant different NUS valueswith GRAPPA compared with non-PAT or with mSENSEand TSENSE. However, the differences, although sta-tistically significant, were small. All obtained NUS val-ues were in the range also reported in other studies(35). In absolute quantification of MBF using theMMID4 model no differences were found between allapplied techniques. Moreover, the variation of MBF val-ues was reduced when using PAT, potentially indicatinga more robust quantification. However, similar behav-ior could be expected for a less sensitive method. Themedian calculated MBF values were in the range of1.00–1.10 mL/g/min and, therefore, in the range oftypical values for healthy volunteers (36).
The presented study is limited by the examination ofonly a small number of healthy volunteers at rest witha relatively low CM dose. Therefore, care has to be takenin the transfer of our results to the clinical scenariowhere stress measurements in patients are performedand where often higher CM concentrations are used.Another limitation is that the scan order was not ran-domized, ie, the scan order was always 1) non-PAT, 2)GRAPPA/mSENSE, 3) TSENSE. However, with the useof a very low CM dosage (2 mL, ie, �0.015 mmol/kg ofbody weight) and a waiting time between two perfusionmeasurements of at least 30 minutes, systematic errorsfrom the remaining CM should be minimized.
Although only an SR-TrueFISP pulse sequence wasused in this work, similar findings could be expectedusing other saturation prepared pulse sequences likespoiled gradient-echo pulse sequences (eg, SR-Turbo-FLASH) or segmented echo-planar-imaging (eg, SR-seg-EPI). This was partly reported in Ref. (27), where threepulse sequences using TSENSE were compared forsemiquantitative myocardial perfusion imaging.
In conclusion, quantitative and semiquantitativemyocardial perfusion imaging can benefit from the useof parallel imaging techniques despite a drop in SNRand CNR. The acquisition time per image can be de-creased and, thus, more slices per heartbeat can beacquired to improve volume coverage of the heart. Thelinear range of the pulse sequence used is increased,which may potentially result in a more reliable quanti-fication of myocardial perfusion. Both GRAPPA andTSENSE seem to be well suited for quantitative myocar-dial perfusion imaging, whereas TSENSE allows slightlyfaster image acquisitions and GRAPPA shows minoradvantages with regard to image quality.
ACKNOWLEDGMENT
The authors thank Siemens Medical Solutions for tech-nical support.
REFERENCES1. Nesto RW, Kowalchuk GJ. The ischemic cascade: temporal se-
quence of hemodynamic, electrocardiographic and symptomaticexpressions of ischemia. Am J Cardiol 1987;59:23C–30C.
2. Edelman RR, Li W. Contrast-enhanced echo-planar MR imaging ofmyocardial perfusion: preliminary study in humans. Radiology1994;190:771–777.
3. Lauerma K, Virtanen KS, Sipila LM, Hekali P, Aronen HJ. MultisliceMRI in assessment of myocardial perfusion in patients with single-vessel proximal left anterior descending coronary artery disease beforeand after revascularization. Circulation 1997;96:2859–2867.
4. Panting JR, Gatehouse PD, Yang GZ, et al. Echo-planar magneticresonance myocardial perfusion imaging: parametric map analysisand comparison with thallium SPECT. J Magn Reson Imaging2001;13:192–200.
5. Schwitter J, Debatin JF, von Schulthess GK, McKinnon GC. Nor-mal myocardial perfusion assessed with multishot echo-planar im-aging. Magn Reson Med 1997;37:140–147.
6. Schwitter J, Nanz D, Kneifel S, et al. Assessment of myocardialperfusion in coronary artery disease by magnetic resonance: acomparison with positron emission tomography and coronary an-giography. Circulation 2001;103:2230–2235.
7. Schmitt M, Horstick G, Petersen SE, et al. Quantification of restingmyocardial blood flow in a pig model of acute ischemia based onfirst-pass MRI. Magn Reson Med 2005;53:1223–1227.
8. Cullen JH, Horsfield MA, Reek CR, Cherryman GR, Barnett DB,Samani NJ. A myocardial perfusion reserve index in humans usingfirst-pass contrast-enhanced magnetic resonance imaging. J AmColl Cardiol 1999;33:1386–1394.
9. Larsson HB, Fritz-Hansen T, Rostrup E, Sondergaard L, Ring P,Henriksen O. Myocardial perfusion modeling using MRI. Magn Re-son Med 1996;35:716–726.
10. Jerosch-Herold M, Wilke N, Stillman AE. Magnetic resonance quan-tification of the myocardial perfusion reserve with a Fermi functionmodel for constrained deconvolution. Med Phys 1998;25:73–84.
11. Wilke N, Jerosch-Herold M. Assessing myocardial perfusion in cor-onary artery disease with magnetic resonance first-pass imaging.Cardiol Clin 1998;16:227–246.
12. Vallee JP, Lazeyras F, Kasuboski L, et al. Quantification of myocardialperfusion with FAST sequence and Gd bolus in patients with normalcardiac function. J Magn Reson Imaging 1999;9:197–203.
13. Schmitt M, Viallon M, Thelen M, Schreiber WG. Quantification ofmyocardial blood flow and blood flow reserve in the presence ofarterial dispersion: a simulation study. Magn Reson Med 2002;47:787–793.
14. Wilke N, Jerosch-Herold M, Stillman AE, et al. Concepts of myo-cardial perfusion imaging in magnetic resonance imaging. MagnReson Q 1994;10:249–286.
15. Ding S, Wolff SD, Epstein FH. Improved coverage in dynamic con-trast-enhanced cardiac MRI using interleaved gradient-echo EPI.Magn Reson Med 1998;39:514–519.
16. Schreiber WG, Schmitt M, Kalden P, Mohrs OK, Kreitner KF,Thelen M. Dynamic contrast-enhanced myocardial perfusion im-aging using saturation-prepared TrueFISP. J Magn Reson Imaging2002;16:641–652.
17. Hunold P, Maderwald S, Eggebrecht H, Vogt FM, Barkhausen J.Steady-state free precession sequences in myocardial first-passperfusion MR imaging: comparison with TurboFLASH imaging. EurRadiol 2004;14:409–416.
18. Wang Y, Moin K, Akinboboye O, Reichek N. Myocardial first passperfusion: steady-state free precession versus spoiled gradientecho and segmented echo planar imaging. Magn Reson Med 2005;54:1123–1129.
19. Fenchel M, Helber U, Simonetti OP, et al. Multislice first-passmyocardial perfusion imaging: Comparison of saturation recovery(SR)-TrueFISP-two-dimensional (2D) and SR-TurboFLASH-2Dpulse sequences. J Magn Reson Imaging 2004;19:555–563.
20. Sodickson DK, Manning WJ. Simultaneous acquisition of spatialharmonics (SMASH): fast imaging with radiofrequency coil arrays.Magn Reson Med 1997;38:591–603.
21. Pruessmann KP, Weiger M, Scheidegger MB, Boesiger P. SENSE:sensitivity encoding for fast MRI. Magn Reson Med 1999;42:952–962.
22. Griswold MA, Jakob PM, Heidemann RM, et al. Generalized auto-calibrating partially parallel acquisitions (GRAPPA). Magn ResonMed 2002;47:1202–1210.
23. Wang J, Kluge T, Nittka M, Jellus V, Kuehn B, Kiefer B. Parallelacquisition techniques with modified SENSE reconstructionmSENSE. In: Proceedings of the 1st Wurzburg Workshop on Par-allel Imaging, Wurzburg, Germany: 2001. p 92.
58 Weber et al.
24. Kellman P, Epstein FH, McVeigh ER. Adaptive sensitivity encodingincorporating temporal filtering (TSENSE). Magn Reson Med 2001;45:846–852.
25. Kellman P, Derbyshire JA, Agyeman KO, McVeigh ER, Arai AE.Extended coverage first-pass perfusion imaging using slice-inter-leaved TSENSE. Magn Reson Med 2004;51:200–204.
26. Madore B, Glover GH, Pelc NJ. Unaliasing by Fourier-encodingthe overlaps using the temporal dimension (UNFOLD), appliedto cardiac imaging and fMRI. Magn Reson Med 1999;42:813–828.
27. Weber S, Kronfeld A, Kunz RP, et al. Comparison of three acceler-ated pulse sequences for semiquantitative myocardial perfusionimaging using sensitivity encoding incorporating temporal filtering(TSENSE). J Magn Reson Imaging 2007;26:569–579.
28. Dietrich O, Raya JG, Reeder SB, Reiser MF, Schoenberg SO. Mea-surement of signal-to-noise ratios in MR images: influence of mul-tichannel coils, parallel imaging, and reconstruction filters. J MagnReson Imaging 2007;26:375–385.
29. Kroll K, Wilke N, Jerosch-Herold M, et al. Modeling regional myo-cardial flows from residue functions of an intravascular indicator.Am J Physiol 1996;271(4 Pt 2):H1643–1655.
30. Jerosch-Herold M, Wilke N, Wang Y, et al. Direct comparison of anintravascular and an extracellular contrast agent for quantificationof myocardial perfusion. Cardiac MRI Group. Int J Card Imaging1999;15:453–464.
31. King RB, Bassingthwaighte JB, Hales JR, Rowell LB. Stability ofheterogeneity of myocardial blood flow in normal awake baboons.Circ Res 1985;57:285–295.
32. Chan IS, Goldstein AA, Bassingthwaighte JB. SENSOP: a deriva-tive-free solver for nonlinear least squares with sensitivity scaling.Ann Biomed Eng 1993;21:621–631.
33. Barkhausen J, Hunold P, Jochims M, Debatin JF. Imaging of myo-cardial perfusion with magnetic resonance. J Magn Reson Imaging2004;19:750–757.
34. Storey P, Chen Q, Li W, Edelman RR, Prasad PV. Band artifacts dueto bulk motion. Magn Reson Med 2002;48:1028–1036.
35. Di Bella EV, Parker DL, Sinusas AJ. On the dark rim artifact indynamic contrast-enhanced MRI myocardial perfusion studies.Magn Reson Med 2005;54:1295–1299.
36. Hsu LY, Rhoads KL, Holly JE, Kellman P, Aletras AH, Arai AE.Quantitative myocardial perfusion analysis with a dual-bolus con-trast-enhanced first-pass MRI technique in humans. J Magn ResonImaging 2006;23:315–322.
Myocardial Perfusion Imaging Using PAT 59