Embed Size (px)
Citation preview

PRINCIPAL STATISTICIAN
BRENDA RAMÍREZ
QUANTITATIVE MEASURES TO EVALUATE PROCESS STABILITY AND ASSESS PROCESS HEALTH
2
• Motivation
• Overview of Process Stability Metrics
• Applications
– Stability Metrics to Inform Nelson Violations on Shewhart Charts
– Combining Process Stability and Process Capability
• Process Performance Graph in JMP®
• Summary
• References & Acknowledgements
OUTLINE

3
• Develop a more objective and consistent way to determine if a
parameter is in a state of statistical control.
• Evaluate the process stability of hundreds of a parameters in
an efficient manner.
• Prioritize and track improvement efforts using the two
important dimensions of process health: stability and
capability.
MOTIVATION
4
• Three metrics were developed:
– SR Test: short term vs. long term variation
– ANOVA F-Test: between vs. within variation
– Instability Ratio (INSR): Western Electric rule violations
• These metrics are used to classify a parameter as:
– Stable process is operating with common cause variation
– Unstable process is operating with special cause variation
• Ramírez, B and Runger, G. (2006).
PROCESS STABILITY METRICS
5
• Using different estimates for the population std. dev. has been studied, e.g., Podolski (1989), Cruthis and Ridgon (1992), Wheeler (1995).
• In the context of SPC:– Long term variation can be estimated using the sample standard
deviation, s
– Short term variation can be estimated using control chart estimates of standard deviation, such as R÷d2 or MR÷d2.
• When evaluating process variation:– Stable process ► long term variation ≈ short term
– Unstable process ► long term variation > short term
SR TEST: SHORT TERM VS. LONG TERM VARIATION
6
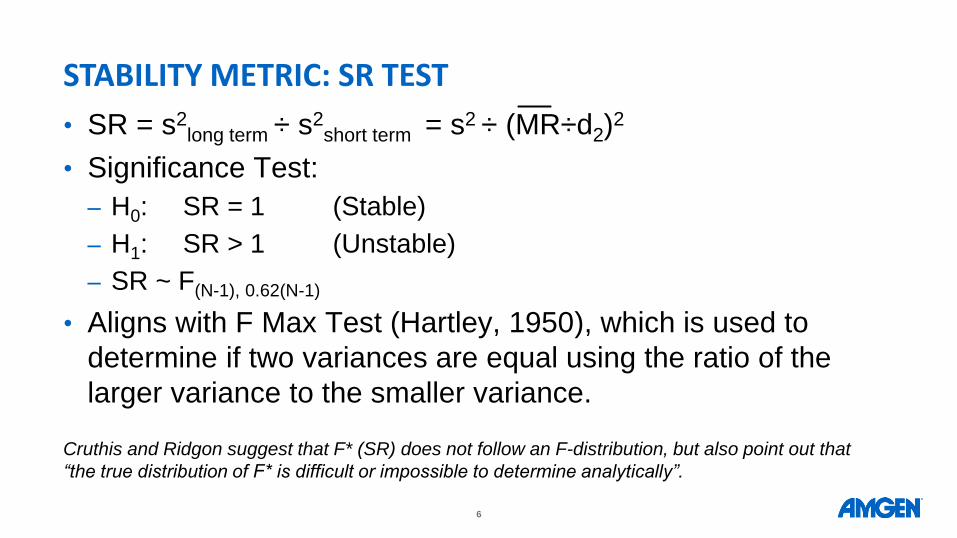
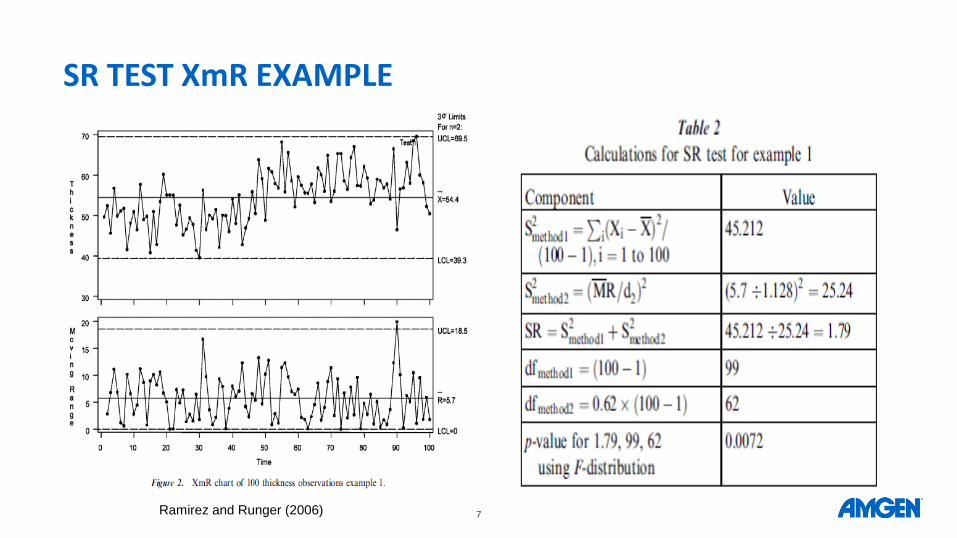
• SR = s2long term ÷ s2
short term = s2 ÷ (MR÷d2)2
• Significance Test:
– H0: SR = 1 (Stable)
– H1: SR > 1 (Unstable)
– SR ~ F(N-1), 0.62(N-1)
• Aligns with F Max Test (Hartley, 1950), which is used to
determine if two variances are equal using the ratio of the
larger variance to the smaller variance.
STABILITY METRIC: SR TEST
Cruthis and Ridgon suggest that F* (SR) does not follow an F-distribution, but also point out that
“the true distribution of F* is difficult or impossible to determine analytically”.
7
SR TEST XmR EXAMPLE
Ramirez and Runger (2006)
8
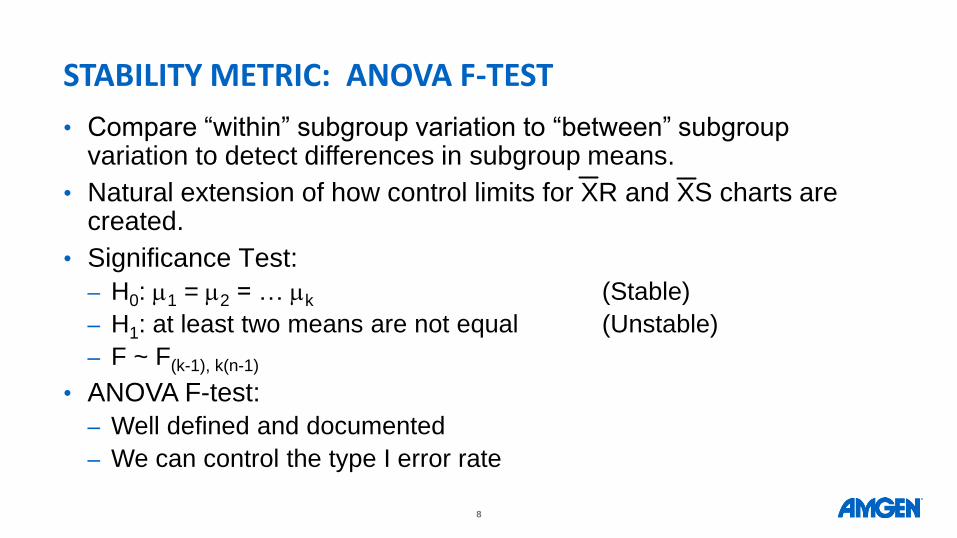
• Compare “within” subgroup variation to “between” subgroup variation to detect differences in subgroup means.
• Natural extension of how control limits for XR and XS charts are created.
• Significance Test:
– H0: m1 = m2 = … mk (Stable)
– H1: at least two means are not equal (Unstable)
– F ~ F(k-1), k(n-1)
• ANOVA F-test:
– Well defined and documented
– We can control the type I error rate
STABILITY METRIC: ANOVA F-TEST
9
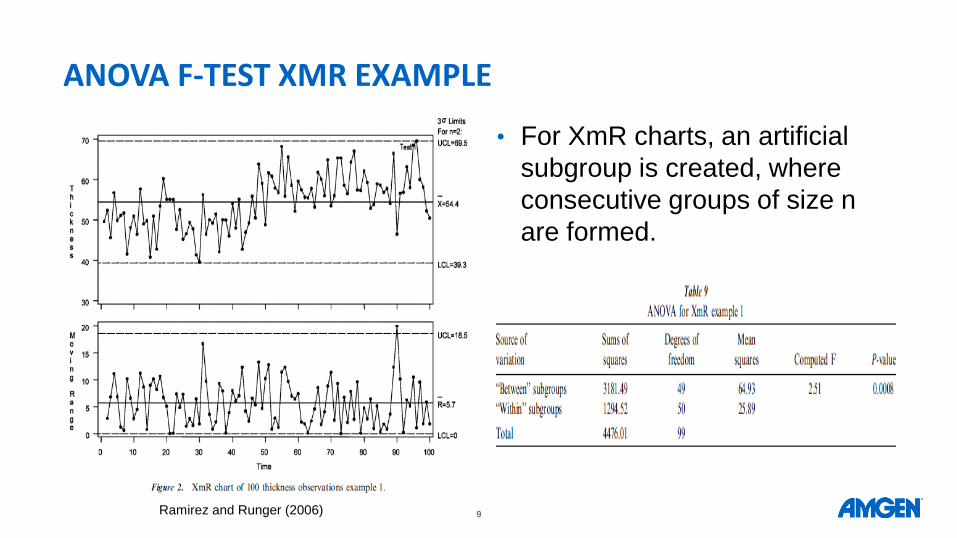
ANOVA F-TEST XMR EXAMPLE
• For XmR charts, an artificial
subgroup is created, where
consecutive groups of size n
are formed.
Ramirez and Runger (2006)
10
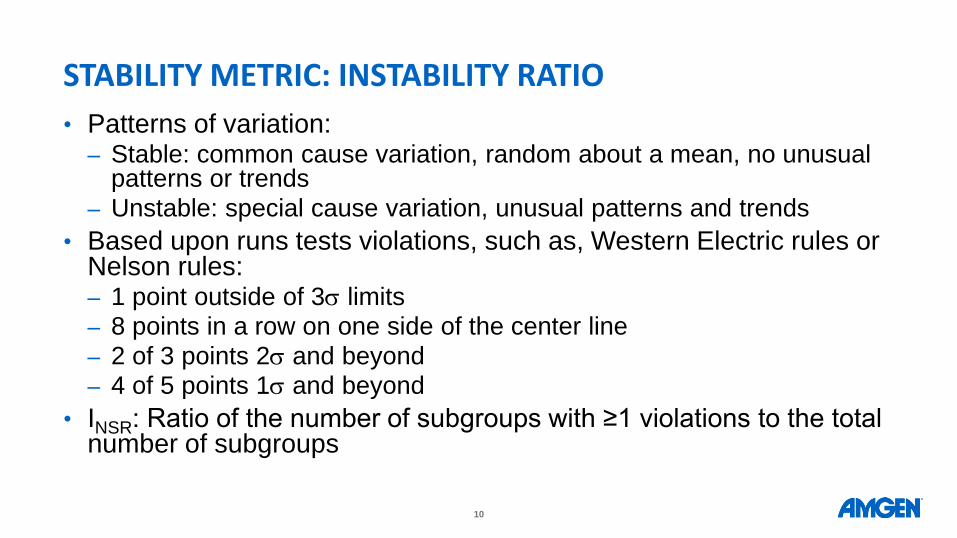
• Patterns of variation:– Stable: common cause variation, random about a mean, no unusual
patterns or trends
– Unstable: special cause variation, unusual patterns and trends
• Based upon runs tests violations, such as, Western Electric rules or Nelson rules:– 1 point outside of 3s limits– 8 points in a row on one side of the center line
– 2 of 3 points 2s and beyond– 4 of 5 points 1s and beyond
• INSR: Ratio of the number of subgroups with ≥1 violations to the total number of subgroups
STABILITY METRIC: INSTABILITY RATIO
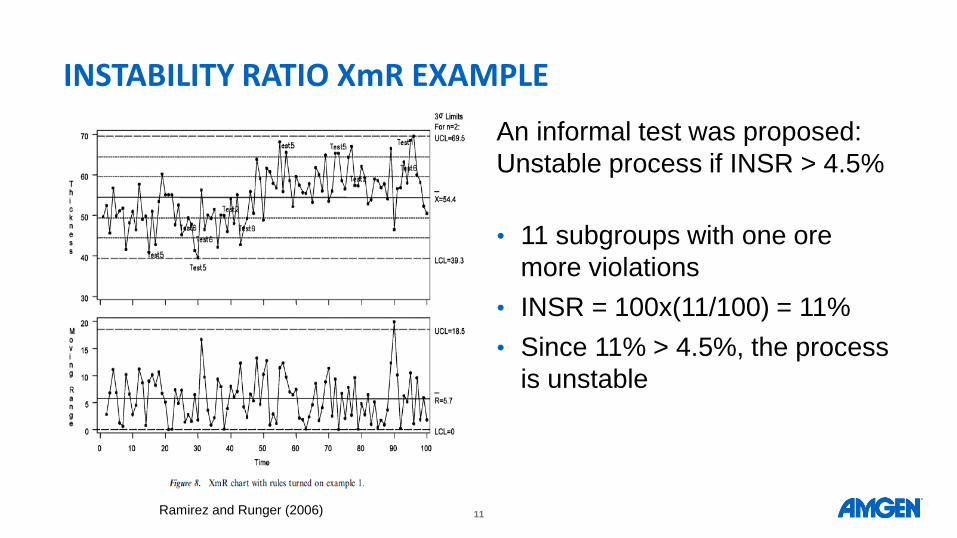
11
An informal test was proposed:
Unstable process if INSR > 4.5%
• 11 subgroups with one ore
more violations
• INSR = 100x(11/100) = 11%
• Since 11% > 4.5%, the process
is unstable
INSTABILITY RATIO XmR EXAMPLE
Ramirez and Runger (2006)

12
• Statistical performance has been documented, e.g., Cruthis
and Ridgon (1992), Ramirez and Runger (2006), Greene
(2007), Britt, Ramirez and Mistretta (2016)
• Conditions studied:
– Random noise, different sample sizes
– Special cause variation, different sample sizes and shifts
STABILITY METRIC PERFORMANCE
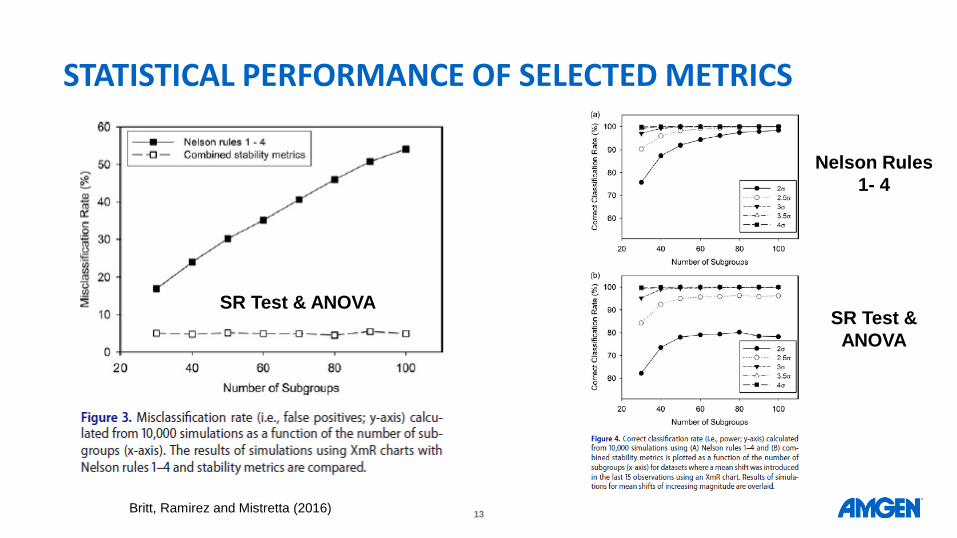
13
STATISTICAL PERFORMANCE OF SELECTED METRICS
SR Test & ANOVASR Test &
ANOVA
Nelson Rules
1- 4
Britt, Ramirez and Mistretta (2016)
14
• Motivation
• Overview of Process Stability Metrics
• Applications
– Stability Metrics to Inform Nelson Violations on Shewhart Charts
– Combining Process Stability and Process Capability
• Process Performance Graph in JMP®
OUTLINE
15
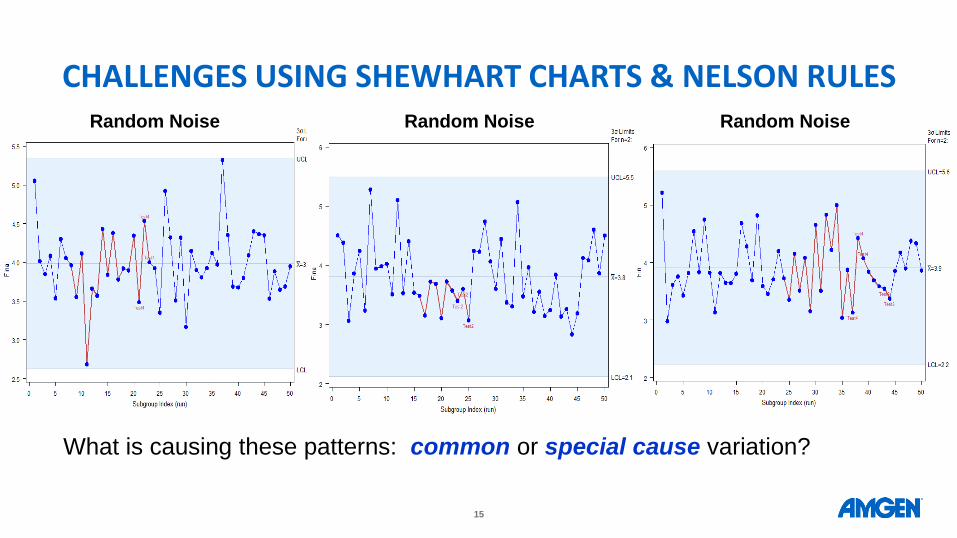
CHALLENGES USING SHEWHART CHARTS & NELSON RULES
What is causing these patterns: common or special cause variation?
Random Noise Random Noise Random Noise
16
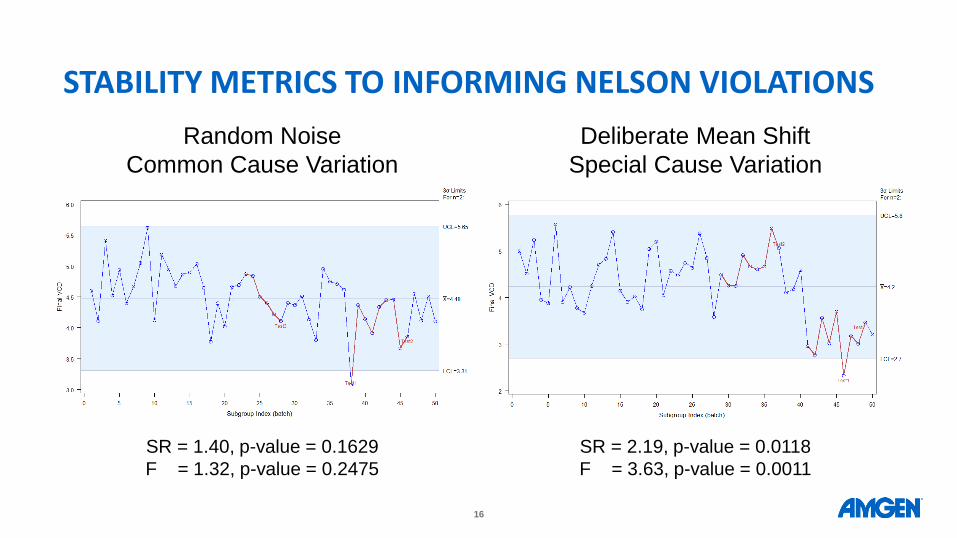
STABILITY METRICS TO INFORMING NELSON VIOLATIONS
Random Noise
Common Cause Variation
Deliberate Mean Shift
Special Cause Variation
SR = 1.40, p-value = 0.1629
F = 1.32, p-value = 0.2475
SR = 2.19, p-value = 0.0118
F = 3.63, p-value = 0.0011
17
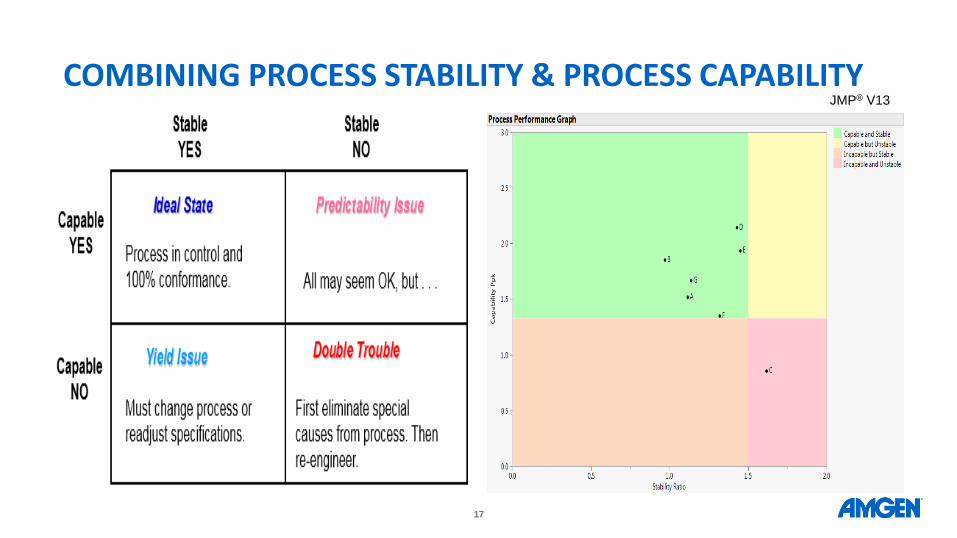
COMBINING PROCESS STABILITY & PROCESS CAPABILITYJMP® V13
18
• Motivation
• Overview of Process Stability Metrics
• Applications
– Stability Metrics to Inform Nelson Violations on Shewhart Charts
– Combining Process Stability and Process Capability
• Process Performance Graph in JMP®
• Summary
• References & Acknowledgements
OUTLINE
19
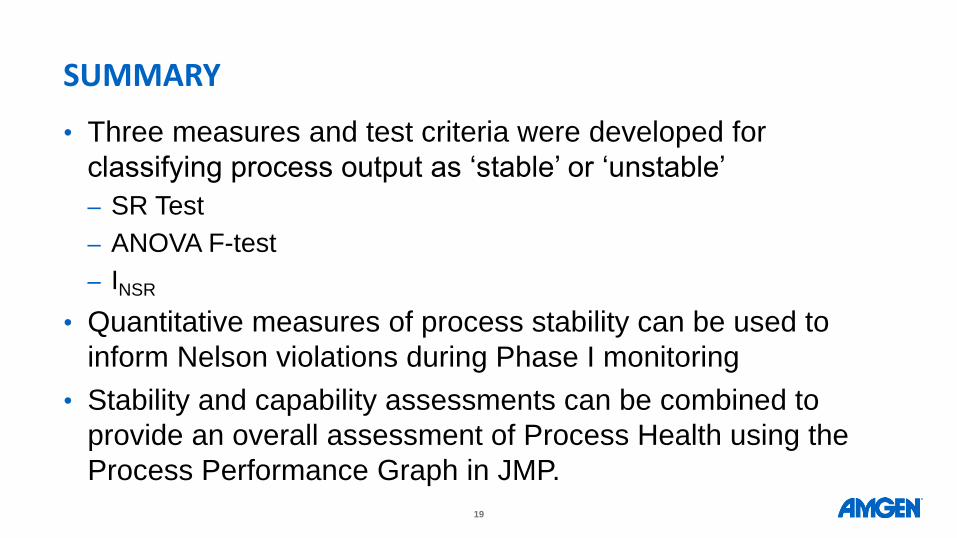
SUMMARY
• Three measures and test criteria were developed for
classifying process output as ‘stable’ or ‘unstable’
– SR Test
– ANOVA F-test
– INSR
• Quantitative measures of process stability can be used to
inform Nelson violations during Phase I monitoring
• Stability and capability assessments can be combined to
provide an overall assessment of Process Health using the
Process Performance Graph in JMP.
20
REFERENCES• Garry Poldoski (1989), Standard deviation: root mean square versus
range conversion, Quality Engineering, 2:2, 155-161
• Emma N. Cruthis & Steven E. Rigdon (1992), Comparing two estimates of the variance to determine the stability of a process, Quality Engineering, 5:1, 67-74.
• Brenda Ramírez & George Runger (2006), Quantitative techniques to evaluate process stability, Quality Engineering, 18: 53 – 68.
• Al Greene (2007), Process Stability: A Method to Quantify the
Stability of Your Process Using the Stability Ratio (SR), A
Presentation to the American Society for Quality, Louisville, KY,
April 12, 2007.
• Keith A. Britt, Brenda Ramirez & Tom Mistretta (2016) Process monitoring using statistical stability metrics: Applications to biopharmaceutical processes, Quality Engineering, 28:2, 193-211

21
• George Runger
• Donald Wheeler
• José Ramírez
• Keith Britt
• Tom Mistretta
• Mark DiMartino
• Dan Weese
ACKNOWLEDGEMENTS