Embed Size (px)
Citation preview
75
G Blumenkrantz et al. MRI of CartilageEuropean Cells and Materials Vol. 13. 2007 (pages 75-86) DOI: 10.22203/eCM.v013a08 ISSN 1473-2262
Abstract
Magnetic resonance imaging of articular cartilage hasrecently been recognized as a tool for the characterizationof cartilage morphology, biochemistry and function. In thispaper advancements in cartilage imaging, computation ofcartilage volume and thickness, and measurement ofrelaxation times (T2 and T1ρ) are presented. In addition, thedelayed uptake of Gadolinium DTPA as a marker ofproteoglycan depletion is also reviewed. The cross-sectionaland longitudinal studies using these imaging techniquesshow promise for cartilage assessment and for the study ofosteoarthritis.
Key Words: magnetic resonance imaging, osteoarthritis,cartilage, collagen, proteoglycan.
*Address for correspondence:Sharmila MajumdarDepartment of RadiologyUniversity of California, San Francisco
Telephone Number: 415 476-6830FAX Number: 415 514-9656
E-mail: [email protected]
Introduction
Osteoarthritis: Prevalence and Risk FactorsOsteoarthritis (OA) is a heterogeneous and multi-factorialdisease characterized by the progressive loss of hyalinearticular cartilage and the development of altered jointcongruency, subchondral sclerosis, intraosseous cysts, andosteophytes. It affects approximately 14% of the adultpopulation (Forman et al., 1983) and is the second mostcommon cause of permanent disability among subjectsover the age of fifty (Peyron, 1984). The initiation andpathogenesis of OA can be affected by many factorsincluding altered mechanical loading and previous kneeinjury.
The relationships between knee OA and heavymechanical work, obesity and malalignment are wellestablished (Kohatsu and Schurman, 1990; Lindberg andMontgomery, 1987). Previous studies have demonstratedthat weight gain increases the risk of OA (Manninen etal., 2004), while weight loss reduces the risk (Felson etal., 1992). Sharma et al. (2001a; 2001b) have shown thatvarus alignment at baseline is associated with a 4-foldincrease in the odds for medial OA progression, whilevalgus alignment at baseline is associated with a 5-foldincrease in the odds for lateral OA progression. Cicuttiniet al. have shown that malalignment at baseline isassociated with cartilage loss over two years (Cicuttini etal., 2004c).
Relative to other risk factors, post-traumatic OA (thatfollows injuries that deform the articular surface or alterjoint geometry), tends to develop relatively soon after theindex injury (e.g., two years (Wright, 1990)) because ofthe severity of this biomechanical input to the diseaseprocess. In a five-year follow-up of thirty-two patientswho underwent surgery for anterior cruciate ligament(ACL) tear, 72% complained of knee pain, 66% had kneeswelling, and 37% reported impaired activities of dailyliving (Feagin, 1979; Wright, 1990). Numerous articleshave reported an increased incidence of knee OAfollowing meniscal surgery (Daniel et al., 1994; Fairbank,1984; Lynch et al., 1983). In a three to ten year (average3.8) follow-up of 196 patients with meniscal tearsassociated with ACL injury, Lynch et al. (1983) observedradiographic changes consistent with degenerative jointdisease (joint-space narrowing, osteophytes and articularsurface flattening) in 88% of the 140 patients whounderwent partial or complete meniscectomy. Thesestudies suggest that traumatic injury and surgicalintervention are risk factors for OA.
QUANTITATIVE MAGNETIC RESONANCE IMAGING OF ARTICULAR CARTILAGEIN OSTEOARTHRITIS
Gabrielle Blumenkrantz and Sharmila Majumdar
Musculoskeletal and Quantitative Imaging Research Group, Department of Radiology, University of California, San Francisco, San Francisco, CA
andJoint Bioengineering Graduate Group,
University of California, San Francisco and University of California, Berkeley, CA
76
G Blumenkrantz et al. MRI of Cartilage
Natural HistoryThe initial stages of OA include proteoglycan loss,increased water content, and disorganization of thecollagen network. With further degeneration, cartilagetissue becomes ulcerated causing proteoglycans to diffuseinto the synovial fluid, thus decreasing water content incartilage. The intermediate stages of OA include cartilagethinning, fibrillation, and decreased proteoglycan and watercontent. In the late stages of OA, collagen, proteoglycan,and water content are further reduced, and the collagennetwork is severely disrupted (Dijkgraaf et al., 1995).
Imaging of Osteoarthritis of the Knee
RadiographyPrimary evaluation of arthritis has relied primarily on plainradiography (Altman et al., 1987), which depicts only grossosseous changes that tend to occur late in the disease. Earlychanges in the cartilage and other articular tissues are notdirectly visible. Cartilage loss can only be indirectlyinferred by the development of joint-space narrowing,which can be highly unreliable even with careful attentionto proper technique (Rogers et al., 1990). False-positiverates as high as 20-40% have been reported for thisparameter. In addition, plain radiographs are insensitiveto focal cartilage loss, and widening of the joint spacedespite significant cartilage loss can occur in onecompartment of the knee simply as a result of narrowingin the other compartment (Chan et al., 1990). Furthermore,meniscal position and degeneration affect joint-spacenarrowing (Hunter et al., 2006b), demonstrating that joint-space narrowing is unspecific to global cartilage loss andcan implicate various morphologic changes in the joint.Radiographic changes reflect the pathologic changes incartilage and bone, but they do not generally correlate withthe severity of pathologic joint destruction. Since thepathologic/radiographic findings of disease do not alwayscorrelate with joint symptoms in cross-sectional studies,the pathologic aspect of the disease does not alwayscorrelate with the clinical prevalence or natural history ofOA. Dougados et al. (1992) reported that althoughradiographic progression was rare by crude Kellgren andLawrence (Kellgren and Lawrence, 1957) grading, somesymptomatic improvement with current treatment was seenover one year of follow-up. Longer term studies haveshown that radiographic progression occurs in up to two-thirds of the patients and that improvement is rare(Schouten et al., 1992; Spector et al., 1992). Radiographicprogression was more prevalent in patients who had earlierevidence of structural changes, femoral or tibial sclerosis.
Magnetic Resonance Imaging of Knee OAMagnetic resonance (MR) imaging is ideal for monitoringarthritis. MR offers multi-planar capabilities, high spatialresolution without ionizing radiation, and superior contrastbetween joint tissues; thus it has gained popularity as amodality for assessing OA. By combining this contrastwith moderate in-plane resolution (469 microns x 938microns) and relatively thin slices (1.5 mm) on a 1.5 Tscanner, Recht, et al. (1993) showed 96% sensitivity and95% specificity for detecting cartilage abnormalities visible
in cadaveric knees following pathological section. Severalstudies have graded cartilage lesions in OA subjects andcompared the severity of these lesions, with other findingssuch as meniscal defects, the presence of marrow lesions,and radiographic and clinical scores (Felson et al., 2001;Felson et al., 2003; Link et al., 2003).
Quantitative MR methods for measuring the relaxationproperties in cartilage may aid in the diagnosis of earlyOA prior to irreversible morphologic changes. This articlewill review MR imaging quantification techniques forcartilage assessment and their applications to OA imaging.Cartilage volume and thickness measurements, T2mapping, T1ρ mapping, and dGEMRIC imaging will bediscussed. A summary with a limited list of references forthe techniques reviewed is presented in Table 1. WhileMR derived measurements of water diffusion have alsobeen studied in articular cartilage, given the limited scopeof this review, these aspects will not be discussed in thispaper.
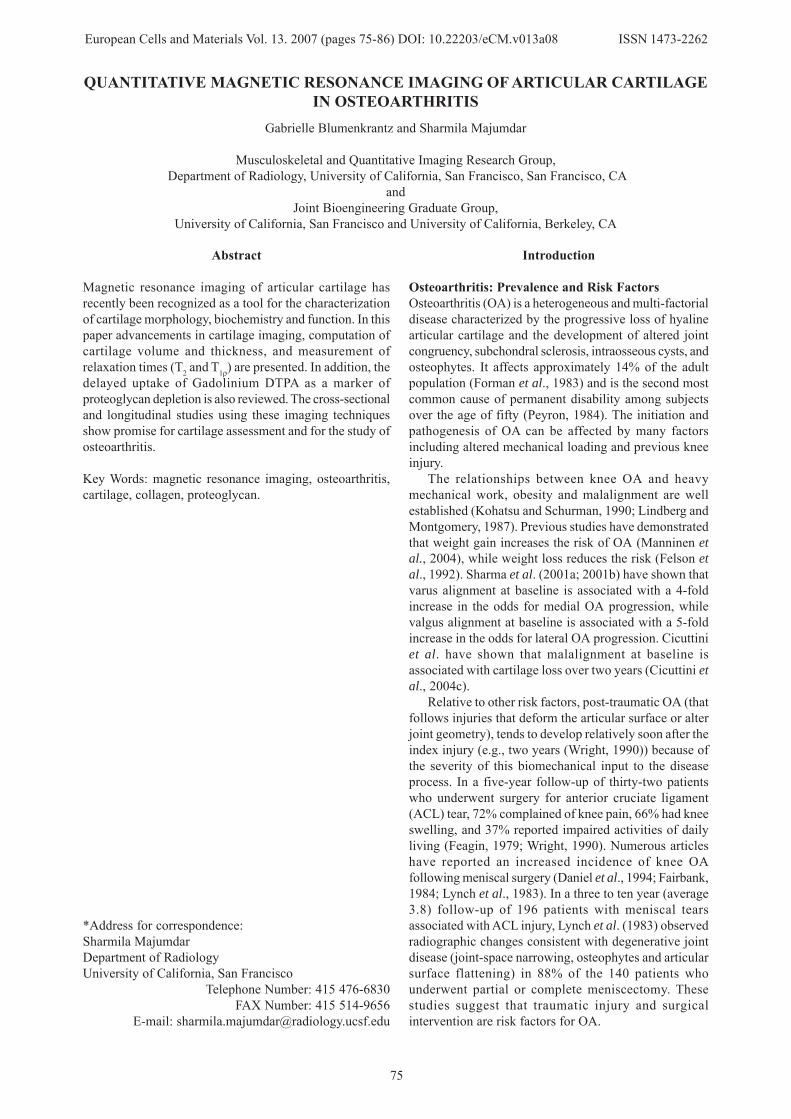
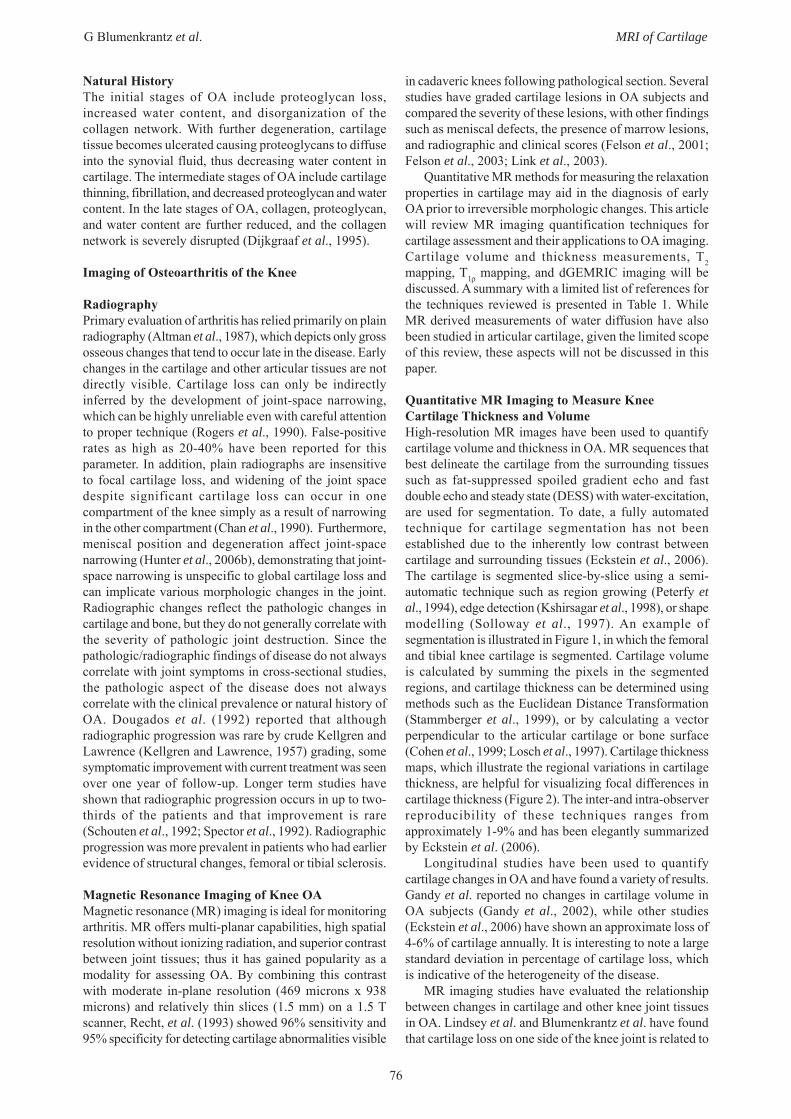
Quantitative MR Imaging to Measure KneeCartilage Thickness and VolumeHigh-resolution MR images have been used to quantifycartilage volume and thickness in OA. MR sequences thatbest delineate the cartilage from the surrounding tissuessuch as fat-suppressed spoiled gradient echo and fastdouble echo and steady state (DESS) with water-excitation,are used for segmentation. To date, a fully automatedtechnique for cartilage segmentation has not beenestablished due to the inherently low contrast betweencartilage and surrounding tissues (Eckstein et al., 2006).The cartilage is segmented slice-by-slice using a semi-automatic technique such as region growing (Peterfy etal., 1994), edge detection (Kshirsagar et al., 1998), or shapemodelling (Solloway et al., 1997). An example ofsegmentation is illustrated in Figure 1, in which the femoraland tibial knee cartilage is segmented. Cartilage volumeis calculated by summing the pixels in the segmentedregions, and cartilage thickness can be determined usingmethods such as the Euclidean Distance Transformation(Stammberger et al., 1999), or by calculating a vectorperpendicular to the articular cartilage or bone surface(Cohen et al., 1999; Losch et al., 1997). Cartilage thicknessmaps, which illustrate the regional variations in cartilagethickness, are helpful for visualizing focal differences incartilage thickness (Figure 2). The inter-and intra-observerreproducibility of these techniques ranges fromapproximately 1-9% and has been elegantly summarizedby Eckstein et al. (2006).
Longitudinal studies have been used to quantifycartilage changes in OA and have found a variety of results.Gandy et al. reported no changes in cartilage volume inOA subjects (Gandy et al., 2002), while other studies(Eckstein et al., 2006) have shown an approximate loss of4-6% of cartilage annually. It is interesting to note a largestandard deviation in percentage of cartilage loss, whichis indicative of the heterogeneity of the disease.
MR imaging studies have evaluated the relationshipbetween changes in cartilage and other knee joint tissuesin OA. Lindsey et al. and Blumenkrantz et al. have foundthat cartilage loss on one side of the knee joint is related to
77
G Blumenkrantz et al. MRI of Cartilage
Table 1: A summary (with a limited list of references) of the quantitative imaging techniques for cartilage evaluation.
trabecular bone loss on the opposite side of the knee joint(Blumenkrantz et al., 2004b; Lindsey et al., 2004).Cartilage degeneration is also associated with changes insubchondral bone architecture (Bobinac et al., 2003), aswell as changes in trabecular bone proximal to the jointline (Blumenkrantz et al., 2004b). Other factors associatedwith cartilage loss include mensical damage and bonemarrow oedema (Raynauld et al., 2006; Torres et al., 2006).A recent longitudinal study by Hunter et al. (2006a) hasdemonstrated that enlarging bone marrow lesions areassociated with cartilage loss in OA. An inverserelationship between pain, as measured by the WesternOntario and McMaster Universities scoring system(WOMAC), and cartilage volume has been demonstrated
(Cicuttini et al., 2002; Hunter et al., 2003; Lindsey et al.,2004; Wluka et al., 2004). Therefore, the measurement ofcartilage volume using MR imaging provides longitudinalquantification of cartilage loss in OA and establishes linksbetween cartilage loss and degenerative changes in othertissues of the knee joint.
T2 mappingQuantitative T2 relaxation time is a non-invasive markerof cartilage degeneration because it is sensitive to tissuehydration and biochemical composition. Immobilizationof water protons in cartilage by the collagen-proteoglycanmatrix promotes T2 decay and renders the cartilage low insignal intensity on long-TE (T2-weighted) images, while
Imaging Technique Affected By: In Vitro Studies: In Vivo Studies:
Cartilage volume and thickness calculations
• Hydration • Loading
• Cohen et al. (Cohen et al., 1999) • Peterfy et al.(Peterfy et al., 1994) • Sittek et al. (Sittek et al., 1996)
• Blumenkrantz et al.(Blumenkrantz et al., 2004b)
• Cicuttini et al. (Cicuttini et al., 2004a; Cicuttini et al., 2004c; Cicuttini et al., 2004d; Cicuttini et al., 2004e)
• Eckstein et al.(Eckstein et al., 2005; Eckstein et al., 2006; Eckstein et al., 2002a; Eckstein et al., 2002b)
• Gandy et al.(Gandy et al., 2002) • Lindsey et al.(Lindsey et al., 2004) • Peterfy et al.(Peterfy et al., 1994) • Raynauld et al.(Raynauld et al., 2003;
Raynauld et al., 2006; Raynauld et al., 2004)
• Wluka et al.(Wluka et al., 2002; Wluka et al., 2004)
T2 mapping
• Integrity of collagen network
• Hydration
• David-Vaudey et al. (David-Vaudey et al., 2004)
• Goodwin et al. (Goodwin and Dunn, 1998; Goodwin et al., 1998; Goodwin et al., 2004)
• Lammentausta et al. (Lammentausta et al., 2006)
• Menezes et al. (Menezes et al., 2004) • Watrin-Pinzano et al. (Watrin-Pinzano et al.,
2004a; Watrin-Pinzano et al., 2004b; Watrin-Pinzano et al., 2005)
• Xia et al.(Xia, 1998; Xia et al., 1994)
• Dardzinski et al.(Dardzinski et al., 2002; Dardzinski et al., 1997)
• Dray et al.(Dray et al., 2005) • Dunn et al.(Dunn et al., 2004) • Mosher et al.(Mosher et al., 2004; Mosher
et al., 2000; Mosher et al., 2001; Mosher et al., 2005)
• Smith et al. (Smith et al., 2001)
T1ρ mapping
• Macromolecular concentration including GAG, collagen
• Hydration
• Akella et al.(Akella et al., 2001) • Duvvuri et al.(Duvvuri et al., 1997) • Menezes et al.(Menezes et al., 2004) • Mlyranik et al.(Mlynarik et al., 2004;
Mlynarik et al., 1999) • Regatte et al.(Regatte et al., 2002) • Wheaton et al.(Wheaton et al., 2004; Wheaton
et al., 2005)
• Li et al.(Li et al., 2007; Li et al., 2005; Li et al., 2006 )
• Pakin et al. (Pakin et al., 2006a; Pakin et al., 2006b)
• Regatte et al.(Regatte et al., 2003; Regatte et al., 2006; Regatte et al., 2004)
dGEMRIC • GAG concentration
• Bashir et al. (Bashir et al., 1996b; Bashir et al., 1999)
• Kurkijarvi et al. (Kurkijarvi et al., 2004) • Lammenstausta et al. (Lammentausta et al.,
2006) • Nieminen et al. (Nieminen et al., 2004a;
Nieminen et al., 2004b) • Nissi et al. (Nissi et al., 2004) • Samosky et al. (Samosky et al., 2005)
• Burstein et al. (Burstein et al., 2001) • Cunningham et al. (Cunningham et al.,
2006) • Gillis et al. (Gillis et al., 2001) • Kim et al. (Kim et al., 2003) • Kimelman et al. (Kimelman et al., 2006) • McKenzie et al. (McKenzie et al., 2006) • Roos et al. (Roos and Dahlberg, 2005) • Tiderius et al. (Tiderius et al., 2006) • Williams et al. (Williams et al., 2004;
Williams et al., 2005)
78
G Blumenkrantz et al. MRI of Cartilage
mobile water protons in synovial fluid retain their highsignal. Loss of collagen and proteoglycan in degeneratingcartilage increases the mobility of water, thus increasingits signal intensity on T2-weighted images (Konig et al.,1987). Signal intensity is further augmented indegenerative disease by the elevation of cartilage watercontent (i.e., proton density) that accompanies matrix loss(Lehner et al., 1989). Consistent with this, foci of highsignal intensity are often seen within the cartilage ofosteoarthritic knees with OA on T2-weighted images andhave been shown to correspond to arthroscopicallydemonstrable abnormalities (Broderick et al., 1994;Peterfy, 2002).
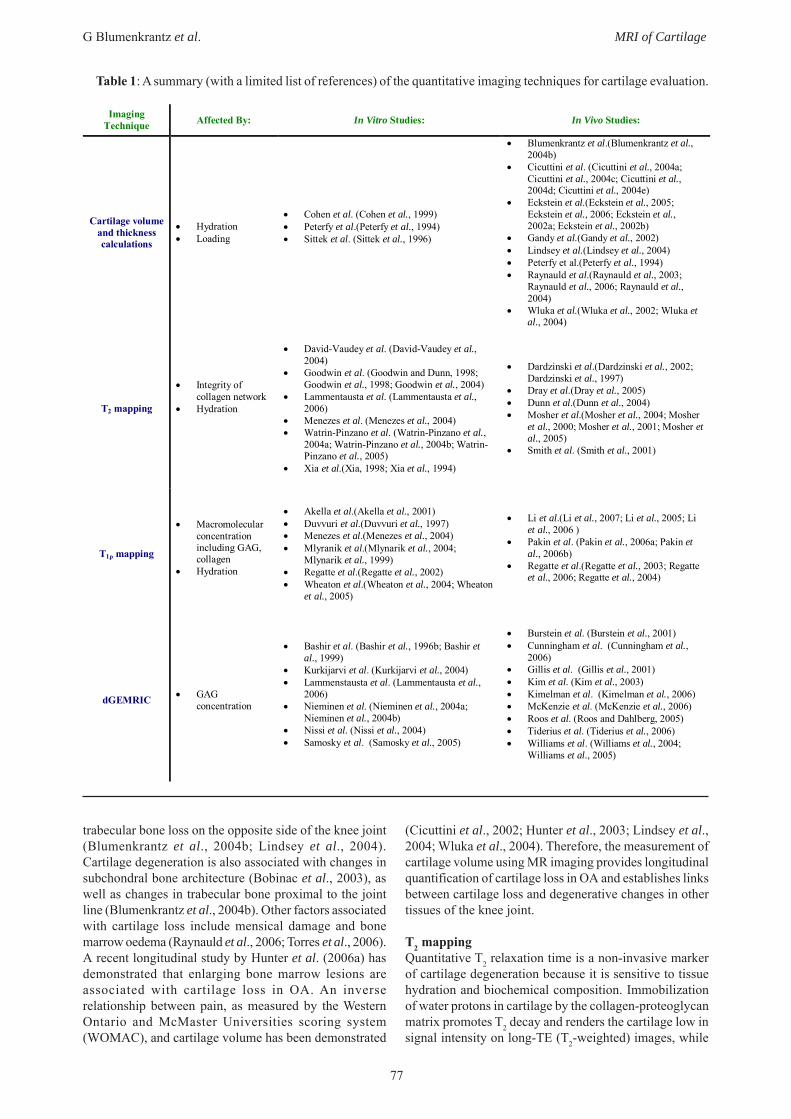
Cartilage T2 maps are created using the followingprocess: Typically, T2-weighted multi-echo, spin echoimages with varying echo times (TE) and identicalrepetition times (TR) are acquired. Second, T2 maps arecomputed (Figure 3) assuming exponential signal decay.T2 is defined as the time at which the signal decays to 37%of the maximum signal.
In vitro imaging studies have evaluated the relationshipbetween biochemistry of cartilage and T2 measurements.Cartilage T2 is affected by hydration and the integrity ofthe collagen matrix; however, the relationship between T2and proteoglycan content remains controversial inliterature. Proteoglycan loss in rat patellar cartilage inducedby hyaluronidase degradation (which does not alter thecollagen network) was associated with significantlyincreased global T2 (Watrin-Pinzano et al., 2005).However, other studies (Borthakur et al., 2000; Mlynariket al., 1999; Toffanin et al., 2001) found that the depletionof proteoglycan had minimal effects on T2. These in vitrostudies demonstrate that the biochemical changesassociated with cartilage degeneration are related toelevated T2; however, the effects of proteoglycanconcentration on T2 must be further evaluated.
The relationship between T2 relaxation time and themechanical properties of cartilage is under investigation.A recent in vitro study by (Lammentausta et al., 2006) hasshown that T2 relaxation time in human patellar cartilageis significantly correlated to Young’s Modulus, suggestingthat T2 quantification may predict the mechanical propertiesof cartilage.
The signal intensity of cartilage in an MR image isdependent on its orientation to the main magnetic field.An in vitro study using high-field (8.6T) microscopic MRI(mMRI) has suggested that the angular dependency of T2with respect to the main magnetic field (B0) can providespecific information about the collagen ultra-structure (Xia,1998). Goodwin et al. (Goodwin et al., 1998) havedescribed how T2 will vary with depth from the articularsurface due to collagen fibril orientation to B0. Imagingof the femoral condyles can be challenging due to the bulkcurvature of the cartilage altering the depth-dependent fibrilorientation. However, a comprehensive in vivo study has
Figure 1: An example of femoral and tibial cartilagesegmentation. This image was acquired at 1.5T withan in-plane resolution of 0.234 x 0.234 mm2 and a slicethickness of 2 mm.
Figure 2: An example of a femoral cartilage thicknessmap demonstrating the variation in cartilage thicknessthroughout the femur.
Figure 3: An example of T2 calculation using four T2-weighted images acquired with different echo-times(TE). The graph shows signal (S) as a function of time.T2 is calculated for each pixel in an image using theabove equation, and is defined as the time at which thesignal decays to 37% of the maximum signal.
79
G Blumenkrantz et al. MRI of Cartilage
shown that the “magic-angle effect” may not be the majordeterminant of T2 heterogeneity in high-curvature articularcartilage (Mosher et al., 2001).
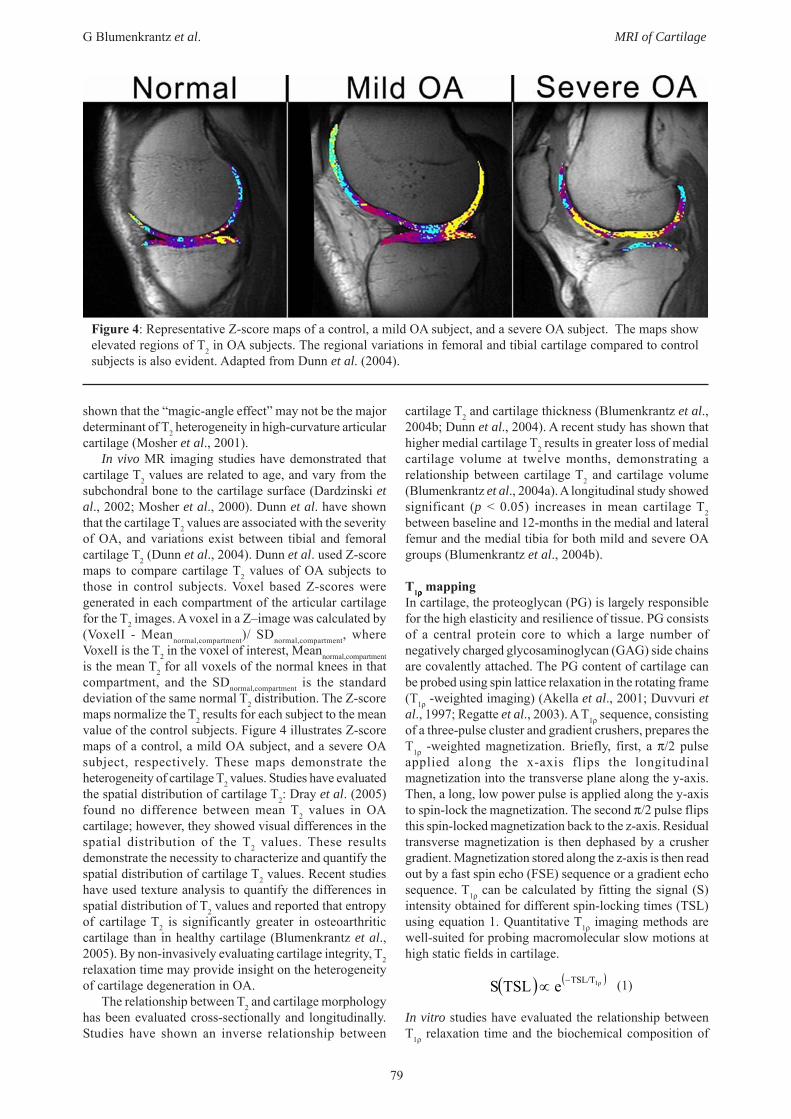
In vivo MR imaging studies have demonstrated thatcartilage T2 values are related to age, and vary from thesubchondral bone to the cartilage surface (Dardzinski etal., 2002; Mosher et al., 2000). Dunn et al. have shownthat the cartilage T2 values are associated with the severityof OA, and variations exist between tibial and femoralcartilage T2 (Dunn et al., 2004). Dunn et al. used Z-scoremaps to compare cartilage T2 values of OA subjects tothose in control subjects. Voxel based Z-scores weregenerated in each compartment of the articular cartilagefor the T2 images. A voxel in a Z–image was calculated by(VoxelI - Meannormal,compartment)/ SDnormal,compartment, whereVoxelI is the T2 in the voxel of interest, Meannormal,compartmentis the mean T2 for all voxels of the normal knees in thatcompartment, and the SDnormal,compartment is the standarddeviation of the same normal T2 distribution. The Z-scoremaps normalize the T2 results for each subject to the meanvalue of the control subjects. Figure 4 illustrates Z-scoremaps of a control, a mild OA subject, and a severe OAsubject, respectively. These maps demonstrate theheterogeneity of cartilage T2 values. Studies have evaluatedthe spatial distribution of cartilage T2: Dray et al. (2005)found no difference between mean T2 values in OAcartilage; however, they showed visual differences in thespatial distribution of the T2 values. These resultsdemonstrate the necessity to characterize and quantify thespatial distribution of cartilage T2 values. Recent studieshave used texture analysis to quantify the differences inspatial distribution of T2 values and reported that entropyof cartilage T2 is significantly greater in osteoarthriticcartilage than in healthy cartilage (Blumenkrantz et al.,2005). By non-invasively evaluating cartilage integrity, T2relaxation time may provide insight on the heterogeneityof cartilage degeneration in OA.
The relationship between T2 and cartilage morphologyhas been evaluated cross-sectionally and longitudinally.Studies have shown an inverse relationship between
cartilage T2 and cartilage thickness (Blumenkrantz et al.,2004b; Dunn et al., 2004). A recent study has shown thathigher medial cartilage T2 results in greater loss of medialcartilage volume at twelve months, demonstrating arelationship between cartilage T2 and cartilage volume(Blumenkrantz et al., 2004a). A longitudinal study showedsignificant (p < 0.05) increases in mean cartilage T2between baseline and 12-months in the medial and lateralfemur and the medial tibia for both mild and severe OAgroups (Blumenkrantz et al., 2004b).
T1ρρρρρ mappingIn cartilage, the proteoglycan (PG) is largely responsiblefor the high elasticity and resilience of tissue. PG consistsof a central protein core to which a large number ofnegatively charged glycosaminoglycan (GAG) side chainsare covalently attached. The PG content of cartilage canbe probed using spin lattice relaxation in the rotating frame(T1ρ -weighted imaging) (Akella et al., 2001; Duvvuri etal., 1997; Regatte et al., 2003). A T1ρ sequence, consistingof a three-pulse cluster and gradient crushers, prepares theT1ρ -weighted magnetization. Briefly, first, a π/2 pulseapplied along the x-axis flips the longitudinalmagnetization into the transverse plane along the y-axis.Then, a long, low power pulse is applied along the y-axisto spin-lock the magnetization. The second π/2 pulse flipsthis spin-locked magnetization back to the z-axis. Residualtransverse magnetization is then dephased by a crushergradient. Magnetization stored along the z-axis is then readout by a fast spin echo (FSE) sequence or a gradient echosequence. T1ρ can be calculated by fitting the signal (S)intensity obtained for different spin-locking times (TSL)using equation 1. Quantitative T1ρ imaging methods arewell-suited for probing macromolecular slow motions athigh static fields in cartilage.
(1)
In vitro studies have evaluated the relationship betweenT1ρ relaxation time and the biochemical composition of
Figure 4: Representative Z-score maps of a control, a mild OA subject, and a severe OA subject. The maps showelevated regions of T2 in OA subjects. The regional variations in femoral and tibial cartilage compared to controlsubjects is also evident. Adapted from Dunn et al. (2004).
( ) ( )1ρTSL/TeTSLS −∝
80
G Blumenkrantz et al. MRI of Cartilage
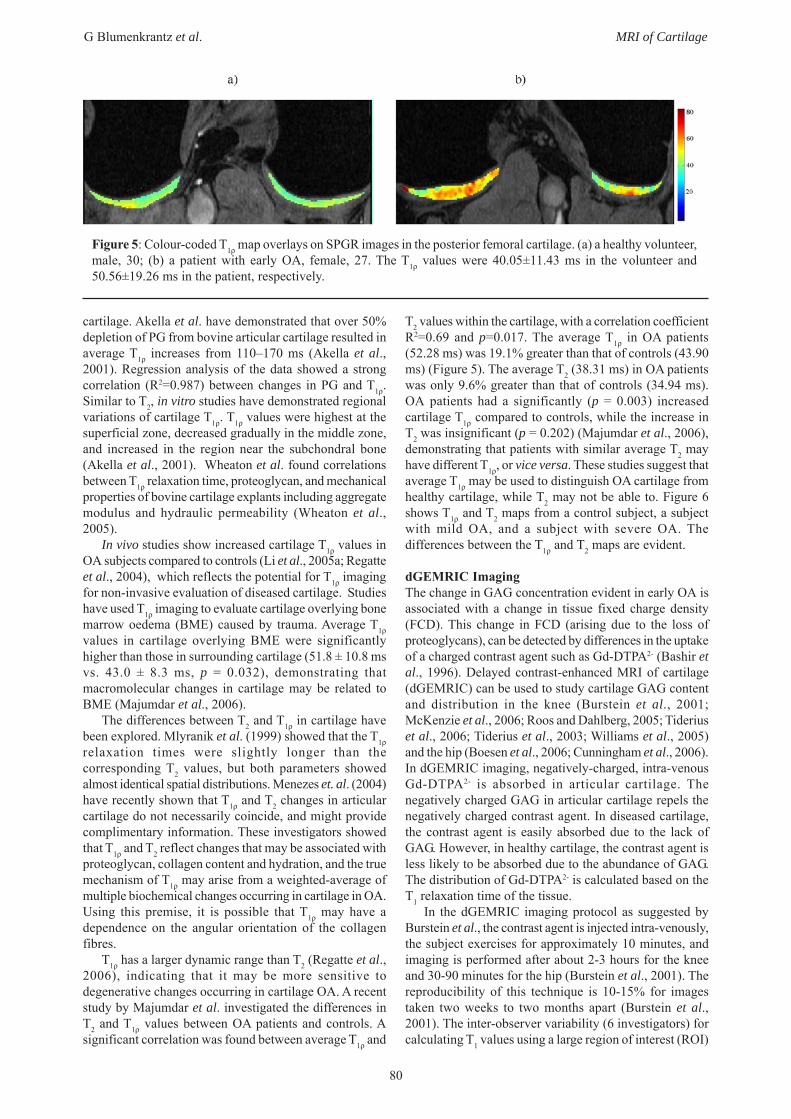
Figure 5: Colour-coded T1ρ map overlays on SPGR images in the posterior femoral cartilage. (a) a healthy volunteer,male, 30; (b) a patient with early OA, female, 27. The T1ρ values were 40.05±11.43 ms in the volunteer and50.56±19.26 ms in the patient, respectively.
cartilage. Akella et al. have demonstrated that over 50%depletion of PG from bovine articular cartilage resulted inaverage T1ρ increases from 110–170 ms (Akella et al.,2001). Regression analysis of the data showed a strongcorrelation (R2=0.987) between changes in PG and T1ρ.Similar to T2, in vitro studies have demonstrated regionalvariations of cartilage T1ρ. T1ρ values were highest at thesuperficial zone, decreased gradually in the middle zone,and increased in the region near the subchondral bone(Akella et al., 2001). Wheaton et al. found correlationsbetween T1ρ relaxation time, proteoglycan, and mechanicalproperties of bovine cartilage explants including aggregatemodulus and hydraulic permeability (Wheaton et al.,2005).
In vivo studies show increased cartilage T1ρ values inOA subjects compared to controls (Li et al., 2005a; Regatteet al., 2004), which reflects the potential for T1ρ imagingfor non-invasive evaluation of diseased cartilage. Studieshave used T1ρ imaging to evaluate cartilage overlying bonemarrow oedema (BME) caused by trauma. Average T1ρvalues in cartilage overlying BME were significantlyhigher than those in surrounding cartilage (51.8 ± 10.8 msvs. 43.0 ± 8.3 ms, p = 0.032), demonstrating thatmacromolecular changes in cartilage may be related toBME (Majumdar et al., 2006).
The differences between T2 and T1ρ in cartilage havebeen explored. Mlyranik et al. (1999) showed that the T1ρrelaxation times were slightly longer than thecorresponding T2 values, but both parameters showedalmost identical spatial distributions. Menezes et. al. (2004)have recently shown that T1ρ and T2 changes in articularcartilage do not necessarily coincide, and might providecomplimentary information. These investigators showedthat T1ρ and T2 reflect changes that may be associated withproteoglycan, collagen content and hydration, and the truemechanism of T1ρ may arise from a weighted-average ofmultiple biochemical changes occurring in cartilage in OA.Using this premise, it is possible that T1ρ may have adependence on the angular orientation of the collagenfibres.
T1ρ has a larger dynamic range than T2 (Regatte et al.,2006), indicating that it may be more sensitive todegenerative changes occurring in cartilage OA. A recentstudy by Majumdar et al. investigated the differences inT2 and T1ρ values between OA patients and controls. Asignificant correlation was found between average T1ρ and
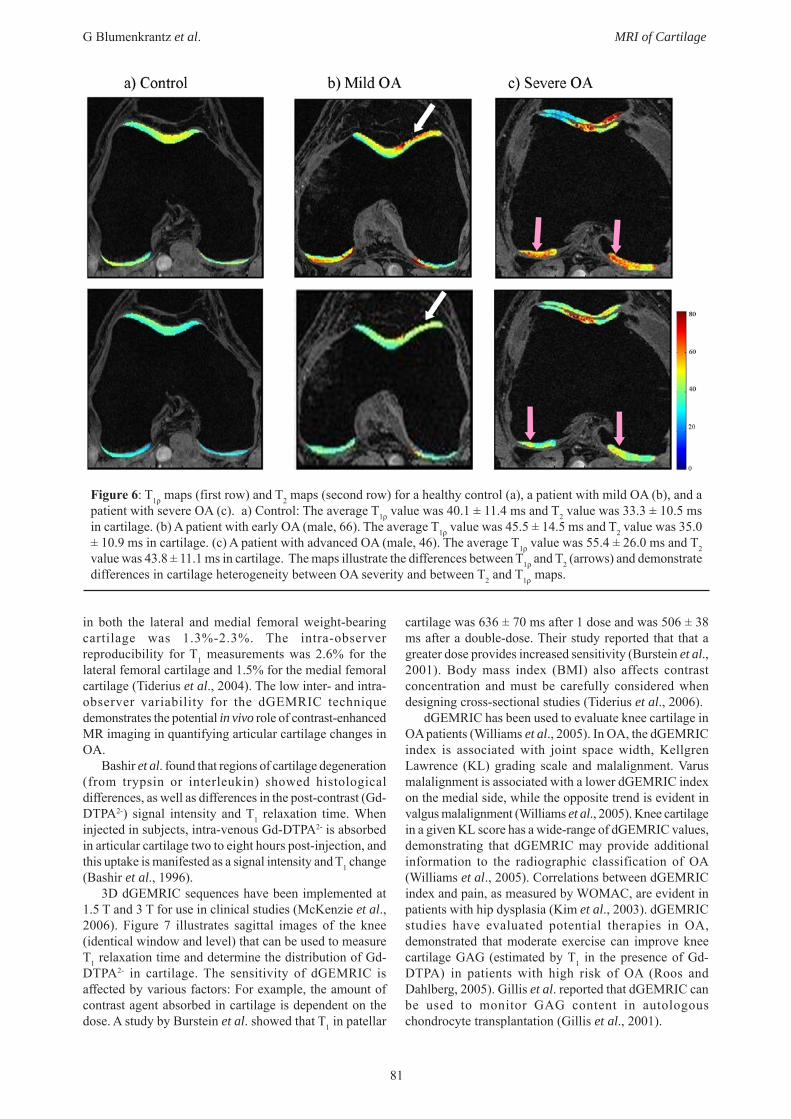
T2 values within the cartilage, with a correlation coefficientR2=0.69 and p=0.017. The average T1ρ in OA patients(52.28 ms) was 19.1% greater than that of controls (43.90ms) (Figure 5). The average T2 (38.31 ms) in OA patientswas only 9.6% greater than that of controls (34.94 ms).OA patients had a significantly (p = 0.003) increasedcartilage T1ρ compared to controls, while the increase inT2 was insignificant (p = 0.202) (Majumdar et al., 2006),demonstrating that patients with similar average T2 mayhave different T1ρ, or vice versa. These studies suggest thataverage T1ρ may be used to distinguish OA cartilage fromhealthy cartilage, while T2 may not be able to. Figure 6shows T1ρ and T2 maps from a control subject, a subjectwith mild OA, and a subject with severe OA. Thedifferences between the T1ρ and T2 maps are evident.
dGEMRIC ImagingThe change in GAG concentration evident in early OA isassociated with a change in tissue fixed charge density(FCD). This change in FCD (arising due to the loss ofproteoglycans), can be detected by differences in the uptakeof a charged contrast agent such as Gd-DTPA2- (Bashir etal., 1996). Delayed contrast-enhanced MRI of cartilage(dGEMRIC) can be used to study cartilage GAG contentand distribution in the knee (Burstein et al., 2001;McKenzie et al., 2006; Roos and Dahlberg, 2005; Tideriuset al., 2006; Tiderius et al., 2003; Williams et al., 2005)and the hip (Boesen et al., 2006; Cunningham et al., 2006).In dGEMRIC imaging, negatively-charged, intra-venousGd-DTPA2- is absorbed in articular cartilage. Thenegatively charged GAG in articular cartilage repels thenegatively charged contrast agent. In diseased cartilage,the contrast agent is easily absorbed due to the lack ofGAG. However, in healthy cartilage, the contrast agent isless likely to be absorbed due to the abundance of GAG.The distribution of Gd-DTPA2- is calculated based on theT1 relaxation time of the tissue.
In the dGEMRIC imaging protocol as suggested byBurstein et al., the contrast agent is injected intra-venously,the subject exercises for approximately 10 minutes, andimaging is performed after about 2-3 hours for the kneeand 30-90 minutes for the hip (Burstein et al., 2001). Thereproducibility of this technique is 10-15% for imagestaken two weeks to two months apart (Burstein et al.,2001). The inter-observer variability (6 investigators) forcalculating T1 values using a large region of interest (ROI)
81
G Blumenkrantz et al. MRI of Cartilage
in both the lateral and medial femoral weight-bearingcartilage was 1.3%-2.3%. The intra-observerreproducibility for T1 measurements was 2.6% for thelateral femoral cartilage and 1.5% for the medial femoralcartilage (Tiderius et al., 2004). The low inter- and intra-observer variability for the dGEMRIC techniquedemonstrates the potential in vivo role of contrast-enhancedMR imaging in quantifying articular cartilage changes inOA.
Bashir et al. found that regions of cartilage degeneration(from trypsin or interleukin) showed histologicaldifferences, as well as differences in the post-contrast (Gd-DTPA2-) signal intensity and T1 relaxation time. Wheninjected in subjects, intra-venous Gd-DTPA2- is absorbedin articular cartilage two to eight hours post-injection, andthis uptake is manifested as a signal intensity and T1 change(Bashir et al., 1996).
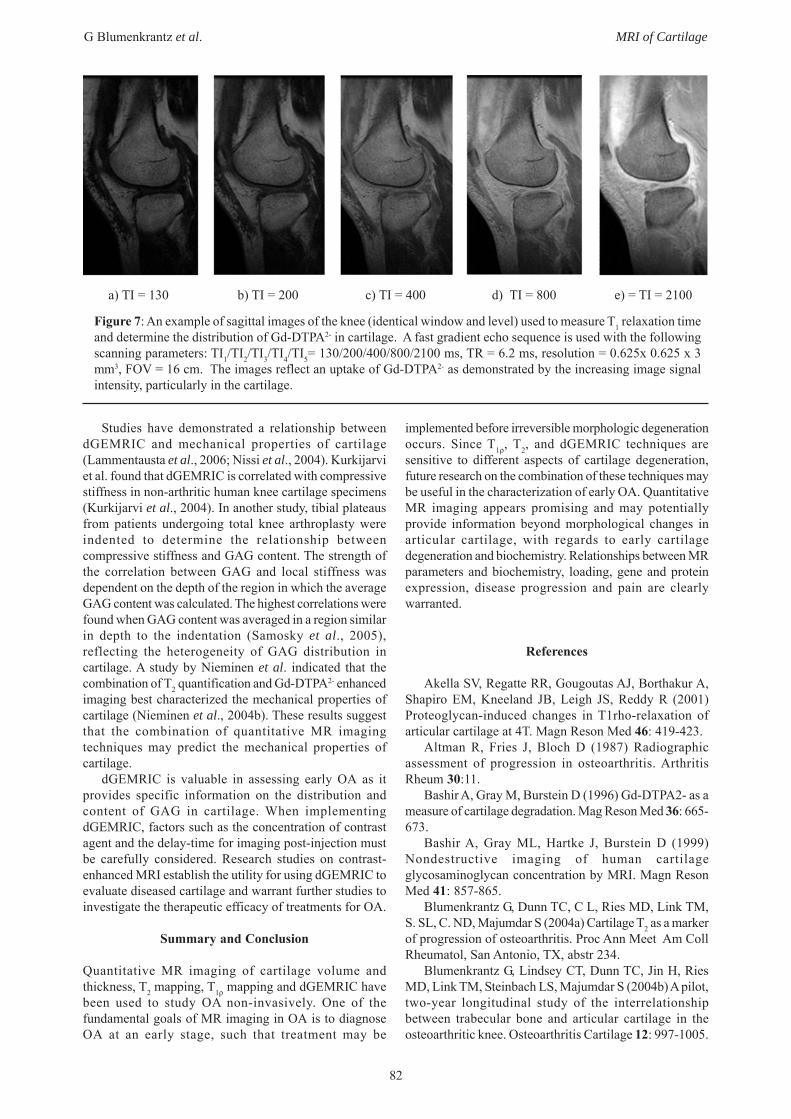
3D dGEMRIC sequences have been implemented at1.5 T and 3 T for use in clinical studies (McKenzie et al.,2006). Figure 7 illustrates sagittal images of the knee(identical window and level) that can be used to measureT1 relaxation time and determine the distribution of Gd-DTPA2- in cartilage. The sensitivity of dGEMRIC isaffected by various factors: For example, the amount ofcontrast agent absorbed in cartilage is dependent on thedose. A study by Burstein et al. showed that T1 in patellar
cartilage was 636 ± 70 ms after 1 dose and was 506 ± 38ms after a double-dose. Their study reported that that agreater dose provides increased sensitivity (Burstein et al.,2001). Body mass index (BMI) also affects contrastconcentration and must be carefully considered whendesigning cross-sectional studies (Tiderius et al., 2006).
dGEMRIC has been used to evaluate knee cartilage inOA patients (Williams et al., 2005). In OA, the dGEMRICindex is associated with joint space width, KellgrenLawrence (KL) grading scale and malalignment. Varusmalalignment is associated with a lower dGEMRIC indexon the medial side, while the opposite trend is evident invalgus malalignment (Williams et al., 2005). Knee cartilagein a given KL score has a wide-range of dGEMRIC values,demonstrating that dGEMRIC may provide additionalinformation to the radiographic classification of OA(Williams et al., 2005). Correlations between dGEMRICindex and pain, as measured by WOMAC, are evident inpatients with hip dysplasia (Kim et al., 2003). dGEMRICstudies have evaluated potential therapies in OA,demonstrated that moderate exercise can improve kneecartilage GAG (estimated by T1 in the presence of Gd-DTPA) in patients with high risk of OA (Roos andDahlberg, 2005). Gillis et al. reported that dGEMRIC canbe used to monitor GAG content in autologouschondrocyte transplantation (Gillis et al., 2001).
Figure 6: T1ρ maps (first row) and T2 maps (second row) for a healthy control (a), a patient with mild OA (b), and apatient with severe OA (c). a) Control: The average T1ρ value was 40.1 ± 11.4 ms and T2 value was 33.3 ± 10.5 msin cartilage. (b) A patient with early OA (male, 66). The average T1ρ value was 45.5 ± 14.5 ms and T2 value was 35.0± 10.9 ms in cartilage. (c) A patient with advanced OA (male, 46). The average T1ρ value was 55.4 ± 26.0 ms and T2value was 43.8 ± 11.1 ms in cartilage. The maps illustrate the differences between T1ρ and T2 (arrows) and demonstratedifferences in cartilage heterogeneity between OA severity and between T2 and T1ρ maps.
82
G Blumenkrantz et al. MRI of Cartilage
Studies have demonstrated a relationship betweendGEMRIC and mechanical properties of cartilage(Lammentausta et al., 2006; Nissi et al., 2004). Kurkijarviet al. found that dGEMRIC is correlated with compressivestiffness in non-arthritic human knee cartilage specimens(Kurkijarvi et al., 2004). In another study, tibial plateausfrom patients undergoing total knee arthroplasty wereindented to determine the relationship betweencompressive stiffness and GAG content. The strength ofthe correlation between GAG and local stiffness wasdependent on the depth of the region in which the averageGAG content was calculated. The highest correlations werefound when GAG content was averaged in a region similarin depth to the indentation (Samosky et al., 2005),reflecting the heterogeneity of GAG distribution incartilage. A study by Nieminen et al. indicated that thecombination of T2 quantification and Gd-DTPA2- enhancedimaging best characterized the mechanical properties ofcartilage (Nieminen et al., 2004b). These results suggestthat the combination of quantitative MR imagingtechniques may predict the mechanical properties ofcartilage.
dGEMRIC is valuable in assessing early OA as itprovides specific information on the distribution andcontent of GAG in cartilage. When implementingdGEMRIC, factors such as the concentration of contrastagent and the delay-time for imaging post-injection mustbe carefully considered. Research studies on contrast-enhanced MRI establish the utility for using dGEMRIC toevaluate diseased cartilage and warrant further studies toinvestigate the therapeutic efficacy of treatments for OA.
Summary and Conclusion
Quantitative MR imaging of cartilage volume andthickness, T2 mapping, T1ρ mapping and dGEMRIC havebeen used to study OA non-invasively. One of thefundamental goals of MR imaging in OA is to diagnoseOA at an early stage, such that treatment may be
implemented before irreversible morphologic degenerationoccurs. Since T1ρ, T2, and dGEMRIC techniques aresensitive to different aspects of cartilage degeneration,future research on the combination of these techniques maybe useful in the characterization of early OA. QuantitativeMR imaging appears promising and may potentiallyprovide information beyond morphological changes inarticular cartilage, with regards to early cartilagedegeneration and biochemistry. Relationships between MRparameters and biochemistry, loading, gene and proteinexpression, disease progression and pain are clearlywarranted.
References
Akella SV, Regatte RR, Gougoutas AJ, Borthakur A,Shapiro EM, Kneeland JB, Leigh JS, Reddy R (2001)Proteoglycan-induced changes in T1rho-relaxation ofarticular cartilage at 4T. Magn Reson Med 46: 419-423.
Altman R, Fries J, Bloch D (1987) Radiographicassessment of progression in osteoarthritis. ArthritisRheum 30:11.
Bashir A, Gray M, Burstein D (1996) Gd-DTPA2- as ameasure of cartilage degradation. Mag Reson Med 36: 665-673.
Bashir A, Gray ML, Hartke J, Burstein D (1999)Nondestructive imaging of human cartilageglycosaminoglycan concentration by MRI. Magn ResonMed 41: 857-865.
Blumenkrantz G, Dunn TC, C L, Ries MD, Link TM,S. SL, C. ND, Majumdar S (2004a) Cartilage T2 as a markerof progression of osteoarthritis. Proc Ann Meet Am CollRheumatol, San Antonio, TX, abstr 234.
Blumenkrantz G, Lindsey CT, Dunn TC, Jin H, RiesMD, Link TM, Steinbach LS, Majumdar S (2004b) A pilot,two-year longitudinal study of the interrelationshipbetween trabecular bone and articular cartilage in theosteoarthritic knee. Osteoarthritis Cartilage 12: 997-1005.
Figure 7: An example of sagittal images of the knee (identical window and level) used to measure T1 relaxation timeand determine the distribution of Gd-DTPA2- in cartilage. A fast gradient echo sequence is used with the followingscanning parameters: TI1/TI2/TI3/TI4/TI5= 130/200/400/800/2100 ms, TR = 6.2 ms, resolution = 0.625x 0.625 x 3mm3, FOV = 16 cm. The images reflect an uptake of Gd-DTPA2- as demonstrated by the increasing image signalintensity, particularly in the cartilage.
a) TI = 130 b) TI = 200 c) TI = 400 d) TI = 800 e) = TI = 2100
83
G Blumenkrantz et al. MRI of Cartilage
Blumenkrantz G, Dunn TC, Carballido-Gamio J, LinkTM, Majumdar S (2005) Spatial heterogeneity of cartilageT2 in osteoarthritic patients. In OARSI. Boston, MA
Bobinac D, Spanjol J, Zoricic S, Maric I (2003)Changes in articular cartilage and subchondral bonehistomorphometry in osteoarthritic knee joints in humans.Bone 32:284-290.
Boesen M, Jensen KE, Qvistgaard E, Danneskiold-Samsoe B, Thomsen C, Ostergaard M, Bliddal H (2006)Delayed gadolinium-enhanced magnetic resonanceimaging (dGEMRIC) of hip joint cartilage: better cartilagedelineation after intra-articular than intravenousgadolinium injection. Acta Radiol 47: 391-396.
Borthakur A, Shapiro EM, Beers J, Kudchodkar S,Kneeland JB, Reddy R (2000) Sensitivity of MRI toproteoglycan depletion in cartilage: comparison of sodiumand proton MRI. Osteoarthritis Cartilage 8: 288-293.
Broderick L, Turner D, Renfrew D, Schnitzer T, HuffJ, Harris C (1994) Severity of articular cartilageabnormality in patients with osteoarthritis: evaluation withfast spin-echo MR vs arthroscopy. AJR 162: 99-103.
Burstein D, Velyvis J, Scott KT, Stock KW, Kim YJ,Jaramillo D, Boutin RD, Gray ML (2001) Protocol issuesfor delayed Gd(DTPA)(2-)-enhanced MRI (dGEMRIC)for clinical evaluation of articular cartilage. Magn ResonMed 45: 36-41.
Chan W, Stevens M, Lang P, Sack K, Majumdar S,Stoller D, Genant H (1990) Structural changes ofosteoarthritis of the knee: radiography, CT, and MRimaging correlation. Radiology 177 (P): 183.
Cicuttini F, Wluka A, Wang Y, Stuckey S (2002) Thedeterminants of change in patella cartilage volume inosteoarthritic knees. J Rheumatol 29: 2615-2619.
Cicuttini F, Wluka A, Davis S, Strauss BJ, Yeung S,Ebeling PR (2004a) Association between knee cartilagevolume and bone mineral density in older adults withoutosteoarthritis. Rheumatology (Oxford) 43: 765-769.
Cicuttini F, Wluka A, Hankin J, Wang Y (2004b)Longitudinal study of the relationship between knee angleand tibiofemoral cartilage volume in subjects with kneeosteoarthritis. Rheumatology (Oxford) 43: 321-324.
Cicuttini F, Wluka A, Hankin J, Wang Y (2004c)Longitudinal study of the relationship between knee angleand tibiofemoral cartilage volume in subjects with kneeosteoarthritis. Rheumatology 43: 321-324.
Cicuttini FM, Wluka AE, Hankin J, Stuckey S (2004d)Comparison of patella cartilage volume and radiographyin the assessment of longitudinal joint change at thepatellofemoral joint. J Rheumatol 31: 1369-1372.
Cicuttini FM, Wluka AE, Wang Y, Stuckey SL (2004e)Longitudinal study of changes in tibial and femoralcartilage in knee osteoarthritis. Arthritis Rheum 50: 94-97.
Cohen ZA, McCarthy DM, Kwak SD, Legrand P,Fogarasi F, Ciaccio EJ, Ateshian GA (1999) Knee cartilagetopography, thickness, and contact areas from MRI: in-vitro calibration and in-vivo measurements. OsteoarthritisCartilage 7: 95-109.
Cunningham T, Jessel R, Zurakowski D, Millis MB,Kim YJ (2006) Delayed gadolinium-enhanced magneticresonance imaging of cartilage to predict early failure of
Bernese periacetabular osteotomy for hip dysplasia. J BoneJoint Surg Am 88: 1540-1548.
Daniel D, Stone M, Dobson B, Fithian D, Rossman D,Kaufman K (1994) Fate of the ACL-injured patient:aprospective outcome study. Am J Sports Med 22: 632-644.
Dardzinski BJ, Laor T, Schmithorst VJ, Klosterman L,Graham TB (2002) Mapping T2 relaxation time in thepediatric knee: feasibility with a clinical 1.5-T MR imagingsystem. Radiology 225: 233-239.
Dardzinski BJ, Mosher TJ, Li S, Van Slyke MA, SmithMB (1997) Spatial variation of T2 in human articularcartilage. Radiology 205: 546-550.
David-Vaudey E, Ghosh S, Ries M, Majumdar S (2004)T2 relaxation time measurements in osteoarthritis. MagnReson Imaging 22: 673-682.
Dijkgraaf LC, de Bont LG, Boering G, Liem RS (1995)The structure, biochemistry, and metabolism ofosteoarthritic cartilage: a review of the literature. J OralMaxillofac Surg 53: 1182-1192.
Ding C, Cicuttini F, Scott F, Cooley H, Jones G (2005)Knee structural alteration and BMI: a cross-sectional study.Obes Res 13: 350-361.
Dougados M, Gueguen A, Nguyen M, Thiesce A,Listrat V, Jacob L, Nakache JP,
Gabriel KR, Lequesne M, Amor B (1992) Longitudinalradiologic evaluation of osteoarthritis of the knee. JRheumatology 19: 378-383.
Dray N, Williams A, Prasad PV, Sharma L, Burstein D(2005) T2 in an OA population: Metrics for reporting data?Proc Ann Meeting Int Soc Magn Resonance Med(ISMRM) Miami, FL, abstr 1995.
Dunn TC, Lu Y, Jin H, Ries MD, Majumdar S (2004)T2 Relaxation time of cartilage at MR iImaging:comparison with severity of knee osteoarthritis. Radiology232: 592-598.
Duvvuri U, Reddy R, Patel SD, Kaufman JH, KneelandJB, Leigh JS (1997) T1rho-relaxation in articular cartilage:effects of enzymatic degradation. Magn Reson Med 38:863-867.
Eckstein F, Muller S, Faber SC, Englmeier KH, ReiserM, Putz R (2002a) Side differences of knee joint cartilagevolume, thickness, and surface area, and correlation withlower limb dominance – an MRI-based study.Osteoarthritis Cartilage 10: 914-921.
Eckstein F, Heudorfer L, Faber SC, Burgkart R,Englmeier KH, Reiser M (2002b) Long-term andresegmentation precision of quantitative cartilage MRimaging (qMRI). Osteoarthritis Cartilage 10: 922-928.
Eckstein F, Charles HC, Buck RJ, Kraus VB, RemmersAE, Hudelmaier M, Wirth W, Evelhoch JL (2005)Accuracy and precision of quantitative assessment ofcartilage morphology by magnetic resonance imaging at3.0T. Arthritis Rheum 52: 3132-3136.
Eckstein F, Cicuttini F, Raynauld JP, Waterton JC,Peterfy C (2006) Magnetic resonance imaging (MRI) ofarticular cartilage in knee osteoarthritis (OA):morphological assessment. Osteoarthritis Cartilage 14Suppl A: A46-75.
Fairbank T (1984) Knee joint changes aftermeniscectomy. Bone Joint Surg 30: 664-670.
84
G Blumenkrantz et al. MRI of Cartilage
Feagin J (1979) The syndrome of the torn anteriorcruciate ligament. Orthop Clin North Am 10: 81-90.
Felson DT, Chaisson CE, Hill CL, Totterman SM, GaleME, Skinner KM, Kazis L, Gale DR (2001) The associationof bone marrow lesions with pain in knee osteoarthritis.Ann Intern Med 134: 541-549.
Felson DT, McLaughlin S, Goggins J, LaValley MP,Gale ME, Totterman S, Li W, Hill C, Gale D (2003) Bonemarrow edema and its relation to progression of kneeosteoarthritis. Ann Intern Med 139: 330-336.
Felson DT, Zhang Y, Anthony JM, Naimark A,Anderson JJ (1992) Weight loss reduces the risk forsymptomatic knee osteoarthritis in women. TheFramingham study. Ann Intern Med 116: 535-539.
Forman M, Malamet R, Kaplan D (1983) A survey ofosteoarthritis of the knee in the elderly. J Rheumatol 10:282-287.
Gandy SJ, Dieppe PA, Keen MC, Maciewicz RA, WattI, Waterton JC (2002) No loss of cartilage volume overthree years in patients with knee osteoarthritis as assessedby magnetic resonance imaging. Osteoarthritis Cartilage10: 929-937.
Gillis A, Bashir A, McKeon B, Scheller A, Gray ML,Burstein D (2001) Magnetic resonance imaging of relativeglycosaminoglycan distribution in patients with autologouschondrocyte transplants. Invest Radiol 36: 743-748.
Goodwin DW, Dunn JF (1998) High-resolutionmagnetic resonance imaging of articular cartilage:correlation with histology and pathology. Top Magn ResonImaging 9: 337-347.
Goodwin DW, Wadghiri YZ, Dunn JF (1998) Micro-imaging of articular cartilage: T2, proton density, and themagic angle effect. Acad Radiol 5: 790-798.
Goodwin DW, Wadghiri YZ, Zhu H, Vinton CJ, SmithED, Dunn JF (2004) Macroscopic structure of articularcartilage of the tibial plateau: influence of a characteristicmatrix architecture on MRI appearance. AJR Am JRoentgenol 182: 311-318.
Hunter DJ, March L, Sambrook PN (2003) Theassociation of cartilage volume with knee pain.Osteoarthritis Cartilage 11: 725-729.
Hunter DJ, Zhang Y, Niu J, Goggins J, Amin S,LaValley MP, Guermazi A, Genant H, Gale D, Felson DT(2006a) Increase in bone marrow lesions associated withcartilage loss: a longitudinal magnetic resonance imagingstudy of knee osteoarthritis. Arthritis Rheum 54: 1529-1535.
Hunter DJ, Zhang Y, X. T, M L, Niu J, Amin S,Guermazi A, Genant H, Gale D, Felson DT (2006b)Change in Joint Space Width: Hylaine Articular CartilageLoss or Alteration in Meniscus. Arthritis Rheum 54: 2488-2495.
Kellgren J, Lawrence J (1957) Radiologic assessmentof osteoarthritis. Ann Rheum Dis 16: 494-502.
Kim YJ, Jaramillo D, Millis MB, Gray ML, BursteinD (2003) Assessment of early osteoarthritis in hip dysplasiawith delayed gadolinium-enhanced magnetic resonanceimaging of cartilage. J Bone Joint Surg Am 85-A: 1987-1992.
Kimelman T, Vu A, Storey P, McKenzie C, BursteinD, Prasad P (2006) Three-dimensional T1 mapping for
dGEMRIC at 3.0 T using the Look Locker method. InvestRadiol 41: 198-203.
Kohatsu N, Schurman D (1990) Risk factors for thedevelopment of osteoarthrosis of the knee. Clin Orthop261: 242-246.
Konig H, Sauter R, Delmling M, Vogt M (1987)Cartilage disorders: a comparison of spin-echo, CHESS,and FLASH sequence MR images. Radiology 164: 753-758.
Kshirsagar AA, Watson PJ, Tyler JA, Hall LD (1998)Measurement of localized cartilage volume and thicknessof human knee joints by computer analysis of three-dimensional magnetic resonance images. Invest Radiol 33:89-299.
Kurkijarvi JE, Nissi MJ, Kiviranta I, Jurvelin JS,Nieminen MT (2004) Delayed gadolinium-enhanced MRIof cartilage (dGEMRIC) and T2 characteristics of humanknee articular cartilage: topographical variation andrelationships to mechanical properties. Magn Reson Med52: 41-46.
Lammentausta E, Kiviranta P, Nissi MJ, Laasanen MS,Kiviranta I, Nieminen MT, Jurvelin JS (2006) T2 relaxationtime and delayed gadolinium-enhanced MRI of cartilage(dGEMRIC) of human patellar cartilage at 1.5 T and 9.4T: Relationships with tissue mechanical properties. JOrthop Res 24: 366-374.
Lehner K, Rechl H, Gmeinwieser J, Heuck A, LukasH, Kohl H (1989) Structure, function, degeneration ofbovine hyaline cartilage: assessment with MR imaging invitro. Radiology 170: 495-499.
Li X, Han ET, Crane JC, Link TM, Ma B, BlumenkrantzG, Keshari K, Newitt DC, Majumdar S (2005a)Development of in vivo multi-slice spiral T 1r mapping incartilage at 3T and its application to osteroarthritis. ProcAnn Meeting Int Soc Magn Resonance Med (ISMRM)Miami, FL, abstr 479
Li X, Han ET, Ma CB, Link TM, Newitt DC, MajumdarS (2005b) In vivo 3T spiral imaging based multi-slice T1 ˜mapping of knee cartilage in osteoarthritis. Mag Res Med:54: 29-96.
Li X, Lozano J, Ma CB, Bauer JS, Link TM, MajumdarS (2006) Quantitative assessment of bone marrow edemaand the overlying cartilage in OA and ACL injuries usingMR imaging and spectroscopic imaging at 3T. Proc AnnMeeting Int Soc Magn Resonance Med (ISMRM), Seattle,WA, abstr 60.
Lindberg H, Montgomery F (1987) Heavy labour andthe occurrence of gonarthrosis. Clin Orthop 214: 235-236.
Lindsey CT, Narasimhan A, Adolfo JM, Jin H,Steinbach LS, Link T, Ries M, Majumdar S (2004)Magnetic resonance evaluation of the interrelationshipbetween articular cartilage and trabecular bone of theosteoarthritic knee. Osteoarthritis Cartilage 12: 86-96.
Link TM, Steinbach LS, Ghosh S, Ries M, Lu Y, LaneN, Majumdar S (2003) Osteoarthritis: MR imagingfindings in different stages of disease and correlation withclinical findings. Radiology 226: 373-381.
Losch A, Eckstein F, Haubner M, Englmeier KH (1997)A non-invasive technique for 3-dimensional assessmentof articular cartilage thickness based on MRI. Part 1:
85
G Blumenkrantz et al. MRI of Cartilage
Development of a computational method. Magn ResonImaging 15: 795-804.
Lynch M, Henning C, Glick K (1983) Knee jointsurface changes: long-term follow-up meniscus teartreatment in stable anterior cruciate ligamentreconstructions. Clin Orthop Rel Res 172: 148-153.
Manninen P, Riihimaki H, Heliovaara M, SuomalainenO (2004) Weight changes and the risk of knee osteoarthritisrequiring arthroplasty. Ann Rheum Dis 63: 1434-1437.
Majumdar S, Li X, Blumenkrantz G, Saldanha K, MaCB, Kim H, Lozano J, Link T. (2006) MR imaging andearly cartilage degeneration and strategies for monitoringregeneration. J Musculoskelet Neuronal Interact 6: 382-384.
McKenzie CA, Williams A, Prasad PV, Burstein D(2006) Three-dimensional delayed gadolinium-enhancedMRI of cartilage (dGEMRIC) at 1.5T and 3.0T. J MagnReson Imaging 24: 928-933.
Menezes NM, Gray ML, Hartke JR, Burstein D (2004)T2 and T1rho MRI in articular cartilage systems. MagnReson Med 51: 503-509.
Mlynarik V, Szomolanyi P, Toffanin R, Vittur F, TrattnigS (2004) Transverse relaxation mechanisms in articularcartilage. J Magn Reson 169: 300-307.
Mlynarik V, Trattnig S, Huber M, Zembsch A, ImhofH (1999) The role of relaxation times in monitoringproteoglycan depletion in articular cartilage. J Magn ResonImaging 10: 497-502.
Mosher TJ, Dardzinski BJ, Smith MB (2000) Humanarticular cartilage: influence of aging and earlysymptomatic degeneration on the spatial variation of T2 –preliminary findings at 3 T. Radiology 214: 259-266.
Mosher TJ, Smith H, Dardzinski BJ, Schmithorst VJ,Smith MB (2001) MR imaging and T2 mapping of femoralcartilage: in vivo determination of the magic angle effect.AJR Am J Roentgenol 177: 665-669.
Mosher TJ, Collins CM, Smith HE, Moser LE,Sivarajah RT, Dardzinski BJ, Smith MB (2004) Effect ofgender on in vivo cartilage magnetic resonance imagingT2 mapping. J Magn Reson Imaging 19: 323-328.
Mosher TJ, Smith HE, Collins C, Liu Y, Hancy J,Dardzinski BJ, Smith MB (2005) Change in knee cartilageT2 at MR imaging after running: a feasibility study.Radiology 234: 245-249.
Nieminen MT, Menezes NM, Williams A, Burstein D(2004a) T2 of articular cartilage in the presence of Gd-DTPA2. Magn Reson Med 51: 1147-1152.
Nieminen MT, Toyras J, Laasanen MS, SilvennoinenJ, Helminen HJ, Jurvelin JS (2004b) Prediction ofbiomechanical properties of articular cartilage withquantitative magnetic resonance imaging. J Biomech 37:321-328.
Nissi MJ, Toyras J, Laasanen MS, Rieppo J, SaarakkalaS, Lappalainen R, Jurvelin JS, Nieminen MT (2004)Proteoglycan and collagen sensitive MRI evaluation ofnormal and degenerated articular cartilage. J Orthop Res22: 557-564.
Peterfy CG (2002) Imaging of the disease process. CurrOpin Rheumatol 14: 590-596.
Peterfy CG, van Dijke CF, Janzen DL, Gluer CC,Namba R, Majumdar S, Lang P, Genant HK (1994)
Quantification of articular cartilage in the knee with pulsedsaturation transfer subtraction and fat-suppressed MRimaging: optimization and validation. Radiology 192: 485-491.
Peyron JG (1984) The epidemiology of osteoathritis.In Moskowitz R, ed. Osteoarthritis Diagnosis andManagement. W. B. Saunders, Philadelphia, pp. 9-27.
Raynauld JP, Kauffmann C, Beaudoin G, BerthiaumeMJ, de Guise JA, Bloch DA, Camacho F, Godbout B,Altman RD, Hochberg M, Meyer JM, Cline G, PelletierJP, Martel-Pelletier J (2003) Reliability of a quantificationimaging system using magnetic resonance images tomeasure cartilage thickness and volume in human normaland osteoarthritic knees. Osteoarthritis Cartilage 11: 351-360.
Raynauld JP, Martel-Pelletier J, Berthiaume MJ,Labonte F, Beaudoin G, de Guise JA, Bloch DA, ChoquetteD, Haraoui B, Altman RD, Hochberg MC, Meyer JM, ClineGA, Pelletier JP (2004) Quantitative magnetic resonanceimaging evaluation of knee osteoarthritis progression overtwo years and correlation with clinical symptoms andradiologic changes. Arthritis Rheum 50: 476-487.
Raynauld JP, Martel-Pelletier J, Berthiaume MJ,Beaudoin G, Choquette D, Haraoui B, Tannenbaum H,Meyer JM, Beary JF, Cline GA, Pelletier JP (2006) Longterm evaluation of disease progression through thequantitative magnetic resonance imaging of symptomaticknee osteoarthritis patients: correlation with clinicalsymptoms and radiographic changes. Arthritis Res Ther8: R21.
Recht M, Kramer J, Marcelis S, Pathria M, Trudell D,Haghighl P, Battens D, Resnick D (1993) Abnormalitiesof articular cartilage in the knee: analysis of available MRtechniques. Radiology 187: 473-478.
Regatte RR, Akella SV, Borthakur A, Kneeland JB,Reddy R (2002) Proteoglycan depletion-induced changesin transverse relaxation maps of cartilage: comparison ofT2 and T1rho. Acad Radiol 9: 1388-1394.
Regatte RR, Akella SV, Borthakur A, Kneeland JB,Reddy R (2003) In vivo proton MR three-dimensionalT1rho mapping of human articular cartilage: initialexperience. Radiology 229: 269-274.
Regatte RR, Akella SV, Wheaton AJ, Lech G, BorthakurA, Kneeland JB, Reddy R (2004) 3D-T1rho-relaxationmapping of articular cartilage: in vivo assessment of earlydegenerative changes in symptomatic osteoarthriticsubjects. Acad Radiol 11: 741-749.
Regatte RR, Akella SV, Lonner JH, Kneeland JB,Reddy R (2006) T1rho relaxation mapping in humanosteoarthritis (OA) cartilage: comparison of T1rho withT2. J Magn Reson Imaging 23: 547-553.
Rogers J, Watt, Dieppe P (1990) A comparison of thevisual and radiographic detection of bony changes at theknee joint. BMJ 300: 367-368.
Roos EM, Dahlberg L (2005) Positive effects ofmoderate exercise on glycosaminoglycan content in kneecartilage: a four-month, randomized, controlled trial inpatients at risk of osteoarthritis. Arthritis Rheum 52: 3507-3514.
Samosky JT, Burstein D, Eric Grimson W, Howe R,Martin S, Gray ML (2005) Spatially-localized correlation
86
G Blumenkrantz et al. MRI of Cartilage
of dGEMRIC-measured GAG distribution and mechanicalstiffness in the human tibial plateau. J Orthop Res 23: 93-101.
Schouten J, van den Ouweland F, Valkenberg H (1992)A 12 year follow up of osteoarthritis of the knee in thegeneral population on prognostic factors of cartilage lossinosteoarthritis of the knee. Ann Rheum Dis 51: 932-937.
Sharma L (2001a) Local factors in osteoarthritis. CurrOpin Rheumatol 13: 441-446.
Sharma L, Song J, Felson DT, Cahue S, Shamiyeh E,Dunlop DD (2001b) The role of knee alignment in diseaseprogression and functional decline in knee osteoarthritis.Jama 286: 188-195.
Sittek H, Eckstein F, Gavazzeni A, Milz S, Kiefer B,Schulte E, Reiser M (1996) Assessment of normal patellarcartilage volume and thickness using MRI: an analysis ofcurrently available pulse sequences. Skeletal Radiol 25:55-62.
Smith HE, Mosher TJ, Dardzinski BJ, Collins BG,Collins CM, Yang QX, Schmithorst VJ, Smith MB (2001)Spatial variation in cartilage T2 of the knee. J Magn ResonImaging 14: 50-55.
Solloway S, Hutchinson CE, Waterton JC, Taylor CJ(1997) The use of active shape models for makingthickness measurements of articular cartilage from MRimages. Magn Reson Med 37: 943-952.
Spector TD, Dacre JE, Harris PA, Huskisson EC (1992)Radiological progression of osteoarthritis: an 11 yearfollow up study of the knee. Ann of Rheum Dis 51: 1107-1110.
Stammberger T, Eckstein F, Englmeier KH, Reiser M(1999) Determination of 3D cartilage thickness data fromMR imaging: computational method and reproducibilityin the living. Magn Reson Med 41: 529-536.
Tiderius CJ, Olsson LE, Leander P, Ekberg O, DahlbergL (2003) Delayed gadolinium-enhanced MRI of cartilage(dGEMRIC) in early knee osteoarthritis. Magn Reson Med49: 488-492.
Tiderius CJ, Tjornstrand J, Akeson P, Sodersten K,Dahlberg L, Leander P (2004) Delayed gadolinium-enhanced MRI of cartilage (dGEMRIC): intra- andinterobserver variability in standardized drawing of regionsof interest. Acta Radiol 45: 628-634.
Tiderius C, Hori M, Williams A, Sharma L, Prasad PV,Finnell M, McKenzie C, Burstein D (2006) dGEMRIC asa function of BMI. Osteoarthritis Cartilage 14: 1091-1097.
Toffanin R, Mlynarik V, Russo S, Szomolanyi P, PirasA, Vittur F (2001) Proteoglycan depletion and magneticresonance parameters of articular cartilage. Arch BiochemBiophys 390: 235-242.
Torres L, Dunlop DD, Peterfy C, Guermazi A, PrasadP, Hayes KW, Song J, Cahue S, Chang A, Marshall M,Sharma L (2006) The relationship between specific tissue
lesions and pain severity in persons with kneeosteoarthritis. Osteoarthritis Cartilage 14: 1033-1040.
Watrin-Pinzano A, Ruaud JP, Cheli Y, Gonord P,Grossin L, Bettembourg-Brault I, Gillet P, Payan E, GuillotG, Netter P, Loeuille D (2004a) Evaluation of cartilagerepair tissue after biomaterial implantation in rat patellaby using T2 mapping. Magma 17: 219-228.
Watrin-Pinzano A, Ruaud JP, Cheli Y, Gonord P,Grossin L, Gillet P, Blum A, Payan E, Olivier P, Guillot G,Netter P, Loeuille D (2004b) T2 mapping: an efficient MRquantitative technique to evaluate spontaneous cartilagerepair in rat patella. Osteoarthritis Cartilage 12: 191-200.
Watrin-Pinzano A, Ruaud JP, Olivier P, Grossin L,Gonord P, Blum A, Netter P, Guillot G, Gillet P, LoeuilleD (2005) Effect of proteoglycan depletion on T2 mappingin rat patellar cartilage. Radiology 234: 162-170.
Wheaton AJ, Casey FL, Gougoutas AJ, Dodge GR,Borthakur A, Lonner JH, Schumacher HR, Reddy R (2004)Correlation of T1rho with fixed charge density in cartilage.J Magn Reson Imaging 20: 519-525.
Wheaton AJ, Dodge GR, Elliott DM, Nicoll SB, ReddyR (2005) Quantification of cartilage biomechanical andbiochemical properties via T1rho magnetic resonanceimaging. Magn Reson Med 54:1087-1093.
Williams A, Gillis A, McKenzie C, Po B, Sharma L,Micheli L, McKeon B, Burstein D (2004) Glycos-aminoglycan distribution in cartilage as determined bydelayed gadolinium-enhanced MRI of cartilage(dGEMRIC): potential clinical applications. AJR Am JRoentgenol 182: 167-172.
Williams A, Sharma L, McKenzie CA, Prasad PV,Burstein D (2005) Delayed gadolinium-enhanced magneticresonance imaging of cartilage in knee osteoarthritis:findings at different radiographic stages of disease andrelationship to malalignment. Arthritis Rheum 52: 3528-3535.
Wluka AE, Stuckey S, Snaddon J, Cicuttini FM (2002)The determinants of change in tibial cartilage volume inosteoarthritic knees. Arthritis Rheum 46: 2065-2072.
Wluka AE, Wolfe R, Stuckey S, Cicuttini FM (2004)How does tibial cartilage volume relate to symptoms insubjects with knee osteoarthritis? Ann Rheum Dis 63: 264-268.
Wright V (1990) Post-traumatic osteoarthritis - Amedicolegal minefield. Br J Rheum 29: 474-478.
Xia Y (1998) Relaxation anisotropy in cartilage byNMR microscopy (muMRI) at 14-microm resolution.Magn Reson Med 39: 941-949.
Xia Y, Farquhar T, Burton-Wurster N, Ray E, JelinskiLW (1994) Diffusion and relaxation mapping of cartilage-bone plugs and excised disks using microscopic magneticresonance imaging. Magn Reson Med 31: 273-282.