Embed Size (px)
Citation preview
CONTENTS
Page
Unit 1: South Africa’s Children 3
Unit 2: Finance and Growth 39
Unit 3: Prisons in South Africa 59
About these materials
These activities and exercises are most appropriate for Humanities and Law students, but the
contexts used should be of interest to any citizen. The mathematical content covered does
not include data analysis, statistics and probability. Understanding these topics is essential
for quantitative literacy, but are not included here. Thus these materials do not provide the
basis of a complete quantitative literacy course, but cover the work of approximately one
semester in a first year programme.
Quantitative Literacy exercises for
University students in South Africa
Pam Lloyd, Vera Frith, Jacob Jaftha, Sheena Rughubar-Reddy, Kate Le Roux,
Numeracy Centre, Academic Development Programme , University of Cape Town.
Originally developed in 2009, subsequently revised.

2
The design of these materials is underpinned by the following theoretical considerations:
There are many different definitions of quantitative literacy (or numeracy) in the literature which emphasise
various aspects of this complex concept, but the core of all of them is the idea that quantitative literacy is
concerned mainly with mathematics and statistics used in context. We use the following definition, which is
most strongly influenced by the definition of numerate behaviour underlying the assessment of numeracy in
the Adult Literacy and Lifeskills (ALL) Survey (Gal et al. 2005) and the view of academic literacy and
numeracy as social practice (e.g. Street 2005, Kelly, Johnston and Baynham 2007):
Quantitative literacy (numeracy) is the ability to manage situations or solve problems in practice, and
involves responding to quantitative (mathematical and statistical) information that may be presented
verbally, graphically, in tabular or symbolic form; it requires the activation of a range of enabling
knowledge, behaviours and processes and it can be observed when it is expressed in the form of a
communication, in written, oral or visual mode (Frith and Prince 2006, 30).
The view of quantitative literacy as practice as a component of an academic Discourse, in which language is
necessarily an integral part, leads to the conclusion that quantitative literacy and language are inextricably
linked. The language used for expressing quantitative concepts and reasoning often uses precise terminology
and forms of expression. It also frequently uses everyday words with very specific meanings (consider, for
example, the word ‘rate’ in the phrase ‘crime rate’ or the word ‘relative’ in the phrase ‘relative sizes’). In order
to be numerate within a particular discipline, a student will have to interpret or use this kind of expression
within the language of the particular disciplinary Discourse.
In our definition, the statement ‘it requires the activation of a range of enabling knowledge, behaviours
and processes’ refers to the full range of competencies necessary for quantitative literacy practice, including
number sense, mathematical abilities, logical thinking and quantitative reasoning in context. Our definition
also emphasises that responding appropriately to quantitative information in a text and communicating
quantitative ideas and reasoning are both essential components of quantitative literacy.
References: Frith, V. and R. N. Prince. 2006. Quantitative literacy. In Access and entry-level benchmarks: The National
Benchmark Tests Project, ed. H. Griesel, 28–34. Pretoria: Higher Education South Africa.
http://www.universitiessa.ac.za/sites/www.universitiessa.ac.za/files/2006_HESA_Access%20and%20E
ntry%20Level%20Benchmarks_0.pdf (accessed 9 October 2015).
Gal, I., M. van Groenestijn, M. Manly, M. J. Schmitt and D. Tout. 2005. Adult numeracy and its assessment in the
ALL Survey: A conceptual framework and pilot results. In Measuring adult literacy and life skills: New
frameworks for assessment, eds. T. Scott Murray, Y. Clermont and M. Binkley, 137–191. Ottawa: Statistics
Canada. http://www.statcan.gc.ca/pub/89-552-m/89-552-m2005013-eng.pdf (accessed 22 July 2015).
Kelly, S., B. Johnston and M. Baynham. 2007. The concept of numeracy as social practice. In The adult numeracy
handbook: Reframing adult numeracy in Australia, eds. S. Kelly, B. Johnston and K. Yasukawa, 35–49. Sydney:
Adult Literacy and Numeracy Australian Research Consortium.
Street, B. 2005. Applying new literacy studies to numeracy as social practice. In Urban literacy: Communication,
identity and learning in development contexts, ed. A. Rogers, 87–96. Hamburg: UNESCO Institute for
Education.
3
Unit 1: South Africa’s Children
Here is a list of the mathematical content that you will encounter in this unit.
Mathematical content Representation of large numbers
Relative sizes of numbers and quantities
Fractions and proportion
Percentages: absolute number vs. percentage, calculating a percentage, calculating the whole given
the percentage
Change: absolute change, percentage change, change in percentage points, rate of change,
compound growth
Interest, interest rates, inflation
Use of language: “at most”, “at least”
Average
Probability
Different graphical representations of data (tables, pie charts, time series)

4
Glossary of some terms used in this unit that you may find helpful:
Cognitive – to do with thinking and reasoning ability
Commission (v) – to instruct that a report or study be done
Draft – preliminary version of a document
Equitable – fair or just
Excerpt – part of a document
Human resources capacity – people having enough training and power in their jobs in
order to get the work done
Impairment -- damage
Implement – put into practice
Infrastructure – the physical structures (and jobs) that need to be set up to enable a
project to go ahead
Early intervention services – services and actions that, if performed at an early stage,
will help to prevent problems later on
Monitor (v) – to keep a record of progress made
Mortality rate – death rate
Narrative – description of facts and progress made
Respondent – person who answers a question/survey
Scenario – an imagined set of events
Social deprivation – the lackof the most basic facilities that are required in order for people to
live a decent life
Stunting – potential growth that is held back
Treasury – the department that looks after the country’s money
Wasting – to wither or become weak

5
Children’s Rights in South Africa
In this unit you will be reading about the Children’s Act which came into law on 1st April 2010 and you will
also be considering the financial implications of implementing this Act. So, in reading the context of the
Children’s Act look out also for quantitative content.
The Children’s Institute at the University of Cape Town conducts research about children in South Africa.
This research can assist policy-makers and practitioners to create policies, programmes and institutions that
support the interests of the children (see www.ci.org.za). Most of the texts used in this part of the course come
from the annual publication of the Institute, called the Child Gauge.
Activity 1: Setting the scene
By way of introduction to the Children’s Act, read the following excerpt from UCT’s Monday Paper, March
31 – April 13, 2008. The focus here will be the context, but you will come across the following quantitative
content: large numbers and scientific notation, fractions, multiples, the idea of inflation and percentage
increase, compound interest, and graphical representation of data.
Child Gauge spotlights new Children’s Act
The new Child Gauge report reflects on how well children have – or have not – enjoyed
access to social services promised by the Constitution
The South African Child Gauge 2007/2008, launched this week by UCT’s Children’s
Institute, celebrates the new Children’s Act, which gives children a constitutional right to
social services.
The Gauge includes an overview of the current situation, and describes how the new act
offers hope to resolve the current crisis in providing social services to children. Historical
inequalities in investments in infrastructure have contributed to poor quality services and
persistent backlogs in disadvantaged areas, leaving many children and their families with
no support. With the Children’s Act, which will most likely come into force next year, the
government has made a new commitment to fulfil children’s right to social services.
Until now, children’s constitutional right to social services has been a neglected and
misunderstood right. The Children’s Act provides for a new focus on prevention and early
intervention services, which will reduce the large number of children in need of costly
state protection and alternative care in the long term.
But there are challenges ahead. The Constitution places an obligation on the state to
give effect to these rights. To meet its obligation, the state must allocate adequate funds
to fulfil these rights.
Funding the services required to fulfil children’s rights
Now read this adapted extract from an article contained in The Child Gauge 2007/2008.
Budget allocations for implementing the Children’s Act
Debbie Budlender (Centre for Actuarial Research, University of Cape Town), Paula Proudlock and Jo Monson
(Children’s Institute)
Section 7(2) of the Bill of Rights in the South African Constitution places an obligation on the
State to enable children to enjoy all the rights in the Bill of Rights. This includes children’s
rights to family care or alternative care, social services, and protection from abuse and
neglect. To meet its obligation the State must allocate adequate budgets so that the
required conditions and services to fulfil these rights are available.
6
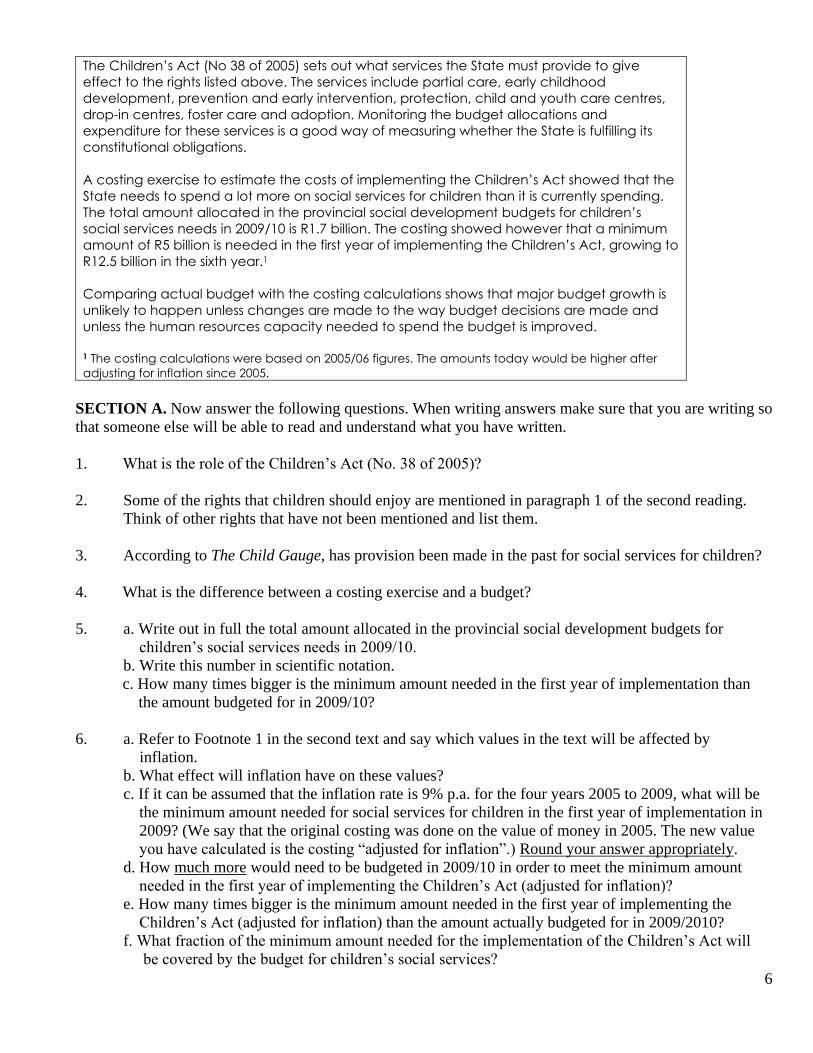
The Children’s Act (No 38 of 2005) sets out what services the State must provide to give
effect to the rights listed above. The services include partial care, early childhood
development, prevention and early intervention, protection, child and youth care centres,
drop-in centres, foster care and adoption. Monitoring the budget allocations and
expenditure for these services is a good way of measuring whether the State is fulfilling its
constitutional obligations.
A costing exercise to estimate the costs of implementing the Children’s Act showed that the
State needs to spend a lot more on social services for children than it is currently spending.
The total amount allocated in the provincial social development budgets for children’s
social services needs in 2009/10 is R1.7 billion. The costing showed however that a minimum
amount of R5 billion is needed in the first year of implementing the Children’s Act, growing to
R12.5 billion in the sixth year.1
Comparing actual budget with the costing calculations shows that major budget growth is
unlikely to happen unless changes are made to the way budget decisions are made and
unless the human resources capacity needed to spend the budget is improved.
1 The costing calculations were based on 2005/06 figures. The amounts today would be higher after
adjusting for inflation since 2005.
SECTION A. Now answer the following questions. When writing answers make sure that you are writing so
that someone else will be able to read and understand what you have written.
1. What is the role of the Children’s Act (No. 38 of 2005)?
2. Some of the rights that children should enjoy are mentioned in paragraph 1 of the second reading.
Think of other rights that have not been mentioned and list them.
3. According to The Child Gauge, has provision been made in the past for social services for children?
4. What is the difference between a costing exercise and a budget?
5. a. Write out in full the total amount allocated in the provincial social development budgets for
children’s social services needs in 2009/10.
b. Write this number in scientific notation.
c. How many times bigger is the minimum amount needed in the first year of implementation than
the amount budgeted for in 2009/10?
6. a. Refer to Footnote 1 in the second text and say which values in the text will be affected by
inflation.
b. What effect will inflation have on these values?
c. If it can be assumed that the inflation rate is 9% p.a. for the four years 2005 to 2009, what will be
the minimum amount needed for social services for children in the first year of implementation in
2009? (We say that the original costing was done on the value of money in 2005. The new value
you have calculated is the costing “adjusted for inflation”.) Round your answer appropriately.
d. How much more would need to be budgeted in 2009/10 in order to meet the minimum amount
needed in the first year of implementing the Children’s Act (adjusted for inflation)?
e. How many times bigger is the minimum amount needed in the first year of implementing the
Children’s Act (adjusted for inflation) than the amount actually budgeted for in 2009/2010?
f. What fraction of the minimum amount needed for the implementation of the Children’s Act will
be covered by the budget for children’s social services?

7
g. What percent of the minimum amount needed for the implementation of the Children’s Act will be
covered by the budget for children’s social services?
______________________________________________________________________________
Continue reading about budget allocations for implementing the Children’s Act:
How are budgets for social services determined?
National government allocates money to provinces according to a formula. Provinces get
95% of their money from national government as a lump sum. This is to be used to provide a
range of services including education, health, housing and social services. Each provincial
treasury decides how this lump sum will be divided between their government departments.
National Treasury does not include social services in the formula In 2007/08, National Treasury used a formula with six components to determine how much to
allocate to the provincial sphere in total, and to each province:
education (making up 51% of the total )
health (26%)
basic (14%)
poverty (3%)
economic (1%) and
institutional (5%)
There is no explicit component for social services in the formula despite the fact that
provinces are responsible for implementing the Child Care Act (No 74 of 1983)1 as well as
other welfare legislation for other vulnerable groups.
What does the Children’s Act say about budget allocations?
All government spheres and departments must prioritise the implementation of the Act.
Section 4(2) of the Children’s Act states that all spheres and departments of government
“must take reasonable measures to the maximum extent of their available resources to
achieve the realisation of the objects of this Act”.
This means that the National Treasury and the provinces need to prioritise the
implementation of the Act when they are making decisions about budgets and the
allocation of resources.
1 The Children’s Act replaces the original Child Care Act.
SECTION B. Answer the following questions:
1. What difficulties does the article highlight in terms of the current system of allocating funding for
social services for children?
2. Refer to the bullet “health (26%)”. Write a sentence in which you describe in full, using the context,
the meaning of the value 26. Begin your sentence in this way: “26% of …”
3. Draw a rough sketch to show how the 2007/08 National Treasury formula might best be represented
graphically. Choose the most appropriate representation (if necessary, refer to the different types of
charts on page 47 of the Yellow Pages).
8
RECAP (after Activity 1)
Activity 1 addresses the following quantitative literacy content. Make sure that you know what is
meant by these descriptions before moving on – ask your lecturer if you have difficulty identifying
the content in the Activity.
Maths content
Large numbers
representing large numbers in full and using scientific notation
rounding to the nearest million, billion, hundred thousand etc.
Comparing the size of numbers
dividing (how many times bigger) and subtracting (how much more) (and descriptive terms
like “more than”, “almost”)
expressing one quantity as a percentage/proportion of another
Percentages
expressing one quantity as a percentage of another
increasing/decreasing by a percentage using a growth factor (including inflation)
Literacies
Reading texts containing quantitative information
The relationship between the maths content and the context of the Children’s Act: how can the numbers
help us to understand the challenges of implementing the Act?
Working with different representations
selecting an appropriate chart (pie chart vs. bar chart)
9
Activity 1: Practice Exercises
Questions 1 to 4 revisit some of the maths content in Activity 1 – use these questions if you feel that you
need additional practice.
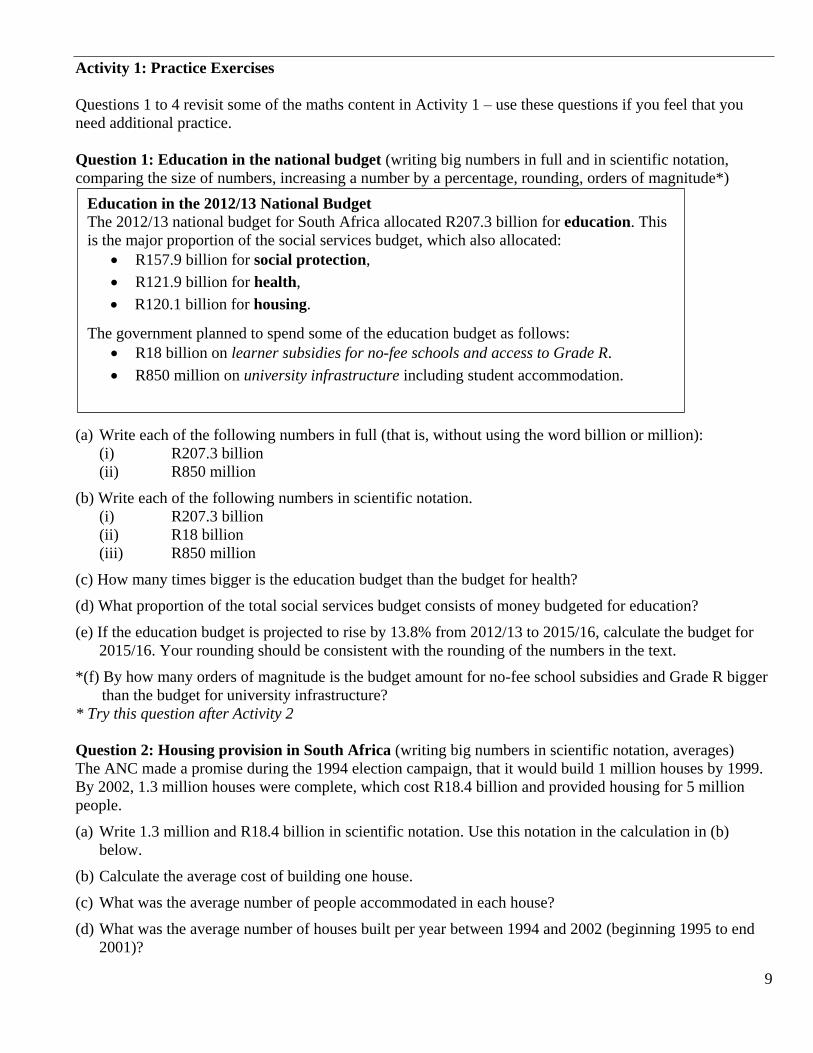
Question 1: Education in the national budget (writing big numbers in full and in scientific notation,
comparing the size of numbers, increasing a number by a percentage, rounding, orders of magnitude*)
(a) Write each of the following numbers in full (that is, without using the word billion or million):
(i) R207.3 billion
(ii) R850 million
(b) Write each of the following numbers in scientific notation.
(i) R207.3 billion
(ii) R18 billion
(iii) R850 million
(c) How many times bigger is the education budget than the budget for health?
(d) What proportion of the total social services budget consists of money budgeted for education?
(e) If the education budget is projected to rise by 13.8% from 2012/13 to 2015/16, calculate the budget for
2015/16. Your rounding should be consistent with the rounding of the numbers in the text.
*(f) By how many orders of magnitude is the budget amount for no-fee school subsidies and Grade R bigger
than the budget for university infrastructure?
* Try this question after Activity 2
Question 2: Housing provision in South Africa (writing big numbers in scientific notation, averages)
The ANC made a promise during the 1994 election campaign, that it would build 1 million houses by 1999.
By 2002, 1.3 million houses were complete, which cost R18.4 billion and provided housing for 5 million
people.
(a) Write 1.3 million and R18.4 billion in scientific notation. Use this notation in the calculation in (b)
below.
(b) Calculate the average cost of building one house.
(c) What was the average number of people accommodated in each house?
(d) What was the average number of houses built per year between 1994 and 2002 (beginning 1995 to end
2001)?
Education in the 2012/13 National Budget
The 2012/13 national budget for South Africa allocated R207.3 billion for education. This
is the major proportion of the social services budget, which also allocated:
R157.9 billion for social protection,
R121.9 billion for health,
R120.1 billion for housing.
The government planned to spend some of the education budget as follows:
R18 billion on learner subsidies for no-fee schools and access to Grade R.
R850 million on university infrastructure including student accommodation.
10
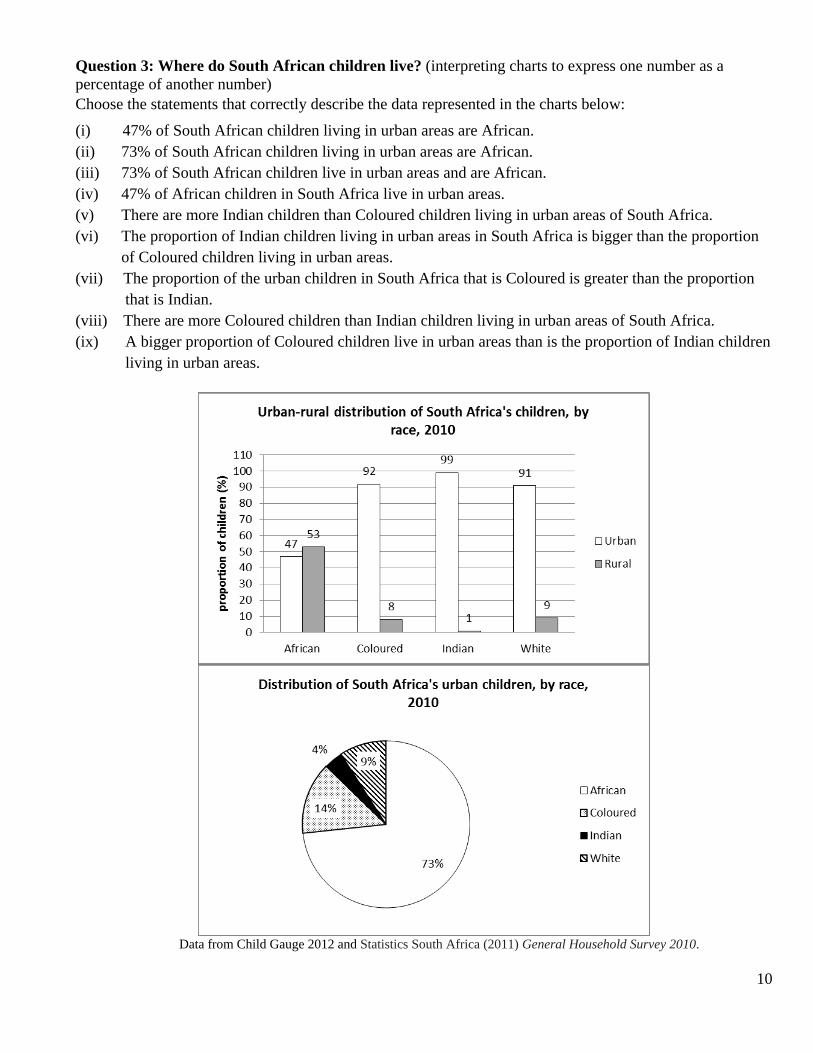
Question 3: Where do South African children live? (interpreting charts to express one number as a
percentage of another number)
Choose the statements that correctly describe the data represented in the charts below:
(i) 47% of South African children living in urban areas are African.
(ii) 73% of South African children living in urban areas are African.
(iii) 73% of South African children live in urban areas and are African.
(iv) 47% of African children in South Africa live in urban areas.
(v) There are more Indian children than Coloured children living in urban areas of South Africa.
(vi) The proportion of Indian children living in urban areas in South Africa is bigger than the proportion
of Coloured children living in urban areas.
(vii) The proportion of the urban children in South Africa that is Coloured is greater than the proportion
that is Indian.
(viii) There are more Coloured children than Indian children living in urban areas of South Africa.
(ix) A bigger proportion of Coloured children live in urban areas than is the proportion of Indian children
living in urban areas.
Data from Child Gauge 2012 and Statistics South Africa (2011) General Household Survey 2010.
11
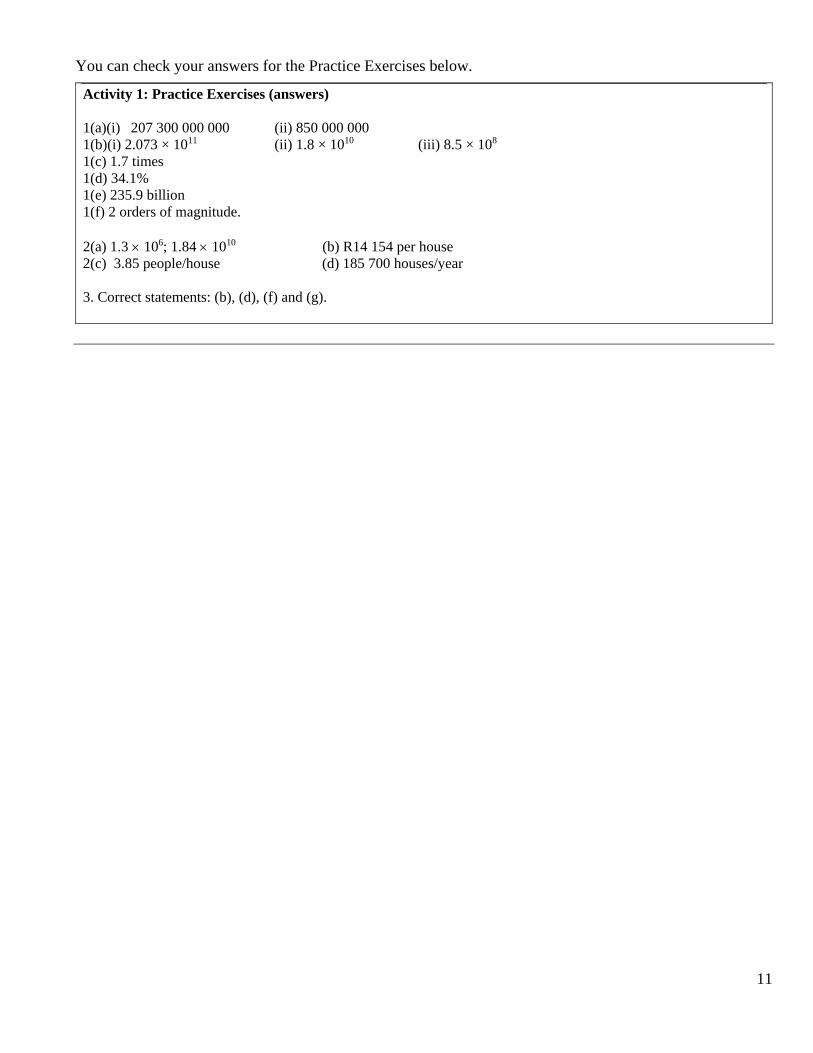
You can check your answers for the Practice Exercises below.
Activity 1: Practice Exercises (answers)
1(a)(i) 207 300 000 000 (ii) 850 000 000
1(b)(i) 2.073 × 10¹¹ (ii) 1.8 × 10¹⁰ (iii) 8.5 × 10⁸
1(c) 1.7 times
1(d) 34.1%
1(e) 235.9 billion
1(f) 2 orders of magnitude.
2(a) 1.3 106; 1.84 1010 (b) R14 154 per house
2(c) 3.85 people/house (d) 185 700 houses/year
3. Correct statements: (b), (d), (f) and (g).
12
Activity 2: How much will it cost to implement the Children’s Act?
The text below is from the The Child Gauge 2007/2008. The quantitative content that will be encountered in
this activity includes large numbers, scientific notation, fractions, percentages and percentage increase.
The cost of implementing the Children’s Act.
In 2006, the government commissioned a team to calculate the total cost of implementing
the Children’s Bill. The costing was done on a 2003 draft of the Bill. While some parts of the
Bill have changed since 2003, the costing still gives a reliable picture of the likely costs of
implementing the Act. The estimated amounts are, however, now lower than they should
be because of inflation.
The team worked out the costs of four possible, but different, situations (scenarios) which we
will call Scenarios 1, 2, 3 and 4. These scenarios describe the services that could be offered,
ranging from the existing inequitable and uneven distribution of service delivery that does
not reach all children in need (Scenario 1) through to a ‘total demand’ service that caters
for the actual need with high standards in all services (Scenario 4). The total cost of each of
the four scenarios over the period 2005/06 (year one) to 2010/11 (year six) was estimated.
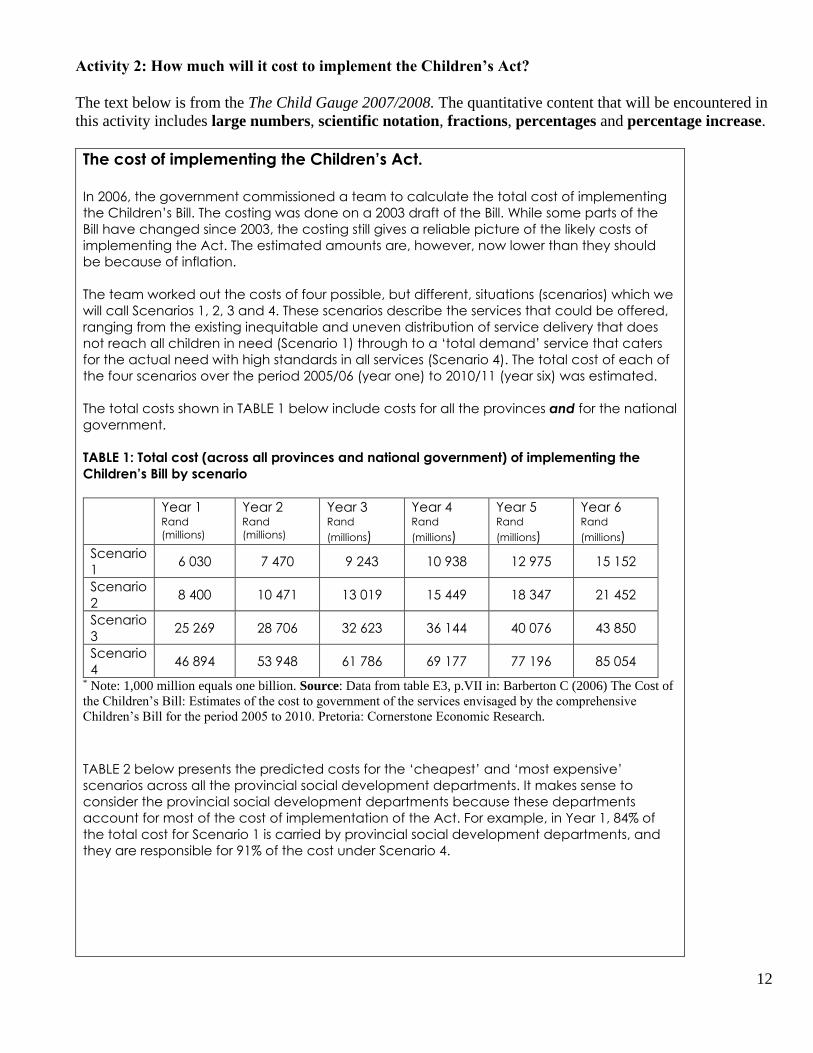
The total costs shown in TABLE 1 below include costs for all the provinces and for the national
government.
TABLE 1: Total cost (across all provinces and national government) of implementing the
Children’s Bill by scenario
Year 1 Rand
(millions)
Year 2 Rand
(millions)
Year 3 Rand
(millions)
Year 4 Rand
(millions)
Year 5 Rand
(millions)
Year 6 Rand
(millions)
Scenario
1 6 030 7 470 9 243 10 938 12 975 15 152
Scenario
2 8 400 10 471 13 019 15 449 18 347 21 452
Scenario
3 25 269 28 706 32 623 36 144 40 076 43 850
Scenario
4 46 894 53 948 61 786 69 177 77 196 85 054
* Note: 1,000 million equals one billion. Source: Data from table E3, p.VII in: Barberton C (2006) The Cost of
the Children’s Bill: Estimates of the cost to government of the services envisaged by the comprehensive
Children’s Bill for the period 2005 to 2010. Pretoria: Cornerstone Economic Research.
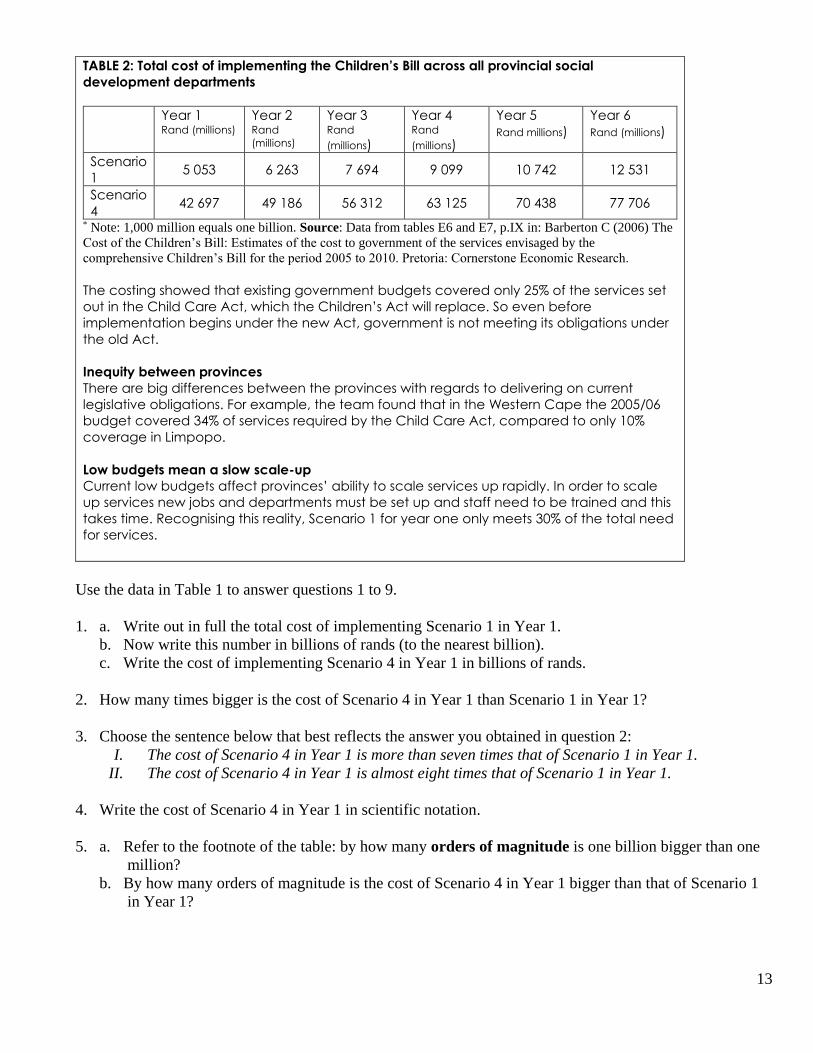
TABLE 2 below presents the predicted costs for the ‘cheapest’ and ‘most expensive’
scenarios across all the provincial social development departments. It makes sense to
consider the provincial social development departments because these departments
account for most of the cost of implementation of the Act. For example, in Year 1, 84% of
the total cost for Scenario 1 is carried by provincial social development departments, and
they are responsible for 91% of the cost under Scenario 4.
13
TABLE 2: Total cost of implementing the Children’s Bill across all provincial social
development departments
Year 1 Rand (millions)
Year 2 Rand
(millions)
Year 3 Rand
(millions)
Year 4 Rand
(millions)
Year 5
Rand millions)
Year 6
Rand (millions)
Scenario
1 5 053 6 263 7 694 9 099 10 742 12 531
Scenario
4 42 697 49 186 56 312 63 125 70 438 77 706
* Note: 1,000 million equals one billion. Source: Data from tables E6 and E7, p.IX in: Barberton C (2006) The
Cost of the Children’s Bill: Estimates of the cost to government of the services envisaged by the
comprehensive Children’s Bill for the period 2005 to 2010. Pretoria: Cornerstone Economic Research.
The costing showed that existing government budgets covered only 25% of the services set
out in the Child Care Act, which the Children’s Act will replace. So even before
implementation begins under the new Act, government is not meeting its obligations under
the old Act.
Inequity between provinces
There are big differences between the provinces with regards to delivering on current
legislative obligations. For example, the team found that in the Western Cape the 2005/06
budget covered 34% of services required by the Child Care Act, compared to only 10%
coverage in Limpopo.
Low budgets mean a slow scale-up
Current low budgets affect provinces’ ability to scale services up rapidly. In order to scale
up services new jobs and departments must be set up and staff need to be trained and this
takes time. Recognising this reality, Scenario 1 for year one only meets 30% of the total need
for services.
Use the data in Table 1 to answer questions 1 to 9.
1. a. Write out in full the total cost of implementing Scenario 1 in Year 1.
b. Now write this number in billions of rands (to the nearest billion).
c. Write the cost of implementing Scenario 4 in Year 1 in billions of rands.
2. How many times bigger is the cost of Scenario 4 in Year 1 than Scenario 1 in Year 1?
3. Choose the sentence below that best reflects the answer you obtained in question 2:
I. The cost of Scenario 4 in Year 1 is more than seven times that of Scenario 1 in Year 1.
II. The cost of Scenario 4 in Year 1 is almost eight times that of Scenario 1 in Year 1.
4. Write the cost of Scenario 4 in Year 1 in scientific notation.
5. a. Refer to the footnote of the table: by how many orders of magnitude is one billion bigger than one
million?
b. By how many orders of magnitude is the cost of Scenario 4 in Year 1 bigger than that of Scenario 1
in Year 1?
14
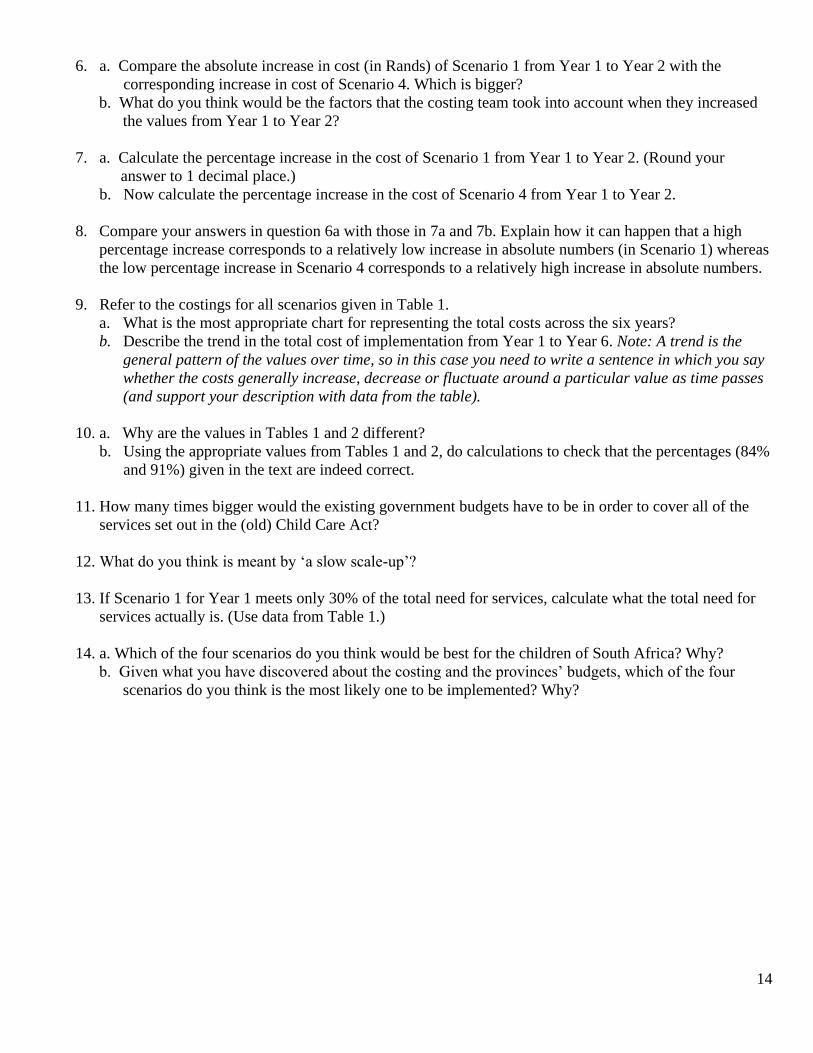
6. a. Compare the absolute increase in cost (in Rands) of Scenario 1 from Year 1 to Year 2 with the
corresponding increase in cost of Scenario 4. Which is bigger?
b. What do you think would be the factors that the costing team took into account when they increased
the values from Year 1 to Year 2?
7. a. Calculate the percentage increase in the cost of Scenario 1 from Year 1 to Year 2. (Round your
answer to 1 decimal place.)
b. Now calculate the percentage increase in the cost of Scenario 4 from Year 1 to Year 2.
8. Compare your answers in question 6a with those in 7a and 7b. Explain how it can happen that a high
percentage increase corresponds to a relatively low increase in absolute numbers (in Scenario 1) whereas
the low percentage increase in Scenario 4 corresponds to a relatively high increase in absolute numbers.
9. Refer to the costings for all scenarios given in Table 1.
a. What is the most appropriate chart for representing the total costs across the six years?
b. Describe the trend in the total cost of implementation from Year 1 to Year 6. Note: A trend is the
general pattern of the values over time, so in this case you need to write a sentence in which you say
whether the costs generally increase, decrease or fluctuate around a particular value as time passes
(and support your description with data from the table).
10. a. Why are the values in Tables 1 and 2 different?
b. Using the appropriate values from Tables 1 and 2, do calculations to check that the percentages (84%
and 91%) given in the text are indeed correct.
11. How many times bigger would the existing government budgets have to be in order to cover all of the
services set out in the (old) Child Care Act?
12. What do you think is meant by ‘a slow scale-up’?
13. If Scenario 1 for Year 1 meets only 30% of the total need for services, calculate what the total need for
services actually is. (Use data from Table 1.)
14. a. Which of the four scenarios do you think would be best for the children of South Africa? Why?
b. Given what you have discovered about the costing and the provinces’ budgets, which of the four
scenarios do you think is the most likely one to be implemented? Why?

15
RECAP (after Activity 2)
Activity 2 addresses the following quantitative literacy content. You have now encountered some of
the content in both Activities 1 and 2. Make sure that you know what is meant by these descriptions
before moving on.
Mathematics content
Large numbers
reading large numbers in text and tables
representing large numbers in full and using scientific notation
rounding
Comparing the size of numbers
dividing (how many times bigger) and subtracting (how much more) (and descriptive terms
like “more than”, “almost”)
expressing one quantity as a percentage/proportion of another
orders of magnitude
Percentages
expressing one quantity as a percentage of another
finding the total (100%) when given the absolute and relative size of a subset
calculating percentage change
Change
Absolute change (change in number) vs. relative change (percentage change)
Literacies
Reading texts containing quantitative information
Working with different representations
interpreting tables (including identifying the variable)
selecting an appropriate chart (time series chart)
Identifying relationship between text and table.
The relationship between the maths content and the context of the Children’s Act: how can the numbers
help us to understand the challenges of implementing the Act?
Describing trends from a table/time series chart.
16
Activity 2: Practice Exercises
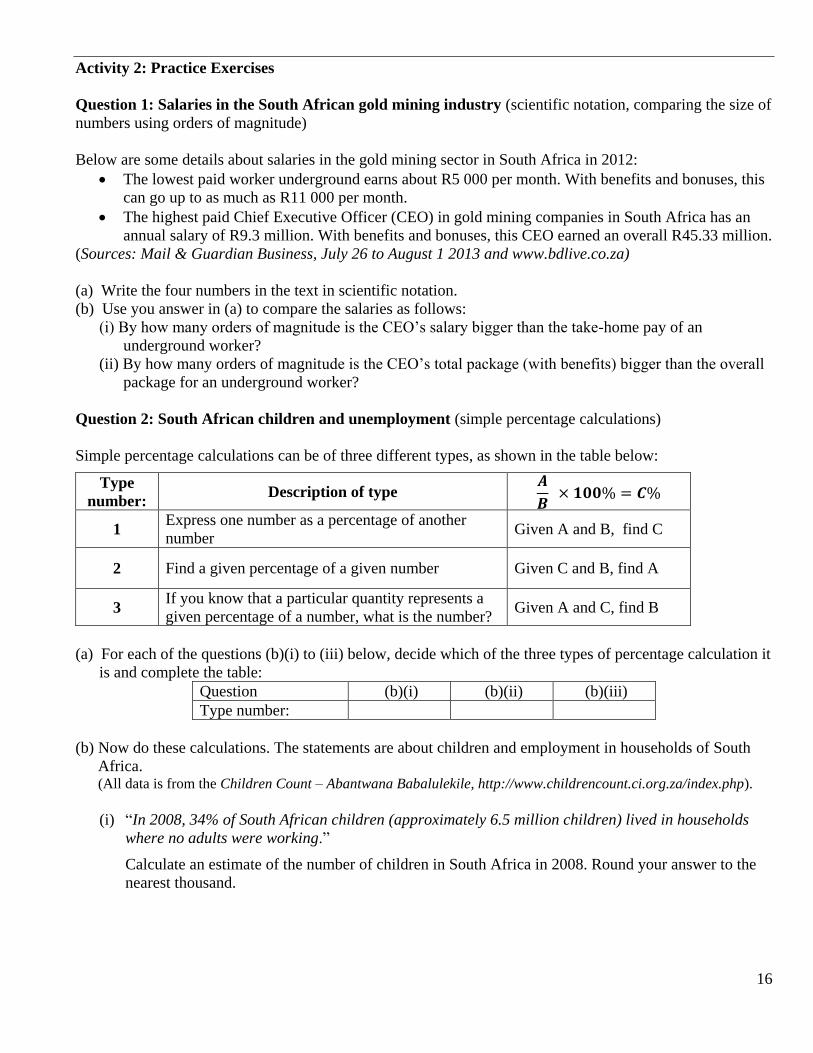
Question 1: Salaries in the South African gold mining industry (scientific notation, comparing the size of
numbers using orders of magnitude)
Below are some details about salaries in the gold mining sector in South Africa in 2012:
The lowest paid worker underground earns about R5 000 per month. With benefits and bonuses, this
can go up to as much as R11 000 per month.
The highest paid Chief Executive Officer (CEO) in gold mining companies in South Africa has an
annual salary of R9.3 million. With benefits and bonuses, this CEO earned an overall R45.33 million.
(Sources: Mail & Guardian Business, July 26 to August 1 2013 and www.bdlive.co.za)
(a) Write the four numbers in the text in scientific notation.
(b) Use you answer in (a) to compare the salaries as follows:
(i) By how many orders of magnitude is the CEO’s salary bigger than the take-home pay of an
underground worker?
(ii) By how many orders of magnitude is the CEO’s total package (with benefits) bigger than the overall
package for an underground worker?
Question 2: South African children and unemployment (simple percentage calculations)
Simple percentage calculations can be of three different types, as shown in the table below:
Type
number: Description of type
𝑨
𝑩 × 𝟏𝟎𝟎% = 𝑪%
1 Express one number as a percentage of another
number Given A and B, find C
2 Find a given percentage of a given number Given C and B, find A
3 If you know that a particular quantity represents a
given percentage of a number, what is the number? Given A and C, find B
(a) For each of the questions (b)(i) to (iii) below, decide which of the three types of percentage calculation it
is and complete the table:
Question (b)(i) (b)(ii) (b)(iii)
Type number:
(b) Now do these calculations. The statements are about children and employment in households of South
Africa. (All data is from the Children Count – Abantwana Babalulekile, http://www.childrencount.ci.org.za/index.php).
(i) “In 2008, 34% of South African children (approximately 6.5 million children) lived in households
where no adults were working.”
Calculate an estimate of the number of children in South Africa in 2008. Round your answer to the
nearest thousand.

17
(ii) “Racial inequalities in the 2008 data are striking: of the 15 880 000 African children, 38.8% lived in
households with no working adult, whereas 2.9% of the 990 000 White children lived in these
circumstances.”
How many Black children lived in households with no working adult? How many White children
lived in household with no working adult? Round your answers to the nearest thousand.
(iii)“In Limpopo in 2008, 1.3 million of the 2.3 million children lived in households with no working
adult.”
What proportion of children in Limpopo lived in households with no working adult?
Question 3 (percentage change)
Percentage change calculations can be of three different types, as shown in the table below:
Type
number:
Description of type % change = 𝒆𝒏𝒅−𝒔𝒕𝒂𝒓𝒕
𝒔𝒕𝒂𝒓𝒕 × 100
1 Express an absolute change as a percentage
change Given start and end, find % change
2 Change (increase or decrease) a number by a
given percentage change. Given start and % change, find end
3*
Determine the original number if you know
its size after it has experienced a given
percentage change
Given end and % change, find start
* You will practise this type of calculation a number of times in Activity 3B.
3.1 Complete the table below (round your answer to one decimal place). These are all Type 1
calculations.
Starting
value
Final value Percentage
change
43.2 67.1
55 110
145 98
3.2
(a) Part (b) below contains four statements about children and employment in households of South Africa. (All data is from the Child Gauge 2009/2010 and Children Count – Abantwana Babalulekile,
http://www.childrencount.ci.org.za/index.php). For questions (b)(i) to (iv) below, decide which of the three types of percentage change calculation it is
and complete the table.
Question (b)(i) (b)(ii) (b)(iii) (b)(iv)
Type number:
(b) Now do the calculations.
(i) The number of children in Mpumalanga living in households with no working adult in 2008 increased
by 7.2% from the 2002 total of 492 682. How many children in Mpumalanga were living in
households with no working adult in 2008?
18
(ii) In 2002, 622 153 children in Gauteng were living in households with no working adult. This number
decreased by 19.2% from 2002 to 2008. How many children in Gauteng were living in households
with no working adult in 2008?
(iii) The number of children in South Africa living in households with no working adult decreased from
6.793 million in 2002 to 6.44 million in 2008. What was the percentage change for this time period?
(iv) In 2008, 1.749 million children in KwaZulu-Natal were living in households with no working adult.
This is an increase of 6.3% since 2002. How many children in KwaZulu-Natal were living in
households with no working adult in 2002?
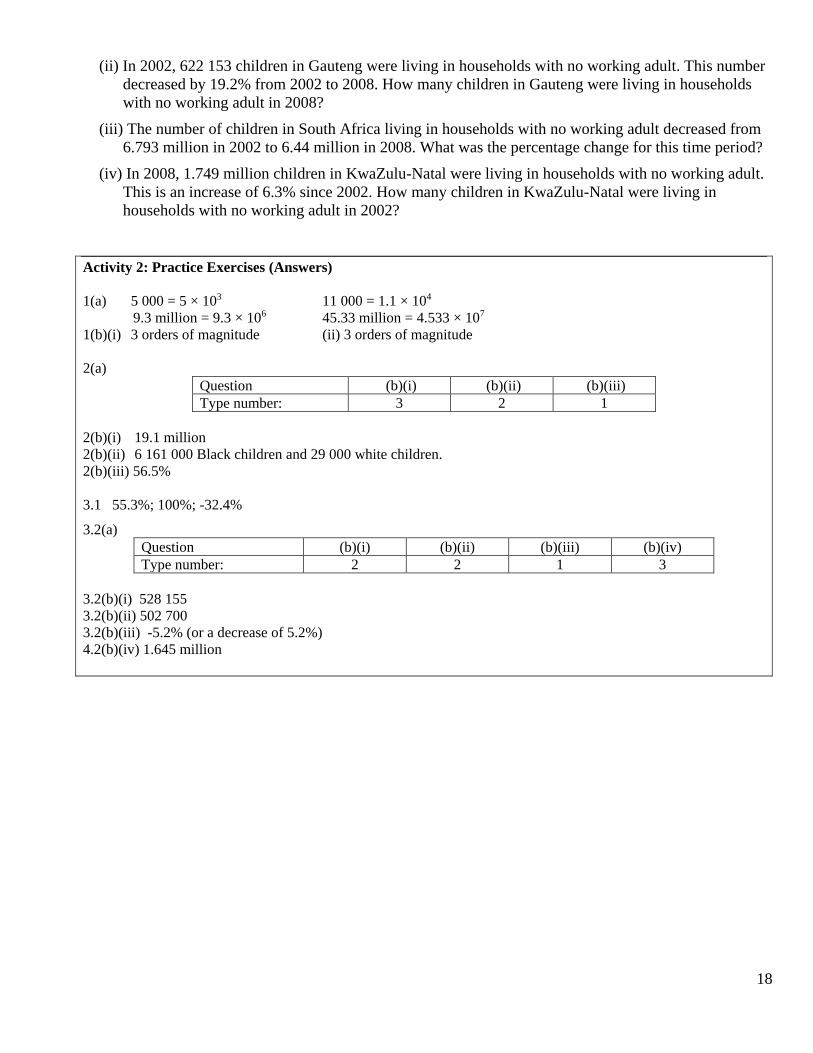
Activity 2: Practice Exercises (Answers)
1(a) 5 000 = 5 × 10³ 11 000 = 1.1 × 10⁴
9.3 million = 9.3 × 10⁶ 45.33 million = 4.533 × 10⁷
1(b)(i) 3 orders of magnitude (ii) 3 orders of magnitude
2(a)
Question (b)(i) (b)(ii) (b)(iii)
Type number: 3 2 1
2(b)(i) 19.1 million
2(b)(ii) 6 161 000 Black children and 29 000 white children.
2(b)(iii) 56.5%
3.1 55.3%; 100%; -32.4%
3.2(a)
Question (b)(i) (b)(ii) (b)(iii) (b)(iv)
Type number: 2 2 1 3
3.2(b)(i) 528 155
3.2(b)(ii) 502 700
3.2(b)(iii) -5.2% (or a decrease of 5.2%)
4.2(b)(iv) 1.645 million

19
Activity 3A: Budgeting for Child Care and Protection
You will read more about provinces’ budgets for social services in this article from The Child Gauge
2007/2008. The mathematical content focus here is on relative sizes and change and the content you will
encounter includes percentages, percentage change, and absolute vs. relative increase. Activities 3A, 3B
and 3C all provide support for your first writing activity.
What have provinces planned to spend on implementing the Act?
This section analyses what the budgets of the social development departments say
about the government’s concrete plans for implementing the Act.
The provincial social development budgets are divided into programmes and the
social welfare programme is the biggest programme. It has to cover a range of laws
and programmes providing social services for vulnerable groups including children, the
elderly and people with disabilities. The first thing to note is that there is an increased
budget for the social welfare programme as a whole – from R3 148 million in 2006/07 to
R4 152 million in 2007/08, an increase of 32%.
The social welfare programme is further divided into sub-programmes including ( but
not limited to):
Substance abuse, prevention and rehabilitation
Crime prevention and support
Child care and protection services
HIV/AIDS and
Care and support services to families
The child care and protection services sub-programme is almost always the biggest in
monetary terms. In this essay, this sub-programme’s budget will be used as an indicator
of the extent to which provinces have begun to plan for implementing the Act. Table 1
shows the increase in the child care and protection services budget for three years per
province. There are large variations across the provinces. For example, Limpopo has the
highest increase but comes off a very low base. Free State, Gauteng and KwaZulu-
Natal have the lowest increases.
TABLE 1: Annual increases in child care and protection services budgets per province,
from the highest to the lowest
2007/08
%
2008/09
%
2009/10
%
Limpopo 76 70 9
North West 47 66 4
Mpumalanga 35 47 4
Northern Cape 39 26 16
Western Cape 33 30 13
Eastern Cape 35 37 3
Free State 4 9 18
KwaZulu-Natal 5 16 8
Gauteng -17 8 41
Average 13 27 15 Source: Analysis by Budlender D (Centre for Actuarial Research, UCT) of data in: National Treasury (2007)
Estimates of National Expenditure: All nine provinces’ estimate of provincial expenditure (2007).

20
Answer the following questions using the text and table:
1. a. Explain in words what the entry ‘76’ in the second column of the table tells us about the context.
b. Describe in words how the value in (a) would have been calculated.
2. Write a sentence that conveys the information given in the table about Gauteng in 2007/08.
3. a. In the text there is a sentence that reads “For example, Limpopo has the highest increase but comes
off a very low base.” What does “comes off a very low base” mean?
b. Would an increase of 76% off a base of 100 lead to a bigger actual increase than an increase of 39%
off a base of 200? Explain.
4. a. Confirm the increase of 32% mentioned in the second paragraph.
b. The value 32% is not reflected in Table 1. Explain why this is the case.
c. Your helpful friend explains how the average budget increase for 2007/08 (13%) was calculated:
“The average budget increase for 2007/08 was found by adding up all
the provinces’ percentage increases for 2007/08 and dividing by 9.”
Is this statement true? If you think it is true, support your answer by doing a calculation. If not,
explain how the calculation would have been done.
5. What does Table 1 tell us about provincial budgeting on child care and protection? What doesn’t it
tell us? Write down three to four points.
6. Do you need other information to help you better understand provinces’ budgets on child care and
protection? If so, what?

21
Activity 3B: Budgeting for Child Care and Protection (selected provinces)
In Activity 3A we used only the percentage change in provincial budgets on child care and protection year-
on-year to comment on the provinces’ planning for the implementation of the Child Care Act. In this activity
we focus on four of the nine provinces, but supplement our knowledge of the context with data on actual
budgets and child populations in these provinces for the 2007/08 budget year:
Table 2: Child population and budget for 2007/08, by selected provinces Province Child population1 Budget (in R’000s)2
Limpopo 2 393 000 48 970
Free State 1 049 000 138 083
KwaZulu-Natal 4.093 000 231 852
Gauteng 3 440 000 253 879 1 2008 child population figures from Child Gauge 2009 2 2007/08 Budget figures from “Analysis of the 2008/09 Budgets of the 9 provincial departments of Social Development: Are the
budgets adequate to implement the Children’s Act?” by Debbie Budlender and Paula Proudlock. 2008 Children’s Institute, UCT.
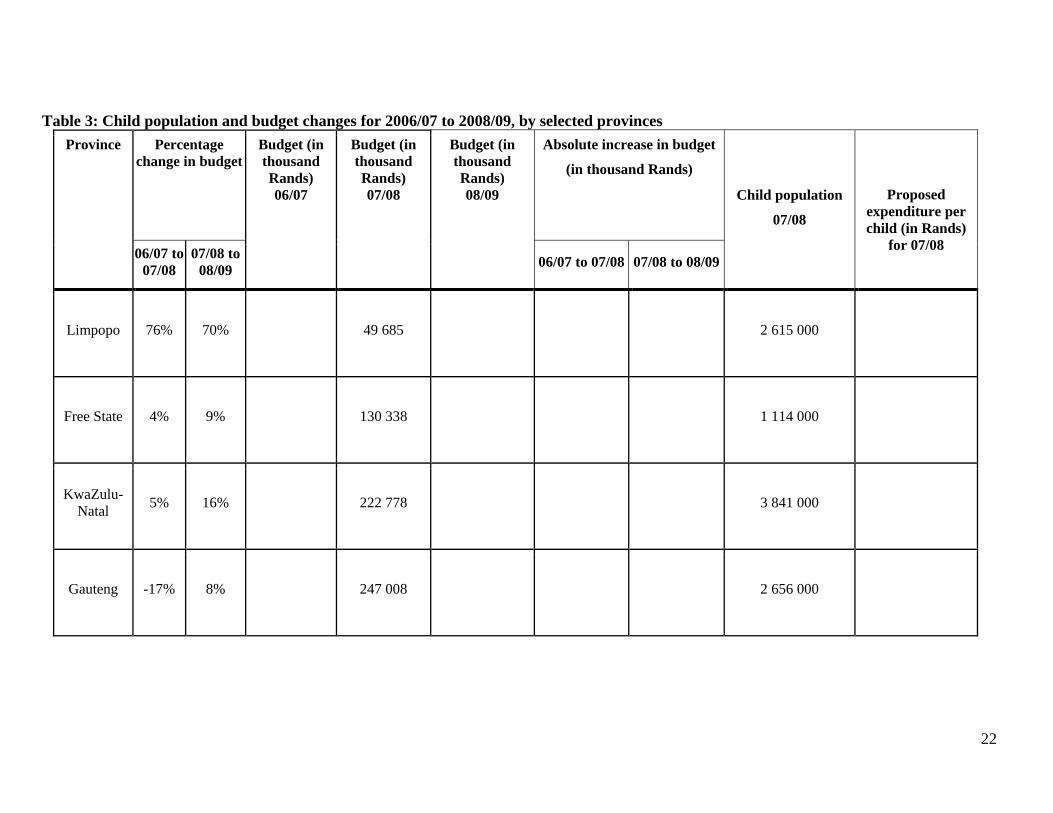
1. The data from Tables 1 and 2 has been entered in Table 3. Complete the missing cells in the table.
2. What does Table 3 say about provincial budgeting on child care and protection? Write down a few points
about child population, budget, budget increase and expenditure per child.
3. Imagine that you are the advisor to the national Minister of Social Development and Welfare on the issue
of child care and protection. You wish to alert the Minister to the situation in the four provinces given in
Table 3 with respect to what their budgeting says about their ability to meet the needs of children in those
provinces.
Write approximately eight sentences indicating why each of these four provinces needs the Minister’s
attention.
Below is a list of attributes that we look for in your writing:
The key issues/important points about the context have been identified (not simply repeating all the
detail in the table).
A variety of appropriate variables are discussed (e.g. child population, budget, budget increase and
expenditure per child), using appropriate units.
The writing is clear and coherent, with full sentences. An argument is built, using words like “in
addition”, “however”, as appropriate. (See the note “Cohesion in Writing” on page 24)
Similar ideas are grouped into paragraphs (no bullets).
The argument is supported with appropriate data in context (not personal opinion). Words like
“bigger”, “increases”, “more” are supported by data.
Writing is an appropriate length.
22
Table 3: Child population and budget changes for 2006/07 to 2008/09, by selected provinces
Province Percentage
change in budget
Budget (in
thousand
Rands)
06/07
Budget (in
thousand
Rands)
07/08
Budget (in
thousand
Rands)
08/09
Absolute increase in budget
(in thousand Rands)
Child population
07/08
Proposed
expenditure per
child (in Rands)
for 07/08 06/07 to
07/08
07/08 to
08/09
06/07 to 07/08 07/08 to 08/09
Limpopo 76% 70%
49 685
2 615 000
Free State 4% 9%
130 338
1 114 000
KwaZulu-
Natal 5% 16%
222 778
3 841 000
Gauteng -17% 8%
247 008
2 656 000
23
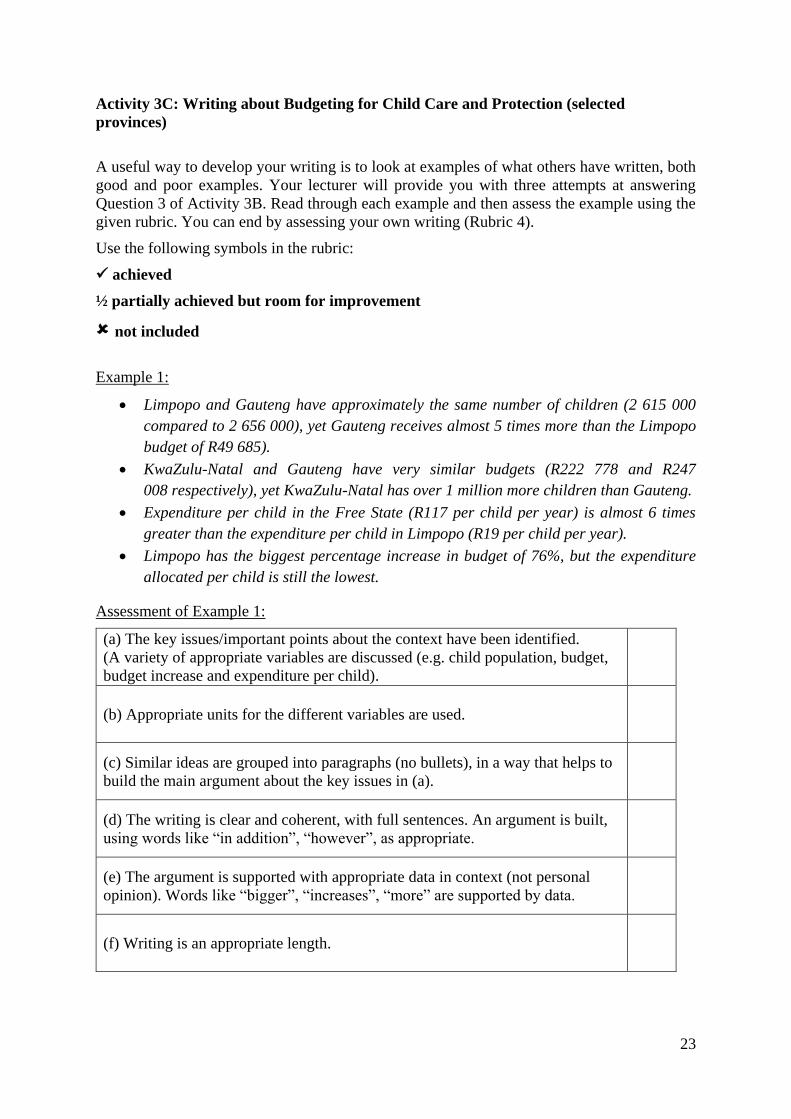
Activity 3C: Writing about Budgeting for Child Care and Protection (selected
provinces)
A useful way to develop your writing is to look at examples of what others have written, both
good and poor examples. Your lecturer will provide you with three attempts at answering
Question 3 of Activity 3B. Read through each example and then assess the example using the
given rubric. You can end by assessing your own writing (Rubric 4).
Use the following symbols in the rubric:
achieved
½ partially achieved but room for improvement
not included
Example 1:
Limpopo and Gauteng have approximately the same number of children (2 615 000
compared to 2 656 000), yet Gauteng receives almost 5 times more than the Limpopo
budget of R49 685).
KwaZulu-Natal and Gauteng have very similar budgets (R222 778 and R247
008 respectively), yet KwaZulu-Natal has over 1 million more children than Gauteng.
Expenditure per child in the Free State (R117 per child per year) is almost 6 times
greater than the expenditure per child in Limpopo (R19 per child per year).
Limpopo has the biggest percentage increase in budget of 76%, but the expenditure
allocated per child is still the lowest.
Assessment of Example 1:
(a) The key issues/important points about the context have been identified.
(A variety of appropriate variables are discussed (e.g. child population, budget,
budget increase and expenditure per child).
(b) Appropriate units for the different variables are used.
(c) Similar ideas are grouped into paragraphs (no bullets), in a way that helps to
build the main argument about the key issues in (a).
(d) The writing is clear and coherent, with full sentences. An argument is built,
using words like “in addition”, “however”, as appropriate.
(e) The argument is supported with appropriate data in context (not personal
opinion). Words like “bigger”, “increases”, “more” are supported by data.
(f) Writing is an appropriate length.
24
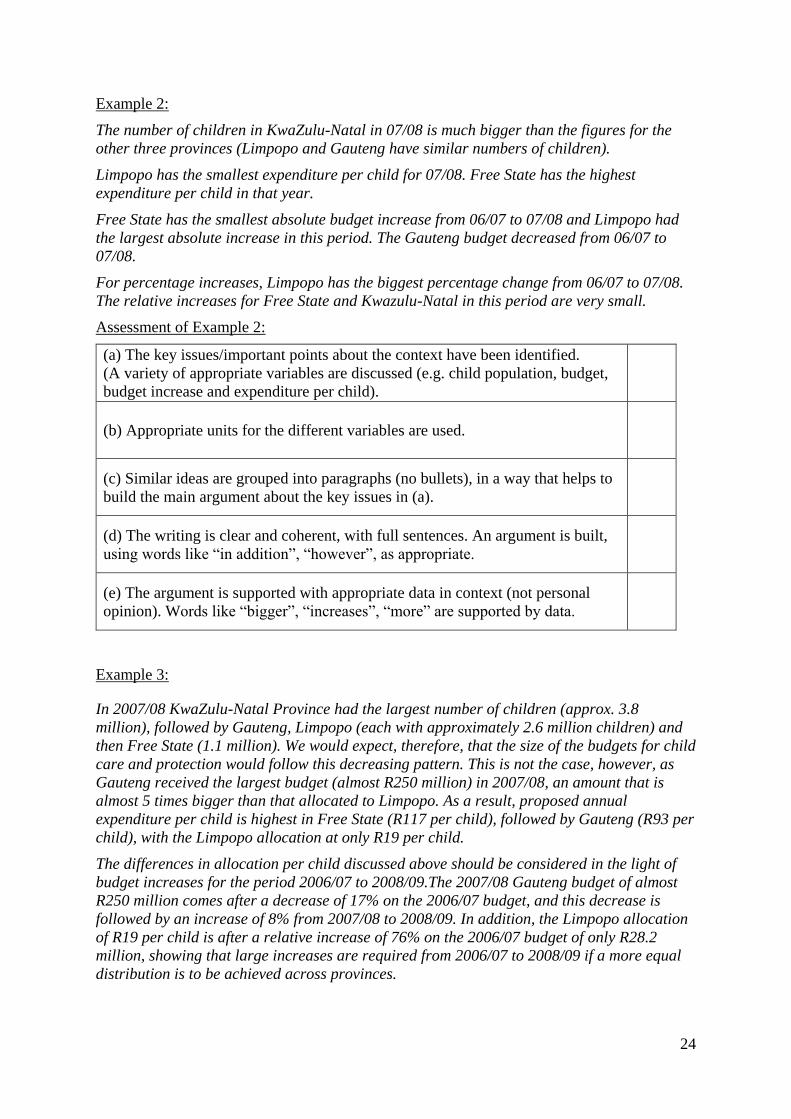
Example 2:
The number of children in KwaZulu-Natal in 07/08 is much bigger than the figures for the
other three provinces (Limpopo and Gauteng have similar numbers of children).
Limpopo has the smallest expenditure per child for 07/08. Free State has the highest
expenditure per child in that year.
Free State has the smallest absolute budget increase from 06/07 to 07/08 and Limpopo had
the largest absolute increase in this period. The Gauteng budget decreased from 06/07 to
07/08.
For percentage increases, Limpopo has the biggest percentage change from 06/07 to 07/08.
The relative increases for Free State and Kwazulu-Natal in this period are very small.
Assessment of Example 2:
(a) The key issues/important points about the context have been identified.
(A variety of appropriate variables are discussed (e.g. child population, budget,
budget increase and expenditure per child).
(b) Appropriate units for the different variables are used.
(c) Similar ideas are grouped into paragraphs (no bullets), in a way that helps to
build the main argument about the key issues in (a).
(d) The writing is clear and coherent, with full sentences. An argument is built,
using words like “in addition”, “however”, as appropriate.
(e) The argument is supported with appropriate data in context (not personal
opinion). Words like “bigger”, “increases”, “more” are supported by data.
Example 3:
In 2007/08 KwaZulu-Natal Province had the largest number of children (approx. 3.8
million), followed by Gauteng, Limpopo (each with approximately 2.6 million children) and
then Free State (1.1 million). We would expect, therefore, that the size of the budgets for child
care and protection would follow this decreasing pattern. This is not the case, however, as
Gauteng received the largest budget (almost R250 million) in 2007/08, an amount that is
almost 5 times bigger than that allocated to Limpopo. As a result, proposed annual
expenditure per child is highest in Free State (R117 per child), followed by Gauteng (R93 per
child), with the Limpopo allocation at only R19 per child.
The differences in allocation per child discussed above should be considered in the light of
budget increases for the period 2006/07 to 2008/09.The 2007/08 Gauteng budget of almost
R250 million comes after a decrease of 17% on the 2006/07 budget, and this decrease is
followed by an increase of 8% from 2007/08 to 2008/09. In addition, the Limpopo allocation
of R19 per child is after a relative increase of 76% on the 2006/07 budget of only R28.2
million, showing that large increases are required from 2006/07 to 2008/09 if a more equal
distribution is to be achieved across provinces.
25
Assessment of Example 3:
(a) The key issues/important points about the context have been identified.
(A variety of appropriate variables are discussed (e.g. child population, budget,
budget increase and expenditure per child).
(b) Appropriate units for the different variables are used.
(c) Similar ideas are grouped into paragraphs (no bullets), in a way that helps to
build the main argument about the key issues in (a).
(d) The writing is clear and coherent, with full sentences. An argument is built,
using words like “in addition”, “however”, as appropriate.
(e) The argument is supported with appropriate data in context (not personal
opinion). Words like “bigger”, “increases”, “more” are supported by data.
(f) Writing is an appropriate length.
Assessment of your own writing:
(a) The key issues/important points about the context have been identified.
(A variety of appropriate variables are discussed (e.g. child population, budget,
budget increase and expenditure per child).
(b) Appropriate units for the different variables are used.
(c) Similar ideas are grouped into paragraphs (no bullets), in a way that helps to
build the main argument about the key issues in (a).
(d) The writing is clear and coherent, with full sentences. An argument is built,
using words like “in addition”, “however”, as appropriate.
(e) The argument is supported with appropriate data in context (not personal
opinion). Words like “bigger”, “increases”, “more” are supported by data.
(f) Writing is an appropriate length.
26
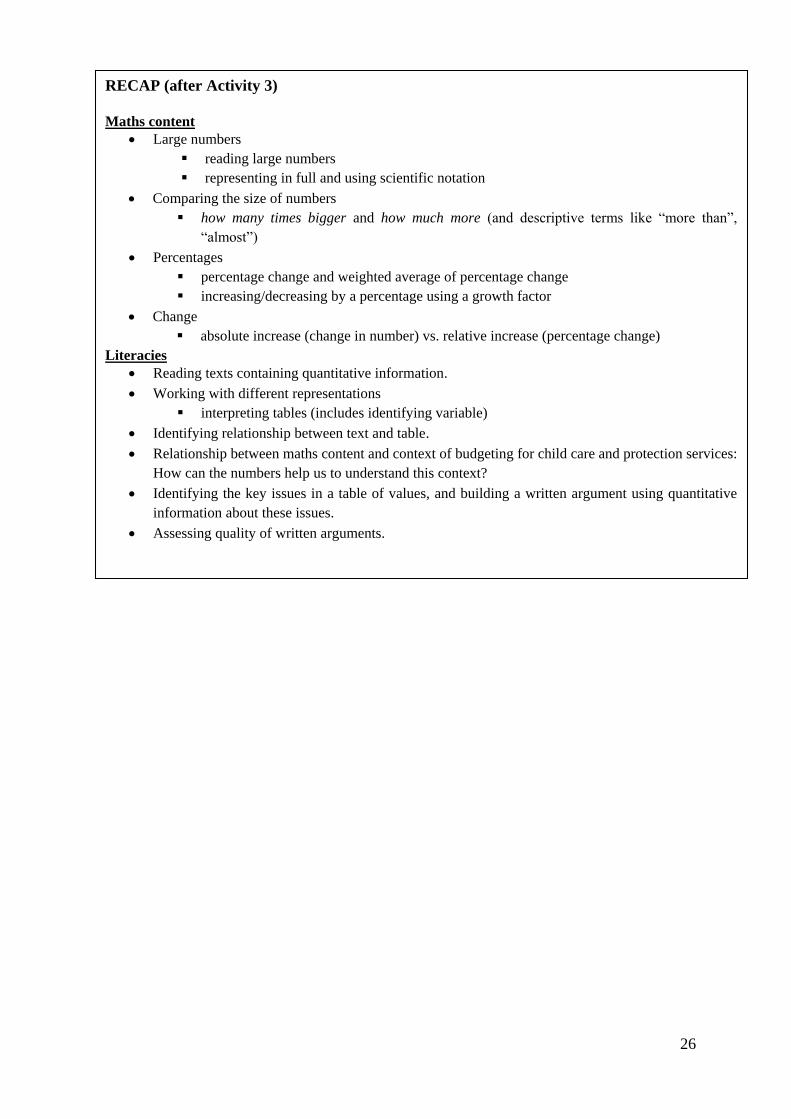
RECAP (after Activity 3)
Maths content
Large numbers
reading large numbers
representing in full and using scientific notation
Comparing the size of numbers
how many times bigger and how much more (and descriptive terms like “more than”,
“almost”)
Percentages
percentage change and weighted average of percentage change
increasing/decreasing by a percentage using a growth factor
Change
absolute increase (change in number) vs. relative increase (percentage change)
Literacies
Reading texts containing quantitative information.
Working with different representations
interpreting tables (includes identifying variable)
Identifying relationship between text and table.
Relationship between maths content and context of budgeting for child care and protection services:
How can the numbers help us to understand this context?
Identifying the key issues in a table of values, and building a written argument using quantitative
information about these issues.
Assessing quality of written arguments.

27
Activity 3: Practice Exercise
The number and proportion of children living with their biological parents (building a
written argument using quantitative information) from Child Gauge 2013
Table 1: The number (in thousands) and proportion of children living with their
parents, by province, 2011
Eastern
Cape
Free
State
Gauteng KwaZulu-
Natal
Limpopo Mpum-
alanga
North
West
Northern
Cape
Western
Cape
South
Africa
Both
parents
21.6%
580
33.2%
352
48.1%
1 605
24.5%
1 034
25.7%
576
29.8%
439
29.3%
375
29.4%
128
52.9%
959
32.9%
6 044
Mother
only*
40.4%
1 087
39.2%
415
34.9%
1 164
40.7%
1 716
44.5%
998
41.4%
610
42.2%
541
42.6%
185
31.7%
575
39.3%
7 293
Father
only*
2.9%
78
3.5%
37
4.4%
146
5.1%
217
1.7%
39
3.9%
58
2.2%
28
3.2%
14
3.5%
63
3.7%
678
Neither
parent
35.0%
942
24.1%
256
12.6%
422
29.6%
1 247
28%
628
24.9%
366
26.3%
337
24.8%
108
12.0%
217
24.4%
4 526
* If a child lives with just one biological parent, this does not mean that the mother or father is a “single parent”.
In most cases there are additional caregivers in the household such as aunts, uncles and grandparents who also
contribute to the care of the child.
The sentences and phrases in the bullets below describe the key features of the data in Table
1. Words like “in contrast”, “this” and “as”, as well as punctuation symbols, have been used
to build an argument about the data. However, the sentences and phrases are not arranged in a
useful way. Reorder the text (without changing the text in any way) into two paragraphs in
such a way that the argument is clear.
Paragraph 1:
Twenty-four percent do not have either of their biological parents living with them.
In contrast, only 4% of children live in households where their fathers are present and
their mothers absent.
…as in most cases (78%) children have at least one parent who is alive but living
elsewhere.
Thirty-three percent of children in South Africa in 2011 were living with both parents.
more than seven million children –
This does not necessarily mean that they are orphaned,
Thirty-nine percent of all children … live with their mothers but not with their fathers.
Paragraph 2:
In the Western Cape and Gauteng the proportion of children living with both parents
is considerably higher than the national average,
(12% and 13% respectively).
There is some provincial variation in these patterns.
In contrast, over a third of children (35%) in the Eastern Cape and approximately one-
quarter of children in each of the remaining provinces live with neither parent.
28
(53% and 48% respectively).
Similarly, the proportion of children living with neither parent is low in these two
provinces
with around half of children resident with both parents
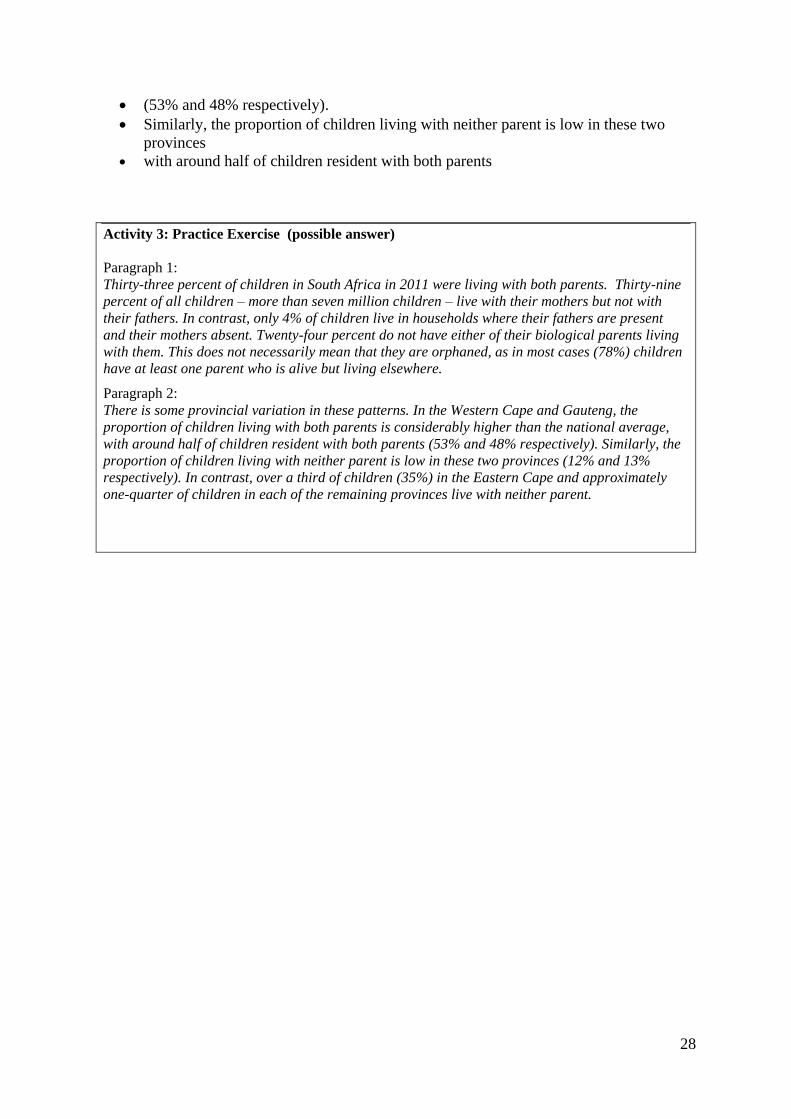
Activity 3: Practice Exercise (possible answer)
Paragraph 1:
Thirty-three percent of children in South Africa in 2011 were living with both parents. Thirty-nine
percent of all children – more than seven million children – live with their mothers but not with
their fathers. In contrast, only 4% of children live in households where their fathers are present
and their mothers absent. Twenty-four percent do not have either of their biological parents living
with them. This does not necessarily mean that they are orphaned, as in most cases (78%) children
have at least one parent who is alive but living elsewhere.
Paragraph 2:
There is some provincial variation in these patterns. In the Western Cape and Gauteng, the
proportion of children living with both parents is considerably higher than the national average,
with around half of children resident with both parents (53% and 48% respectively). Similarly, the
proportion of children living with neither parent is low in these two provinces (12% and 13%
respectively). In contrast, over a third of children (35%) in the Eastern Cape and approximately
one-quarter of children in each of the remaining provinces live with neither parent.
29
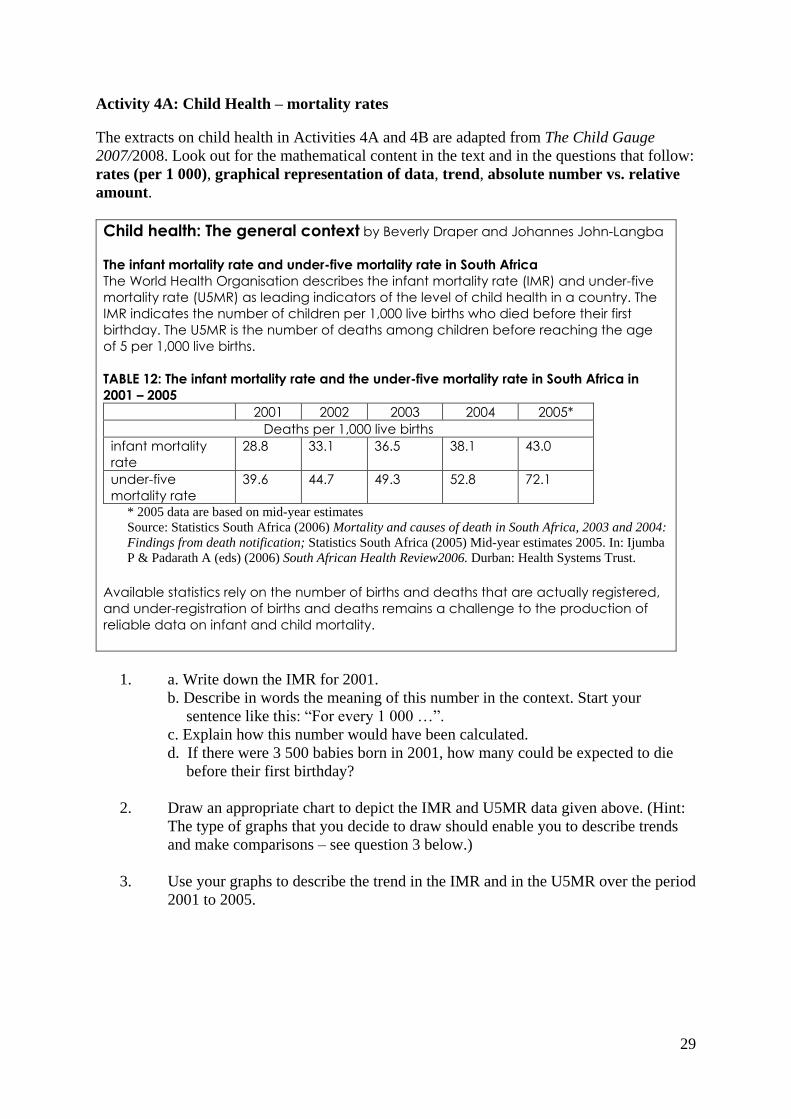
Activity 4A: Child Health – mortality rates
The extracts on child health in Activities 4A and 4B are adapted from The Child Gauge
2007/2008. Look out for the mathematical content in the text and in the questions that follow:
rates (per 1 000), graphical representation of data, trend, absolute number vs. relative
amount.
Child health: The general context by Beverly Draper and Johannes John-Langba
The infant mortality rate and under-five mortality rate in South Africa
The World Health Organisation describes the infant mortality rate (IMR) and under-five
mortality rate (U5MR) as leading indicators of the level of child health in a country. The
IMR indicates the number of children per 1,000 live births who died before their first
birthday. The U5MR is the number of deaths among children before reaching the age
of 5 per 1,000 live births.
TABLE 12: The infant mortality rate and the under-five mortality rate in South Africa in
2001 – 2005
2001 2002 2003 2004 2005*
Deaths per 1,000 live births
infant mortality
rate
28.8 33.1 36.5 38.1 43.0
under-five
mortality rate
39.6 44.7 49.3 52.8 72.1
* 2005 data are based on mid-year estimates
Source: Statistics South Africa (2006) Mortality and causes of death in South Africa, 2003 and 2004:
Findings from death notification; Statistics South Africa (2005) Mid-year estimates 2005. In: Ijumba
P & Padarath A (eds) (2006) South African Health Review2006. Durban: Health Systems Trust.
Available statistics rely on the number of births and deaths that are actually registered,
and under-registration of births and deaths remains a challenge to the production of
reliable data on infant and child mortality.
1. a. Write down the IMR for 2001.
b. Describe in words the meaning of this number in the context. Start your
sentence like this: “For every 1 000 …”.
c. Explain how this number would have been calculated.
d. If there were 3 500 babies born in 2001, how many could be expected to die
before their first birthday?
2. Draw an appropriate chart to depict the IMR and U5MR data given above. (Hint:
The type of graphs that you decide to draw should enable you to describe trends
and make comparisons – see question 3 below.)
3. Use your graphs to describe the trend in the IMR and in the U5MR over the period
2001 to 2005.
30
4. The following quote comes from the report:
“The apparent trend of rising infant and under-five mortality rates may be due to
improved registration of births and deaths. Nevertheless, it is very clear that South
Africa is not moving in a positive direction as far as infant and under-five mortality
is concerned.”
Use your graphs to explain on what evidence the statement in the last sentence
was made.
5. How many children (per 1,000 live births) died aged 1 to 4 years in 2001?
6. If there were approximately 47 300 infants who died before their first birthday in
2005, how many live births were there in that year?
7. According to a publication of the United Nations Organisation, World Population
Prospects: 2006 Revision, the IMR for South Africa in 2006 was 44.8 per 1,000
live births, whereas for Botswana it was 46.5. Does this mean that in 2006 there
were more infants under 1 year who died in Botswana than in South Africa?
Explain.
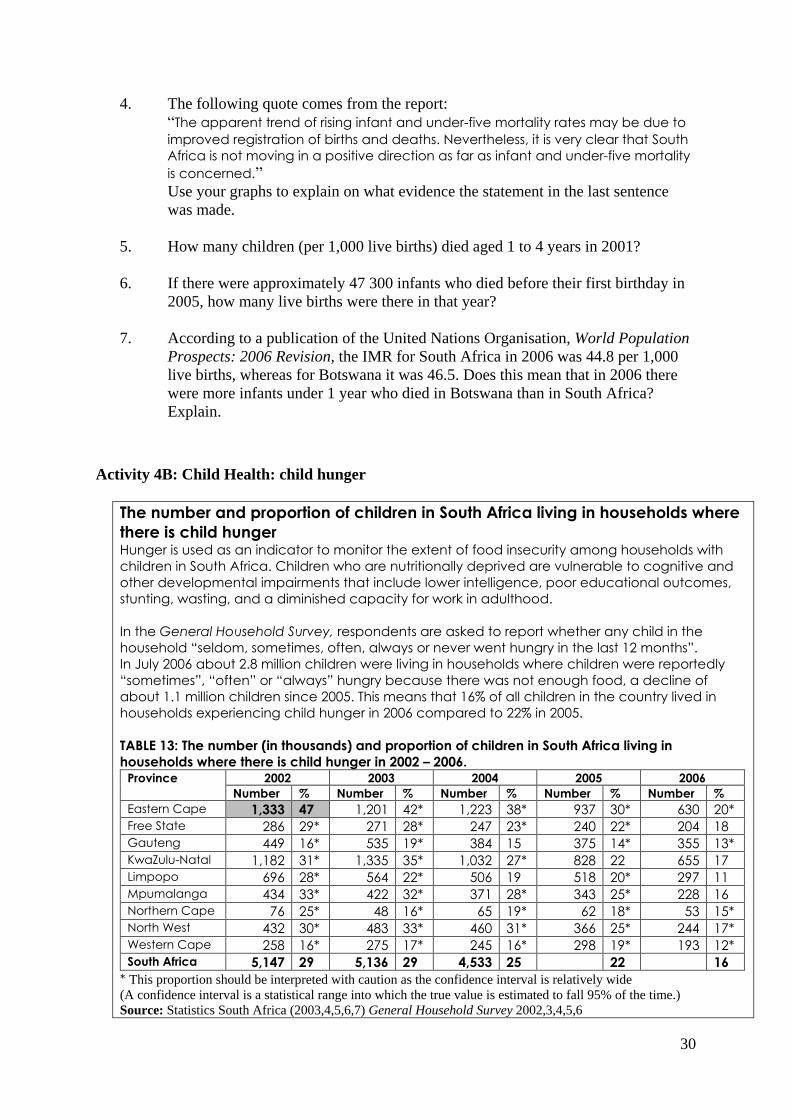
Activity 4B: Child Health: child hunger
The number and proportion of children in South Africa living in households where
there is child hunger Hunger is used as an indicator to monitor the extent of food insecurity among households with
children in South Africa. Children who are nutritionally deprived are vulnerable to cognitive and
other developmental impairments that include lower intelligence, poor educational outcomes,
stunting, wasting, and a diminished capacity for work in adulthood.
In the General Household Survey, respondents are asked to report whether any child in the
household “seldom, sometimes, often, always or never went hungry in the last 12 months”.
In July 2006 about 2.8 million children were living in households where children were reportedly
“sometimes”, “often” or “always” hungry because there was not enough food, a decline of
about 1.1 million children since 2005. This means that 16% of all children in the country lived in
households experiencing child hunger in 2006 compared to 22% in 2005.
TABLE 13: The number (in thousands) and proportion of children in South Africa living in
households where there is child hunger in 2002 – 2006. Province 2002 2003 2004 2005 2006
Number % Number % Number % Number % Number %
Eastern Cape 1,333 47 1,201 42* 1,223 38* 937 30* 630 20* Free State 286 29* 271 28* 247 23* 240 22* 204 18 Gauteng 449 16* 535 19* 384 15 375 14* 355 13* KwaZulu-Natal 1,182 31* 1,335 35* 1,032 27* 828 22 655 17 Limpopo 696 28* 564 22* 506 19 518 20* 297 11 Mpumalanga 434 33* 422 32* 371 28* 343 25* 228 16 Northern Cape 76 25* 48 16* 65 19* 62 18* 53 15* North West 432 30* 483 33* 460 31* 366 25* 244 17* Western Cape 258 16* 275 17* 245 16* 298 19* 193 12* South Africa 5,147 29 5,136 29 4,533 25 22 16
* This proportion should be interpreted with caution as the confidence interval is relatively wide
(A confidence interval is a statistical range into which the true value is estimated to fall 95% of the time.)
Source: Statistics South Africa (2003,4,5,6,7) General Household Survey 2002,3,4,5,6

31
1. Write a clear and coherent sentence that describes all the information given by the
two numbers that are highlighted in row 1 of the table.
2. In the second-last sentence in the text above the table it says
“In July 2006 about 2.8 million children were living in households where children were
reportedly “sometimes”, “often” or “always” hungry because there was not enough
food, a decline of about 1.1 million children since 2005.” Calculate the percentage change, from 2005 to 2006, in the number of children living
in households where there was not enough food.
3. A person reads the last sentence in the text and says “Oh, so there has been a 6%
decrease in number of children living in households experiencing child hunger from
2005 to 2006.”
Explain what is wrong with the wording in this statement and write a correct statement.
4. Assuming that the data in the table is accurate, find the total number of children in the
Western Cape in 2006.
5. Which province experienced the greatest decrease in the proportion of children living
in households where there is child hunger from 2002 to 2006? (In answering this
question, did you think about change in percentage points or percentage change in
proportions?)
6. Look at the data for 2005 and 2006. You will be asked to identify the province that had
the greatest percentage decrease in proportion of children living in households where
there is child hunger. You could do a percentage change calculation for each of the
nine provinces, but that is a lot of work. Just by looking at the two columns of
percentages you should be able to eliminate those that will have a small percentage
increase (hint: look at the numerators and denominators in the percentage change
calculation). Now do your three or four calculations to determine the greatest
percentage increase.
7. What does the data in the table tell you about child hunger in South Africa? Write a
short paragraph giving an overview of the situation. Remember to focus only on the
key issues related to the provinces and South Africa as a whole.
32
RECAP (After Activity 4)
Maths Content
Large numbers
reading large numbers
Percentages
one number expressed as a percentage of a whole
finding the total (100%) when given the percentage
percentage change
change in percentage points
Rates (per 1 000 and per 100 000)
calculating the rate from the actual numbers
finding the actual number from the rate
using proportiona reasoning to make comparisons (no calculations)
Change
Absolute increase (change in number) vs. relative increase (percentage change)
percentage change in proportion vs. change in percentage points
Literacies
Reading texts containing quantitative information
Working with different representations
interpreting tables (includes identifying variable)
selecting an appropriate chart (time series chart)
Writing about quantitative information (selecting appropriate data as evidence and completing given
sentences).
Relationship between text and table.
Identifying appropriate representation for data presented in a table, e.g. time series chart.
Describing trends from data in table/time series chart.
Relationship between maths content and context of prison populations/child health: How can the numbers
help us to compare the prison populations in different countries, and to compare child deaths in South
Africa over time? How can the numbers help us to understand if South Africa has made progress is
dealing with child hunger? Are the numbers an accurate reflection of the context?

33
Activity 4: Practice Exercises
Question 1: Crime statistics in South Africa [rates (per 100 000)]
Presenting crime statistics as a rate (number of crimes per 100 000 of population) is an
internationally acceptable standard, as it allows for an accurate measure of how crime rates
(e.g. for murder, assault etc.) compare over time (with changing population sizes) and across
different places (with different population sizes). Table 1 below gives crime statistics for
some categories of crimes in South Africa in 2011/12 and 2012/13*.
Crime category Total number
of reported
cases
(2011/12)
Total number
of reported
cases
(2012/13)
2011/12 rate
(per 100 000)
2012/2013 rate
(per 100 000)
sexual crimes 64 514 66 387 125.1 A
neglect and ill-
treatment of children 2 950 B 5.7 5.3
driving under the
influence of alcohol or
drugs
69 441 71 065 134.6 136.1
(a) Refer to the rate 125.1 given in bold in the table. Describe in words the meaning of this
number in the context by completing each of the following sentences:
(i) For every 100 000 …
(ii) For every 10 000 …
(iii) For every 1 000 …
(b) If the population of South Africa in 2012/13 was 52.2 million, calculate the value of A in
the table.
(c) If the population of South Africa in 2012/13 was 52.2 million, calculate the value of B in
the table.
(d) What value for the total population of South Africa was used to calculate the sexual
crimes rate for 2011/12?
(e) In which of the crime categories has there been an improvement? How does the data
support your statement?
(f) In a hypothetical crime category the number of cases increased from 21 329 in 2011/12 to
21 450 in 2012/13.
i. Calculate the respective ratios.
ii. How would you describe the change in the situation for this crime?
*Sources: Institute of Security Studies (www.issafrica.org/crimehub/hot-topics/miscalculations-in-the-2013-national-crime-ratios)
Politicsweb (www.politicsweb.co.za/politicsweb/view/politicsweb/en/page71619?oid=405840&pid=71616&sn=Detail
News24 (www.news24.com/SouthAfrica/News/FACTSHEET-SAs-201213-crime-statistics-20130920).
34
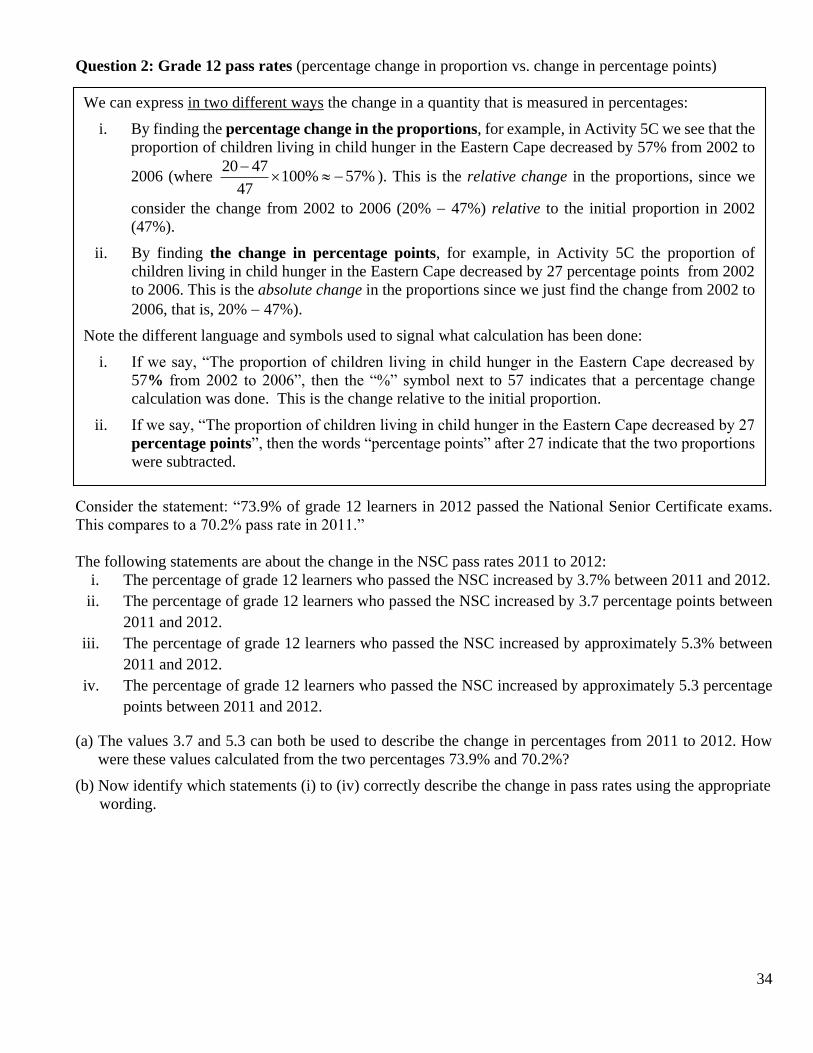
Question 2: Grade 12 pass rates (percentage change in proportion vs. change in percentage points)
Consider the statement: “73.9% of grade 12 learners in 2012 passed the National Senior Certificate exams.
This compares to a 70.2% pass rate in 2011.”
The following statements are about the change in the NSC pass rates 2011 to 2012:
i. The percentage of grade 12 learners who passed the NSC increased by 3.7% between 2011 and 2012.
ii. The percentage of grade 12 learners who passed the NSC increased by 3.7 percentage points between
2011 and 2012.
iii. The percentage of grade 12 learners who passed the NSC increased by approximately 5.3% between
2011 and 2012.
iv. The percentage of grade 12 learners who passed the NSC increased by approximately 5.3 percentage
points between 2011 and 2012.
(a) The values 3.7 and 5.3 can both be used to describe the change in percentages from 2011 to 2012. How
were these values calculated from the two percentages 73.9% and 70.2%?
(b) Now identify which statements (i) to (iv) correctly describe the change in pass rates using the appropriate
wording.
We can express in two different ways the change in a quantity that is measured in percentages:
i. By finding the percentage change in the proportions, for example, in Activity 5C we see that the
proportion of children living in child hunger in the Eastern Cape decreased by 57% from 2002 to
2006 (where %57%10047
4720
). This is the relative change in the proportions, since we
consider the change from 2002 to 2006 (20% 47%) relative to the initial proportion in 2002
(47%).
ii. By finding the change in percentage points, for example, in Activity 5C the proportion of
children living in child hunger in the Eastern Cape decreased by 27 percentage points from 2002
to 2006. This is the absolute change in the proportions since we just find the change from 2002 to
2006, that is, 20% 47%).
Note the different language and symbols used to signal what calculation has been done:
i. If we say, “The proportion of children living in child hunger in the Eastern Cape decreased by
57% from 2002 to 2006”, then the “%” symbol next to 57 indicates that a percentage change
calculation was done. This is the change relative to the initial proportion.
ii. If we say, “The proportion of children living in child hunger in the Eastern Cape decreased by 27
percentage points”, then the words “percentage points” after 27 indicate that the two proportions
were subtracted.
35
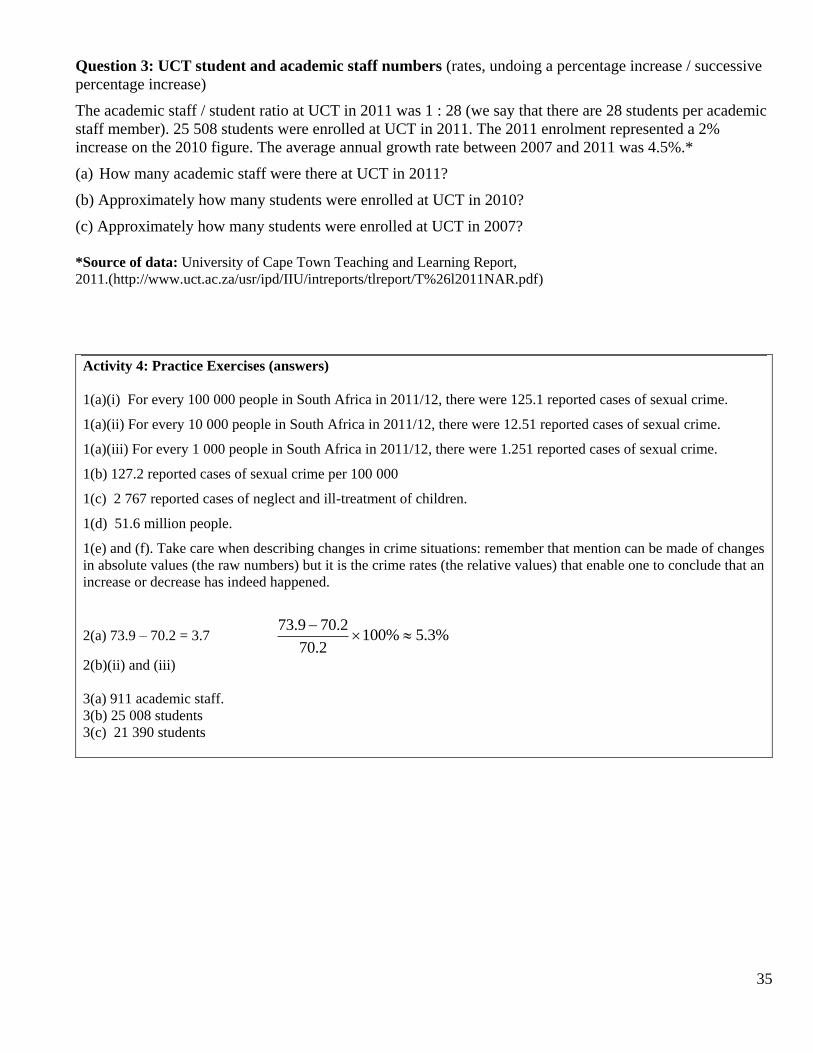
Question 3: UCT student and academic staff numbers (rates, undoing a percentage increase / successive
percentage increase)
The academic staff / student ratio at UCT in 2011 was 1 : 28 (we say that there are 28 students per academic
staff member). 25 508 students were enrolled at UCT in 2011. The 2011 enrolment represented a 2%
increase on the 2010 figure. The average annual growth rate between 2007 and 2011 was 4.5%.*
(a) How many academic staff were there at UCT in 2011?
(b) Approximately how many students were enrolled at UCT in 2010?
(c) Approximately how many students were enrolled at UCT in 2007?
*Source of data: University of Cape Town Teaching and Learning Report,
2011.(http://www.uct.ac.za/usr/ipd/IIU/intreports/tlreport/T%26l2011NAR.pdf)
Activity 4: Practice Exercises (answers)
1(a)(i) For every 100 000 people in South Africa in 2011/12, there were 125.1 reported cases of sexual crime.
1(a)(ii) For every 10 000 people in South Africa in 2011/12, there were 12.51 reported cases of sexual crime.
1(a)(iii) For every 1 000 people in South Africa in 2011/12, there were 1.251 reported cases of sexual crime.
1(b) 127.2 reported cases of sexual crime per 100 000
1(c) 2 767 reported cases of neglect and ill-treatment of children.
1(d) 51.6 million people.
1(e) and (f). Take care when describing changes in crime situations: remember that mention can be made of changes
in absolute values (the raw numbers) but it is the crime rates (the relative values) that enable one to conclude that an
increase or decrease has indeed happened.
2(a) 73.9 – 70.2 = 3.7 %3.5%1002.70
2.709.73
2(b)(ii) and (iii)
3(a) 911 academic staff.
3(b) 25 008 students
3(c) 21 390 students
36
Activity 5: Supporting poor and vulnerable children
Read the following two pieces from the Child Gauge 2007/2008: the first one is again from the ‘Budget
allocations for implementing the Children’s Act’ article and analyses one of the areas where provinces are
focusing their attention. The second one is an extract from another article entitled Making the link between
social services and social assistance by Charmaine Smith of the Children’s Institute.
The quantitative ideas that you should look out for in the text and the questions include percentage,
proportion, probability, absolute vs. relative change, percentage change, successive percentage
changes, average.
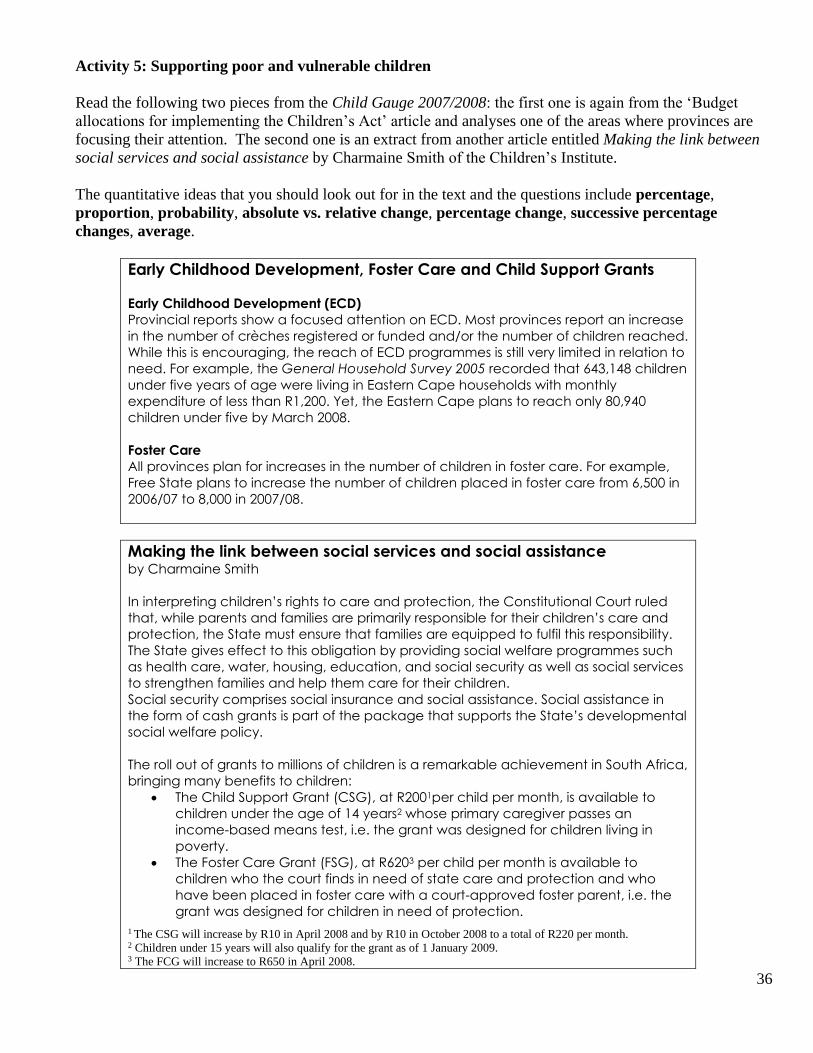
Early Childhood Development, Foster Care and Child Support Grants Early Childhood Development (ECD)
Provincial reports show a focused attention on ECD. Most provinces report an increase
in the number of crèches registered or funded and/or the number of children reached.
While this is encouraging, the reach of ECD programmes is still very limited in relation to
need. For example, the General Household Survey 2005 recorded that 643,148 children
under five years of age were living in Eastern Cape households with monthly
expenditure of less than R1,200. Yet, the Eastern Cape plans to reach only 80,940
children under five by March 2008.
Foster Care
All provinces plan for increases in the number of children in foster care. For example,
Free State plans to increase the number of children placed in foster care from 6,500 in
2006/07 to 8,000 in 2007/08.
Making the link between social services and social assistance by Charmaine Smith
In interpreting children’s rights to care and protection, the Constitutional Court ruled
that, while parents and families are primarily responsible for their children’s care and
protection, the State must ensure that families are equipped to fulfil this responsibility.
The State gives effect to this obligation by providing social welfare programmes such
as health care, water, housing, education, and social security as well as social services
to strengthen families and help them care for their children.
Social security comprises social insurance and social assistance. Social assistance in
the form of cash grants is part of the package that supports the State’s developmental
social welfare policy.
The roll out of grants to millions of children is a remarkable achievement in South Africa,
bringing many benefits to children:
The Child Support Grant (CSG), at R2001per child per month, is available to
children under the age of 14 years2 whose primary caregiver passes an
income-based means test, i.e. the grant was designed for children living in
poverty.
The Foster Care Grant (FSG), at R6203 per child per month is available to
children who the court finds in need of state care and protection and who
have been placed in foster care with a court-approved foster parent, i.e. the
grant was designed for children in need of protection.
1 The CSG will increase by R10 in April 2008 and by R10 in October 2008 to a total of R220 per month. 2 Children under 15 years will also qualify for the grant as of 1 January 2009. 3 The FCG will increase to R650 in April 2008.

37
TABLE 5: The number and proportion of children accessing the CSG, by age group for
May 2007.
Child Support Grant
Age groups Number %
0 – 5 years 2,881,467
6 – 12 years 4,170,695 52.5
13 years* 887,030 11.2
Total
7,939,192 100
* The CSG discontinues when a child turns 14 and will discontinue when a child is 15 as of January 2009
Source: Department of Social Development (2007) SOCPEN data for May 2007.
A large increase in Foster Child Grant take up
The 2000/2001 annual report of the Department of Social Development states that
49,843 children were in foster care by April 2000. In comparison, administrative data
from the department for May 2007 show that 398,068 children were receiving the FCG.
1. You wish to describe the shortfall in children under five years who are in need in of ECD in the
Eastern Cape and will not be reached by the provincial government by March 2008. Write down
two different calculations that will do this.
2. Calculate the missing percentage in TABLE 5 in two ways. Show all your workings.
3. Consider these two statements that might be made using information from the table:
a. 52.5% of all 6-12 year old children receive a CSG.
b. 52.5% of all children who receive a CSG are in the age group 6-12 years.
Say which statement is correct and explain what error was made in making the other statement.
4. What proportion of all children receiving the CSG in May 2007 were at least 6 years old?
5. What proportion of all children receiving the CSG in May 2007 were at most 12 years old?
6. What is the probability that a randomly-chosen child receiving the CSG will be aged 13 years?
7. In South Africa in 2006 there were approximately 13.2 million children who were 12 years or
younger. Use this number to calculate approximately what proportion (percentage) of all children
aged 12 years or less were receiving the CSG in May 2007.
8. The proportion of all children in South Africa who received the CSG in May 2007 was
approximately 43%. What proportion of all children in South Africa were 12 years or younger
and received the CSG? (Is this question the same as question 7? Explain.)
9. Refer to the last paragraph of the second reading. If we assume that the number of children
receiving the FCG increased at a more or less steady rate over the years, calculate the average
increase per year in number of children receiving the FCG between 2000 and 2007.
10. a. Calculate the percentage increase in the number of children receiving the FCG between
2000 and 2007.
38
b. Use your answer in a. to say how many times greater the number of children receiving the
FCG was in 2007 than in 2000.
c. Choose the statement below that best reflects the size of the increase in number of children
receiving the FCG between 2000 and 2007:
A. There was an increase of 348,225 children receiving the FCG in that period.
B. There was an increase of 699% in the number of children receiving the FCG in that period.
C. There was an increase of 348,225 children receiving the FCG, representing a 699%
increase, in that period.
11. In footnotes 1 and 3 we are told that the CSG will increase by R10 in April 2008 and that the
FCG will increase to R650 in April 2008. Write the percentage increase calculations for the CSG
and FCG in fraction form and then without actually doing the calculations say whether the
percentage increase in the CSG will be bigger than, smaller than, or equal to the percentage
increase in the FCG.
12. In footnote 3, reference is made to future increases in the CSG:
a. Calculate the percentage increase in the CSG from March 2008 to April 2008.
b. Calculate the percentage increase in the CSG from April 2008 to October 2008.
c. Now calculate the overall percentage increase in the CSG from March 2008 to October 2008.
d. Look at your answer in (c): why is it bigger than the sum of the answers in a. and b.?
RECAP (Activity 5)
Maths and Statistics content
Large numbers
reading large numbers
Comparing the size of numbers
how many times bigger and how much more (and descriptive terms like “more than”, “almost”)
one quantity as a percentage/proportion of another
Percentages
expressing one number as a percentage of another
finding percentage of a percentage
percentage change (and relationship to how many times bigger)
successive percentage increases; overall percentage increase (using growth factor)
Change
absolute (change in number) vs. relative increase (percentage change)
average change
Probabilities
Literacies
Reading texts containing quantitative information
Working with different representations
interpreting tables (includes identifying the variable)
Relationship between text and table
Relationship between mathematics and statistics content and the context of the needs of children and
government support for children. How can the numbers help us to understand the changes over time?

39
Unit 2: Finance and Growth
We will take a detour from considering the implications of implementing the Children’s Act in order to look
at some financial concepts.
1. Compound interest
First, a review of some concepts encountered previously:
a. Increasing by a percentage:
Recall that when a quantity is increased by r %, then the final value is given by:
final value = initial quantity × (1 + 𝑟
100)
The expression 1 +𝑟
100 is known as the growth factor.
(Aside: If the initial quantity is decreased by r %, then final value = initial quantity × (1 – 𝑟
100) . Now (1 –
𝑟
100) is
known as the shrinkage factor )
b. Successive percentage increases:
If a quantity is increased first by 𝑟1% and then the new quantity is increased by 𝑟2%,
final value = initial quantity × (1 + 𝑟1
100) × (1 +
𝑟2
100 )
The growth factor is now (1 + 𝑟1
100) × (1 +
𝑟2
100 )
c. Compound interest:
If a quantity is increased by r % many times, say n times, then
final value = initial quantity × (1 + 𝑟
100) × (1 +
𝑟
100) × (1 +
𝑟
100) × ….. × (1 +
𝑟
100)
This gives rise to the familiar compound interest formula:
F = P (1 + 𝑟
100) 𝑛 where F = final value and P = initial quantity

40
Section 1: Practice Exercises on percentage increase/decrease
Make sure that you use the growth factor in these calculations.
1. A shirt in a shop has a price tag of R262.00 (exclusive of VAT of 14%). What is the total cost, to the nearest
ten cents, of the shirt? So how much VAT will you pay on this shirt?
2. A T-shirt costs R79.99 (inclusive of VAT).
(a) What was the price, to the nearest ten cents, of the T-shirt, exclusive of VAT?
(b) What percentage of the marked price of R79.99 is VAT?
(c) The answer to (b) is not 14%. Explain why this is so.
3. A visitor to South Africa buys a wooden carving for R650.30 (inclusive of VAT) in a Cape Town shop. At
the airport, when leaving South Africa, the visitor gets a refund of the VAT for this purchase. How much
is this refund?
4. Consider the following statements:
Statement 1: The price of your car is 200% the price of my car.
Statement 2: The price of cars has increased by 200% in the last 10 years.
(a) Both of these statements use the value 200%, but the values that would be used in the calculations in
statements 1 and 2 are different. Explain the difference.
(b) For statement 1, say how many times more expensive your car is than mine.
(c) For statement 2, say how many times more expensive a car is now than it was 10 years ago.
5. If the number of sexual harassment cases brought to court per year has increased to 10 times what it was a
decade ago, what has been the percentage increase in the number of cases per year over the decade?
6. In an article entitled ‘Aliens take over despite human effort’ in the Mail and Guardian in August 2000, the
then Minister of Water Affairs and Forestry, Ronnie Kasrils, is quoted as saying, “Invading alien plants
are spreading and growing at an average of 5% per year – a doubling period of about 14 years. We already
need to clear over 10 million hectares of invaded land, a land area greater than the size of KwaZulu-Natal.”
Do a calculation to check that 14 years is the correct estimate for the period of time it will take the area of
land covered by aliens to become twice as large as KwaZulu-Natal.
7. A bank advertises a savings account that pays 6.4% interest per year, compounded annually. In this question
you can assume that this interest rate stays constant for the next 30 years, that no money is removed from
the account, and that interest earned is reinvested at the end of each year. Calculate, to the nearest cent, the
value of an initial investment of R2 000:
(a) after one year
(b) after two years
(c) after 10 years
(d) after 30 years.
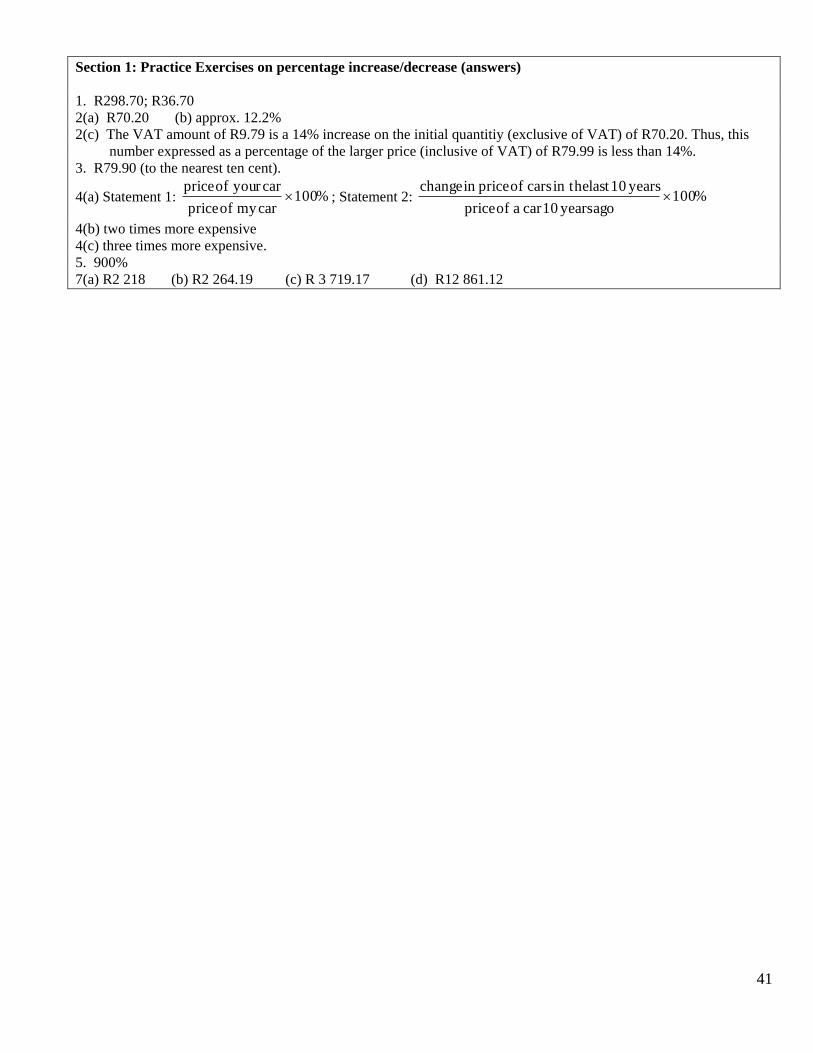
41
Section 1: Practice Exercises on percentage increase/decrease (answers)
1. R298.70; R36.70
2(a) R70.20 (b) approx. 12.2%
2(c) The VAT amount of R9.79 is a 14% increase on the initial quantitiy (exclusive of VAT) of R70.20. Thus, this
number expressed as a percentage of the larger price (inclusive of VAT) of R79.99 is less than 14%.
3. R79.90 (to the nearest ten cent).
4(a) Statement 1: %100carmy of price
caryour of price ; Statement 2: %100
ago years 10car a of price
years 10last in the cars of pricein change
4(b) two times more expensive
4(c) three times more expensive.
5. 900%
7(a) R2 218 (b) R2 264.19 (c) R 3 719.17 (d) R12 861.12
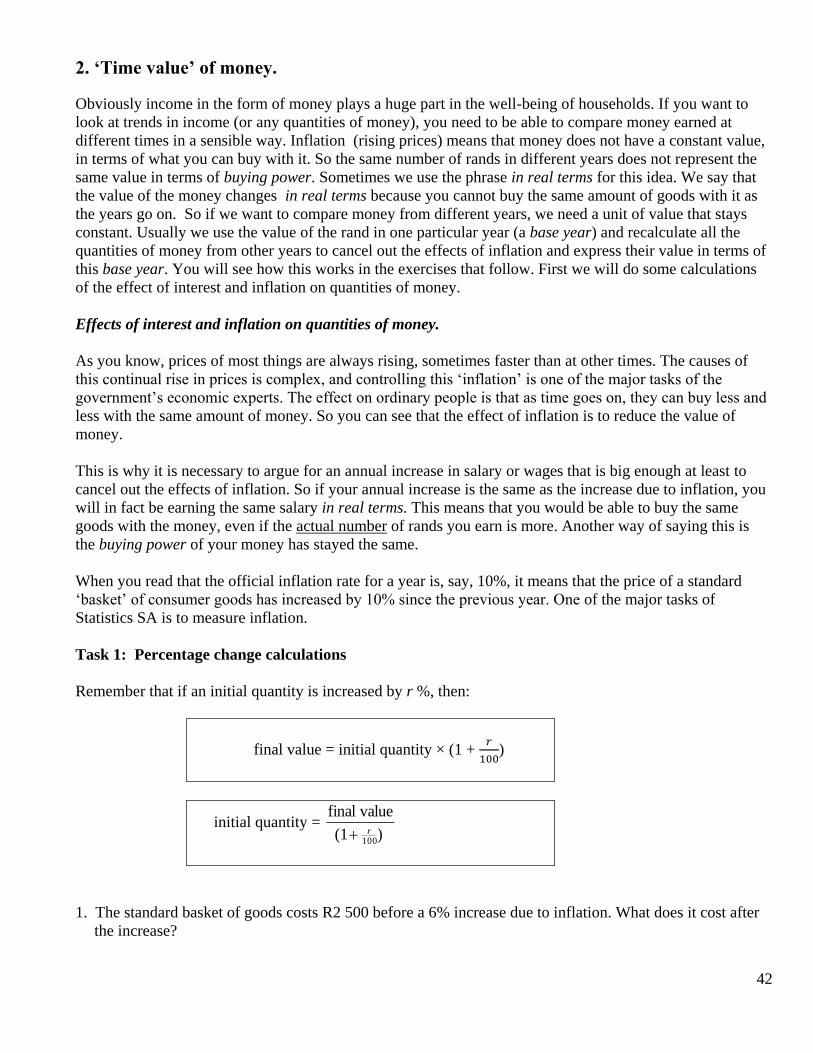
42
2. ‘Time value’ of money.
Obviously income in the form of money plays a huge part in the well-being of households. If you want to
look at trends in income (or any quantities of money), you need to be able to compare money earned at
different times in a sensible way. Inflation (rising prices) means that money does not have a constant value,
in terms of what you can buy with it. So the same number of rands in different years does not represent the
same value in terms of buying power. Sometimes we use the phrase in real terms for this idea. We say that
the value of the money changes in real terms because you cannot buy the same amount of goods with it as
the years go on. So if we want to compare money from different years, we need a unit of value that stays
constant. Usually we use the value of the rand in one particular year (a base year) and recalculate all the
quantities of money from other years to cancel out the effects of inflation and express their value in terms of
this base year. You will see how this works in the exercises that follow. First we will do some calculations
of the effect of interest and inflation on quantities of money.
Effects of interest and inflation on quantities of money.
As you know, prices of most things are always rising, sometimes faster than at other times. The causes of
this continual rise in prices is complex, and controlling this ‘inflation’ is one of the major tasks of the
government’s economic experts. The effect on ordinary people is that as time goes on, they can buy less and
less with the same amount of money. So you can see that the effect of inflation is to reduce the value of
money.
This is why it is necessary to argue for an annual increase in salary or wages that is big enough at least to
cancel out the effects of inflation. So if your annual increase is the same as the increase due to inflation, you
will in fact be earning the same salary in real terms. This means that you would be able to buy the same
goods with the money, even if the actual number of rands you earn is more. Another way of saying this is
the buying power of your money has stayed the same.
When you read that the official inflation rate for a year is, say, 10%, it means that the price of a standard
‘basket’ of consumer goods has increased by 10% since the previous year. One of the major tasks of
Statistics SA is to measure inflation.
Task 1: Percentage change calculations
Remember that if an initial quantity is increased by r %, then:
final value = initial quantity × (1 + 𝑟
100)
initial quantity = ) (1
valuefinal
100r
1. The standard basket of goods costs R2 500 before a 6% increase due to inflation. What does it cost after
the increase?
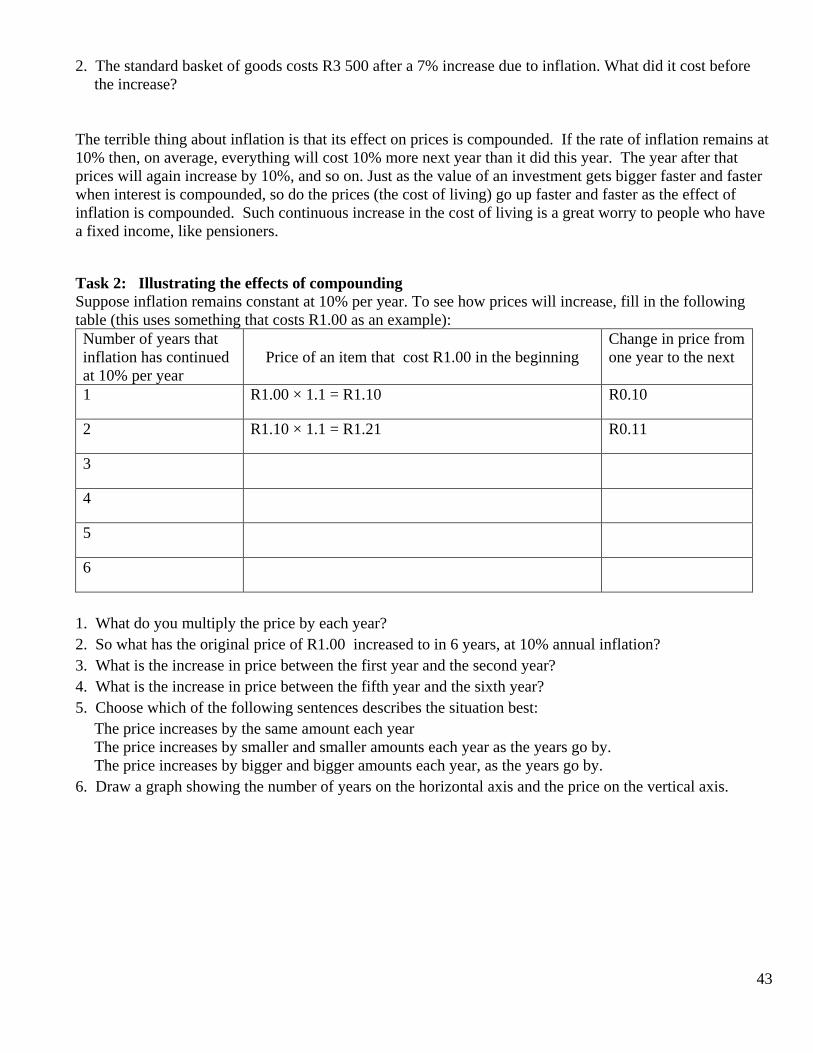
43
2. The standard basket of goods costs R3 500 after a 7% increase due to inflation. What did it cost before
the increase?
The terrible thing about inflation is that its effect on prices is compounded. If the rate of inflation remains at
10% then, on average, everything will cost 10% more next year than it did this year. The year after that
prices will again increase by 10%, and so on. Just as the value of an investment gets bigger faster and faster
when interest is compounded, so do the prices (the cost of living) go up faster and faster as the effect of
inflation is compounded. Such continuous increase in the cost of living is a great worry to people who have
a fixed income, like pensioners.
Task 2: Illustrating the effects of compounding
Suppose inflation remains constant at 10% per year. To see how prices will increase, fill in the following
table (this uses something that costs R1.00 as an example):
Number of years that
inflation has continued
at 10% per year
Price of an item that cost R1.00 in the beginning
Change in price from
one year to the next
1 R1.00 × 1.1 = R1.10 R0.10
2 R1.10 × 1.1 = R1.21 R0.11
3
4
5
6
1. What do you multiply the price by each year?
2. So what has the original price of R1.00 increased to in 6 years, at 10% annual inflation?
3. What is the increase in price between the first year and the second year?
4. What is the increase in price between the fifth year and the sixth year?
5. Choose which of the following sentences describes the situation best:
The price increases by the same amount each year
The price increases by smaller and smaller amounts each year as the years go by.
The price increases by bigger and bigger amounts each year, as the years go by.
6. Draw a graph showing the number of years on the horizontal axis and the price on the vertical axis.
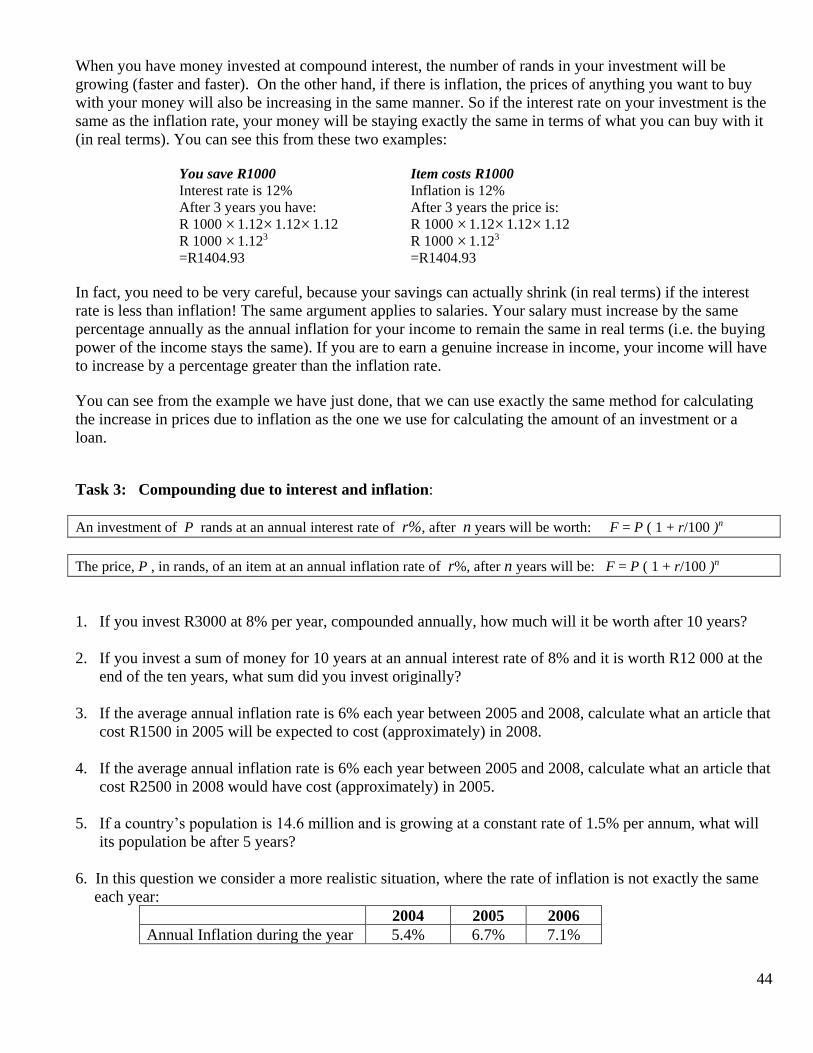
44
When you have money invested at compound interest, the number of rands in your investment will be
growing (faster and faster). On the other hand, if there is inflation, the prices of anything you want to buy
with your money will also be increasing in the same manner. So if the interest rate on your investment is the
same as the inflation rate, your money will be staying exactly the same in terms of what you can buy with it
(in real terms). You can see this from these two examples:
You save R1000 Item costs R1000
Interest rate is 12% Inflation is 12%
After 3 years you have: After 3 years the price is:
R 1000 1.121.121.12 R 1000 1.121.121.12
R 1000 1.123 R 1000 1.123
=R1404.93 =R1404.93
In fact, you need to be very careful, because your savings can actually shrink (in real terms) if the interest
rate is less than inflation! The same argument applies to salaries. Your salary must increase by the same
percentage annually as the annual inflation for your income to remain the same in real terms (i.e. the buying
power of the income stays the same). If you are to earn a genuine increase in income, your income will have
to increase by a percentage greater than the inflation rate.
You can see from the example we have just done, that we can use exactly the same method for calculating
the increase in prices due to inflation as the one we use for calculating the amount of an investment or a
loan.
Task 3: Compounding due to interest and inflation:
An investment of P rands at an annual interest rate of r%, after n years will be worth: F = P ( 1 + r/100 )n
The price, P , in rands, of an item at an annual inflation rate of r%, after n years will be: F = P ( 1 + r/100 )n
1. If you invest R3000 at 8% per year, compounded annually, how much will it be worth after 10 years?
2. If you invest a sum of money for 10 years at an annual interest rate of 8% and it is worth R12 000 at the
end of the ten years, what sum did you invest originally?
3. If the average annual inflation rate is 6% each year between 2005 and 2008, calculate what an article that
cost R1500 in 2005 will be expected to cost (approximately) in 2008.
4. If the average annual inflation rate is 6% each year between 2005 and 2008, calculate what an article that
cost R2500 in 2008 would have cost (approximately) in 2005.
5. If a country’s population is 14.6 million and is growing at a constant rate of 1.5% per annum, what will
its population be after 5 years?
6. In this question we consider a more realistic situation, where the rate of inflation is not exactly the same
each year:
2004 2005 2006
Annual Inflation during the year 5.4% 6.7% 7.1%
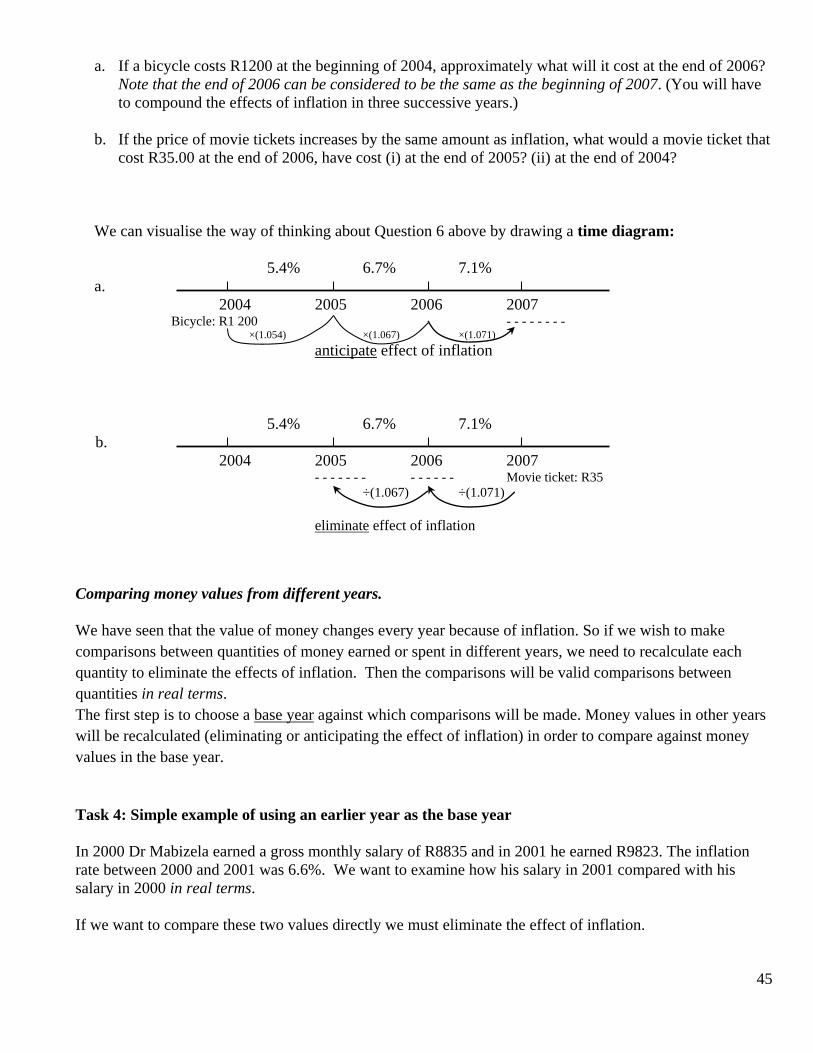
45
a. If a bicycle costs R1200 at the beginning of 2004, approximately what will it cost at the end of 2006?
Note that the end of 2006 can be considered to be the same as the beginning of 2007. (You will have
to compound the effects of inflation in three successive years.)
b. If the price of movie tickets increases by the same amount as inflation, what would a movie ticket that
cost R35.00 at the end of 2006, have cost (i) at the end of 2005? (ii) at the end of 2004?
We can visualise the way of thinking about Question 6 above by drawing a time diagram:
5.4% 6.7% 7.1%
a.
2004 2005 2006 2007 Bicycle: R1 200 - - - - - - - - ×(1.054) ×(1.067) ×(1.071)
anticipate effect of inflation
5.4% 6.7% 7.1%
b.
2004 2005 2006 2007 - - - - - - - - - - - - - Movie ticket: R35
÷(1.067) ÷(1.071)
eliminate effect of inflation
Comparing money values from different years.
We have seen that the value of money changes every year because of inflation. So if we wish to make
comparisons between quantities of money earned or spent in different years, we need to recalculate each
quantity to eliminate the effects of inflation. Then the comparisons will be valid comparisons between
quantities in real terms.
The first step is to choose a base year against which comparisons will be made. Money values in other years
will be recalculated (eliminating or anticipating the effect of inflation) in order to compare against money
values in the base year.
Task 4: Simple example of using an earlier year as the base year
In 2000 Dr Mabizela earned a gross monthly salary of R8835 and in 2001 he earned R9823. The inflation
rate between 2000 and 2001 was 6.6%. We want to examine how his salary in 2001 compared with his
salary in 2000 in real terms.
If we want to compare these two values directly we must eliminate the effect of inflation.
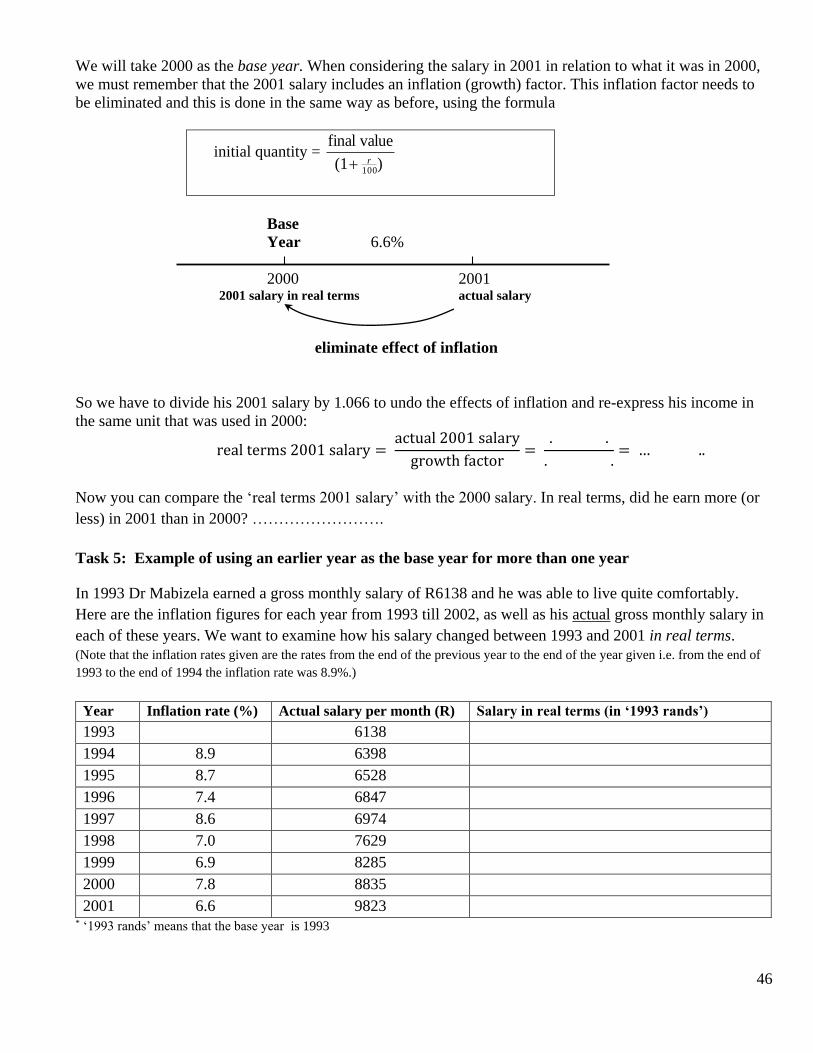
46
We will take 2000 as the base year. When considering the salary in 2001 in relation to what it was in 2000,
we must remember that the 2001 salary includes an inflation (growth) factor. This inflation factor needs to
be eliminated and this is done in the same way as before, using the formula
initial quantity = ) (1
valuefinal
100r
Base
Year 6.6%
2000 2001 2001 salary in real terms actual salary
eliminate effect of inflation
So we have to divide his 2001 salary by 1.066 to undo the effects of inflation and re-express his income in
the same unit that was used in 2000:
real terms 2001 salary = actual 2001 salary
growth factor=
. .
. .= … ..
Now you can compare the ‘real terms 2001 salary’ with the 2000 salary. In real terms, did he earn more (or
less) in 2001 than in 2000? …………………….
Task 5: Example of using an earlier year as the base year for more than one year
In 1993 Dr Mabizela earned a gross monthly salary of R6138 and he was able to live quite comfortably.
Here are the inflation figures for each year from 1993 till 2002, as well as his actual gross monthly salary in
each of these years. We want to examine how his salary changed between 1993 and 2001 in real terms.
(Note that the inflation rates given are the rates from the end of the previous year to the end of the year given i.e. from the end of
1993 to the end of 1994 the inflation rate was 8.9%.)
Year Inflation rate (%) Actual salary per month (R) Salary in real terms (in ‘1993 rands’)
1993 6138
1994 8.9 6398
1995 8.7 6528
1996 7.4 6847
1997 8.6 6974
1998 7.0 7629
1999 6.9 8285
2000 7.8 8835
2001 6.6 9823 * ‘1993 rands’ means that the base year is 1993
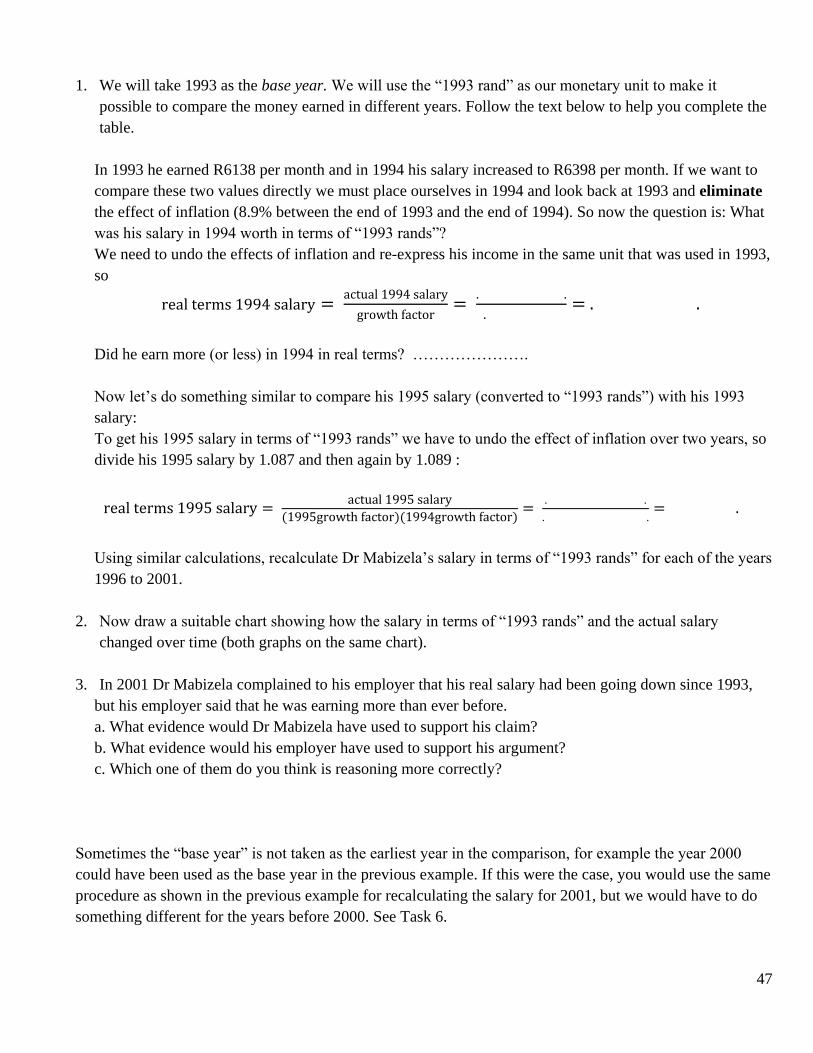
47
1. We will take 1993 as the base year. We will use the “1993 rand” as our monetary unit to make it
possible to compare the money earned in different years. Follow the text below to help you complete the
table.
In 1993 he earned R6138 per month and in 1994 his salary increased to R6398 per month. If we want to
compare these two values directly we must place ourselves in 1994 and look back at 1993 and eliminate
the effect of inflation (8.9% between the end of 1993 and the end of 1994). So now the question is: What
was his salary in 1994 worth in terms of “1993 rands”?
We need to undo the effects of inflation and re-express his income in the same unit that was used in 1993,
so
real terms 1994 salary = actual 1994 salary
growth factor=
. .
. = . .
Did he earn more (or less) in 1994 in real terms? ………………….
Now let’s do something similar to compare his 1995 salary (converted to “1993 rands”) with his 1993
salary:
To get his 1995 salary in terms of “1993 rands” we have to undo the effect of inflation over two years, so
divide his 1995 salary by 1.087 and then again by 1.089 :
real terms 1995 salary = actual 1995 salary
(1995growth factor)(1994growth factor)=
. .
. .= .
Using similar calculations, recalculate Dr Mabizela’s salary in terms of “1993 rands” for each of the years
1996 to 2001.
2. Now draw a suitable chart showing how the salary in terms of “1993 rands” and the actual salary
changed over time (both graphs on the same chart).
3. In 2001 Dr Mabizela complained to his employer that his real salary had been going down since 1993,
but his employer said that he was earning more than ever before.
a. What evidence would Dr Mabizela have used to support his claim?
b. What evidence would his employer have used to support his argument?
c. Which one of them do you think is reasoning more correctly?
Sometimes the “base year” is not taken as the earliest year in the comparison, for example the year 2000
could have been used as the base year in the previous example. If this were the case, you would use the same
procedure as shown in the previous example for recalculating the salary for 2001, but we would have to do
something different for the years before 2000. See Task 6.

48
Task 6: Using a later year as the base year
Here are the same figures as in the previous example. We want to examine how his salary changed between
1993 and 2000 in real terms, using the year 2000 as the base year.
Year Inflation rate (%) Actual salary per month (R)
(at the end of the year)
Salary in real terms (in ‘2000 rands’)
1993 6138
1994 8.9 6398
1995 8.7 6528
1996 7.4 6847
1997 8.6 6974
1998 7.0 7629
1999 6.9 8285
2000 7.8 8835
We will take 2000 as the base year. We will use the “2000 rand” as our monetary unit to make it possible to
compare the money earned in different years.
1. Follow the text below to help you complete the table.
In 2000 he earned R8835 per month and in 1999 his salary was R8285 per month. If we want to
compare these two values directly we need to look forward from 1999 to 2000 and must anticipate the
effect of inflation (7.8% between the end of 1999 and the end of 2000).
So now the question is: What was his salary in 1999 worth in terms of “2000 rands”?
When considering the salary in 1999 in relation to what it was in 2000, we must remember that the 1999
salary has not experienced inflation, so the inflation factor needs to be introduced and this is done in the
same way as before, using the formula
final value = initial quantity × (1 + 𝑟
100)
Base
7.8% Year
1999 2000 actual salary 1999 salary in real terms
anticipate effect of inflation

49
So we have to multiply his 1999 salary by 1.078 to anticipate the effects of inflation and re-express his
income in the same unit that was used in 2000:
real terms 1999 salary = actual 1999 salary × (1.078) = … … … … … ..
Now you can compare the ‘real terms 1999 salary’ with the 2000 salary. In real terms, did he earn more
(or less) in 1999 than in 2000? …………………… (How does this compare with what you found in the
previous example?)
Now let’s do something similar to compare his 1998 salary with his 2000 salary (in “2000 rand”):
To get his 1998 salary in terms of “2000 rands”, we would have to multiply his 1998 salary by 1.069
and then again by 1.078 to “anticipate” two years’ worth of inflation.
Using similar calculations, recalculate Dr Mabizela’s salary in terms of “2000 rands” for each of the
years 1993 to 1997.”
2. Now draw a suitable chart showing how the salary in terms of “2000 rands” and the actual salary
changed over time (both graphs on the same chart).
3. Does this chart tell the same story about Dr Mabizela’s salary changes as the one you drew in the
previous example? Explain.
In the previous three examples, you knew the actual number of rands earned and then recalculated them all
in terms of a base year. In the next example you will do this in reverse. You will be given the values in terms
of a given base year i.e. the ‘real terms’ values, and recalculate them to find the actual amounts in rands
earned in each year.
Task 7: calculating back to find the actual values
The table below presents values of monthly incomes in real terms for different years, using the year 2000 as
the base year.
1998 1999 2000 2001 2002
Income in terms of
“2000 rands” (real
income)
1187
999
1011
891
801
Inflation rate* (%) 6.9 5.2 5.4 5.7 9.2
Actual income
1011
*Note that the inflation rate for a given year is the percentage change in the cost of a standard basket of
goods in the preceding year. So, for example the price rose by 6.9% between 1997 and 1998.
1. Remember that in order to get the 2001 income in terms of “2000 rands” the actual income in 2001 would
have been divided by 1.057 to undo the effect of inflation (inflation was 5.7% between 2000 and 2001).
This resulted in the ‘real terms’ salary of 891.
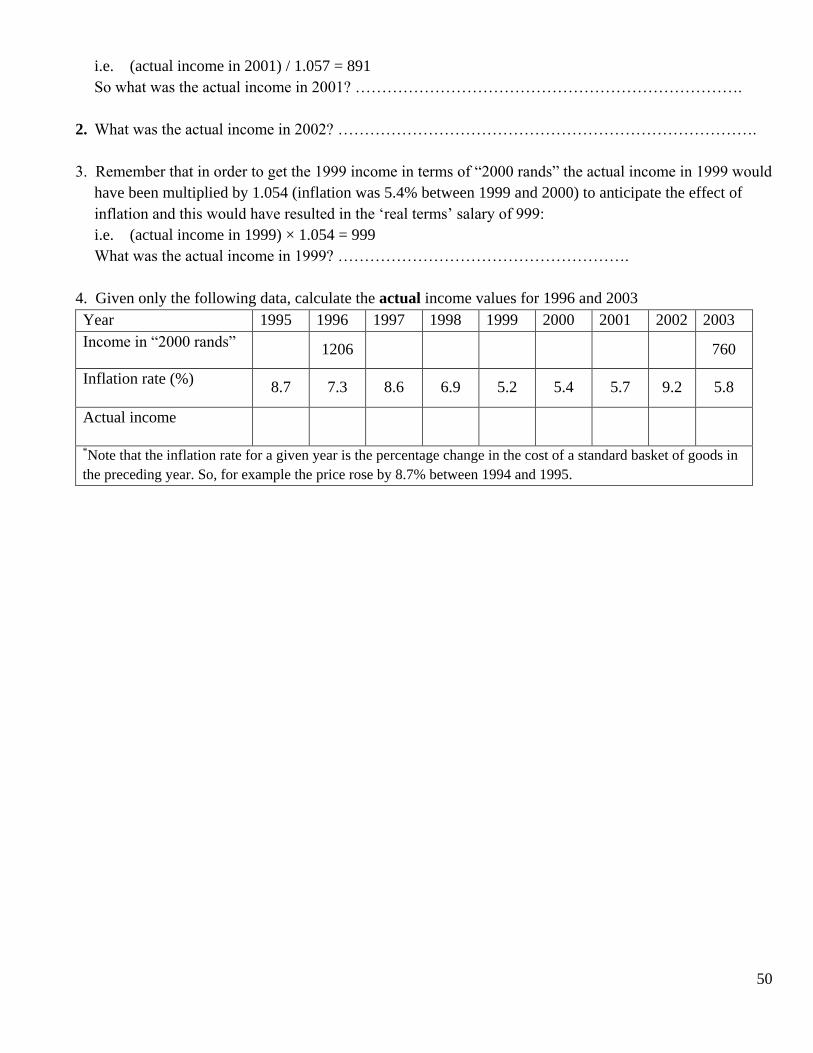
50
i.e. (actual income in 2001) / 1.057 = 891
So what was the actual income in 2001? ……………………………………………………………….
2. What was the actual income in 2002? …………………………………………………………………….
3. Remember that in order to get the 1999 income in terms of “2000 rands” the actual income in 1999 would
have been multiplied by 1.054 (inflation was 5.4% between 1999 and 2000) to anticipate the effect of
inflation and this would have resulted in the ‘real terms’ salary of 999:
i.e. (actual income in 1999) × 1.054 = 999
What was the actual income in 1999? ……………………………………………….
4. Given only the following data, calculate the actual income values for 1996 and 2003
Year 1995 1996 1997 1998 1999 2000 2001 2002 2003
Income in “2000 rands” 1206 760
Inflation rate (%) 8.7 7.3 8.6 6.9 5.2 5.4 5.7 9.2 5.8
Actual income
*Note that the inflation rate for a given year is the percentage change in the cost of a standard basket of goods in
the preceding year. So, for example the price rose by 8.7% between 1994 and 1995.
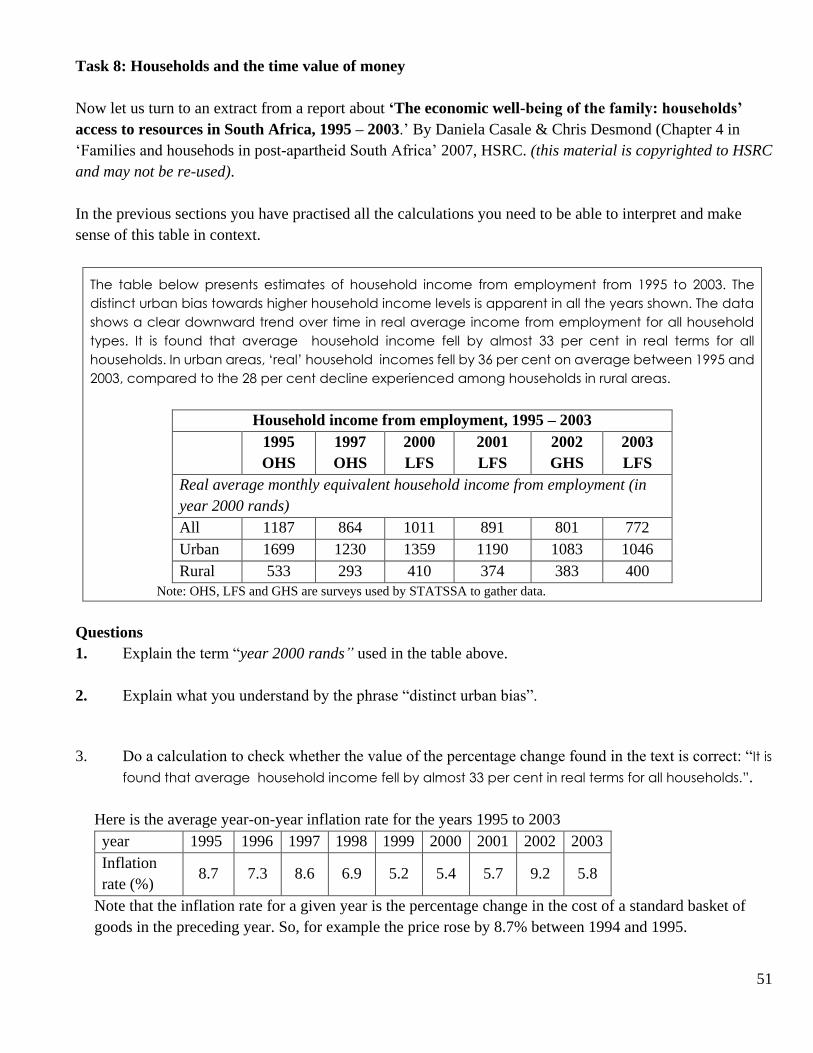
51
Task 8: Households and the time value of money
Now let us turn to an extract from a report about ‘The economic well-being of the family: households’
access to resources in South Africa, 1995 – 2003.’ By Daniela Casale & Chris Desmond (Chapter 4 in
‘Families and househods in post-apartheid South Africa’ 2007, HSRC. (this material is copyrighted to HSRC
and may not be re-used).
In the previous sections you have practised all the calculations you need to be able to interpret and make
sense of this table in context.
The table below presents estimates of household income from employment from 1995 to 2003. The
distinct urban bias towards higher household income levels is apparent in all the years shown. The data
shows a clear downward trend over time in real average income from employment for all household
types. It is found that average household income fell by almost 33 per cent in real terms for all
households. In urban areas, ‘real’ household incomes fell by 36 per cent on average between 1995 and
2003, compared to the 28 per cent decline experienced among households in rural areas.
Household income from employment, 1995 – 2003
1995
OHS
1997
OHS
2000
LFS
2001
LFS
2002
GHS
2003
LFS
Real average monthly equivalent household income from employment (in
year 2000 rands)
All 1187 864 1011 891 801 772
Urban 1699 1230 1359 1190 1083 1046
Rural 533 293 410 374 383 400
Note: OHS, LFS and GHS are surveys used by STATSSA to gather data.
Questions
1. Explain the term “year 2000 rands” used in the table above.
2. Explain what you understand by the phrase “distinct urban bias”.
3. Do a calculation to check whether the value of the percentage change found in the text is correct: “It is
found that average household income fell by almost 33 per cent in real terms for all households.”.
Here is the average year-on-year inflation rate for the years 1995 to 2003
year 1995 1996 1997 1998 1999 2000 2001 2002 2003
Inflation
rate (%) 8.7 7.3 8.6 6.9 5.2 5.4 5.7 9.2 5.8
Note that the inflation rate for a given year is the percentage change in the cost of a standard basket of
goods in the preceding year. So, for example the price rose by 8.7% between 1994 and 1995.
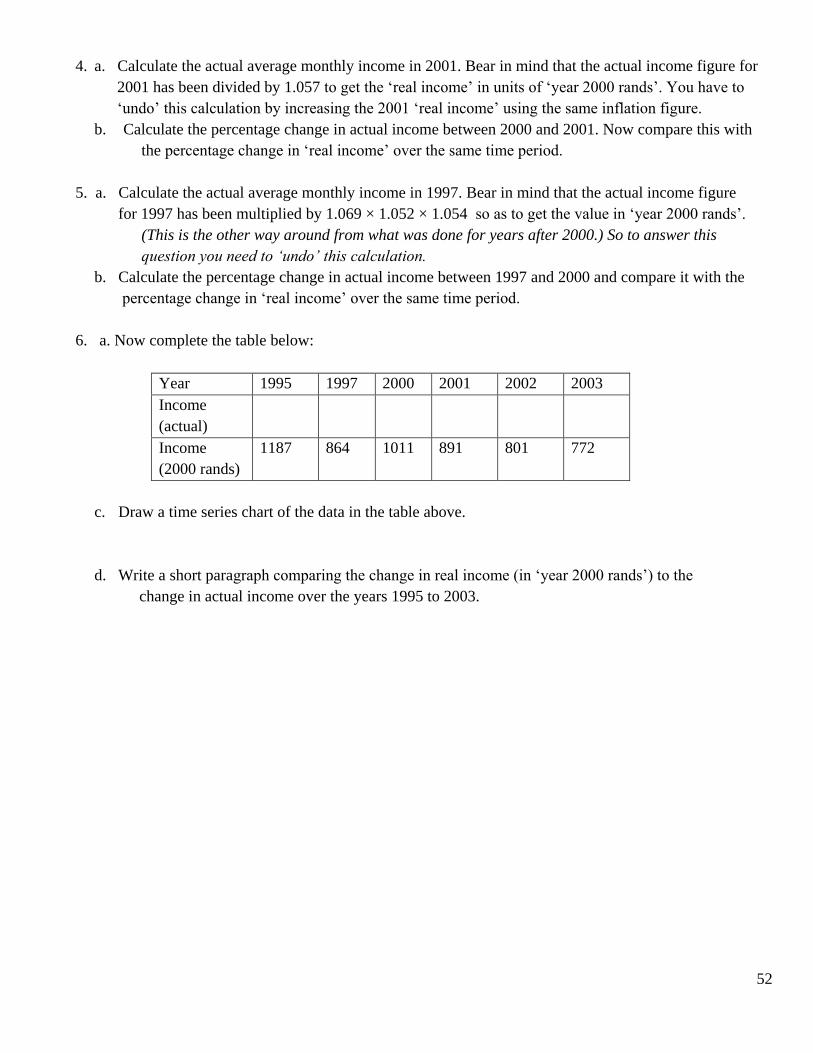
52
4. a. Calculate the actual average monthly income in 2001. Bear in mind that the actual income figure for
2001 has been divided by 1.057 to get the ‘real income’ in units of ‘year 2000 rands’. You have to
‘undo’ this calculation by increasing the 2001 ‘real income’ using the same inflation figure.
b. Calculate the percentage change in actual income between 2000 and 2001. Now compare this with
the percentage change in ‘real income’ over the same time period.
5. a. Calculate the actual average monthly income in 1997. Bear in mind that the actual income figure
for 1997 has been multiplied by 1.069 × 1.052 × 1.054 so as to get the value in ‘year 2000 rands’.
(This is the other way around from what was done for years after 2000.) So to answer this
question you need to ‘undo’ this calculation.
b. Calculate the percentage change in actual income between 1997 and 2000 and compare it with the
percentage change in ‘real income’ over the same time period.
6. a. Now complete the table below:
Year 1995 1997 2000 2001 2002 2003
Income
(actual)
Income
(2000 rands)
1187 864 1011 891 801 772
c. Draw a time series chart of the data in the table above.
d. Write a short paragraph comparing the change in real income (in ‘year 2000 rands’) to the
change in actual income over the years 1995 to 2003.

53
Section 2: Practice Exercises on ‘time value’ of money
Questions 1 and 2 are an opportunity to practise interpreting the language used for describing the time value
of money and doing the necessary calculations (increasing by a percentage or undoing a percentage increase).
Questions 3 and 4 contain texts that use the concepts of “real” and “actual” value of money.
Note: In Questions 1 and 2 you will convert from actual values to real values for a particular base year.
Question 3(h) requires that you convert from real values to actual values. We’ll leave it for you to decide what
to do in Question 4.
Question 1
For the last few years you have been receiving a bursary from a sponsor that pays your fees and provides you
with some pocket money. You think that recently your bursary hasn’t covered as much as it did in the past, so
you have collected some data about the inflation rates over the last few years to help compare the value of the
bursary over time.
2005 2006 2007 2008
Actual value of
bursary R29 000 R31 000 R33 000 R35 000
Year-on-year
inflation rate
6.7% 7.1% 8.4%
Real value of bursary
(in “2006 rands”)
(a) Use 2006 as the base year to calculate the value of the bursary in the other years in real terms. Write
your answers in the spaces provided in the table.
(b) You wish to communicate your findings to your sponsor. Write a few sentences that will summarise
your findings about whether the increases in your allowance over time have been below, in line with, or
above inflation.
Question 2
The table below presents the actual monthly income of a family for the years from 2003 to 2006 and the
inflation rates for the years ending 31 December 2003, 2004 and 2005.
2003 2004 2005 2006
Monthly income 639 767 921 1 300
Inflation rate (%) 9.9 5.9 4.5
(a) Using 2004 as the base year, calculate the 2003 monthly income in real terms.
(b) Using 2004 as the base year, calculate the 2006 monthly income in real terms.
(c) Describe, using data to support your statement, the change (if any) in the family’s buying power
from 2004 to 2006.
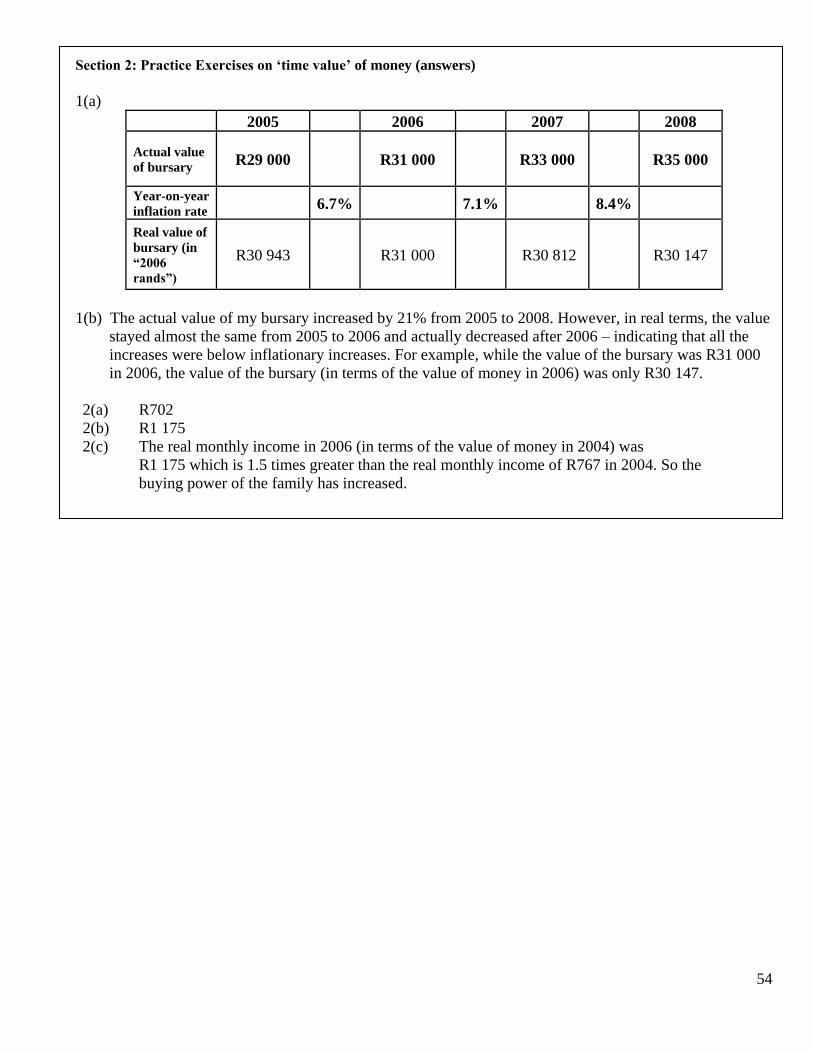
54
Section 2: Practice Exercises on ‘time value’ of money (answers)
1(a)
2005 2006 2007 2008
Actual value
of bursary R29 000 R31 000 R33 000 R35 000
Year-on-year
inflation rate 6.7% 7.1% 8.4%
Real value of
bursary (in
“2006
rands”)
R30 943 R31 000 R30 812 R30 147
1(b) The actual value of my bursary increased by 21% from 2005 to 2008. However, in real terms, the value
stayed almost the same from 2005 to 2006 and actually decreased after 2006 – indicating that all the
increases were below inflationary increases. For example, while the value of the bursary was R31 000
in 2006, the value of the bursary (in terms of the value of money in 2006) was only R30 147.
2(a) R702
2(b) R1 175
2(c) The real monthly income in 2006 (in terms of the value of money in 2004) was
R1 175 which is 1.5 times greater than the real monthly income of R767 in 2004. So the
buying power of the family has increased.
55
3. Compound interest with different compounding periods
The previous examples illustrated situations where interest was compounded annually. What happens when
compounding is not annual?
Banks often advertise interest rates for savings accounts with interest being compounded over other periods
of time such as: daily, monthly, quarterly, etc.
We still use the formula for compound interest that we had before, except that n will now represent the
number of days, months, quarters (or years) i.e. the number of investment periods, and the value of r will be
the daily, monthly, quarterly (or annual) interest rate respectively.
The important thing is that the frequency of the compounding and the time period for the interest rate must
be the same: if r is a quarterly, half-yearly, monthly or daily interest rate, then n will have to be measured in
quarters, half-years, months or days. n and r must be compatible.
After n investment periods (e.g. days, months or quarters) at a corresponding interest rate (daily, monthly or
quarterly), the initial investment will have grown according to the formula
F = P (1 + 𝑟
100) 𝑛 , where F = final value and P = initial quantity
How does this work in practice?
If the bank advertises its interest rate as 9% p.a. compounded monthly, this really (in effect) means that the
interest rate that is applied monthly is calculated from the stated (nominal) rate of 9% divided by 12.
So the effective rate, which will be applied monthly, is 9%
12=0.75% .
In general, the effective rate per period is found by dividing the nominal rate by
the number of compoundings that are done in ONE year.
Remember that when you use any interest rate in the formula, it must be expressed as a decimal!
Example. What will your investment be worth after 3 years, if you invest R600 at 8% p.a. with quarterly
compoundings?
First find the effective quarterly rate: there are 4 quarters in one year, so divide the nominal rate by 4:
𝑟 = 0.08
4= 0.02
Since the interest is compounded quarterly, the total investment period must be converted to quarters:
3 years = 3 × 4 quarters. So n = 12
Thus, F = P (1 + 𝑟
100) 𝑛 = 600(1 + 0.02) 12 = 760.95

56
4. Equivalent Effective Interest Rates
Consider two investments of R100, each invested for one year, but at different banks: Bank A and Bank B.
Calculate the future value of the investment in each case.
Bank A: R100 is invested for one year at 12.68% p.a.
𝐹 = 𝑃(1 +𝑟
100)𝑛 = 100(1 +
…..
100)…. =
Bank B: R100 is invested for one year at 12% p.a. compounded monthly. (Remember that this means 1%
per month, and remember also that n and r must be compatible, so n must be in months.)
𝐹 = 𝑃(1 +𝑟
100)𝑛 = 100(1 +
…..
100)…. =
Notice that the result is the same for both banks. This means that the interest rate of 12.68% p.a. has the same
effect on the investment as the interest rate of 12% p.a. compounded monthly. So these two rates are called
equivalent effective rates.
How to find an equivalent effective rate.
In order to make meaningful comparisons between different interest rates it is usual to find the annual effective
rate that is equivalent to a given rate. If, in the above example, you did not know the annual effective rate, it
could be found by rewriting the growth factor for the given monthly rate over 12 months as follows:
(1 +1
100)12 = 1.12682503 = 1 + 0.12682503 = (1 + 0.12682503)1
Since all the above expressions are equal you can see that the monthly rate of 1% (or 12% p.a. compounded
monthly) is equivalent to the annual rate of 12.682503%.
You can do a similar calculation to show that the interest rate of 10% p.a. compounded quarterly is
equivalent to the annual rate of 10.38%.
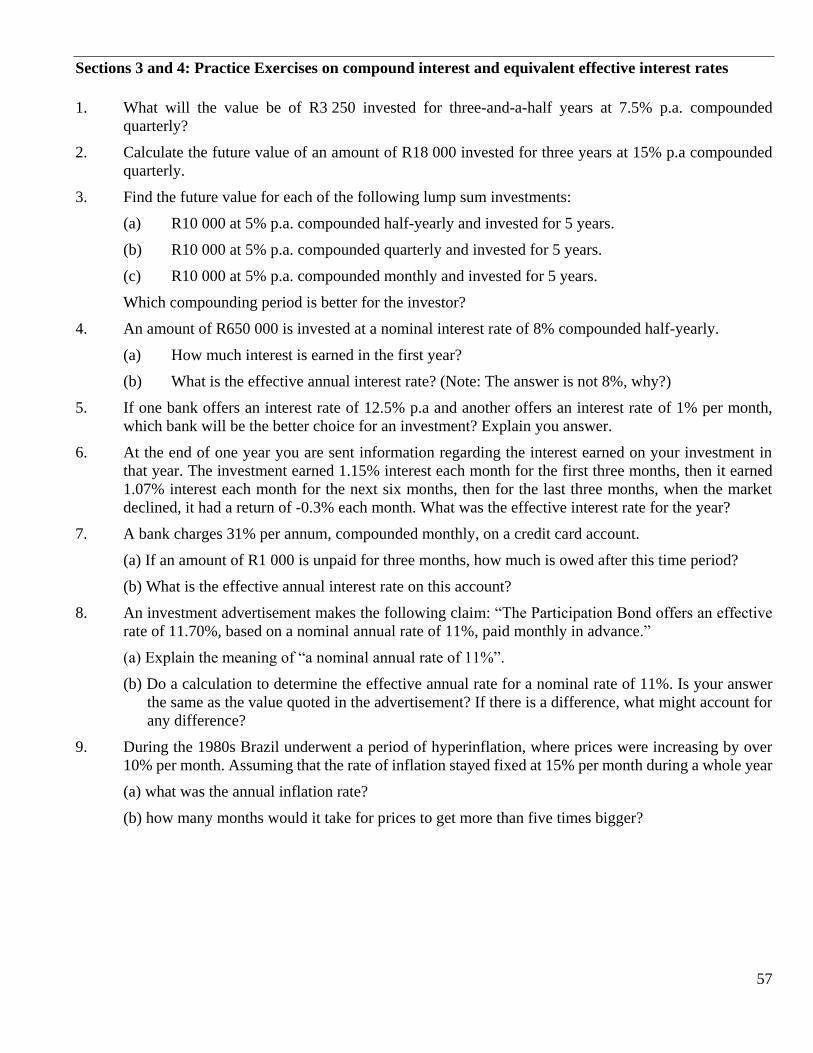
57
Sections 3 and 4: Practice Exercises on compound interest and equivalent effective interest rates
1. What will the value be of R3 250 invested for three-and-a-half years at 7.5% p.a. compounded
quarterly?
2. Calculate the future value of an amount of R18 000 invested for three years at 15% p.a compounded
quarterly.
3. Find the future value for each of the following lump sum investments:
(a) R10 000 at 5% p.a. compounded half-yearly and invested for 5 years.
(b) R10 000 at 5% p.a. compounded quarterly and invested for 5 years.
(c) R10 000 at 5% p.a. compounded monthly and invested for 5 years.
Which compounding period is better for the investor?
4. An amount of R650 000 is invested at a nominal interest rate of 8% compounded half-yearly.
(a) How much interest is earned in the first year?
(b) What is the effective annual interest rate? (Note: The answer is not 8%, why?)
5. If one bank offers an interest rate of 12.5% p.a and another offers an interest rate of 1% per month,
which bank will be the better choice for an investment? Explain you answer.
6. At the end of one year you are sent information regarding the interest earned on your investment in
that year. The investment earned 1.15% interest each month for the first three months, then it earned
1.07% interest each month for the next six months, then for the last three months, when the market
declined, it had a return of -0.3% each month. What was the effective interest rate for the year?
7. A bank charges 31% per annum, compounded monthly, on a credit card account.
(a) If an amount of R1 000 is unpaid for three months, how much is owed after this time period?
(b) What is the effective annual interest rate on this account?
8. An investment advertisement makes the following claim: “The Participation Bond offers an effective
rate of 11.70%, based on a nominal annual rate of 11%, paid monthly in advance.”
(a) Explain the meaning of “a nominal annual rate of 11%”.
(b) Do a calculation to determine the effective annual rate for a nominal rate of 11%. Is your answer
the same as the value quoted in the advertisement? If there is a difference, what might account for
any difference?
9. During the 1980s Brazil underwent a period of hyperinflation, where prices were increasing by over
10% per month. Assuming that the rate of inflation stayed fixed at 15% per month during a whole year
(a) what was the annual inflation rate?
(b) how many months would it take for prices to get more than five times bigger?
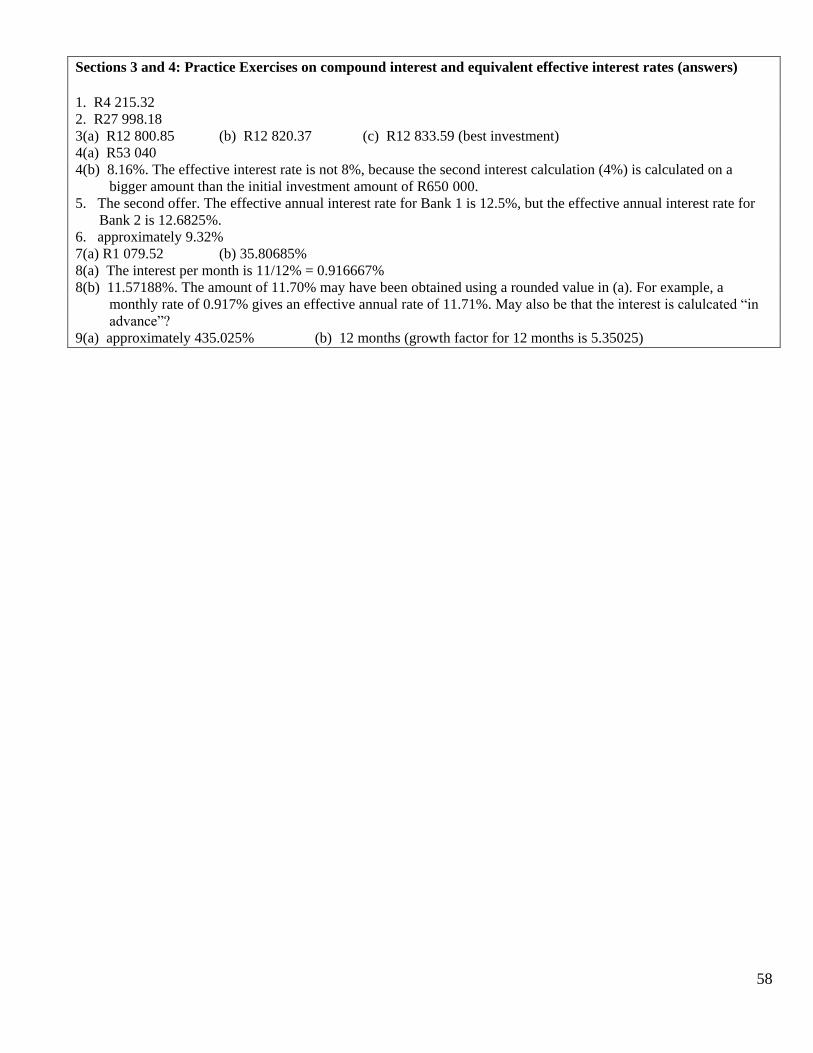
58
Sections 3 and 4: Practice Exercises on compound interest and equivalent effective interest rates (answers)
1. R4 215.32
2. R27 998.18
3(a) R12 800.85 (b) R12 820.37 (c) R12 833.59 (best investment)
4(a) R53 040
4(b) 8.16%. The effective interest rate is not 8%, because the second interest calculation (4%) is calculated on a
bigger amount than the initial investment amount of R650 000.
5. The second offer. The effective annual interest rate for Bank 1 is 12.5%, but the effective annual interest rate for
Bank 2 is 12.6825%.
6. approximately 9.32%
7(a) R1 079.52 (b) 35.80685%
8(a) The interest per month is 11/12% = 0.916667%
8(b) 11.57188%. The amount of 11.70% may have been obtained using a rounded value in (a). For example, a
monthly rate of 0.917% gives an effective annual rate of 11.71%. May also be that the interest is calulcated “in
advance”?
9(a) approximately 435.025% (b) 12 months (growth factor for 12 months is 5.35025)
59
Unit 3: Prisons in South Africa
In this unit we will read extracts from a report about overcrowding of prisons in South Africa:
Giffard, C and Muntingh, L. (2006) The Effect of sentencing on the size of the South African prison
population. Open Society Foundation for South Africa, Newlands, SA
The focus in this unit will be on use of language in describing quantitative ideas.
Here is a list of the mathematical content that you will encounter in this unit.
Mathematical content Relative sizes of numbers and quantities
Fractions, ratio and proportion
Percentages: absolute number vs. percentage, calculating a percentage
Change: rate of change, absolute change, percentage change, change in percentage points
Different graphical representations of data (tables, bar charts, pie charts, line chart)
Area of a square and a rectangle
Glossary of terms:
Sentenced prisoner – a person who is in jail serving a jail term that has been decided by a court of law as the
outcome of their trial for a crime.
Unsentenced prisoner – a person who is in jail because they are accused of a crime, but their case has not yet
come to court. They have not yet been (and may not even be) sentenced to a jail term.
Long-term prisoner – a prisoner who is serving a jail term of more than 7 years.
Remission – a reduction of a jail term that a prisoner is serving.
Amnesty – a complete cancelling out of a person’s sentence for a crime.
Minimum sentences – legally-specified minimum jail terms that must be imposed for specified crimes.
"Zonderwater Prison-001" by Paul Parsons ([email protected]) - Paul Parsons
([email protected]). Licensed under CC BY-SA 3.0 via Commons -
https://commons.wikimedia.org/wiki/File:Zonderwater_Prison-001.jpg#/media/File:Zonderwater_Prison-001.jpg
60
Activity 1:
In this activity you will be looking at the many ways in which the mathematical idea of change can be
described using language. The quantitative ideas encountered here include absolute vs relative size,
absolute vs relative change, rate of change, graphical representation.
I. Before you read the extract, here is an exercise on assessing the validity of statements about
proportions. Consider this statement from the extract about prisoners in South African prisons in
2005:
“Prisoners serving longer sentences make up an increasing proportion of the prisoner population”.
Which of the following conclusions (based only on this statement) are valid?
A. There are increasing numbers of prisoners with longer sentences.
B. There are increasing numbers of prisoners in total.
C. The fraction of the prison population that is serving longer sentences is increasing.
D. There are decreasing numbers of unsentenced prisoners and prisoners with shorter sentences.
E. The ratio of short-term and unsentenced prisoners to long-term prisoners is decreasing.
II. Now read this extract from the beginning of the report and answer the questions below.
Executive Summary South Africa has a serious prison overcrowding problem. The total number of prisoners has grown steadily
and dramatically over the last 11 years. The cause of the increase has changed during this time. Between
1995 and 2000, the major reason that the prison population was rising was the massive increase in the
number of unsentenced prisoners. After 2000, the number of unsentenced prisoners stabilised, and then
began to decrease. But the prisoner population continued to grow, now as a result of an increase in the
number of sentenced prisoners. This growth continues, despite the fact that the number of offenders sent to
prison is decreasing. The bulk of this increase consists of prisoners serving long sentences. Thus, the rate of
release of sentenced prisoners is slowing down.
Prisoners serving longer sentences make up an increasing proportion of the prisoner population.
Mathematical projections show that the longer sentences are driving up the total prisoner population
rapidly. These projections suggest that, if current trends are maintained, the growth in the number of long-
term prisoners will increase the prison population to over 226 000 by 2015. Half of these will be prisoners
serving sentences of between 10 and 20 years, 15% will be serving more than 20 years and about 90% will be
serving sentences longer than 7 years.
Questions
1. For each of the following statements from the text, choose the three statements that you think are most
accurately expressing the same idea:
a. “The total number of prisoners has grown steadily ….”
A. The total number of prisoners has become more and more …
B. There has been a continuous increase in the total number of prisoners …
C. The total number of prisoners has increased consistently ….
D. The total number of prisoners has increased at a constant rate …
E. There has been a fairly constant growth in the total number of prisoners …
F. The total number of prisoners has grown faster and faster …
61
b. “After 2000, the number of unsentenced prisoners stabilised.”
A. After 2000, the number of unsentenced prisoners stopped changing and then stayed roughly
the same.
B. After 2000 the number of unsentenced prisoners was the same.
C. After 2000 the increase in the number of unsentenced prisoners became constant.
D. There were only small changes in the number of unsentenced prisoners after 2000.
E. After 2000 there were fewer unsentenced prisoners put in jail than before.
F. The number of unsentenced prisoners was relatively constant after 2000.
c. “The rate of release of sentenced prisoners is slowing down.”
A. The number of sentenced prisoners who are being released each year is decreasing.
B. The prisons have stopped releasing sentenced prisoners.
C. Fewer and fewer sentenced prisoners are being released each year.
D. The release rate for sentenced prisoners is negative.
E. The prisons are releasing sentenced prisoners at a decreasing rate.
F. Fewer sentenced prisoners are being released.
3. Explain how it is possible that the prison population continues to grow even though the number of
offenders admitted to prison is decreasing.
4. What does it mean to say that “the longer sentences are driving up the total prisoner population rapidly”?
5. What is a “mathematical projection”?
6. Using information in the last sentence, sketch a pie chart showing the projected composition of the prison
population in 2015, broken down into four categories based on length of prison sentence. (Do this on a
large piece of paper so that it can be displayed on the board)
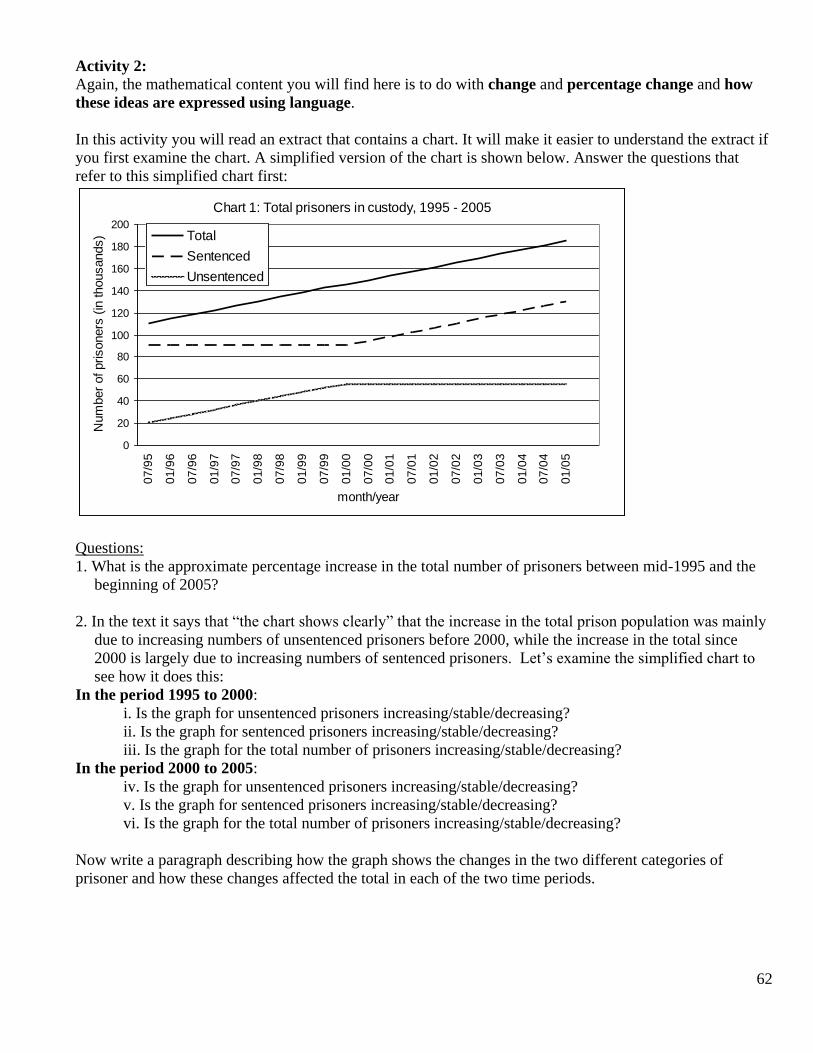
62
Activity 2:
Again, the mathematical content you will find here is to do with change and percentage change and how
these ideas are expressed using language.
In this activity you will read an extract that contains a chart. It will make it easier to understand the extract if
you first examine the chart. A simplified version of the chart is shown below. Answer the questions that
refer to this simplified chart first:
Questions:
1. What is the approximate percentage increase in the total number of prisoners between mid-1995 and the
beginning of 2005?
2. In the text it says that “the chart shows clearly” that the increase in the total prison population was mainly
due to increasing numbers of unsentenced prisoners before 2000, while the increase in the total since
2000 is largely due to increasing numbers of sentenced prisoners. Let’s examine the simplified chart to
see how it does this:
In the period 1995 to 2000:
i. Is the graph for unsentenced prisoners increasing/stable/decreasing?
ii. Is the graph for sentenced prisoners increasing/stable/decreasing?
iii. Is the graph for the total number of prisoners increasing/stable/decreasing?
In the period 2000 to 2005:
iv. Is the graph for unsentenced prisoners increasing/stable/decreasing?
v. Is the graph for sentenced prisoners increasing/stable/decreasing?
vi. Is the graph for the total number of prisoners increasing/stable/decreasing?
Now write a paragraph describing how the graph shows the changes in the two different categories of
prisoner and how these changes affected the total in each of the two time periods.
Chart 1: Total prisoners in custody, 1995 - 2005
0
20
40
60
80
100
120
140
160
180
200
07
/95
01
/96
07
/96
01
/97
07
/97
01
/98
07
/98
01
/99
07
/99
01
/00
07
/00
01
/01
07
/01
01
/02
07
/02
01
/03
07
/03
01
/04
07
/04
01
/05
month/year
Num
ber
of prisoners
(in
thousands) Total
Sentenced
Unsentenced
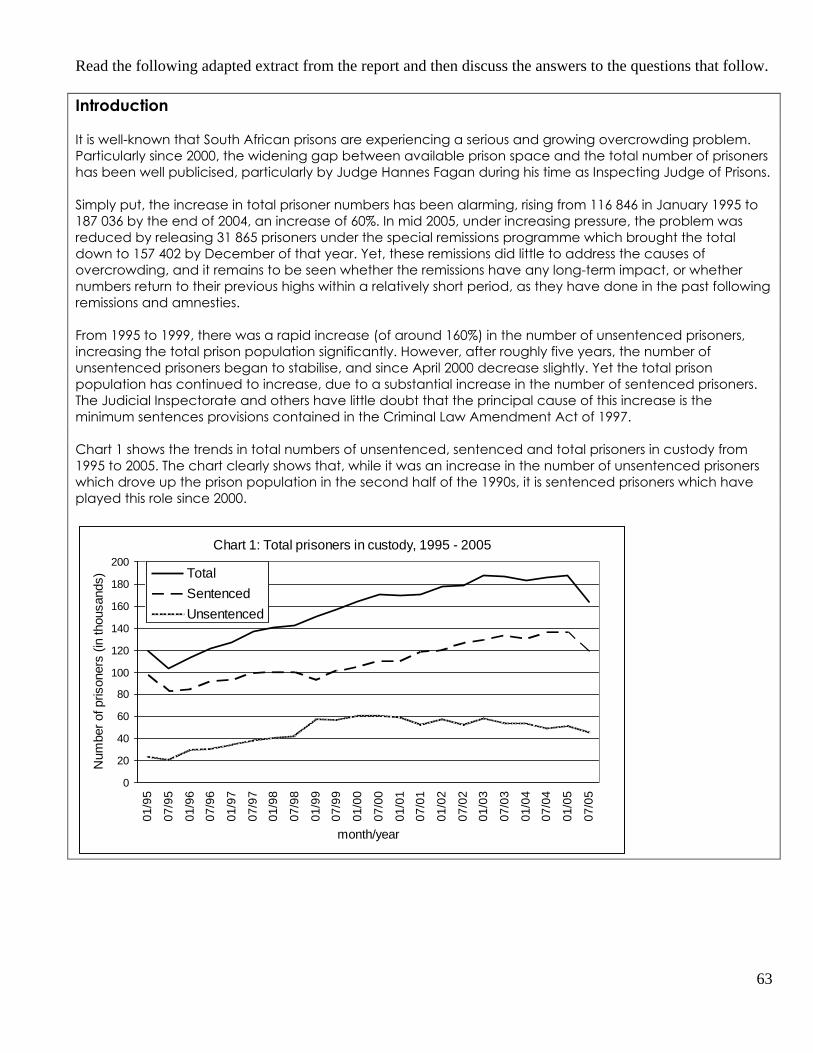
63
Read the following adapted extract from the report and then discuss the answers to the questions that follow.
Introduction
It is well-known that South African prisons are experiencing a serious and growing overcrowding problem.
Particularly since 2000, the widening gap between available prison space and the total number of prisoners
has been well publicised, particularly by Judge Hannes Fagan during his time as Inspecting Judge of Prisons.
Simply put, the increase in total prisoner numbers has been alarming, rising from 116 846 in January 1995 to
187 036 by the end of 2004, an increase of 60%. In mid 2005, under increasing pressure, the problem was
reduced by releasing 31 865 prisoners under the special remissions programme which brought the total
down to 157 402 by December of that year. Yet, these remissions did little to address the causes of
overcrowding, and it remains to be seen whether the remissions have any long-term impact, or whether
numbers return to their previous highs within a relatively short period, as they have done in the past following
remissions and amnesties.
From 1995 to 1999, there was a rapid increase (of around 160%) in the number of unsentenced prisoners,
increasing the total prison population significantly. However, after roughly five years, the number of
unsentenced prisoners began to stabilise, and since April 2000 decrease slightly. Yet the total prison
population has continued to increase, due to a substantial increase in the number of sentenced prisoners.
The Judicial Inspectorate and others have little doubt that the principal cause of this increase is the
minimum sentences provisions contained in the Criminal Law Amendment Act of 1997.
Chart 1 shows the trends in total numbers of unsentenced, sentenced and total prisoners in custody from
1995 to 2005. The chart clearly shows that, while it was an increase in the number of unsentenced prisoners
which drove up the prison population in the second half of the 1990s, it is sentenced prisoners which have
played this role since 2000.
Chart 1: Total prisoners in custody, 1995 - 2005
0
20
40
60
80
100
120
140
160
180
200
01
/95
07
/95
01
/96
07
/96
01
/97
07
/97
01
/98
07
/98
01
/99
07
/99
01
/00
07
/00
01
/01
07
/01
01
/02
07
/02
01
/03
07
/03
01
/04
07
/04
01
/05
07
/05
month/year
Num
ber
of prisoners
(in
thousands) Total
Sentenced
Unsentenced

64
Activity 2 Questions (continued):
3. Confirm that the increase in total prisoner population between January 1995 and the end of 2004 was in fact
60%.
4. What was the percentage decrease in the total number of prisoners as a result of the remissions in 2005?
5. “From 1995 to 1999, there was a rapid increase (of around 160%) in the number of unsentenced prisoners.”
Which of the following four statements is/are true?
A. The number of unsentenced prisoners was 1,6 times more in 1999 than in 1995.
B. The number of unsentenced prisoners more than doubled between 1995 and 1999.
C. The number of unsentenced prisoners increased by 160 percentage points between 1995 and 1999.
D. The number of unsentenced prisoners was 2,6 times more in 1999 than in 1995.
6. At the end of the third paragraph it says that the principal cause of the increase in the total number of
prisoners “is the minimum sentences provisions contained in the Criminal Law Amendment Act of 1997”.
Explain how introducing a law that specifies minimum sentences for various crimes could cause the
increase in the total number of prisoners.
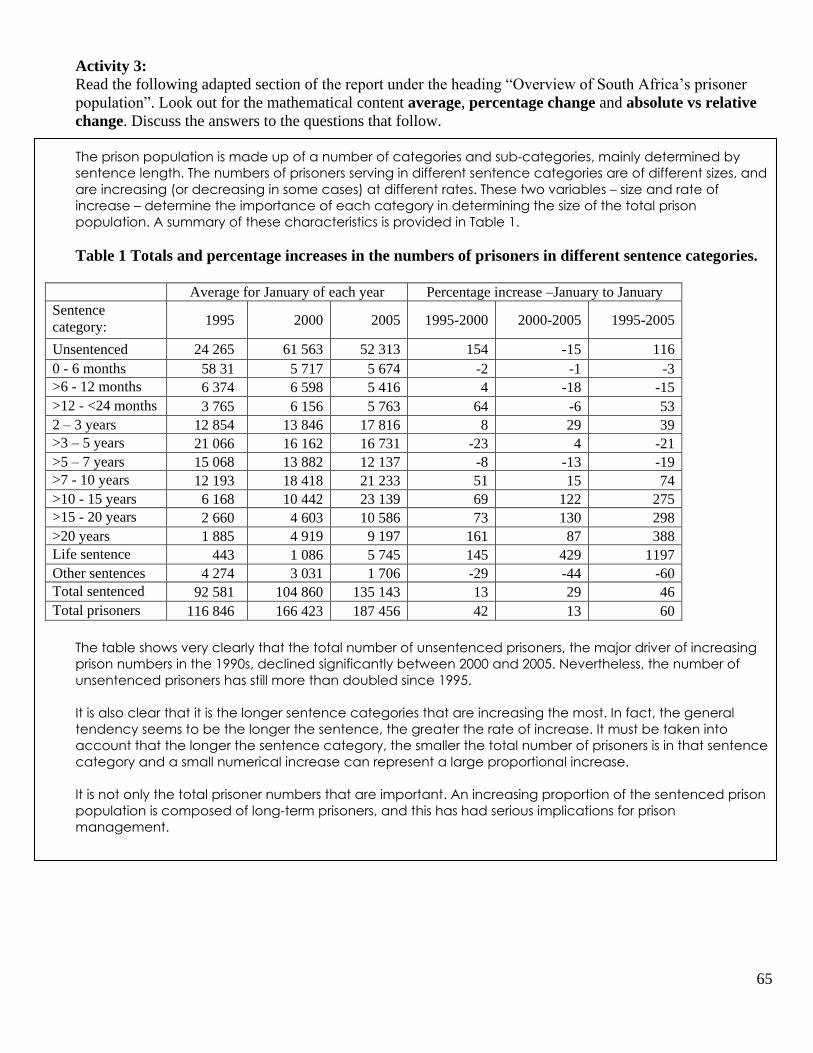
65
Activity 3:
Read the following adapted section of the report under the heading “Overview of South Africa’s prisoner
population”. Look out for the mathematical content average, percentage change and absolute vs relative
change. Discuss the answers to the questions that follow.
The prison population is made up of a number of categories and sub-categories, mainly determined by
sentence length. The numbers of prisoners serving in different sentence categories are of different sizes, and
are increasing (or decreasing in some cases) at different rates. These two variables – size and rate of
increase – determine the importance of each category in determining the size of the total prison
population. A summary of these characteristics is provided in Table 1.
Table 1 Totals and percentage increases in the numbers of prisoners in different sentence categories.
Average for January of each year Percentage increase –January to January
Sentence
category: 1995 2000 2005 1995-2000 2000-2005 1995-2005
Unsentenced 24 265 61 563 52 313 154 -15 116
0 - 6 months 58 31 5 717 5 674 -2 -1 -3
>6 - 12 months 6 374 6 598 5 416 4 -18 -15
>12 - <24 months 3 765 6 156 5 763 64 -6 53
2 – 3 years 12 854 13 846 17 816 8 29 39
>3 – 5 years 21 066 16 162 16 731 -23 4 -21
>5 – 7 years 15 068 13 882 12 137 -8 -13 -19
>7 - 10 years 12 193 18 418 21 233 51 15 74
>10 - 15 years 6 168 10 442 23 139 69 122 275
>15 - 20 years 2 660 4 603 10 586 73 130 298
>20 years 1 885 4 919 9 197 161 87 388
Life sentence 443 1 086 5 745 145 429 1197
Other sentences 4 274 3 031 1 706 -29 -44 -60
Total sentenced 92 581 104 860 135 143 13 29 46
Total prisoners 116 846 166 423 187 456 42 13 60
The table shows very clearly that the total number of unsentenced prisoners, the major driver of increasing
prison numbers in the 1990s, declined significantly between 2000 and 2005. Nevertheless, the number of
unsentenced prisoners has still more than doubled since 1995.
It is also clear that it is the longer sentence categories that are increasing the most. In fact, the general
tendency seems to be the longer the sentence, the greater the rate of increase. It must be taken into
account that the longer the sentence category, the smaller the total number of prisoners is in that sentence
category and a small numerical increase can represent a large proportional increase.
It is not only the total prisoner numbers that are important. An increasing proportion of the sentenced prison
population is composed of long-term prisoners, and this has had serious implications for prison
management.
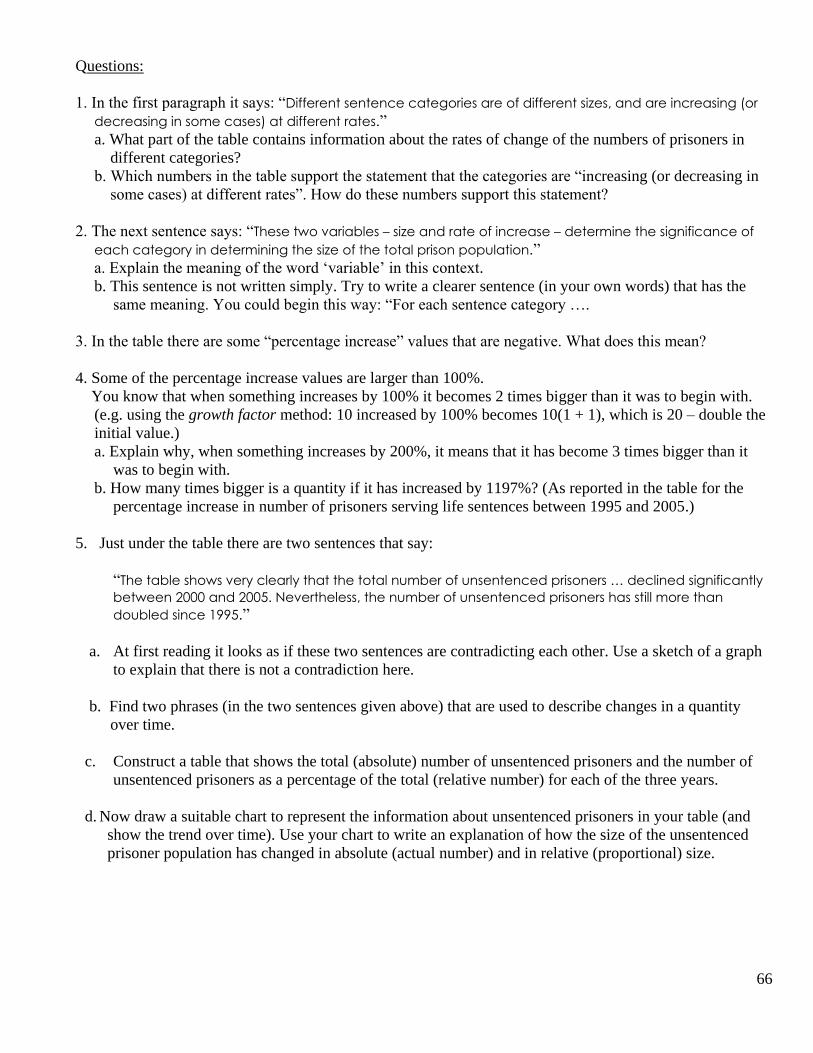
66
Questions:
1. In the first paragraph it says: “Different sentence categories are of different sizes, and are increasing (or
decreasing in some cases) at different rates.”
a. What part of the table contains information about the rates of change of the numbers of prisoners in
different categories?
b. Which numbers in the table support the statement that the categories are “increasing (or decreasing in
some cases) at different rates”. How do these numbers support this statement?
2. The next sentence says: “These two variables – size and rate of increase – determine the significance of
each category in determining the size of the total prison population.”
a. Explain the meaning of the word ‘variable’ in this context.
b. This sentence is not written simply. Try to write a clearer sentence (in your own words) that has the
same meaning. You could begin this way: “For each sentence category ….
3. In the table there are some “percentage increase” values that are negative. What does this mean?
4. Some of the percentage increase values are larger than 100%.
You know that when something increases by 100% it becomes 2 times bigger than it was to begin with.
(e.g. using the growth factor method: 10 increased by 100% becomes 10(1 + 1), which is 20 – double the
initial value.)
a. Explain why, when something increases by 200%, it means that it has become 3 times bigger than it
was to begin with.
b. How many times bigger is a quantity if it has increased by 1197%? (As reported in the table for the
percentage increase in number of prisoners serving life sentences between 1995 and 2005.)
5. Just under the table there are two sentences that say:
“The table shows very clearly that the total number of unsentenced prisoners … declined significantly
between 2000 and 2005. Nevertheless, the number of unsentenced prisoners has still more than
doubled since 1995.”
a. At first reading it looks as if these two sentences are contradicting each other. Use a sketch of a graph
to explain that there is not a contradiction here.
b. Find two phrases (in the two sentences given above) that are used to describe changes in a quantity
over time.
c. Construct a table that shows the total (absolute) number of unsentenced prisoners and the number of
unsentenced prisoners as a percentage of the total (relative number) for each of the three years.
d. Now draw a suitable chart to represent the information about unsentenced prisoners in your table (and
show the trend over time). Use your chart to write an explanation of how the size of the unsentenced
prisoner population has changed in absolute (actual number) and in relative (proportional) size.
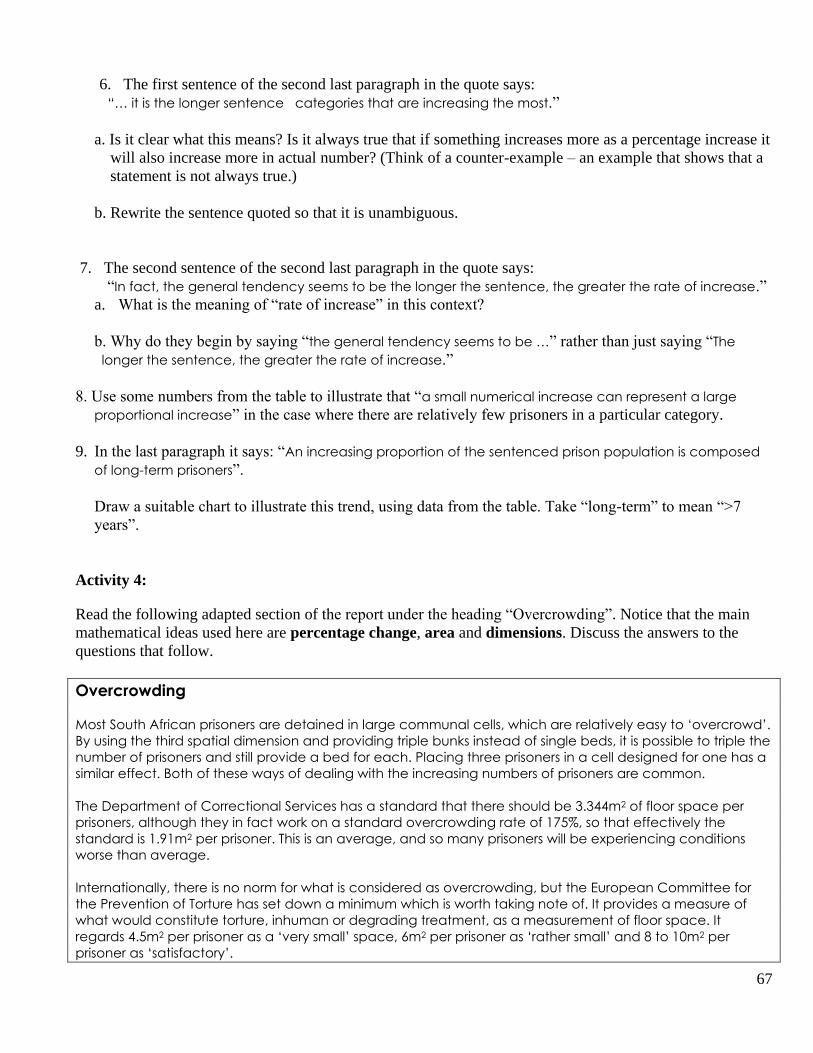
67
6. The first sentence of the second last paragraph in the quote says:
“… it is the longer sentence categories that are increasing the most.”
a. Is it clear what this means? Is it always true that if something increases more as a percentage increase it
will also increase more in actual number? (Think of a counter-example – an example that shows that a
statement is not always true.)
b. Rewrite the sentence quoted so that it is unambiguous.
7. The second sentence of the second last paragraph in the quote says:
“In fact, the general tendency seems to be the longer the sentence, the greater the rate of increase.”
a. What is the meaning of “rate of increase” in this context?
b. Why do they begin by saying “the general tendency seems to be …” rather than just saying “The
longer the sentence, the greater the rate of increase.”
8. Use some numbers from the table to illustrate that “a small numerical increase can represent a large
proportional increase” in the case where there are relatively few prisoners in a particular category.
9. In the last paragraph it says: “An increasing proportion of the sentenced prison population is composed
of long-term prisoners”.
Draw a suitable chart to illustrate this trend, using data from the table. Take “long-term” to mean “>7
years”.
Activity 4:
Read the following adapted section of the report under the heading “Overcrowding”. Notice that the main
mathematical ideas used here are percentage change, area and dimensions. Discuss the answers to the
questions that follow.
Overcrowding
Most South African prisoners are detained in large communal cells, which are relatively easy to ‘overcrowd’.
By using the third spatial dimension and providing triple bunks instead of single beds, it is possible to triple the
number of prisoners and still provide a bed for each. Placing three prisoners in a cell designed for one has a
similar effect. Both of these ways of dealing with the increasing numbers of prisoners are common.
The Department of Correctional Services has a standard that there should be 3.344m2 of floor space per
prisoners, although they in fact work on a standard overcrowding rate of 175%, so that effectively the
standard is 1.91m2 per prisoner. This is an average, and so many prisoners will be experiencing conditions
worse than average.
Internationally, there is no norm for what is considered as overcrowding, but the European Committee for
the Prevention of Torture has set down a minimum which is worth taking note of. It provides a measure of
what would constitute torture, inhuman or degrading treatment, as a measurement of floor space. It
regards 4.5m2 per prisoner as a ‘very small’ space, 6m2 per prisoner as ‘rather small’ and 8 to 10m2 per
prisoner as ‘satisfactory’.
68
Questions:
1. What is the meaning of the phrase “By using the third spatial dimension …”
2. Do a calculation to confirm that 175% overcrowding (using the Department of Correctional Services’ way
of calculating overcrowding – see previous activity) would reduce the standard floor space from 3.344m2
to 1.91m2 per prisoner.
3. Work out the side length of a square that has an approximate area of 1.91m2. Now mark out this area on
the floor (using string). Stand in this square and think about living in a space where this is all that is
allocated to you. Do you think that every prisoner in a prison where there is 1.9m2 per prisoner will be
confined to a space this size at all times of the day?
4. Measure approximately the length and breadth of the room you are in and calculate the floor area. Now
calculate how many prisoners the Department would regard it as acceptable to have living in this room
(allowing for 175% overcrowding). Now consider that for about half of all prisoners, there is less space
than this. Why can we say this?
5. Do you think the South African standard for floor area per prisoner would be acceptable to the European
Committee for the Prevention of Torture? Why or why not?
___________________________________________________________________________________