Embed Size (px)
Citation preview
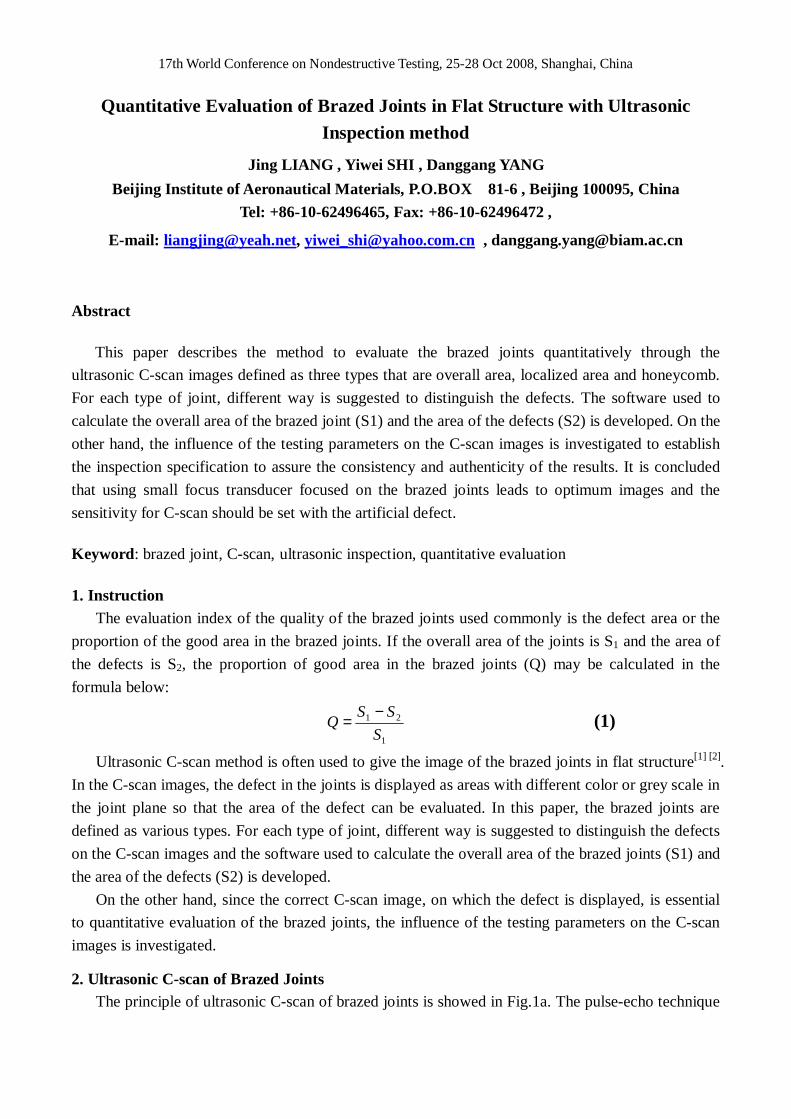
17th World Conference on Nondestructive Testing, 25-28 Oct 2008, Shanghai, China
Quantitative Evaluation of Brazed Joints in Flat Structure with Ultrasonic
Inspection method
Jing LIANG , Yiwei SHI , Danggang YANG
Beijing Institute of Aeronautical Materials, P.O.BOX 81-6 , Beijing 100095, China Tel: +86-10-62496465, Fax: +86-10-62496472 ,
E-mail: [email protected], [email protected] , [email protected]
Abstract
This paper describes the method to evaluate the brazed joints quantitatively through the
ultrasonic C-scan images defined as three types that are overall area, localized area and honeycomb.
For each type of joint, different way is suggested to distinguish the defects. The software used to
calculate the overall area of the brazed joint (S1) and the area of the defects (S2) is developed. On the
other hand, the influence of the testing parameters on the C-scan images is investigated to establish
the inspection specification to assure the consistency and authenticity of the results. It is concluded
that using small focus transducer focused on the brazed joints leads to optimum images and the
sensitivity for C-scan should be set with the artificial defect.
Keyword: brazed joint, C-scan, ultrasonic inspection, quantitative evaluation
1. Instruction
The evaluation index of the quality of the brazed joints used commonly is the defect area or the
proportion of the good area in the brazed joints. If the overall area of the joints is S1 and the area of
the defects is S2, the proportion of good area in the brazed joints (Q) may be calculated in the
formula below:
1
21
S
SSQ
−= (1)
Ultrasonic C-scan method is often used to give the image of the brazed joints in flat structure[1] [2].
In the C-scan images, the defect in the joints is displayed as areas with different color or grey scale in
the joint plane so that the area of the defect can be evaluated. In this paper, the brazed joints are
defined as various types. For each type of joint, different way is suggested to distinguish the defects
on the C-scan images and the software used to calculate the overall area of the brazed joints (S1) and
the area of the defects (S2) is developed.
On the other hand, since the correct C-scan image, on which the defect is displayed, is essential
to quantitative evaluation of the brazed joints, the influence of the testing parameters on the C-scan
images is investigated.
2. Ultrasonic C-scan of Brazed Joints The principle of ultrasonic C-scan of brazed joints is showed in Fig.1a. The pulse-echo technique
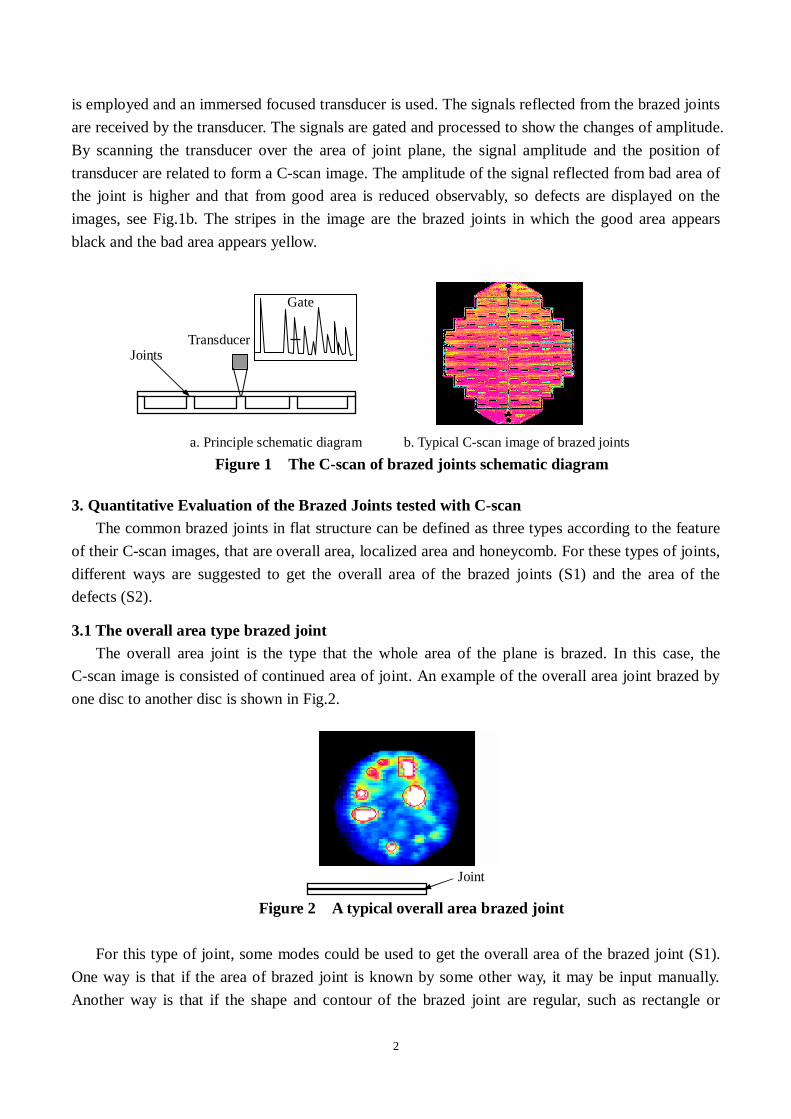
2
is employed and an immersed focused transducer is used. The signals reflected from the brazed joints
are received by the transducer. The signals are gated and processed to show the changes of amplitude.
By scanning the transducer over the area of joint plane, the signal amplitude and the position of
transducer are related to form a C-scan image. The amplitude of the signal reflected from bad area of
the joint is higher and that from good area is reduced observably, so defects are displayed on the
images, see Fig.1b. The stripes in the image are the brazed joints in which the good area appears
black and the bad area appears yellow.
a. Principle schematic diagram b. Typical C-scan image of brazed joints
Figure 1 The C-scan of brazed joints schematic diagram
3. Quantitative Evaluation of the Brazed Joints tested with C-scan The common brazed joints in flat structure can be defined as three types according to the feature
of their C-scan images, that are overall area, localized area and honeycomb. For these types of joints,
different ways are suggested to get the overall area of the brazed joints (S1) and the area of the
defects (S2).
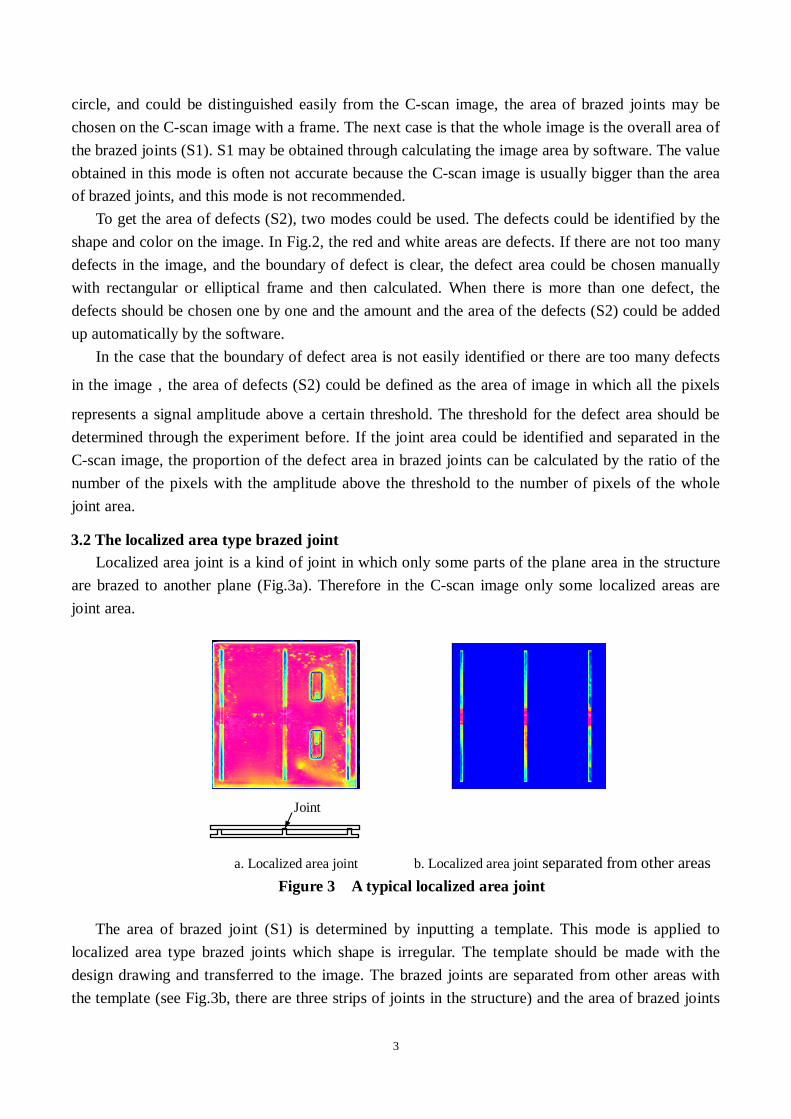
3.1 The overall area type brazed joint The overall area joint is the type that the whole area of the plane is brazed. In this case, the
C-scan image is consisted of continued area of joint. An example of the overall area joint brazed by
one disc to another disc is shown in Fig.2.
Figure 2 A typical overall area brazed joint
For this type of joint, some modes could be used to get the overall area of the brazed joint (S1).
One way is that if the area of brazed joint is known by some other way, it may be input manually.
Another way is that if the shape and contour of the brazed joint are regular, such as rectangle or
Joints Transducer
Gate
Joint
3
circle, and could be distinguished easily from the C-scan image, the area of brazed joints may be
chosen on the C-scan image with a frame. The next case is that the whole image is the overall area of
the brazed joints (S1). S1 may be obtained through calculating the image area by software. The value
obtained in this mode is often not accurate because the C-scan image is usually bigger than the area
of brazed joints, and this mode is not recommended.
To get the area of defects (S2), two modes could be used. The defects could be identified by the
shape and color on the image. In Fig.2, the red and white areas are defects. If there are not too many
defects in the image, and the boundary of defect is clear, the defect area could be chosen manually
with rectangular or elliptical frame and then calculated. When there is more than one defect, the
defects should be chosen one by one and the amount and the area of the defects (S2) could be added
up automatically by the software.
In the case that the boundary of defect area is not easily identified or there are too many defects
in the image,the area of defects (S2) could be defined as the area of image in which all the pixels
represents a signal amplitude above a certain threshold. The threshold for the defect area should be
determined through the experiment before. If the joint area could be identified and separated in the
C-scan image, the proportion of the defect area in brazed joints can be calculated by the ratio of the
number of the pixels with the amplitude above the threshold to the number of pixels of the whole
joint area.
3.2 The localized area type brazed joint Localized area joint is a kind of joint in which only some parts of the plane area in the structure
are brazed to another plane (Fig.3a). Therefore in the C-scan image only some localized areas are
joint area.
a. Localized area joint b. Localized area joint separated from other areas
Figure 3 A typical localized area joint
The area of brazed joint (S1) is determined by inputting a template. This mode is applied to
localized area type brazed joints which shape is irregular. The template should be made with the
design drawing and transferred to the image. The brazed joints are separated from other areas with
the template (see Fig.3b, there are three strips of joints in the structure) and the area of brazed joints
Joint
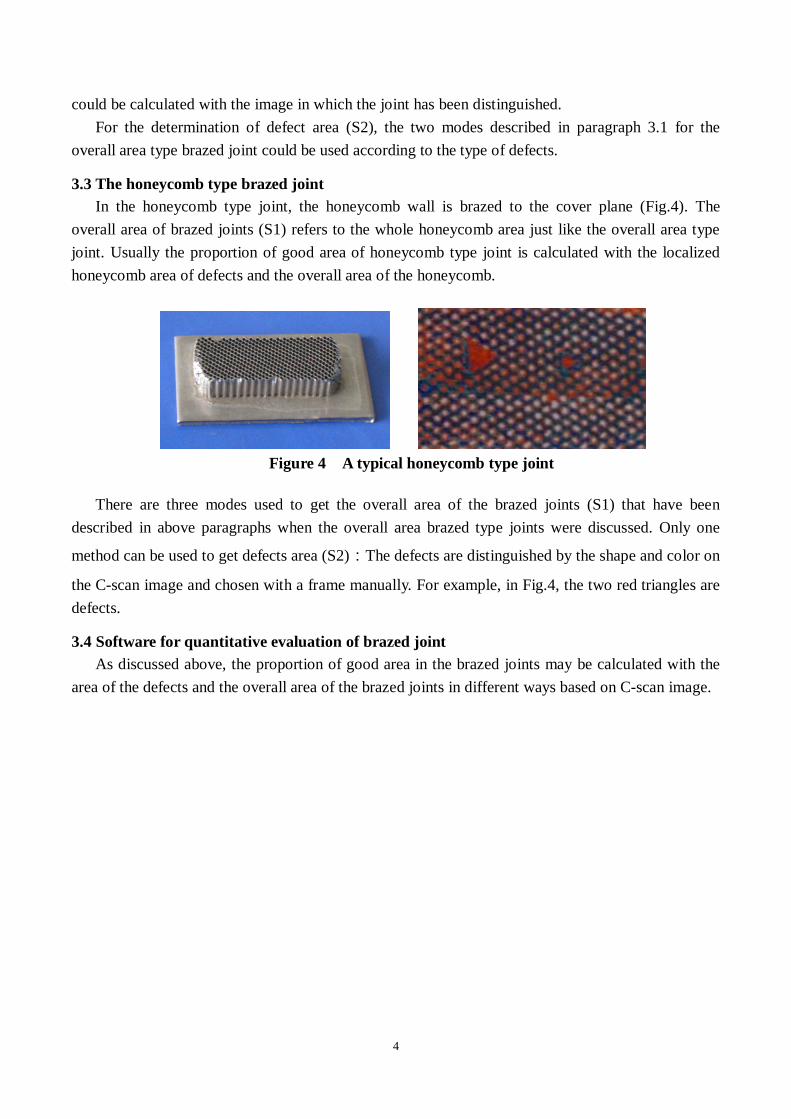
4
could be calculated with the image in which the joint has been distinguished.
For the determination of defect area (S2), the two modes described in paragraph 3.1 for the
overall area type brazed joint could be used according to the type of defects.
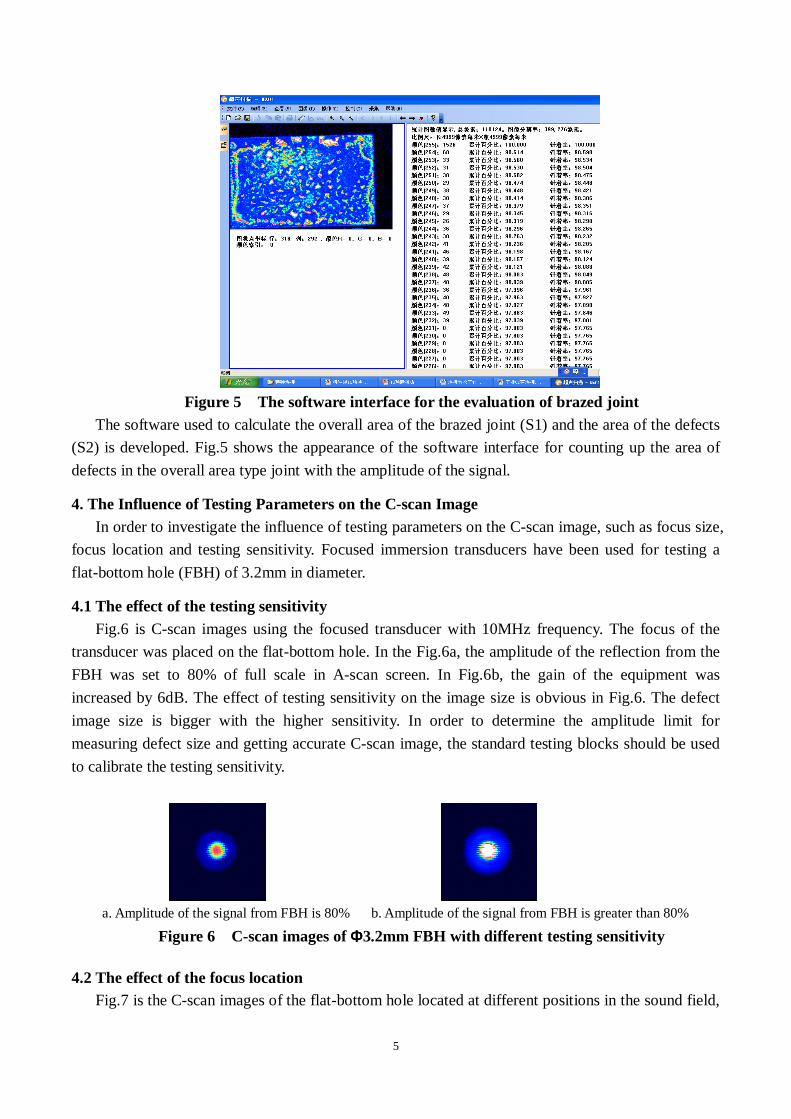
3.3 The honeycomb type brazed joint In the honeycomb type joint, the honeycomb wall is brazed to the cover plane (Fig.4). The
overall area of brazed joints (S1) refers to the whole honeycomb area just like the overall area type
joint. Usually the proportion of good area of honeycomb type joint is calculated with the localized
honeycomb area of defects and the overall area of the honeycomb.
Figure 4 A typical honeycomb type joint
There are three modes used to get the overall area of the brazed joints (S1) that have been
described in above paragraphs when the overall area brazed type joints were discussed. Only one
method can be used to get defects area (S2):The defects are distinguished by the shape and color on
the C-scan image and chosen with a frame manually. For example, in Fig.4, the two red triangles are
defects.
3.4 Software for quantitative evaluation of brazed joint As discussed above, the proportion of good area in the brazed joints may be calculated with the
area of the defects and the overall area of the brazed joints in different ways based on C-scan image.
5
Figure 5 The software interface for the evaluation of brazed joint
The software used to calculate the overall area of the brazed joint (S1) and the area of the defects
(S2) is developed. Fig.5 shows the appearance of the software interface for counting up the area of
defects in the overall area type joint with the amplitude of the signal.
4. The Influence of Testing Parameters on the C-scan Image In order to investigate the influence of testing parameters on the C-scan image, such as focus size,
focus location and testing sensitivity. Focused immersion transducers have been used for testing a
flat-bottom hole (FBH) of 3.2mm in diameter.
4.1 The effect of the testing sensitivity Fig.6 is C-scan images using the focused transducer with 10MHz frequency. The focus of the
transducer was placed on the flat-bottom hole. In the Fig.6a, the amplitude of the reflection from the
FBH was set to 80% of full scale in A-scan screen. In Fig.6b, the gain of the equipment was
increased by 6dB. The effect of testing sensitivity on the image size is obvious in Fig.6. The defect
image size is bigger with the higher sensitivity. In order to determine the amplitude limit for
measuring defect size and getting accurate C-scan image, the standard testing blocks should be used
to calibrate the testing sensitivity.
a. Amplitude of the signal from FBH is 80% b. Amplitude of the signal from FBH is greater than 80%
Figure 6 C-scan images of ΦΦΦΦ3.2mm FBH with different testing sensitivity
4.2 The effect of the focus location Fig.7 is the C-scan images of the flat-bottom hole located at different positions in the sound field,
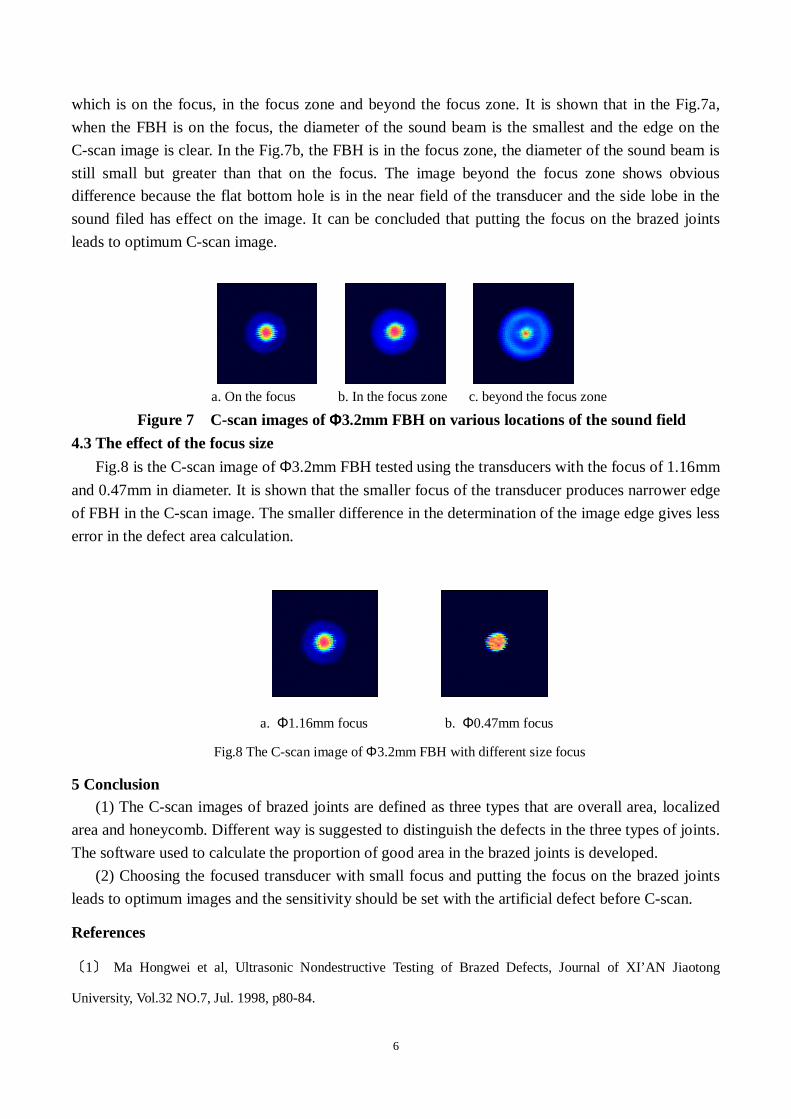
6
which is on the focus, in the focus zone and beyond the focus zone. It is shown that in the Fig.7a,
when the FBH is on the focus, the diameter of the sound beam is the smallest and the edge on the
C-scan image is clear. In the Fig.7b, the FBH is in the focus zone, the diameter of the sound beam is
still small but greater than that on the focus. The image beyond the focus zone shows obvious
difference because the flat bottom hole is in the near field of the transducer and the side lobe in the
sound filed has effect on the image. It can be concluded that putting the focus on the brazed joints
leads to optimum C-scan image.
a. On the focus b. In the focus zone c. beyond the focus zone
Figure 7 C-scan images of ΦΦΦΦ3.2mm FBH on various locations of the sound field
4.3 The effect of the focus size
Fig.8 is the C-scan image of Φ3.2mm FBH tested using the transducers with the focus of 1.16mm
and 0.47mm in diameter. It is shown that the smaller focus of the transducer produces narrower edge
of FBH in the C-scan image. The smaller difference in the determination of the image edge gives less
error in the defect area calculation.
a. Φ1.16mm focus b. Φ0.47mm focus
Fig.8 The C-scan image of Φ3.2mm FBH with different size focus
5 Conclusion (1) The C-scan images of brazed joints are defined as three types that are overall area, localized
area and honeycomb. Different way is suggested to distinguish the defects in the three types of joints.
The software used to calculate the proportion of good area in the brazed joints is developed.
(2) Choosing the focused transducer with small focus and putting the focus on the brazed joints
leads to optimum images and the sensitivity should be set with the artificial defect before C-scan.
References
〔1〕 Ma Hongwei et al, Ultrasonic Nondestructive Testing of Brazed Defects, Journal of XI’AN Jiaotong
University, Vol.32 NO.7, Jul. 1998, p80-84.

7
〔2〕 Zhu Siyi, Reliability of Ultrasonic C-scan Testing of Brazing Quality, NDT, Vol.19 No.12, Dec. 1997,
p343-344.