Embed Size (px)
Citation preview
FEDERAL RESERVE BANK OF ST. LOUIS REVIEW NOVEMBER/DECEMBER 2010 465
Quantitative Easing: Entrance and Exit Strategies
Alan S. Blinder
This article was originally presented as the Homer Jones Memorial Lecture, organized by theFederal Reserve Bank of St. Louis, St. Louis, Missouri, April 1, 2010.
Federal Reserve Bank of St. Louis Review, November/December 2010, 92(6), pp. 465-79.
easing is something aberrant. I adhere to thatnomenclature here.
I begin by sketching the conceptual basis forquantitative easing: why it might be appropriateand how it is supposed to work. I then turn to theFed’s entrance strategy—which is presumablyin the past, and then to the Fed’s exit strategy—which is still mostly in the future. Both strategiesinvite some brief comparisons with the Japaneseexperience between 2001 and 2006. Finally, Iaddress some questions about central bank inde-pendence raised by quantitative easing beforebriefly wrapping up.
THE CONCEPTUAL BASIS FOR QUANTITATIVE EASING: THE LIQUIDITY TRAP
To begin with the obvious, I think every stu-dent of monetary policy believes that the centralbank’s conventional policy instrument—the over -night interest rate (the “federal funds” rate in theUnited States)—is more powerful and reliablethan quantitative easing. So why would anyrational central banker ever resort to quantita-tive easing? The answer is pretty clear: Under
A pparently, it can happen here. OnDecember 16, 2008, the Federal OpenMarket Committee (FOMC), in aneffort to fight what was shaping up
to be the worst recession since 1937-38, reducedthe federal funds rate to nearly zero.1 From thenon, with all its conventional ammunition spent,the Federal Reserve was squarely in the bravenew world of quantitative easing. Chairman BenBernanke tried to call the Fed’s new policies“credit easing,” probably to differentiate themfrom actions taken by the Bank of Japan (BOJ)earlier in the decade, but the label did not stick.2
Roughly speaking, quantitative easing refersto changes in the composition and/or size of acentral bank’s balance sheet that are designed toease liquidity and/or credit conditions. Presum -ably, reversing these policies constitutes “quanti-tative tightening,” but nobody seems to use thatterminology. The discussion refers instead to thebank’s “exit strategy,” indicating that quantitative
1 Specifically, the FOMC cut the funds rate to a range between zeroand 25 basis points. In practice, funds have mostly traded around10 to 15 basis points ever since.
2 As will be clear later, the Fed’s approach and the BoJ’s approachwere different.
Alan S. Blinder is the Gordon S. Rentschler Memorial Professor of Economics and Public Affairs at Princeton University and co-director ofPrinceton’s Center for Economic Policy Studies. He is also vice chairman of the Promontory Interfinancial Network. This paper is based onhis Homer Jones Memorial Lecture at the Federal Reserve Bank of St. Louis, April 1, 2010. The author thanks Gauti Eggertsson, Todd Keister,Jamie McAndrews, Paul Mizen, John Taylor, Alexander Wolman, and Michael Woodford for extremely useful comments on an earlier draftand Princeton’s Center for Economic Policy Studies for research support.
© 2010, The Federal Reserve Bank of St. Louis. The views expressed in this article are those of the author(s) and do not necessarily reflect theviews of the Federal Reserve System, the Board of Governors, or the regional Federal Reserve Banks. Articles may be reprinted, reproduced,published, distributed, displayed, and transmitted in their entirety if copyright notice, author name(s), and full citation are included. Abstracts,synopses, and other derivative works may be made only with prior written permission of the Federal Reserve Bank of St. Louis.
extremely adverse circumstances, a central bankcan cut the nominal interest rate all the way tozero and still be unable to stimulate its economysufficiently.3 Such a situation, in which the nomi-nal rate hits its zero lower bound, has come tobe called a “liquidity trap” (Krugman, 1998),although that terminology differs somewhat fromKeynes’s original meaning.4
Let’s review the underlying logic. The pre-sumption is that real interest rates (r), not nominalinterest rates (i ), are what mainly matter for, say,aggregate demand. In deep recessions, monetarypolicymakers may need to push real rates (r = i – π,where π is the rate of inflation) into negativeterritory.5 But once i hits zero, the central bankcannot force it down any farther, which leaves r“stuck” at –π, which is small or possibly evenpositive. In any case, once i = 0, conventionalmonetary policy is “out of bullets.”
Actually, the situation is even worse thanthat. Recall Milton Friedman’s (1968) warningabout the perils of fixing the nominal interest ratewhen inflation is either rising or falling: Doing soinvites dynamic instability. Well, once the nomi-nal rate is stuck at zero, it is, of course, fixed. Ifinflation then falls, the real interest rate will risefarther, thereby squeezing the economy evenmore. This is a recipe for deflationary implosion.
Enter quantitative easing. Suppose that, eventhough the riskless overnight rate is constrainedto zero, the central bank has some unconventionalpolicy instruments that it can use to reduce inter-est rate spreads—such as term premiums and/orrisk premiums. If flattening the yield curve and/orshrinking risk premiums can boost aggregatedemand, then monetary policy is not powerless,even at the zero lower bound.6 In that case, a cen-
tral bank that pursues quantitative easing withsufficient vigor can break the potentially viciousdownward cycle of deflation, weaker aggregatedemand, more deflation, and so on.
What unconventional weapons might becontained in such an arsenal? The following listis hypothetical and conceptual, but every itemhas a clear counterpart in something the FederalReserve has actually done.
First, suppose the central bank’s objective isto flatten the yield curve, perhaps because longrates have more powerful effects on spendingthan short rates. There are two main options. Oneis to use “open mouth policy.” The central bankcan commit to keeping the overnight rate at ornear zero either for, say, “an extended period”(or some such phrase) or until, say, inflationrises above a certain level. To the extent that the(rational) expectations theory of the term struc-ture is valid and the commitment is credible,doing so should reduce long rates and therebystimulate demand.7 But such verbal commitmentswould not normally be considered quantitativeeasing because no quantity on the central bank’sbalance sheet is affected. So I will not discussthem further.
The quantitative easing approach to the termstructure is straightforward: Use otherwise-conventional open market purchases to acquirelonger-term government securities instead of theshort-term bills that central banks normally buy.If arbitrage along the yield curve is imperfect,perhaps because asset holders have “preferredhabitats,” then such operations can push longrates down by shrinking term premiums.8
The other likely target of quantitative easingis risk or liquidity spreads. Every private debtinstrument, even a bank deposit or a AAA-ratedbond, pays some spread over Treasuries for one
Blinder
466 NOVEMBER/DECEMBER 2010 FEDERAL RESERVE BANK OF ST. LOUIS REVIEW
3 Another argument is that a central bank might want to “save itsbullets” for an even more dire situation. However, this argumentwas effectively debunked by Reifschneider and Williams (2002).
4 The Keynesian liquidity trap arises at the point where the demandfunction for money becomes infinitely elastic, which could happenat a nonzero interest rate.
5 The difference between ex ante expected inflation and ex postactual inflation is not important for this purpose.
6 Here I exclude exchange rate policy from monetary policy. Depre -ciating the exchange rate may be another option (see Svensson,2003), though not when the whole world is in a slump.
7 While the expectations theory of the term structure with rationalexpectations fails every empirical test (see, for example, Blinder,2004, Chap. 3), long rates do seem to move in the right direction,if not by the right amount.
8 The preferred habitat theory is attributed to Modigliani and Sutch(1966). It was one rationale, for example, for “Operation Twist,”which sought to lower long rates while raising short rates in theearly 1960s. Operation Twist, however, was not widely viewed assuccessful.
or both of these reasons.9 Since private borrow-ing, lending, and spending decisions presumablydepend on (risky) non-Treasury rates, reducingtheir spreads over (riskless) Treasuries reducesthe interest rates that matter for actual transactionseven if riskless rates are unchanged.
How might a central bank accomplish that?The most obvious approach is to buy one of therisky and/or less-liquid assets, paying either by(i) selling some Treasuries from its portfolio,which would change the composition of its bal-ance sheet, or (ii) creating new base money, whichwould increase the size of its balance sheet.10
Either variant can be said to constitute quantita-tive easing, and its effectiveness depends on thedegree of substitutability across the assets beingtraded. As we know, buying X and selling Y doesnothing if X and Y are perfect substitutes.11 For -tunately, it seems unlikely that, say, mortgage-backed securities (MBS) are perfect substitutesfor Treasuries—certainly not in a crisis.
THE FED’S ENTRANCE STRATEGYWith this conceptual framework in mind, I
turn now to what the Federal Reserve actually didas it embarked on its new strategy of quantitativeeasing. Because the messy failure of LehmanBrothers in mid-September 2008 was such awatershed, I begin the story before that event.
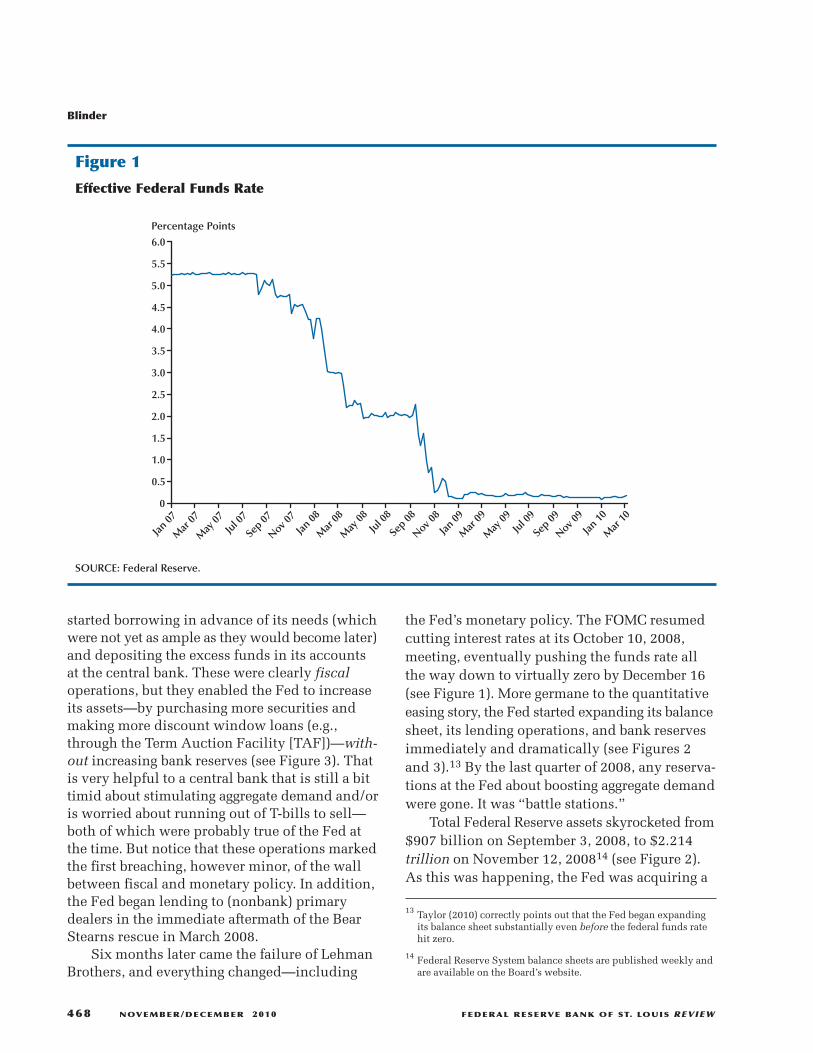
Reacting somewhat late to the onset of thefinancial crisis in the summer of 2007, theFOMC began cutting the federal funds rate onSeptember 18, 2007—starting from an initial tar-get of 5.25 percent. While it cut rates rapidly byhistorical standards, the Fed did not signal anygreat sense of urgency. It was not until April 30,
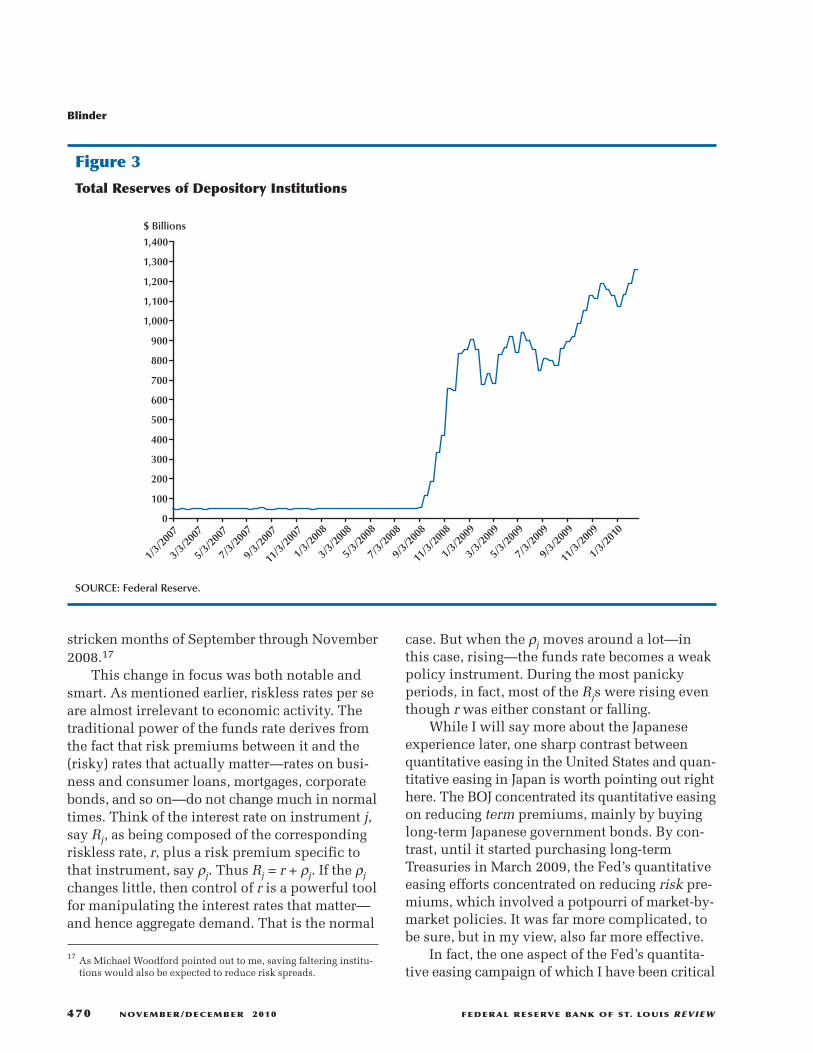
2008, that the target funds rate got down to 2percent, where the FOMC decided to keep itwhile awaiting further developments (Figure 1).Perhaps more germane to the quantitative easingstory, the Fed was neither expanding its balancesheet (Figure 2) nor increasing bank reserves(Figure 3) much over this period.
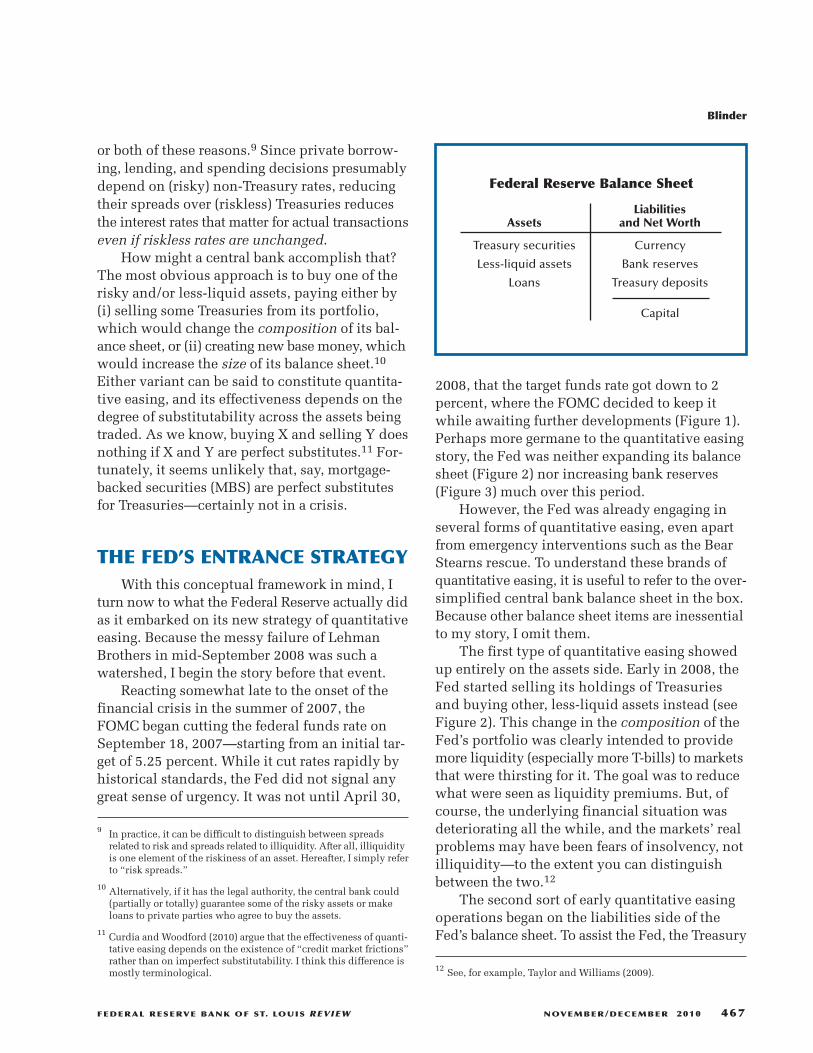
However, the Fed was already engaging inseveral forms of quantitative easing, even apartfrom emergency interventions such as the BearStearns rescue. To understand these brands ofquantitative easing, it is useful to refer to the over-simplified central bank balance sheet in the box.Because other balance sheet items are inessentialto my story, I omit them.
The first type of quantitative easing showedup entirely on the assets side. Early in 2008, theFed started selling its holdings of Treasuriesand buying other, less-liquid assets instead (seeFigure 2). This change in the composition of theFed’s portfolio was clearly intended to providemore liquidity (especially more T-bills) to marketsthat were thirsting for it. The goal was to reducewhat were seen as liquidity premiums. But, ofcourse, the underlying financial situation wasdeteriorating all the while, and the markets’ realproblems may have been fears of insolvency, notilliquidity—to the extent you can distinguishbetween the two.12
The second sort of early quantitative easingoperations began on the liabilities side of theFed’s balance sheet. To assist the Fed, the Treasury
Blinder
FEDERAL RESERVE BANK OF ST. LOUIS REVIEW NOVEMBER/DECEMBER 2010 467
9 In practice, it can be difficult to distinguish between spreadsrelated to risk and spreads related to illiquidity. After all, illiquidityis one element of the riskiness of an asset. Hereafter, I simply referto “risk spreads.”
10 Alternatively, if it has the legal authority, the central bank could(partially or totally) guarantee some of the risky assets or makeloans to private parties who agree to buy the assets.
11 Curdia and Woodford (2010) argue that the effectiveness of quanti-tative easing depends on the existence of “credit market frictions”rather than on imperfect substitutability. I think this difference ismostly terminological.
Federal Reserve Balance Sheet
Liabilities Assets and Net Worth
Treasury securities Currency
Less-liquid assets Bank reserves
Loans Treasury deposits
Capital
12 See, for example, Taylor and Williams (2009).
started borrowing in advance of its needs (whichwere not yet as ample as they would become later)and depositing the excess funds in its accountsat the central bank. These were clearly fiscaloperations, but they enabled the Fed to increaseits assets—by purchasing more securities andmaking more discount window loans (e.g.,through the Term Auction Facility [TAF])—with-out increasing bank reserves (see Figure 3). Thatis very helpful to a central bank that is still a bittimid about stimulating aggregate demand and/oris worried about running out of T-bills to sell—both of which were probably true of the Fed atthe time. But notice that these operations markedthe first breaching, however minor, of the wallbetween fiscal and monetary policy. In addition,the Fed began lending to (nonbank) primarydealers in the immediate aftermath of the BearStearns rescue in March 2008.
Six months later came the failure of LehmanBrothers, and everything changed—including
the Fed’s monetary policy. The FOMC resumedcutting interest rates at its October 10, 2008,meeting, eventually pushing the funds rate allthe way down to virtually zero by December 16(see Figure 1). More germane to the quantitativeeasing story, the Fed started expanding its balancesheet, its lending operations, and bank reservesimmediately and dramatically (see Figures 2and 3).13 By the last quarter of 2008, any reserva-tions at the Fed about boosting aggregate demandwere gone. It was “battle stations.”
Total Federal Reserve assets skyrocketed from$907 billion on September 3, 2008, to $2.214trillion on November 12, 200814 (see Figure 2).As this was happening, the Fed was acquiring a
Blinder
468 NOVEMBER/DECEMBER 2010 FEDERAL RESERVE BANK OF ST. LOUIS REVIEW
0
0.5
1.0
1.5
2.0
2.5
3.0
3.5
4.0
4.5
5.0
5.5
6.0
Jan 07
Mar
07
May
07Ju
l 07
Sep 07
Nov 07
Jan 08
Mar
08
May
08Ju
l 08
Sep 08
Nov 08
Jan 09
Mar
09
May
09Ju
l 09
Sep 09
Nov 09
Jan 10
Mar
10
Percentage Points
Figure 1
Effective Federal Funds Rate
SOURCE: Federal Reserve.
13 Taylor (2010) correctly points out that the Fed began expandingits balance sheet substantially even before the federal funds ratehit zero.
14 Federal Reserve System balance sheets are published weekly andare available on the Board’s website.
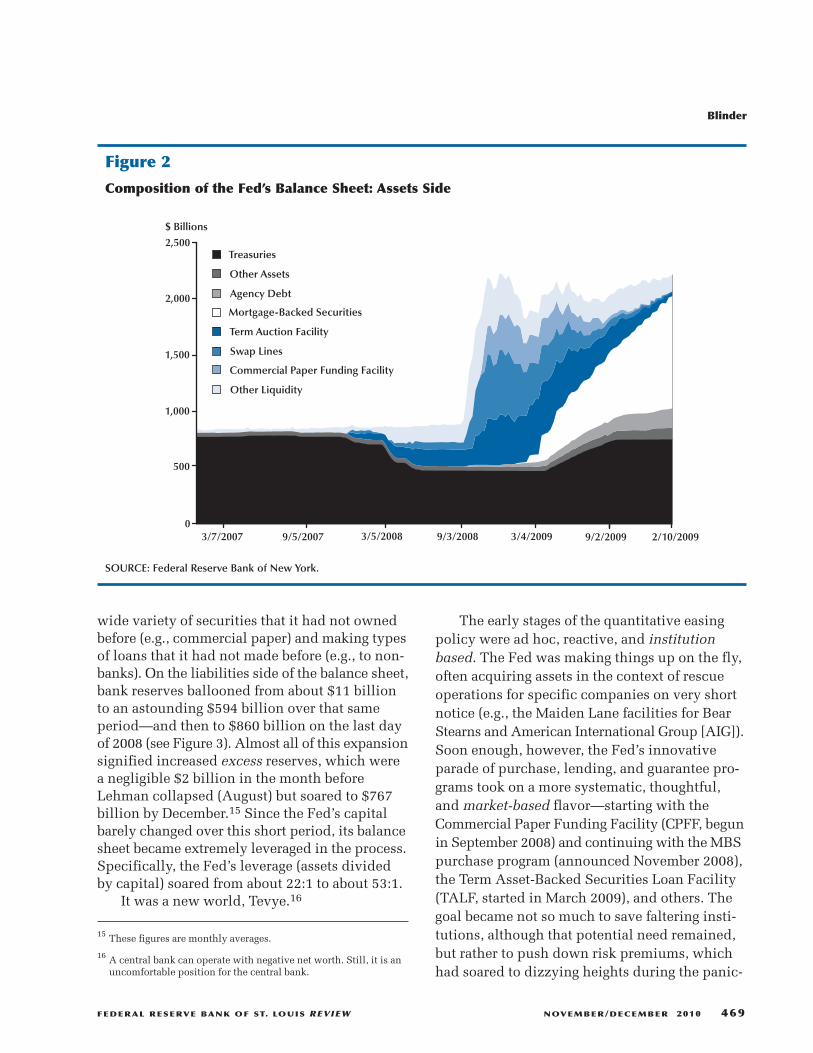
wide variety of securities that it had not ownedbefore (e.g., commercial paper) and making typesof loans that it had not made before (e.g., to non-banks). On the liabilities side of the balance sheet,bank reserves ballooned from about $11 billionto an astounding $594 billion over that sameperiod—and then to $860 billion on the last dayof 2008 (see Figure 3). Almost all of this expansionsignified increased excess reserves, which werea negligible $2 billion in the month beforeLehman collapsed (August) but soared to $767billion by December.15 Since the Fed’s capitalbarely changed over this short period, its balancesheet became extremely leveraged in the process.Specifically, the Fed’s leverage (assets dividedby capital) soared from about 22:1 to about 53:1.
It was a new world, Tevye.16
The early stages of the quantitative easingpolicy were ad hoc, reactive, and institutionbased. The Fed was making things up on the fly,often acquiring assets in the context of rescueoperations for specific companies on very shortnotice (e.g., the Maiden Lane facilities for BearStearns and American International Group [AIG]).Soon enough, however, the Fed’s innovativeparade of purchase, lending, and guarantee pro-grams took on a more systematic, thoughtful,and market-based flavor—starting with theCommercial Paper Funding Facility (CPFF, begunin September 2008) and continuing with the MBSpurchase program (announced November 2008),the Term Asset-Backed Securities Loan Facility(TALF, started in March 2009), and others. Thegoal became not so much to save faltering insti-tutions, although that potential need remained,but rather to push down risk premiums, whichhad soared to dizzying heights during the panic-
Blinder
FEDERAL RESERVE BANK OF ST. LOUIS REVIEW NOVEMBER/DECEMBER 2010 469
Treasuries
Other Assets
Agency Debt
$ Billions
3/7/2007 9/5/2007 3/5/2008 9/3/2008 3/4/2009 9/2/2009
2,500
2,000
1,500
1,000
500
0
Mortgage-Backed Securities
Term Auction Facility
Swap Lines
Commercial Paper Funding Facility
Other Liquidity
2/10/2009
Figure 2
Composition of the Fed’s Balance Sheet: Assets Side
SOURCE: Federal Reserve Bank of New York.
15 These figures are monthly averages.
16 A central bank can operate with negative net worth. Still, it is anuncomfortable position for the central bank.
stricken months of September through November2008.17
This change in focus was both notable andsmart. As mentioned earlier, riskless rates per seare almost irrelevant to economic activity. Thetraditional power of the funds rate derives fromthe fact that risk premiums between it and the(risky) rates that actually matter—rates on busi-ness and consumer loans, mortgages, corporatebonds, and so on—do not change much in normaltimes. Think of the interest rate on instrument j,say Rj, as being composed of the correspondingriskless rate, r, plus a risk premium specific tothat instrument, say ρj. Thus Rj = r + ρj. If the ρjchanges little, then control of r is a powerful toolfor manipulating the interest rates that matter—and hence aggregate demand. That is the normal
case. But when the ρj moves around a lot—inthis case, rising—the funds rate becomes a weakpolicy instrument. During the most panickyperiods, in fact, most of the Rjs were rising eventhough r was either constant or falling.
While I will say more about the Japaneseexperience later, one sharp contrast betweenquantitative easing in the United States and quan-titative easing in Japan is worth pointing out righthere. The BOJ concentrated its quantitative easingon reducing term premiums, mainly by buyinglong-term Japanese government bonds. By con-trast, until it started purchasing long-termTreasuries in March 2009, the Fed’s quantitativeeasing efforts concentrated on reducing risk pre-miums, which involved a potpourri of market-by-market policies. It was far more complicated, tobe sure, but in my view, also far more effective.
In fact, the one aspect of the Fed’s quantita-tive easing campaign of which I have been critical
Blinder
470 NOVEMBER/DECEMBER 2010 FEDERAL RESERVE BANK OF ST. LOUIS REVIEW
0
100
200
300
400
500
600
700
800
900
1,000
1,100
1,200
1,300
1,400
1/3/
2007
3/3/
2007
5/3/
2007
7/3/
2007
9/3/
2007
11/3
/200
7
1/3/
2008
3/3/
2008
5/3/
2008
7/3/
2008
9/3/
2008
11/3
/200
8
1/3/
2009
3/3/
2009
5/3/
2009
7/3/
2009
9/3/
2009
11/3
/200
9
1/3/
2010
$ Billions
Figure 3
Total Reserves of Depository Institutions
SOURCE: Federal Reserve.
17 As Michael Woodford pointed out to me, saving faltering institu-tions would also be expected to reduce risk spreads.
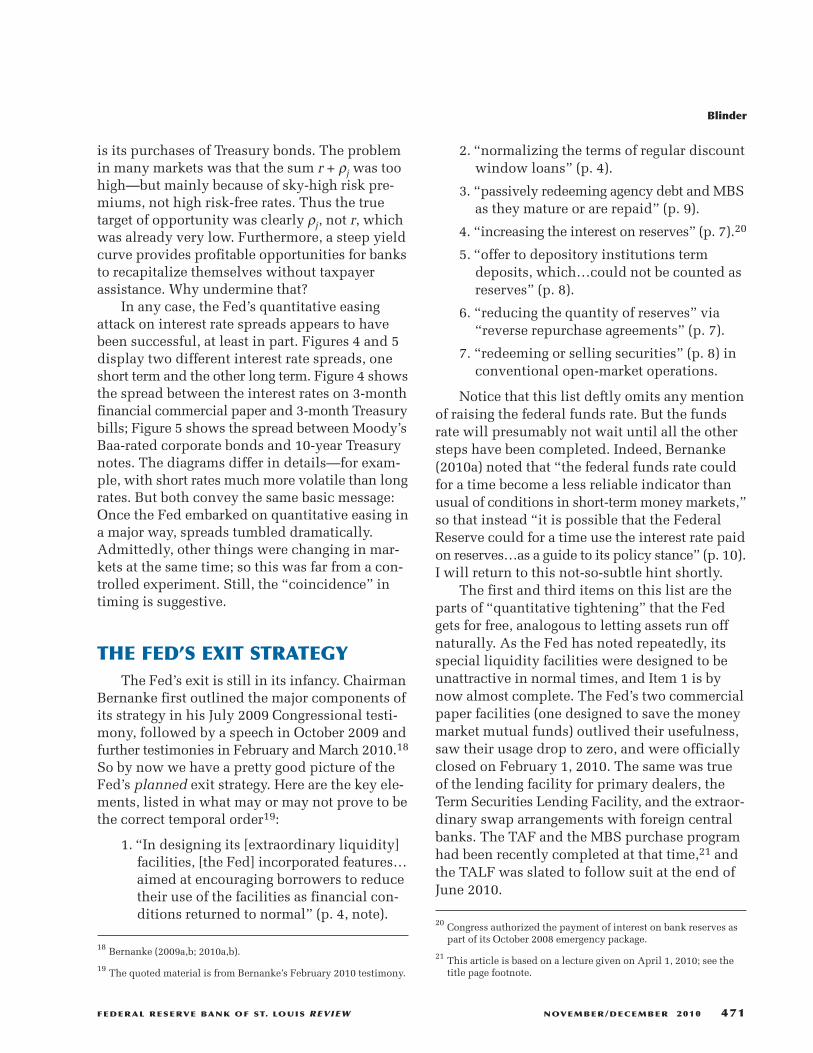
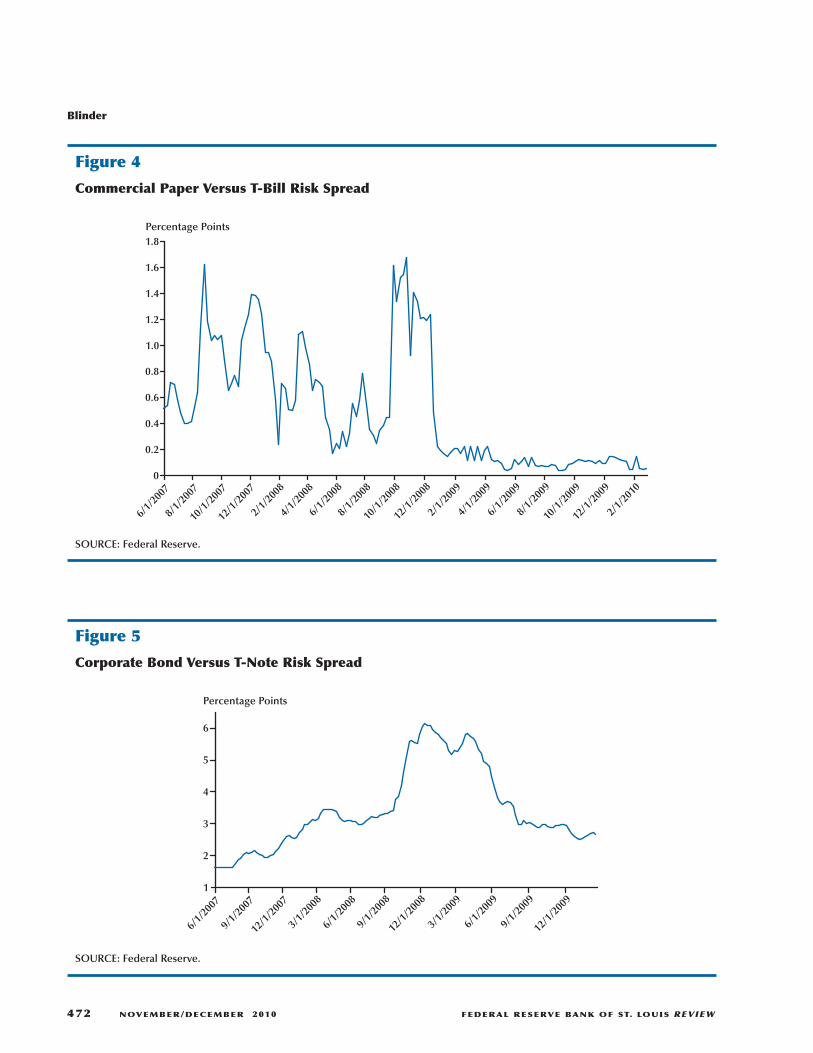
is its purchases of Treasury bonds. The problemin many markets was that the sum r + ρj was toohigh—but mainly because of sky-high risk pre-miums, not high risk-free rates. Thus the truetarget of opportunity was clearly ρj, not r, whichwas already very low. Furthermore, a steep yieldcurve provides profitable opportunities for banksto recapitalize themselves without taxpayerassistance. Why undermine that?
In any case, the Fed’s quantitative easingattack on interest rate spreads appears to havebeen successful, at least in part. Figures 4 and 5display two different interest rate spreads, oneshort term and the other long term. Figure 4 showsthe spread between the interest rates on 3-monthfinancial commercial paper and 3-month Treasurybills; Figure 5 shows the spread between Moody’sBaa-rated corporate bonds and 10-year Treasurynotes. The diagrams differ in details—for exam-ple, with short rates much more volatile than longrates. But both convey the same basic message:Once the Fed embarked on quantitative easing ina major way, spreads tumbled dramatically.Admittedly, other things were changing in mar-kets at the same time; so this was far from a con-trolled experiment. Still, the “coincidence” intiming is suggestive.
THE FED’S EXIT STRATEGYThe Fed’s exit is still in its infancy. Chairman
Bernanke first outlined the major components ofits strategy in his July 2009 Congressional testi-mony, followed by a speech in October 2009 andfurther testimonies in February and March 2010.18
So by now we have a pretty good picture of theFed’s planned exit strategy. Here are the key ele-ments, listed in what may or may not prove to bethe correct temporal order19:
1. “In designing its [extraordinary liquidity]facilities, [the Fed] incorporated features…aimed at encouraging borrowers to reducetheir use of the facilities as financial con-ditions returned to normal” (p. 4, note).
2. “normalizing the terms of regular discountwindow loans” (p. 4).
3. “passively redeeming agency debt and MBSas they mature or are repaid” (p. 9).
4. “increasing the interest on reserves” (p. 7).20
5. “offer to depository institutions termdeposits, which…could not be counted asreserves” (p. 8).
6. “reducing the quantity of reserves” via“reverse repurchase agreements” (p. 7).
7. “redeeming or selling securities” (p. 8) inconventional open-market operations.
Notice that this list deftly omits any mentionof raising the federal funds rate. But the fundsrate will presumably not wait until all the othersteps have been completed. Indeed, Bernanke(2010a) noted that “the federal funds rate couldfor a time become a less reliable indicator thanusual of conditions in short-term money markets,”so that instead “it is possible that the FederalReserve could for a time use the interest rate paidon reserves…as a guide to its policy stance” (p. 10).I will return to this not-so-subtle hint shortly.
The first and third items on this list are theparts of “quantitative tightening” that the Fedgets for free, analogous to letting assets run offnaturally. As the Fed has noted repeatedly, itsspecial liquidity facilities were designed to beunattractive in normal times, and Item 1 is bynow almost complete. The Fed’s two commercialpaper facilities (one designed to save the moneymarket mutual funds) outlived their usefulness,saw their usage drop to zero, and were officiallyclosed on February 1, 2010. The same was trueof the lending facility for primary dealers, theTerm Securities Lending Facility, and the extraor-dinary swap arrangements with foreign centralbanks. The TAF and the MBS purchase programhad been recently completed at that time,21 andthe TALF was slated to follow suit at the end ofJune 2010.
Blinder
FEDERAL RESERVE BANK OF ST. LOUIS REVIEW NOVEMBER/DECEMBER 2010 471
20 Congress authorized the payment of interest on bank reserves aspart of its October 2008 emergency package.
21 This article is based on a lecture given on April 1, 2010; see thetitle page footnote.
18 Bernanke (2009a,b; 2010a,b).
19 The quoted material is from Bernanke’s February 2010 testimony.
Blinder
472 NOVEMBER/DECEMBER 2010 FEDERAL RESERVE BANK OF ST. LOUIS REVIEW
0
0.2
0.4
0.6
0.8
1.0
1.2
1.4
1.6
1.8Percentage Points
6/1/
2007
8/1/
2007
10/1
/200
7
12/1
/200
7
2/1/
2008
4/1/
2008
6/1/
2008
8/1/
2008
10/1
/200
8
12/1
/200
8
2/1/
2009
4/1/
2009
6/1/
2009
8/1/
2009
10/1
/200
9
12/1
/200
9
2/1/
2010
Figure 4
Commercial Paper Versus T-Bill Risk Spread
SOURCE: Federal Reserve.
1
2
3
4
5
6
Percentage Points
6/1/
2007
9/1/
2007
12/1
/200
7
3/1/
2008
6/1/
2008
9/1/
2008
12/1
/200
8
3/1/
2009
6/1/
2009
9/1/
2009
12/1
/200
9
Figure 5
Corporate Bond Versus T-Note Risk Spread
SOURCE: Federal Reserve.
Item 2 on this list (raising the discount rate)is necessary to supplement Item 1 (making borrow-ing less attractive), and the Fed began doing sowith a surprise intermeetingmove on February18, 2010. A higher discount rate is also needed ifthe Fed is to shift to the “corridor” system dis-cussed later.
Note, however, that all these adjustments inliquidity facilities will still leave the Fed’s balancesheet with the Bear Stearns and AIG assets andhuge volumes of MBS and government-sponsoredenterprise debt. Now that new purchases havestopped, the stocks of these two asset classes willgradually dwindle (Item 3 on the list). But unlessthere are aggressive open market sales, it will bea long time before the Fed’s balance sheet resem-bles the status quo ante.
That brings me to Items 6 and 7 on Bernanke’slist, which are two types of conventional contrac-tionary open market operations, achieved eitherby reverse repurchases (repos) (and thus tempo-rary) or by outright sales (and thus permanent).Transactions such as these have long been famil-iar to anyone who pays attention to monetarypolicy, as are their normal effects on interest rates.
However, there is a key distinction betweenItems 1 and 3 (lending facilities), on the one hand,and Items 6 and 7 (open market operations), onthe other, when it comes to degree of difficulty.Quantitative easing under Item 1, in particular,wears off naturally on the markets’ own rhythm:These special liquidity facilities fall into disuseas and when the markets no longer need them.From the point of view of the central bank, thisis ideal because the exit is perfectly timed, almostby definition.
Items 6 and 7 are different. The FOMC willhave to decide on the pace of its open marketsales, just as it does in any tightening cycle. Butthis time, both the volume and the variety ofassets to be sold will probably be huge. Of course,the FOMC will get the usual market and macrosignals: movements in asset prices and interestrates, the changing macro outlook, inflation andinflationary expectations, and so on. But its deci-sionmaking will be more difficult, and more con-sequential, than usual because of the enormousscale of the tightening. If the Fed tightens too
quickly, it may stunt or even abort the recovery.If it waits too long, inflation may gather steam.Once the Fed’s policy rates are lifted off zero,short-term interest rates will presumably be theFed’s main guidepost once again—more or lessas in the past.
This discussion leads naturally to Item 5 onBernanke’s list, the novel plan to offer banks newtypes of accounts “which are roughly analogousto certificates of deposit” (p. 8). That is, insteadof just having a “checking account” at the Fed,as at present, banks will be offered the option ofbuying various certificates of deposit (CDs) aswell. But here’s the wrinkle: Unlike their check-ing account balances at the Fed, the CDs will notcount as official reserves. Thus, when a banktransfers money from its checking account to itssaving account, bank reserves will simply vanish.
The potential utility of this new instrumentto a central bank wanting to drain reserves is evi-dent, and the Fed has announced its intention toauction off fixed volumes of CDs of various matu-rities, probably ranging from one to six months.Such auctions would give it perfect control overthe quantities but leave the corresponding interestrates to be determined by the market. Frankly, Iwonder why banks would find these new fixed-income instruments attractive since they cannotbe withdrawn before maturity, they do not consti-tute reserves, and they cannot serve as clearingbalances. As a consequence, the new CDs mayhave to bear interest rates higher than those onTreasury bills. We’ll see.
I come, finally, to the instrument that Bernankeand the Fed seem to view as most central to theirexit strategy: the interest rate paid on bankreserves. Fed officials seem to view paying intereston reserves as something akin to the magic bullet.I hope they are right, but confess to being a bit wor-ried. Everyone recognizes that the Fed’s quanti-tative easing operations have created a veritablemountain of excess reserves (shown in Figure 3),which U.S. banks are currently holding voluntar-ily, despite the paltry rates paid by the Fed. Thequestion is this: How urgent is it—or will itbecome—to whittle this mountain down to size?
One view sees all those excess reserves aspotential financial kindling that will prove infla-
Blinder
FEDERAL RESERVE BANK OF ST. LOUIS REVIEW NOVEMBER/DECEMBER 2010 473
tionary unless withdrawn from the system asfinancial conditions normalize.22 We know thatunder normal circumstances—before interestwas paid on reserves—banks’ demand for excessreserves was virtually zero. But now that reservesearn interest, say at rate z, which the Fed sets,banks probably will not want to reduce theirreserves all the way back to zero. Instead, excessreserves now compete with other very short-termsafe assets, such as T-bills, in banks’ asset portfo-lios.23 Indeed, one can argue that, for banks,reserves are now almost-perfect substitutes forT-bills. So excess reserve holdings will not needto fall all the way back to zero. Rather, the Fed’slooming task will be to reduce the supply of excessreserves at the same pace that banks reduce theirdemands for them. The questions are how fastthat pace will be and how far the process willgo. Remember that as the Fed’s liabilities shrink,so must its assets. So as the Fed reduces bankreserves, it must also reduce some of the loansand/or less-liquid assets now on its balance sheet.
There is, however, an alternative view thatargues that the large apparent “overhang” of excessreserves is nothing to worry about. Specifically,
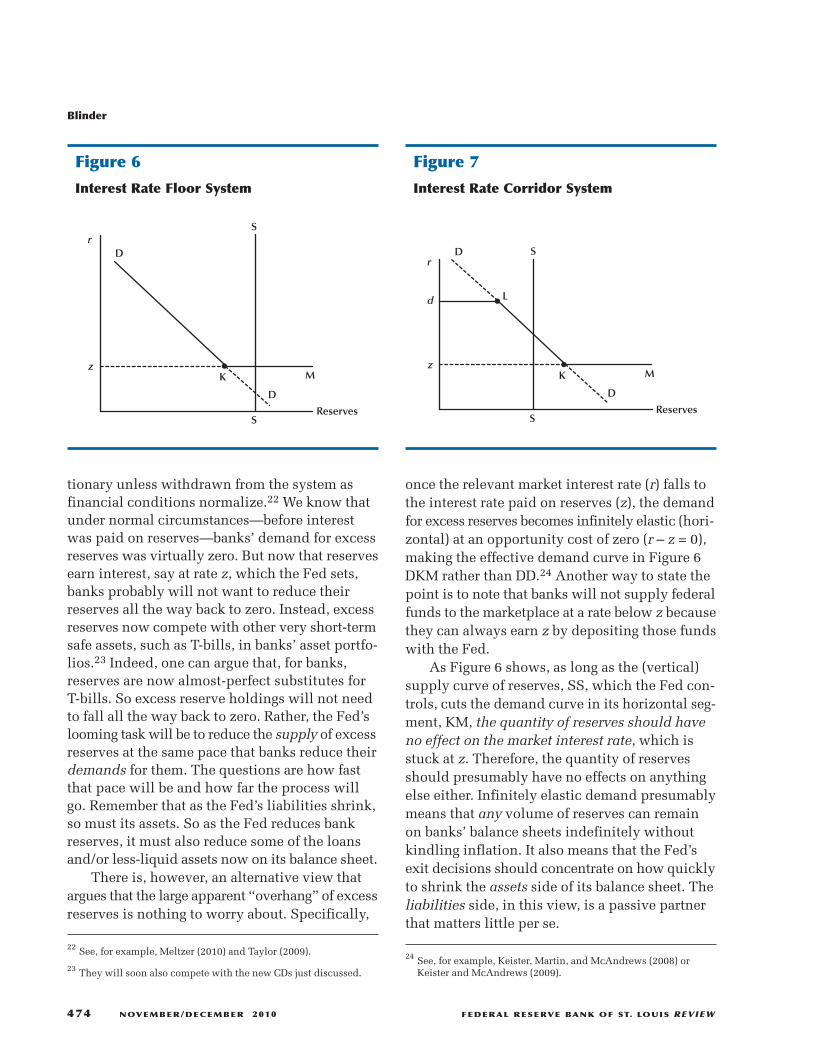
once the relevant market interest rate (r) falls tothe interest rate paid on reserves (z), the demandfor excess reserves becomes infinitely elastic (hori-zontal) at an opportunity cost of zero (r – z = 0),making the effective demand curve in Figure 6DKM rather than DD.24 Another way to state thepoint is to note that banks will not supply federalfunds to the marketplace at a rate below z becausethey can always earn z by depositing those fundswith the Fed.
As Figure 6 shows, as long as the (vertical)supply curve of reserves, SS, which the Fed con-trols, cuts the demand curve in its horizontal seg-ment, KM, the quantity of reserves should haveno effect on the market interest rate, which isstuck at z. Therefore, the quantity of reservesshould presumably have no effects on anythingelse either. Infinitely elastic demand presumablymeans that any volume of reserves can remainon banks’ balance sheets indefinitely withoutkindling inflation. It also means that the Fed’sexit decisions should concentrate on how quicklyto shrink the assets side of its balance sheet. Theliabilities side, in this view, is a passive partnerthat matters little per se.
22 See, for example, Meltzer (2010) and Taylor (2009).
23 They will soon also compete with the new CDs just discussed.
Blinder
474 NOVEMBER/DECEMBER 2010 FEDERAL RESERVE BANK OF ST. LOUIS REVIEW
D
S
M
D
S
Kz
r
Reserves
Figure 6
Interest Rate Floor System
D S
M
D
S
Kz
r
Reserves
Ld
Figure 7
Interest Rate Corridor System
24 See, for example, Keister, Martin, and McAndrews (2008) orKeister and McAndrews (2009).
The idea of establishing either an interestrate floor, as depicted in Figure 6, or an interestrate corridor, as depicted in Figure 7, may becomethe Fed’s new operating procedure.25 The corridorsystem starts with the floor (just explained) andadds a ceiling above which the funds rate cannotgo. That ceiling is the Fed’s discount rate, d,because no bank will pay more than d to borrowfederal funds in the marketplace if it can borrowat rate d from the Fed.26 The Fed’s policymakerscan then set the upper and lower bounds of thecorridor (d and z) and let the funds rate float—whether freely or managed—between these twolimits. Under such a system, the lower bound—the rate paid on reserves, z—could easily becomethe Fed’s active policy instrument, with the dis-count rate set mechanically, say, 100 basis pointsor so higher.27
If the federal funds rate were free to floatwithin the corridor, rather than remaining stuckat the floor or ceiling, the Fed could use it as avaluable information variable. If the funds ratetraded up too rapidly, that might indicate the Fedwas withdrawing reserves too quickly, creatingmore scarcity than it wants. If funds traded downtoo far, that might indicate that reserves were tooabundant—that is, the Fed was withdrawing themtoo slowly. Such information should help theFed time its exit.
QUANTITATIVE EASING ANDTIGHTENING IN JAPAN
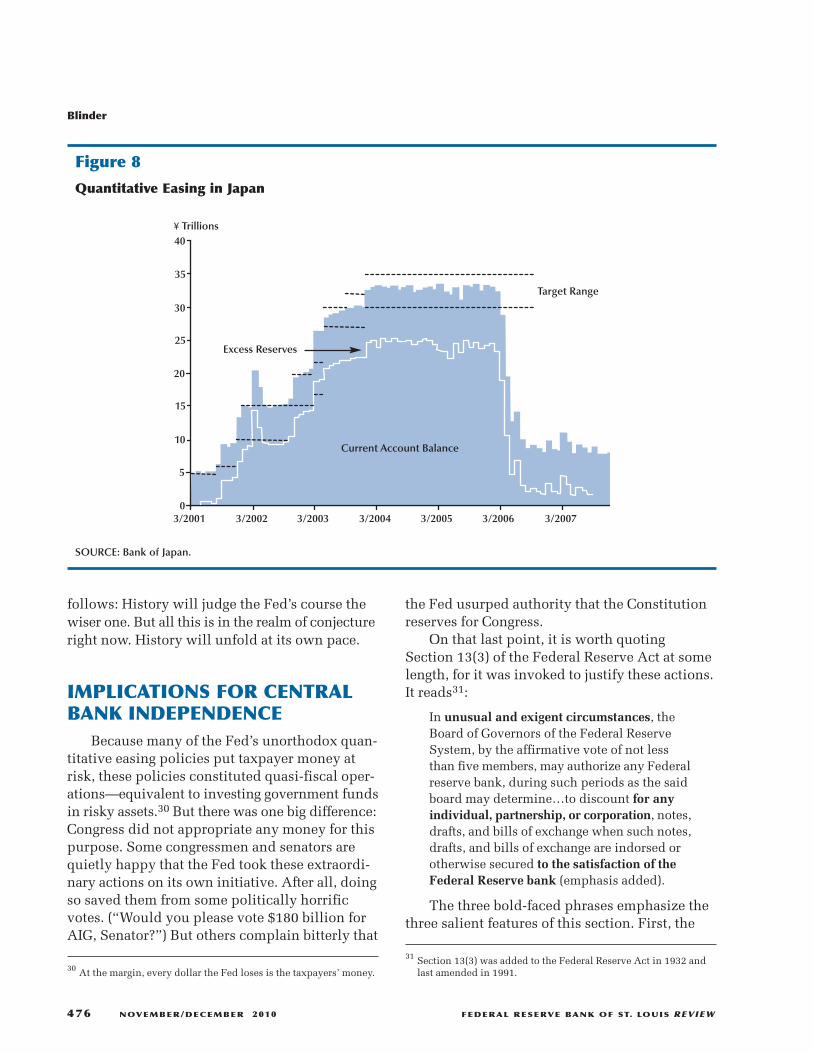
Quantitative easing in Japan, the only relevanthistorical precursor, began in March 2001 andended in March 2006 (Figure 8). The BOJ drove theovernight interest rate to zero and then pledgedto keep it there until deflation ended, mainly byflooding the banking system with excess reserves.
To create all those new reserves, the BOJ boughtmostly Japanese government bonds, as mentionedearlier. The central idea behind quantitative eas-ing in Japan was to stimulate the economy byproliferating reserves and flattening the (risk-free)yield curve, not by decreasing risk spreads.28
In fact, long bond rates did fall. But it is diffi-cult to know how much of the decline was dueto the BOJ’s purchases and how much was due toits pledge to keep short rates near zero for a longwhile. Ugai’s (2006) survey of empirical researchon the effects of Japan’s quantitative easing pro-grams concluded that the evidence “confirms aclear effect” of the commitment policy on short-and medium-term interest rates but offers only“mixed” evidence that “expansion of the mone-tary base and altering the composition of theBOJ’s balance sheet” had much effect.29
In any case, one of the more interesting andinstructive aspects of quantitative easing in Japanmay be how quickly it was withdrawn. Figure 8shows that banks’ excess reserves climbed grad-ually from about 5 trillion yen to about 33 trillionyen over the course of about two and a half years,but then fell back to only about 8 trillion yenover just a few months in 2006. Such an abruptwithdrawal of central bank money was, I suppose,driven by fears of incipient inflation—which wascurious given Japan’s recent deflationary history.In any case, inflation never showed up. Whilethe suddenness of the BOJ’s exit did not kill theeconomy, whether it hampered Japan’s ability tostage a strong recovery is an open question.
In the case of the Fed, the massive increasein bank reserves after the Lehman bankruptcycame very quickly, as Figure 3 shows. The shrink-age, of course, has yet to begin. But my guess isthat it will be gradual. If so, the Fed’s pattern (upfast, down slow) will be just the opposite of theBOJ’s (up slow, down fast). My second guess isthat the Fed’s more gradual withdrawal of quan-titative easing will not unleash strong inflation-ary forces. And if that is correct, my third guess
Blinder
FEDERAL RESERVE BANK OF ST. LOUIS REVIEW NOVEMBER/DECEMBER 2010 475
25 Bernanke (2010a, p. 9 note) elucidates the corridor idea.
26 Obviously, this requires that discount window lending is neitherrationed by, for example, window guidance nor limited by “stigma.”
27 There is an interesting sidelight here for Fed aficionados: Atpresent, the authority to set the discount rate and the rate paid onreserves resides with the Board of Governors, not the FOMC, whichsets the funds rate.
28 There were some purchases of private assets, but the BOJ concen-trated on Japanese government bonds.
29 The quoted material is from the paper’s abstract.
follows: History will judge the Fed’s course thewiser one. But all this is in the realm of conjectureright now. History will unfold at its own pace.
IMPLICATIONS FOR CENTRALBANK INDEPENDENCE
Because many of the Fed’s unorthodox quan-titative easing policies put taxpayer money atrisk, these policies constituted quasi-fiscal oper-ations—equivalent to investing government fundsin risky assets.30 But there was one big difference:Congress did not appropriate any money for thispurpose. Some congressmen and senators arequietly happy that the Fed took these extraordi-nary actions on its own initiative. After all, doingso saved them from some politically horrificvotes. (“Would you please vote $180 billion forAIG, Senator?”) But others complain bitterly that
the Fed usurped authority that the Constitutionreserves for Congress.
On that last point, it is worth quotingSection 13(3) of the Federal Reserve Act at somelength, for it was invoked to justify these actions.It reads31:
In unusual and exigent circumstances, theBoard of Governors of the Federal ReserveSystem, by the affirmative vote of not lessthan five members, may authorize any Federalreserve bank, during such periods as the saidboard may determine…to discount for anyindividual, partnership, or corporation, notes,drafts, and bills of exchange when such notes,drafts, and bills of exchange are indorsed orotherwise secured to the satisfaction of theFederal Reserve bank (emphasis added).
The three bold-faced phrases emphasize thethree salient features of this section. First, the
31 Section 13(3) was added to the Federal Reserve Act in 1932 andlast amended in 1991.
Blinder
476 NOVEMBER/DECEMBER 2010 FEDERAL RESERVE BANK OF ST. LOUIS REVIEW
40
35
30
25
20
15
10
5
03/2001 3/2002 3/2003 3/2004 3/2005 3/2006 3/2007
¥ Trillions
Target Range
Excess Reserves
Current Account Balance
Figure 8
Quantitative Easing in Japan
SOURCE: Bank of Japan.
30 At the margin, every dollar the Fed loses is the taxpayers’ money.
circumstances must be extraordinary (“unusualand exigent”). Second, the law allows the Fed tolend to pretty much anyone, without restriction,as long as it takes good collateral. Third, the Feditself gets to judge whether the collateral is good.In a system of government founded on checksand balances, that provision constitutes an extra -ordinary grant of power. But reading the law doesat least answer one narrow question: The Fed didnot overstep its legal authority; that authoritywas and is extremely broad.
The real question is whether Section 13(3)grants the central bank too much unbridledpower. My tentative answer is yes, especiallysince Section 13(3) interventions tend to put tax-payer funds at risk and to be institution specific—two characteristics that make them inherentlypolitical. Still, getting timely congressional votesto address “unusual and exigent” circumstancescan be very difficult. Remember, the TroubledAsset Relief Program (TARP) failed on the firstvote. Balancing those two considerations leadsme to recommend something similar to the pro-visions in the House and Senate bills: In orderto invoke Section 13(3) powers, the Fed shouldneed approval from some other authority, suchas the Secretary of the Treasury, acting on behalfof the president.32 Then, as soon as is practicable,the Fed should report to the two banking com-mittees of Congress on exactly what it did, whyit made those decisions, and whether it expectsto incur any losses on the transactions.33 Thosetwo steps would go a long way toward filling thedemocracy deficit.34
But the broader question is this: How farbeyond conventional monetary policy shouldthe doctrine of central bank independence beextended? Remember, the Federal Reserve hasnever had nearly as much independence in thesphere of bank supervision and regulation, where
it shares power with three other federal bankingagencies, as it has in monetary policy. So, forexample, if the Fed were to be made the systemicrisk regulator, should it be as independent in thatrole as it is in monetary policy? Or should it begiven something more like primus inter paresstatus? It’s a fair question, without a clear answer.
Another variant of the same question ariseswhen some of the quasi-fiscal operations justifiedby Section 13(3) come to constitute all or mostof the Fed’s monetary policy. Such a situation is,of course, not hypothetical. Since December 2008,the FOMC’s undisputed control of the federalfunds rate has given it no leverage over theeconomy whatsoever because the funds rate isconstrained to essentially zero, and hence immo-bilized. Indeed, one might argue that, until justrecently, the Fed’s most important monetary pol-icy instruments were its asset purchases.35
WRAPPING UPWhen the FOMC met on August 7, 2007, and
declared that inflation was still a bigger threatthan unemployment, no one could have guessedwhat the coming years would bring. When theFOMC met on September 16, 2008, the day afterthe Lehman bankruptcy, probably no one imag-ined what the Fed would wind up doing over thenext six months. The quantitative easing policiesthat began as a trickle in 2007, but became a floodafter the Lehman failure, may have changed theFed forever. They have certainly raised numerousquestions about its policy options, its operatingprocedures, and its position within the U.S.government.
The Fed’s entrance strategy into quantitativeeasing was ad hoc and crisis driven at first, but itbecame more orderly and thoughtful as timewent by. It was a wonderful example of learningby doing. But the Fed now finds itself on an alienplanet, with a near-zero funds rate, a two-trillion-
Blinder
FEDERAL RESERVE BANK OF ST. LOUIS REVIEW NOVEMBER/DECEMBER 2010 477
32 Both bills require the approval of the proposed Financial StabilityOversight Council, which is to be chaired by the Secretary of theTreasury. The House bill also requires explicit approval from theTreasury secretary.
33 This report should probably be kept confidential for a while, asboth bills recognize.
34 The Dodd-Frank Act was passed several months (July 21, 2010)after this lecture was given.
35 Both the House and Senate bills draw sharp distinctions betweenSection 13(3) lending to specific institutions, which would beprohibited, and more generic Section 13(3) lending aimed at mar-kets, which would be allowed. The latter is, arguably (unconven-tional) monetary policy.
REFERENCESBernanke, Ben S. “Semiannual Monetary Policy Report to the Congress.” Testimony before the Committee onFinancial Services, U.S. House of Representatives, Washington, DC, July 21, 2009a;www.federalreserve.gov/newsevents/testimony/bernanke20090721a.htm.
Bernanke, Ben S. “The Federal Reserve’s Balance Sheet: An Update.” Speech at the Federal Reserve BoardConference on Key Developments in Monetary Policy, Washington, DC, October 8, 2009b; www.federalreserve.gov/newsevents/speech/bernanke20091008a.htm.
Bernanke, Ben S. “Federal Reserve’s Exit Strategy.” Testimony before the Committee on Financial Services,U.S. House of Representatives, Washington, DC, February 10, 2010a; www.federalreserve.gov/newsevents/testimony/bernanke20100210a.htm.
Bernanke, Ben S. “Federal Reserve’s Exit Strategy.” Testimony before the Committee on Financial Services,U.S. House of Representatives, Washington, DC, March 25, 2010b; www.federalreserve.gov/newsevents/testimony/bernanke20100325a.htm.
Blinder, Alan S. The Quiet Revolution: Central Banking Goes Modern. New Haven, CT: Yale University Press, 2004.
Curdía, Vasco and Michael Woodford. “The Central-Bank Balance Sheet as an Instrument of Monetary Policy.”Presented at the 75th Carnegie-Rochester Conference on Public Policy, “The Future of Central Banking,”April 16-17, 2010; www.carnegie-rochester.rochester.edu/april10-pdfs/Curdia%20Woodford.pdf.
Friedman, Milton. “The Role of Monetary Policy.” American Economic Review, March 1968, 58(1), pp. 1-17.
Keister, Todd; Martin, Antoine and McAndrews, James. “Divorcing Money from Monetary Policy.” FederalReserve Bank of New York Economic Policy Review, September 2008, pp. 41-56;www.newyorkfed.org/research/EPR/08v14n2/0809keis.pdf.
Keister, Todd and McAndrews, James. “Why Are Banks Holding So Many Excess Reserves?” Federal ReserveBank of New York Current Issues in Economics and Finance, December 2009, 15(8), pp. 1-10; www.newyorkfed.org/research/current_issues/ci15-8.pdf.
Krugman, Paul R. “It’s Baaack: Japan’s Slump and the Return of the Liquidity Trap.” Brookings Papers onEconomic Activity, 1998, 29(2), pp. 137-205.
Meltzer, Allan. “The Fed’s Anti-Inflation Exit Strategy Will Fail.” Wall Street Journal, January 27, 2010.
Modigliani, Franco and Sutch, Richard. “Innovations in Interest Rate Policy.” American Economic Review,March 1966, 56(1/2), pp. 178-97.
Reifschneider, David and Williams, John C. “Board Staff Presentation to the FOMC on the Implications of theZero Bound on Nominal Interest Rates.” Federal Reserve Board of Governors, January 29, 2002; www.federalreserve.gov/monetarypolicy/files/FOMC20020130material.pdf (see Appendix 3, pp. 157-64).
Blinder
478 NOVEMBER/DECEMBER 2010 FEDERAL RESERVE BANK OF ST. LOUIS REVIEW
dollar balance sheet, a variety of dodgy assets,holes in the wall separating the Fed from theTreasury, Congress up in arms, and its regulatoryrole up in the air.
Your mission, Mr. Bernanke, since you’vechosen to accept it, is to steer the Federal Reserveback to planet Earth, using as principal aspects
of your exit strategy some new instruments youhave never tried before. As always, should youor any member of the Fed fail, the Secretary andCongress will disavow any knowledge of youractions. This lecture will self-destruct in fiveseconds. Good luck, Ben.
Svensson, Lars E.O. “Escaping from a Liquidity Trap and Deflation: The Foolproof Way and Others.” Journal ofEconomic Perspectives, Fall 2003, 17(4), pp. 145-66.
Taylor, John B. “An Exit Rule for Monetary Policy.” Unpublished manuscript, Stanford University, February 10,2010; www.stanford.edu/~johntayl/House%20FSC%20Feb%2010%202010.pdf.
Taylor, John B. “The Need for a Clear and Credible Exit Strategy,” in John Ciorciari and John Taylor, eds., The Road Ahead for the Fed. Chap. 6. Stanford, CA: Hoover Institution Press, 2009, pp. 85-100.
Taylor, John B. and Williams, John C. “A Black Swan in the Money Market.” American Economic Journal:Macroeconomics, January 2009, 1(1), pp. 58-83.
Ugai, Hiroshi. “Effects of the Quantitative Easing Policy: A Survey of the Empirical Evidence.” Bank of JapanWorking Paper No. 06-E-10, July 2006; www.boj.or.jp/en/type/ronbun/ron/wps/data/wp06e10.pdf.
Blinder
FEDERAL RESERVE BANK OF ST. LOUIS REVIEW NOVEMBER/DECEMBER 2010 479
480 NOVEMBER/DECEMBER 2010 FEDERAL RESERVE BANK OF ST. LOUIS REVIEW