Embed Size (px)
Citation preview

Francesco Russo & Giuseppe Musolino, Int. J. Transp. Dev. Integr., Vol. 4, No. 2 (2020), 103–112
© 2020 WIT Press, www.witpress.comISSN: 2058-8305 (paper format), ISSN: 2058-8313 (online), http://www.witpress.com/journalsDOI: 10.2495/TDI-V4-N2-103-112
Quantitative CHaRaCteRiStiCS foR PoRt geneRationS: tHe itaLian CaSe StuDY
fRanCeSCo RuSSo & giuSePPe MuSoLinouniversità Mediterranea di Reggio Calabria, italy.
aBStRaCtSeveral classifications of ports were proposed in the literature, but there is no single established or accepted framework or taxonomy due to the complexity and diversity of the port entities.
in 1990s, unCtaD introduced a new classification based on the definition of port-generation, according to which some prevalent ports’ characteristics could be associated to discrete time periods, the so-called generations. unCtaD fully defined the characteristics of three generations of ports, while the fourth-generation port was less specified. Later, several researchers criticized the definition of port-generation and proposed new elements of classification, mainly of qualitative nature.
the objective of the paper regards to the definition of an operative basis for the quantitative specifica-tion of ports’ characteristics, based on unCtaD port-generation approach. the definition of a specific generation for a port is not a vote, or an element of ranking; but, a synthetic indicator about his main role in the worldwide network. Several ports were object, in the time, of a process of hybridization. they were born with specific characteristics and, later, they evolved in acquiring new ones.
the paper, after the presentation of a revised port-generation classification, proposes some indica-tors to identify each of the three generations defined by unCtaD. the applicative section presents the preliminary results of the calculation of the specified indicators to a set of italian ports.Keywords: commercial ports, port-generation approach, quantitative indicators.
1 intRoDuCtionPorts historically played a crucial role in the economy of countries, acting as gates for the exchange of people and goods: from the Phoenician people, and before great part of the mythology, to the first and second industrial revolution. However, since the first half of the 20th century, ports have been going through relevant changes.
as globalization of national economies has shifted from investment-led (or import-substitution) to export-oriented policies, a great increase was registered in external trade volumes generated in some regions of the world. this emphasized the strategic importance of ports in national economies and in global trade and freight traffic [1], as integral part of the supply chain with ports as crucial nodes [2].
in the literature, different attempts were made to introduce ports classifications or taxono-mies. the difficulties in identifying commonly accepted ones lie in the complexity and het-erogeneity of ports. united nations Conference on trade and Development, unCtaD ([3], [4]) coined the definition of port-generations. in 1994, unCtaD [3] defined the characteris-tics of three generations of ports according to some criteria, while in 1999 introduced a less specified definition of fourth-generation port. a debate, still present today, among researchers has been generated on the unCtaD definitions in the effort to develop and specify new ele-ments of classification, mainly of qualitative nature ([5], [6], [7], [8]).
the objective of the paper concerns the analysis and evaluation of ports’ characteristics, according to quantitative indicators linking descriptive characteristics of a port to its attrac-tiveness and operational performances. the specification of quantitative indicators is associ-ated to characteristic elements of each port generation.

104 Francesco Russo & Giuseppe Musolino, Int. J. Transp. Dev. Integr., Vol. 4, No. 2 (2020)
the preliminary results of the application concern a set of italian ports, by partially calcu-lating the specified indicators in the current conditions. in this way, it is possible to consider italy as a case study.
the following part of the paper is articulated into four sections. Section 2 presents a revised port-generation classification, identifying some observed traditional characteristics of the ports, and reports the specification of indicators for each generation of port. Section 3 reports the preliminary results of an application with the specified indicators to some italian ports. finally, the research perspectives are presented in the last section.
2 ReviSeD PoRt-geneRation aPPRoaCH: inDiCatoRS SPeCifiCationthis section presents a proposal of quantitative indicators for each port-generation, in order to sketch the main role of a port. it is worth to recall that the passage from a generation to another is not discrete, but it is continuous. Moreover, it is common to observe the coexist-ence of different activities in a port, as a result of a hybridization of the single port that was born with specific characteristics and can evolve acquiring new ones.
the port-generation approach, as defined in unCtaD [3], classified ports from the first-generation stage to the third-generation stage under the five categories, such as:
1) attitude and strategy of port development: 1.i. conservative/changing point of transport mode; 1.ii. expansionist/transport, industrial and commercial centre; 1.iii. commercial oriented/integrated transport centre and logistic platform for interna-
tional trade;
2) scope of activities: 2.i. cargo loading/discharging storage/navigational service; 2.ii. cargo transformation/ship-related industrial and commercial services; 2.iii. cargo and information distribution/logistic activities;
3) organization characteristics: 3.i. independent activities within port/informal relationship between port and port
users; 3.ii. closer relationship between port and port users/loose relationship between activi-
ties within the port/casual relationship between port and municipality; 3.iii. united port community/integration of port with trade and transport chain/close
relationship between port and municipality/ enlarged port organization;
4) production characteristics: 4.i. cargo flow/simple individual service/low value-added, 4.ii. cargo flow/cargo transformation/combined services/improved value-added; 4.iii. cargo and information flow/cargo and information distribution, multiple service
package/high value added;
5) decisive factors: 5.i. labour and capital; 5.ii. capital; 5.iii. technology and know-how.

Francesco Russo & Giuseppe Musolino, Int. J. Transp. Dev. Integr., Vol. 4, No. 2 (2020) 105
the above five categories allow to shape three changing periods for ports, identifying three generations of ports.
the first generation of ports, before the Second World War, is given to us by history. Ports were directly connected with the cities. even more: for the first-generation ports, cities were born where ports were. firstly, the port is born and, then, the city around, which grows in symbiosis with the port ([9], [10]). this element remains an indissoluble union over the cen-turies. Cities are fed by ports and urban productions are sent to other cities via ports ([11], [12]). the model remains constant; it goes through the millennia. the Roman road network and, then, making a leap in time, the railway network, allow the urban systems to arise far from the ports.
the ships that arrive at the ports are initially promiscuous and, then, segmented into freight and passengers. Cargo ships are typically structured for dry goods of various types, generally for bulk cargoes. Passenger ships go from the historical transatlantic to today’s cruise ships.
the quantitative indicators that could be associated to the first generation of ports refer to:
• distance of port from the nearest city larger than 200,000 inhabitants [km];
• density population in the area close to the port [inhabitants/km2];
• presence of services activities [number of firms, number of employees];
• (financial) flow exchanged with the city for final demand (consumption);
• (financial) flow exchanged with the city for intermediate demand (consumption).
the second generation of ports, after the Second World War, develops after the birth of large industrial systems and it is established during the 20th century. Large ports are built close to the industrial areas. Heavy industrial sectors need huge loading capacity, direct connections without constraints on shapes, lengths and unit of loads. the steel industry, the petrochemi-cal, the power plants, etc., determine the birth of second-generation ports. the technical characteristics are different; large yards close to the quays, oil terminals with sophisticated security systems, starting points for oil pipelines and power lines. the territorial paradigm is modified: firstly, the industrial plant was settled and, then, the port was built for serving the industrial plant.
in the last decades, the urban sprawl determined an extension of the urban perimeter, until reaching the port area and sometimes incorporating the areas where the industrial plants are located. the ships that arrive at the ports are already more specialized. the oil tankers are born, with the subsequent variations of hull and technology, they evolve up to the Lng ships.
given the elements related to the first generation, the quantitative indicators that could be associated to the second generation of ports refer to:
• number of employees in industrial plants close to the port [number of employees];
• density of industrial plants close to the port [number of employees/km2];
• amount of liquid bulk handled in the port [tons×1,000];
• ratio between the amount of liquid bulk and total freight handled in the port [%].
the third generation of ports, after the 1980s, was born within the same maritime transport systems, one could say for endogenesis. it was born with the container revolution. McLean’s box appeared in 1957, but only in the 1960s it acquired a first industrial release. in the 1980s container tried to hook dry bulk goods. in the last decade of the 20th century, unitized

106 Francesco Russo & Giuseppe Musolino, Int. J. Transp. Dev. Integr., Vol. 4, No. 2 (2020)
transport via container by sea is definitely established as the most economically advanta-geous on the trade markets, with the double possibility of container handling from berth to ship [13]: lift-on-lift-off (lo-lo) and roll-on-roll-off (ro-ro). the cost of transport is cut down and whole macro-regions (as the asian one) are allowed to enter into the global trade market. this allowed to shift their economies from investment-led (or import-substitution) to export-oriented ones.
the ships that arrive into the ports are hyper-specialized. Container ships are born, fol-lowed by deep-sea ferries. the first ones allow simplifying the life of large carriers by reduc-ing the internal times inside ports. the growth of the dimensions allows to reduce more and more transportation cost. Container ports are born; ports having well-defined technical and functional characteristics: long docks, high backdrops, large equipped yards, gigantic cranes.
from the economic point of view, ports raise the added value of the goods that transit through them, not only due the traditional advantage of position (which is historically the role of the ports), but due also to the manipulations that are placed in the goods. Many literature items consider the supply/demand into the system transport approach ([14], [15], [16], [17]). a trivial example is that of two containers that come from two different areas of the planet, one is full of car tires, and the other of wheel rims. as the containers are opened, the tires are mounted on the rims and at the end of the job they are put back into another single container, which is sent to the car manufacturer. third-generation ports are united by breaking down administrative costs and increasing the number of operators within the system.
given the elements related to the first and second generations, the quantitative indicators that could be associated to the third generation of ports refer to:
• container throughput in the port [teus];
• ratio between containerized freight and total freight handled in the port [%];
• amount of import/export through the port from closer areas (regional port) [tons×1,000];
• amount of import/export through the port from farther areas (gateway) [tons×1,000].
3 aPPLiCation to itaLian CoMMeRCiaL PoRtSthis section reports the preliminary results of an application of the identified indicators related to the three generations to a set of italian commercial ports.
after the fall in 2009, italian commercial ports had a gradual increase from 2013 reaching 483.8 [tons×106] of handled freight in 2016. they mainly handled: liquid bulk with 182.3 [tons×106] and 37.7% of share; container with 114.7 [tons×106] and 23.7% of share; and ro-ro with 93.9 [tons×106] and 19.4% of share [18].
figure 1 shows a picture of italy, with the location of main italian commercial ports. in Southern italy, the ports of Catania, augusta and taranto (ionian range) and the ports of gioia tauro and naples (South tyrrhenian range) are selected. in the northern italy, the ports of genova, La Spezia and Livorno (north tyrrhenian range) and the ports of Ravenna, venezia and trieste (north adriatic range) are selected.
Starting from the set of indicators presented in Section 2 for each port-generation, that have a high degree of complexity, a single indicator for each generation has been identified, in order to obtain the maximum explanatory capacity.

Francesco Russo & Giuseppe Musolino, Int. J. Transp. Dev. Integr., Vol. 4, No. 2 (2020) 107
the distance between port and city (with more than 200,000 inh.), d [km], has been consid-ered as indicator connected to the first-generation characteristic. the results of the calculation for each port are reported in fig. 2, which emphasized that gioia tauro and augusta are far than the closest city, respectively, 40 km (from Reggio Calabria) and 49 km (from Catania). the other ports have distances from their own cities in less than 5 km.
figure 1: Main italian commercial ports (source: Regulation eu 1315/2013).

108 Francesco Russo & Giuseppe Musolino, Int. J. Transp. Dev. Integr., Vol. 4, No. 2 (2020)
0
10
20
30
40
50
60
Km
Distance port-city (km)
figure 2: Set of italian ports: distance city-port [km].
figure 3: Set of italian ports: values of liquid bulk [tons×1,000] (year 2016).
0
5000
10000
15000
20000
25000
30000
35000
40000
45000
[ton
n*10
00]
Liquid bulk [tonn*1000]
as indicators connected with the second- and third-generation characteristics, it is consid-ered, respectively:
• the amount of liquid bulk handled in the port [tons×1,000] and the ratio between the amount of liquid bulk and total freight handled in the port [%];
• the container throughput (lo-lo) in the port [teus] and the ratio between containerized freight and total freight handled in the port [%].
a picture of the indicators related to second-generation characteristics is reported in fig. 3, for what concerns the amount of handled liquid bulk, and in fig. 4, for what concerns the ratio between the amount of liquid bulk and total freight handled in the port [%].
Francesco Russo & Giuseppe Musolino, Int. J. Transp. Dev. Integr., Vol. 4, No. 2 (2020) 109
figure 4: Set of italian ports: liquid bulk/total freight [%] (year 2016).
0.010.020.030.040.050.060.070.080.090.0
100.0
[%]
Liquid bulk/Total freight [%]
0
500
1,000
1,500
2,000
2,500
3,000Container (TEUs*1000)
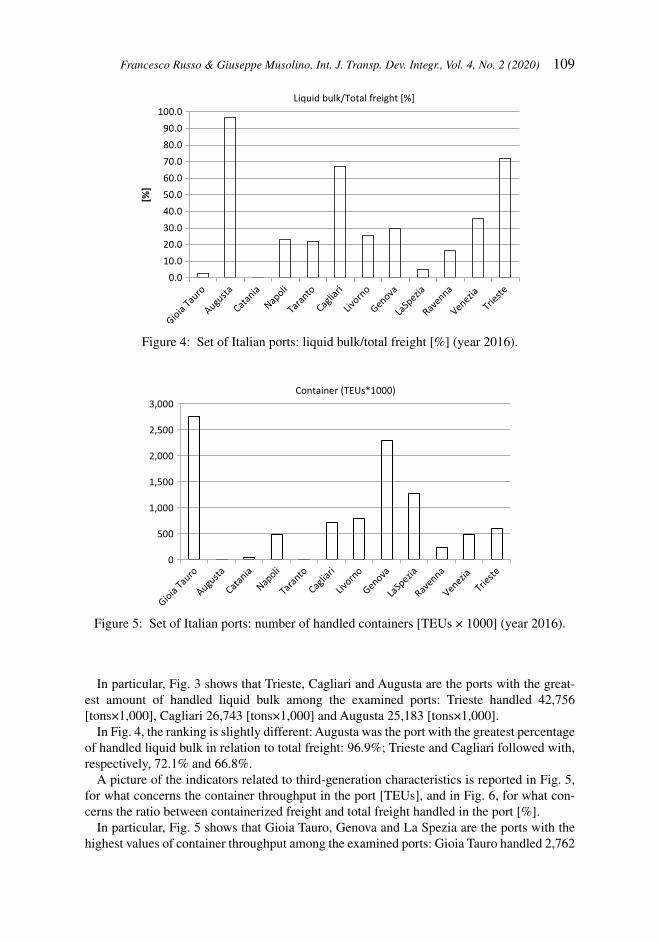
figure 5: Set of italian ports: number of handled containers [teus × 1000] (year 2016).
in particular, fig. 3 shows that trieste, Cagliari and augusta are the ports with the great-est amount of handled liquid bulk among the examined ports: trieste handled 42,756 [tons×1,000], Cagliari 26,743 [tons×1,000] and augusta 25,183 [tons×1,000].
in fig. 4, the ranking is slightly different: augusta was the port with the greatest percentage of handled liquid bulk in relation to total freight: 96.9%; trieste and Cagliari followed with, respectively, 72.1% and 66.8%.
a picture of the indicators related to third-generation characteristics is reported in fig. 5, for what concerns the container throughput in the port [teus], and in fig. 6, for what con-cerns the ratio between containerized freight and total freight handled in the port [%].
in particular, fig. 5 shows that gioia tauro, genova and La Spezia are the ports with the highest values of container throughput among the examined ports: gioia tauro handled 2,762

110 Francesco Russo & Giuseppe Musolino, Int. J. Transp. Dev. Integr., Vol. 4, No. 2 (2020)
figure 6: Set of italian ports: containerized freight/total freight [%] (year 2016).
0.010.020.030.040.050.060.070.080.090.0
100.0
[%]
Container / Total freight [%]
figure 7: Set of italian ports: comparison based on the three-generation indicators.
0
10
20
30
40
50
60
70
80
90
100
GioiaTauro
Catania
Augusta
Napoli
Taranto
Cagliari
Livorno
Genova
LaSpezia
Ravenna
Venezia
Trieste
Distance port-city [min 100%-max 0%] Liquid bulk /Total freight [%]Container /Total freight [%]

Francesco Russo & Giuseppe Musolino, Int. J. Transp. Dev. Integr., Vol. 4, No. 2 (2020) 111
[teus×1000], genova 2,297 [teus×1000] and La Spezia followed with 1,272 [teus×1000]. in this case also, according to fig. 6, the ranking changes by considering the percentage of handled containerized freight in relation to total freight: gioia tauro was still the port with the greatest percentage of containerized freight in relation to total freight: 96.3%; La Spezia had a percentage of 85.3% and genova followed with 44.7%.
a general view of the indicators related to three generations is reported in the data presented in the radar diagram of fig. 7. firstly, it is necessary to point out that the indicator related to the first generation, distance port-city [km], has been standardized as (in other to be homog-enized with the other two ones, expressed in [%]):
dist 0 100 100, / .max max min = × −( ) −( )d d d d (1)
the following elements emerge from the data presented in the radar diagram. gioia tauro handles almost exclusively containers (third-generation characteristic) with weak relations with the closest city. La Spezia has a similar condition, even if in minor quantities, of gioia tauro. augusta handles only liquid bulk, as it is an industrial port (second-generation char-acteristic).
Cagliari has a similar condition, even if in minor quantities, of augusta. trieste has a rel-evant component of handled liquid bulk; however, it has a strong relationship with its own city and a significant component of handled containers. genova has relevant components of handled liquid bulk and containers, with a strong relationship with its own city.
the results show a clear identification in a specific generation for the ports of Catania, Ravenna, augusta and gioia tauro. the value of the indicator for the dominant characteristic of each of the three ports is close to 100. the distance city-port (first generation) indicator for Catania and Ravenna is respectively 99.6 and 96.3; the liquid bulk/total freight (second generation) indicator for augusta is 96.9; the containerized freight/total freight (third gen-eration) indicator for gioia tauro is 96.9. the evaluation of these elements could lead to the specification of indicators for further ports’ generations.
4 ConCLuSionSthe paper regards to the definition of an operative basis for the single quantitative indicators of ports’ characteristics, based on port-generation approach. Quantitative indicators associ-ated to characteristic elements of the first three port generations are specified; and they are applied to a set of italian commercial ports.
the preliminary results highlight the following elements. the existence of one predomi-nant economic function in some ports, with a clear propensity to belong to one generation, as it is the case of gioia tauro for container (third generation) and of augusta for liquid bulk (second generation). the coexistence of more than one relevant function in other ports, with the presence of a hybridization process among generations, as it is the case of genova. taranto, Catania and Ravenna have a strong interaction with their own cities (first genera-tion). taranto hosted a container terminal operator from 2001 until 2014, when the terminal company decided to move in Piraeus, causing the collapse of container traffic and losing its third-generation characteristics.
further work concerns two main directions. the first relates to the specification of further ports’ generations, by specifying indicators belonging to current (and next) port-generations, as already emerged in the application. the second concerns the development of the applica-tion to the main commercial ports of the Mediterranean Basin.

112 Francesco Russo & Giuseppe Musolino, Int. J. Transp. Dev. Integr., Vol. 4, No. 2 (2020)
RefeRenCeS [1] Russo, f., Musolino, g. & assumma, v., an integrated procedure to estimate demand
flows of maritime container transport at international scale. International Journal of Shipping and Transport Logistics, 6(2), pp. 112–132, 2014.
[2] Russo, f. & Rindone, C., Container maritime transport on an international scale: Data envelopment analysis for transhipment port. WIT Transactions on Ecology and the En-vironment, 150, pp. 831–846, 2011.
[3] unCtaD, Port marketing and the challenge of the third generation port. trade and Development Board Committee on Shipping ad hoc intergovernment group of Port experts, 1994.
[4] unCtaD, Fourth-generation Port: technical note. Ports newsletter n. 19, prepared by unCtaD Secretariat, 1999.
[5] Paixao, a.C. & Marlow, P.B., fourth generation ports: a question of agility? Interna-tional Journal of Physical, Distribution & Logistics Management, 33(4), pp. 355–376, 2003.
[6] Beresford, K.C. & gardner, B.M., Pettit S.J. & Wooldridge C., the unCtaD and WoRKPoRt models of port development: evolution or revolution? Maritime Policy & Management, 31(2), pp. 93–107, 2004.
[7] Bichou, K. & gray, R. a critical review of conventional terminology for classifying seaports. Transportation Research Part A, 39, pp. 75–92, 2005.
[8] flynn, M., Lee, P.t.W. & notteboom, t., the next step on the Port generations Ladder: Customer-Centric and Community Ports. Current Issues in Shipping, Ports and Logis-tics, ed. t. notteboom, university Press antwerp: Brussels, pp. 497–510, 2011.
[9] Polimeni, a. & vitetta, a., vehicle routing in urban areas: an optimal approach with cost function calibration. Transportmetrica B, 2(1), pp. 1–19, 2014.
[10] Musolino, g., Rindone, C. & vitetta, a., Sustainable mobility and energy resources: a quantitative assessment of transport services with electrical vehicles. Renewable and Sustainable Energy Reviews, 113, pp. 109–236, 2019.
[11] Russo, f. & Musolino, g., a unifying modelling framework to simulate the Spatial economic transport interaction process at urban and national scales. Journal of Trans-port Geography, 24, pp. 189–197, 2012.
[12] Russo f., Rindone C. & Panuccio P., european plans for the smart city: from theo-ries and rules to logistics test case. European Planning Studies, 24(9), pp. 1709–1726, 2016.
[13] Russo, f., Musolino, g. & assumma, v., Competition between ro-ro and lo-lo services in short sea shipping market: the case of Mediterranean countries. Research in Trans-portation Business and Management, 19, pp. 27–33, 2016.
[14] Cantarella g.e. (ed.), Sistemi di trasporto: tecnica e economia, utet, 2008.[15] Cascetta e., Transportation Systems Analysis. Models and Applications, Springer-
verlag: new York, 2009.[16] Ben-akiva M., Meersman H. & van de voorde e. (eds.), Freight Transport Modelling,
emerald, 2013.[17] tavasszy, L. & de Jong, g. (eds.), Modelling Freight Transport, elsevier inc., 2014.[18] Censis, V Rapporto sull’economia del mare. Cluster marittimo e sviluppo in Italia.
federazione del Mare, 2015.[19] italian Ministry of infrastructures and transport, Piano Strategico Nazionale della
Portualità e della Logistica, Report finale, 2015.