Embed Size (px)
Citation preview
ISSN 1757-9694
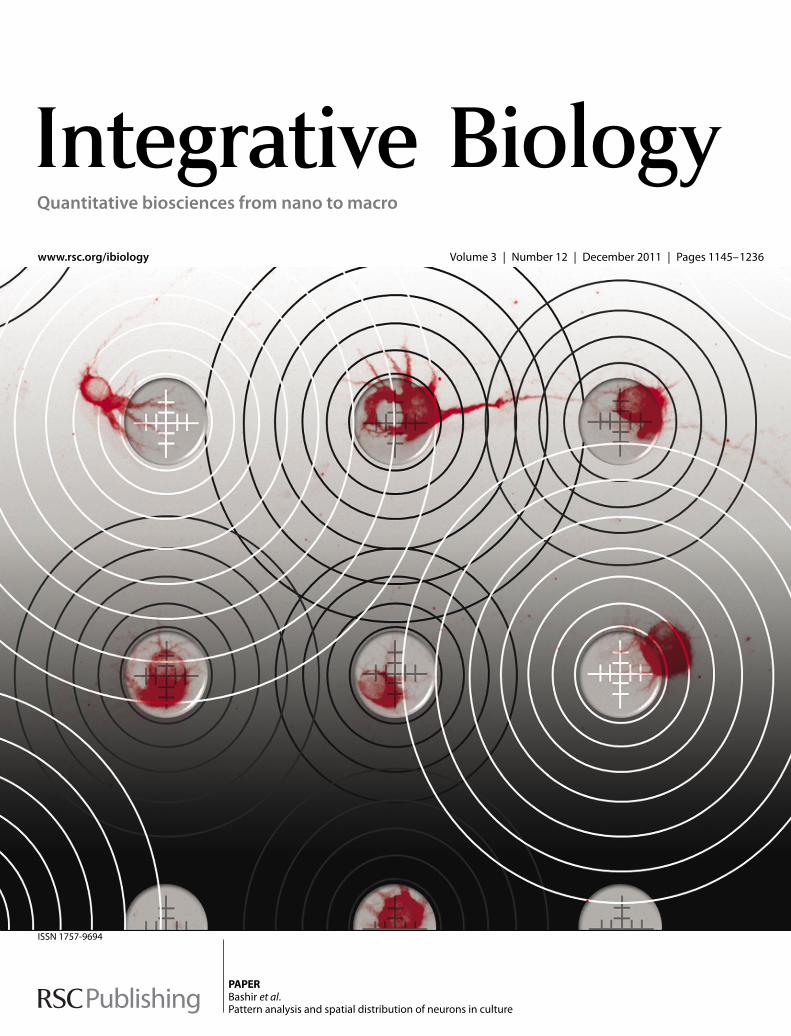
PAPERBashir et al.Pattern analysis and spatial distribution of neurons in culture
www.rsc.org/ibiology Volume 3 | Number 12 | December 2011 | Pages 1145–1236
Quantitative biosciences from nano to macro

This journal is c The Royal Society of Chemistry 2011 Integr. Biol., 2011, 3, 1167–1178 1167
Cite this: Integr. Biol., 2011, 3, 1167–1178
Pattern analysis and spatial distribution of neurons in culture
Larry J. Millet,abc
Mitchell B. Collens,bd
George L. W. Perryefand Rashid Bashir*
abd
Received 2nd June 2011, Accepted 20th October 2011
DOI: 10.1039/c1ib00054c
The nervous system is a complex, highly-ordered, integrated network of cells. Dispersed cultures of
neurons enable investigations into intrinsic cellular functions without the complexities inherent in the
intact nervous system. This culture process generates a homogeneously dispersed population that is
assumed to be spatially random. Despite the vast number of studies utilizing dispersed neurons, few
studies address the spatial distribution of large populations of neurons, in vitro. We used ink-jet
printing and surface chemistry to define patterned areas of poly-lysine adhesion (B50 mm spots)
juxtaposed against a fluorinated-silane background. We quantitatively analysed populations of
patterned neurons on printed protein spots, and unpatterned neurons. Using a microarray scanner,
we acquired large images (72 mm � 22 mm) of patterns, and neurons with and without patterns.
Fast Fourier transformation (FFT) image analysis was used to determine global alignment of
neurons to patterns. Through point pattern analysis, we described the spatial organization of
dispersed neurons with, or without, patterned substrates. Patterned neurons show spatial
organization characteristics reminiscent of printed patterns, with spatial distributions representative
of unpatterned neurons. Most notably, both patterned and unpatterned neurons show departure
from null models of complete spatial randomness (CSR; a homogeneous Poisson process) at shorter
distances with conformity to CSR occurring at longer distances. Cellular morphometrics show that
when compared to their unpatterned counterparts, spot-patterned neurons exhibit a significant
increase (p o 0.0001) in the mean dendritic circularity and an increase in the number of more
circular neurons. Through neurite tracing, we show that dendritic processes are also highly confined
to patterned areas, and that they are on average 58% shorter than dendrites of neurons without
patterns. Our findings show that patterned areas change the spatial organization of the somata and
dendrites of cultured neurons, and that traditional neuronal cultures deviate from CSR.
Introduction
Primary neuron cultures remain an indispensible approach to
advance neuroscience research. In vitro studies enable investi-
gations into the inherent molecular and cellular properties of
the neuron on a fundamental level, from the establishment of
neuronal polarity, to synaptic plasticity,1,2 drug development,3,4
and neurodegenerative disease research.5–8 An example is, the
work of Banker and colleagues, who pioneered elegant research
on the establishment and characterization of neuron cultures
aDepartment of Electrical and Computer Engineering, University ofIllinois at Urbana-Champaign, Urbana, IL 61801, USA.E-mail: [email protected]; Fax: 217-244-6375; Tel: 217-333-3097
bMicro and Nanotechnology Laboratory, University of Illinois atUrbana-Champaign, Urbana, IL 61801, USA
cNeuroscience Program, University of Illinois at Urbana-Champaign,Urbana, IL 61801, USA
dDepartment of Bioengineering, University of Illinois atUrbana-Champaign, Urbana, IL 61801, USA
e School of Environment, University of Auckland, Auckland,Private Bag 92019, New Zealand
f School of Biological Sciences, University of Auckland, Auckland,Private Bag 92019, New Zealand
Insight, innovation, integration
This study provides insight into the spatial distribution of
neurons in cell culture. Our innovative approach uses ink-jet
printing and microarray scanners to integrate pattern ana-
lysis and spatial statistics into neurobiology to resolve the
large-scale spatial distribution of patterned and unpatterned
neuron populations. We engineered neuronal substrates to
present developing neurons with a contrast of highly-adhe-
sive and loosely-adhesive substrates. This work is a focused
study on the ability of neuronal somata and dendrites to
align to engineered targets in vitro. A key finding of our study
is that patterned and unpatterned neuron populations
deviate from null models of complete spatial randomness.
Integrative Biology Dynamic Article Links
www.rsc.org/ibiology PAPER

1168 Integr. Biol., 2011, 3, 1167–1178 This journal is c The Royal Society of Chemistry 2011
demonstrating that neurons retain their characteristic morphologies
in culture.9 Other studies show that neurons in culture exhibit
density-dependent viability.10
Understanding the characteristics of the emergent behaviour of
neurons in culture is important,6 because it has implications for the
results and conclusions of the in vitro study. For example, common
media formulations used in culturing primary neurons are under
renewed scrutiny due to the bias imposed by media reagents.11–13
Many other questions remain unaddressed. For example, what
is the spatial distribution of neurons in 2-D culture? How does
the cellular distribution influence the process of differentiation
and maturation within the culture? How do culture conditions,
such as substrates and co-cultures, influence the spatial distri-
bution of neurons in culture? Answering these and other funda-
mental, distribution- and density-dependent questions will
further refine the cell culture process and advance studies that
seek to resolve the intrinsic and extrinsic cellular influences.
Investigations of neurons in vitro have been high-resolution and
low-throughput. In the former, neurons have received unprece-
dented exposure through dynamic imaging studies, complemented
with detailed molecular and immunochemical investigations. For
the latter, relatively few neurons in the cell culture population are
used because imaging, counting, and classifying hundreds or
thousands of cells is exhausting and time consuming.14 Therefore,
random sampling and statistical methods are often used to
describe the population, treatment or condition.14–16
Incorporating new methods of analyses will further aid in
answering these questions. The implementation of spatial statistics
in cell biology has the potential to provide a greater understanding
of the composition and behaviour of cellular clusters and systems
that will empower cell and tissue engineering in vitro.
Large-scale, high resolution analyses have the potential to
reveal insights into intercellular spatial relationships through
multivariate analyses. Despite the decades of research on
dispersed neurons in culture, there is much to be learned about
the spatial order and relationship between neurons in cultures.14–16
Here, we employ pattern analysis and spatial statistics to study the
distribution of large, spatially homogeneous neuronal populations
(44000 neurons). We use inkjet printing to produce defined
patterns of cell-adhesive poly-lysine; the unpatterned glass is
blocked with less adhesive fluorinated-silanes. The juxtaposition
of synthetic substrates provides primary neurons with a surface of
contrasting physicochemical properties. Using pattern analysis
and spatial statistics, we analyse substrate patterns, patterned
neurons, and neurons without patterns.
Our results demonstrate that large-scale spatial analyses are
able to detect the alignment of neuronal somata and dendritic
fields to the patterned substrates, and that unpatterned neurons
in culture can deviate from a null model of complete spatial
randomness (CSR; a homogeneous Poisson process).17 With the
ability to generate large-scale patterns that influence the distribution
of neurons, we can compare conventional dissociated neuron
cultures with patterned cultures to add additional insight to
the spatial characteristics of neurons in vitro.
Materials and methods
An overview of the neuron patterning process is shown in
Fig. 1A. Stock glucose ink solutions are formulated to achieve
10–12 cP and B34 mN m�1. Inks are then printed via Inkjet
printing, the pattern quality is viewed by imaging the samples
with a microarray scanner. Printed microscope slides are
blocked with fluorinated silanes and sterilized for cell culture.
Samples are prepared for cell attachment by flood coating with
poly-L-lysine. Primary postnatal hippocampal neurons are
cultured, fixed, labelled with antibodies, and dried. Samples
are imaged with a microarray scanner and fluorescence micro-
scope for analysis.
Ink formulation and characterization
Fluorescent proteinaceous glucose ink. A stock glucose
(100–105% (w/v)) ink solution is made by dissolving 200–210 grams
of glucose in 200 mL of DI water or phosphate buffered saline
(PBS). Tween-20 (1% (v/v) final concentration) is added to decrease
surface tension; to increase the accuracy of the final concentration, a
25% stock of Tween-20 is used for dilutions. Fluorescent proteins
are diluted in the stock ink to yield printable inks, one ink contains
fluorescein-conjugated poly-L-lysine (FITC-PLL), and the other
contains Rhodamine-BSA (R-BSA).
Glucose ink characterization. According to the printer manu-
facturer, optimal inkjet printing with a Fuji-Film Dimatix DMP-
2831 printer (FUJIFILM Dimatix, Santa Clara, CA) is achieved
when the final ink viscosity and surface tension is between
10–12 cP and 28–30 mN m�1, respectively. The viscosity is
measured using a rotating cylinder viscometer (Brookfield DV
II+ pro), a low viscosity cylinder (spindle 00, 20% motor power,
and 22.8 C) is used to measure viscosities below 15 cP. To reduce
measurement error, we use 15mL aliquots to acquire two separate
independent measurements. Surface tension is determined using a
drop tensiometer (Attension Theta Lite). To reduce measurement
error, the surface tension of the ink is measured four times.
Fig. 1B shows the relationship between the viscosity and surface
tension; values were measured during the formulation of our
proteinaceous-glucose ink stock solution.
Ink-jet printing
Cleaning microscope slides.Microscope slides, 75 mm (long)�25 mm (wide)� 1 mm (thick), are cleaned and prepared for ink-jet
printing by either piranha cleaning or sonication. Piranha cleaning
is the preferred method; slides are immersed in a 3 : 1 ratio of
sulphuric acid (H2SO4) and 30% hydrogen peroxide (Sigma-
Aldrich) for 45 min. After piranha cleaning, slides are rinsed with
ethanol, dried, and cleaned with oxygen plasma. Alternatively,
glass slides can be cleaned by (1) sonication in acetone (3 min), (2)
rinsing with acetone, (3) sonication in ethanol (3 min), (4) rinsing
with ethanol, (5) drying with nitrogen, and (6) cleaning with
oxygen plasma (1 min) in a barrel etcher (Diener Pico). Either
cleaning process renders the glass microscope slide hydrophilic
and ready for printing.
Ink-jet printing on microscope slides. 1.5 mL of the final ink
solution undergoes degassing and filtering through a 0.22 mmfilter as the ink is injected into the bladder of the cartridge
(Dimatix type 11610). For optimal printing results, cartridges
are assembled and allowed to sit overnight in a humidified
incubator (37 1C) before use.

This journal is c The Royal Society of Chemistry 2011 Integr. Biol., 2011, 3, 1167–1178 1169
Droplet ejection is optimized by tuning each of the 16 nozzles
with the Dimatix Drop Manager software. The target droplet
(10 pL) velocity is 6.0 m sec�1. The waveform editor is used to
adjust the droplet characteristics to eliminate satellite droplets
(Fig. 1C). Due to the thickness of the glass, the substrate
height settings are set to 1000 microns. The printer platen
temperature is set to 35 1C when in use.
Printed patterns are generated in the Drop Manager soft-
ware. Parallel lines are best printed parallel to the x-axis;
therefore, grid patterns are printed using two separate parallel
line patterning files. First, one set of parallel lines is printed.
Then the slide is rotated 901 to print the second set of grid
lines. Printing spot arrays is achieved with a single printing file,
but the density and complexity of the spot pattern can be
adjusted to achieve different results. Nozzles can be used
individually or in a set of two or more. Following inkjet
printing, patterned slides are imaged on a microarray scanner
to assess pattern quality before proceeding with surface
chemistry.
Blocking unpatterned glass. To block unpatterned regions of
the glass after printing, the patterned slides are passivated with
dimethyl(3,3,3-trifluoropropyl)chlorosilane (Sigma-Aldrich)
for 90 min under vacuum.18 Specifically, three patterned
microscope slides are placed in a square (90 mm � 90 mm)
Petri dish along with the cap removed from a 1.5 mL micro-
centrifuge tube containing 12.5 mL of silane.
Cell culture
Following the printing and passivation process, slides are
prepared for cell cultures by: (1) sterilization by immersion
in 70% ethanol for 30 min, (2) a brief rinsing with DI water,
(3) dipping into 25 ug mL�1 FITC-PLL in DI water for 15 min,
(4) rinsing with DI water for 10 min, and (5) rinsing with
Neurobasal-A (Invitrogen) culture media.
Hippocampal neurons. Primary hippocampal neurons are
cultured from postnatal (P1 to P4) Sprague Dawley rats and
are used in accordance with protocols established by the
University of Illinois Institutional Animal Care and Use
Committee and in accordance with all state and federal
regulations.
Bilateral hippocampi are dissected, prepared, and cultured
as previously described.19,20 Hibernate-A (Brain Bits, Springfield,
IL) and Neurobasal-A (Invitrogen) are supplemented with 0.5 mM
L-glutamine, Gem21 NeuroPlext (Gemini Bio-Products),
100 U mL�1 penicillin and 0.1 mg mL�1 streptomycin. Bilateral
hippocampi are dissected in cold Hibernate, and incubated in
papain (25.5 U mL�1) dissolved in Hibernate for 30 min at 37 1C
with periodic agitation. Following incubation, the tissue is
rinsed with enzyme-free Hibernate and the cells are released
through mechanical dissociation (trituration) with a fire-polished
Pasteur pipette in 2 mL of supplemented Hibernate. After
tissue chunks settle, the cell suspension is transferred to a new
vial and the trituration repeated once more. Dissociated cells
in solution are centrifuged at 1400 rpm for 5 min. The cells are
resuspended, counted, diluted in Neurobasal media, and
homogenously dispersed by plating (100–125 cells mm�2) in
a square 90 mm � 90 mm Petri dish containing 3 patterned
microscope slides. Cultures were maintained for 7–9 days
in vitro (DIV).
Human colorectal adenocarcinoma (HT-29) cells.HT-29 cells
are cultured on poly-lysine-coated microscope slides using
McCoy’s 5a media supplemented with fetal bovine serum
(10%) and 1% PenStrep. Cells are removed from culture
flasks using trypsinization for B5 min, dissociated with gentle
Fig. 1 Experimental overview and ink characterization. (A) A general
overview of the experimental process used here. (B) Custom inks were
made from a stock solution formulated to the viscosity of 10–12 cP
and surface tension of 33–35 mN m�1. Water and physiological saline
are about 1.0 cP and 72 mN m�1. Mean surface tension and viscosity
values based on 4 and 2 separate measurements, respectively. Mean
values are for inks with 100% glucose in the following: PBS+1%
Tween-20 (open triangles), DI water+1% Tween-20 (filled triangles),
PBS without Tween-20 (open circle), and DI water without Tween-20
(filled circles). (C) During initial setup and ink calibration, the jetting
voltage of each nozzle was adjusted to B16.0 V to optimize glucose-
PBS ink droplet velocity to 6 m sec�1; droplets are B10 pL each.
6 m sec�1 = 300 mm/50 ms strobe delay. The inset shows an image
from the drop watcher camera; the jetting nozzle holes are at the 0 mmgridline, and the droplets (shown at about the 300 mm gridline) are
ejected out to the targeted surface. Below the 500 mm gridline is a
shadow from the cartridge.

1170 Integr. Biol., 2011, 3, 1167–1178 This journal is c The Royal Society of Chemistry 2011
trituration, centrifuged for 5 min at 1400 rpm, suspended in
culture media and plated (100 cells mm�2) on poly-lysine-
coated microscope slides. Cells are allowed to attach for 4 h,
then samples are fixed with 4% paraformaldehyde, permeabilized
with 0.25% Triton X-100, labelled with DAPI (1 : 50 000,
5 min), rinsed with DI water, dried, and imaged with a
GenePix scanner.
Immunochemistry
Microscope slides containing neurons are fixed and labelled at
7–9 DIV. The samples are rinsed and fixed with pre-warmed
(37 1C) 4% paraformaldehyde for 30 min. Cells are permea-
bilized with 0.25% Triton X-100 in PBS and blocked at room
temperature with 2.5% bovine serum albumin (BSA) in PBS.
Primary and secondary antibodies are incubated with 2.5%
BSA in PBS. Microtubule associate proteins (MAP2 and tau)
are labelled to identify axons and dendrites, respectively.
Antibodies for MAP2 (Millipore, polyclonal AB5622) and
tau (Anti-Tau-1 clone PC1C6, monoclonal MAB3420) are
used with secondary antibodies Alexa488 and Alexa594
(Invitrogen). Following antibody labelling, samples are rinsed
with PBS, briefly rinsed with DI water (to prevent salt crystal
formation), dried, and imaged.
Imaging
Microscope slides are imaged with an Axon Genepix 4200A
Microarray Scanner (Langer) to quickly acquire large-scale
data from the microscope slide for analysis of patterns, and
neurons with and without patterns. The 488 nm and 532 nm
wavelength lasers are used with Alexa 488 and Texas Red
filters to image labelled patterns and neurons. The Genepix
4200A scanner resolution is 5 mm/pixel. High resolution
images for neurite tracing are acquired with a Spot RT-3
Slider monochrome camera (Diagnostic Instruments) mounted
on an upright Olympus BX51 fluorescence microscope.
Data analysis and statistics
Global pattern analysis. Fast Fourier transform (FFT)
analysis is performed on images21 of printed patterns and
patterned substrates with and without neurons. Because the
FFT is a mathematical manipulation transforming spatial
information to information in the frequency domain, the
frequency information can be used for pattern analysis to
resolve periodic changes in the pixel intensity of an image.
Image J 1.44o,22 is used for the image processing and for FFT
analysis as follows. First, images are cropped to a square
(2048 � 2048 pixels). Second, to limit edge effects and reduce
background noise, the background is subtracted, the contrast
is enhanced (0.4% saturated pixels, equalized histogram and
normalized intensity), and the image is filtered with a median
blur filter (two pixel radius). Third, the image is processed with
the Image J FFT processing tool ‘‘FFT’’ to produce a 2-D
image of the frequency information. The highest frequency
information is located at the centre pixels of the frequency
image while the lowest frequency information is in the outer
pixels of the image. Fourth, the frequency image must be
rotated 901 to compensate for a 901 rotation that occurs
during FFT processing. Fifth, an Image J oval profile plugin
is used to radially summate the frequency information to
produce a power spectrum. A power spectrum is a graphical
plot showing the intensity at each angle of alignment. Within
the circle, 01 correlates to 3 o’clock, 901 (12 o’clock), 1801
(9 o’clock), and 2701 (6 o’clock).
Spatial statistics. The coordinate points of cells are derived
from images acquired by a GenePix scanner. First, images are
thresholded to render a binary image of cells. Background
noise is filtered from the image to yield cellular points (formally
‘‘events’’).23 The centroid values of each event are exported to
Excel for statistical analysis. Due to the large datasets of
cellular events and the limitations on spatial statistical soft-
ware packages for handling large datasets, square areas
(B15 mm2) of 4000–5500 cellular events are analysed using
SpPack, a Visual Basic add-in for Excel.24
The univariate first-order nearest neighbour (NN) test (Clark-
Evans Statistic) is derived from the distance to the closest event
for each data point in the spatial point pattern.25 The test
estimates the distances for nearest neighbour events under
complete spatial randomness (CSR) and the departure from
the observed nearest neighbour distances from those expected
under a null model of CSR.23 The ratio R is the observed NN
distance divided by the expected NN distance of CSR. The edge-
corrected c-score evaluates the significance of R.
The univariate second-order spatial point pattern analyses
are performed using the cumulative Ripley’s K-function and
the neighbourhood density function (NDF). Ripley’s K test
provides the K(t), and its linear transformation L(t).26 This
cumulative test calculates (for each event) the number of
events within incrementally larger radii t, along with the high
and low bounds of the confidence envelope under simulations
of complete spatial randomness (CSR).24 Calculations are for
20 mm step lengths with weighted-edge corrections and a 99%
confidence envelope derived from 99 Monte Carlo realisations
of the null model of CSR.27,28
The neighbourhood density function (NDF; O)29 is a non-
cumulative second-order analysis that is a (rescaled) derivative
of Ripley’s K; it is analogous to the pair-correlation function.
The test counts the number of cellular events within a series of
annular, or O-ring, regions (x to dx) for all x + dx within the
plot. The counts are divided by the total area of the annuli,
with the number of neighbours and area being summed for all
events to yield a density function of individual events for the
average event. In SpPack, the NDF is calculated with 20 mmstep lengths to a maximum of 1000 mm. An edge-weighted area
correction (modified from Goreaud and Pelissier)30 is used.
99% confidence envelopes are estimated, with Monte Carlo
methods, from 99 realisations of the null model of CSR.
Cellular morphometrics
Image J is used to determine the circularity of patterned and
unpatterned neurons. For this data, 1 represents a perfect
circle and 0 represents a line. Patterned spots, neurons
cultured on spots, and randomly seeded neurons are analysed
and separated into 10 bins of 0.1 intervals. Line graphs are
generated and the number of neurons per circularity bin is
compared using Prism statistical software using Student’s
t-test.

This journal is c The Royal Society of Chemistry 2011 Integr. Biol., 2011, 3, 1167–1178 1171
Neurite analysis. High resolution images (0.38 mm per pixel)
of patterned and unpatterned neurons are used for local
neurite analysis. Neurite tracings are performed with Neuro-
lucida v9.62software (MBF Biosciences). Neuron reconstruction
of the cell body, axon, and dendrites is completed using a semi-
automated tracing technique. Tracings for all images are
combined and exported toNeurolucida Explorer. Polar histograms
for the patterned and unpatterned neurons are built in the
Neurolucida module to display neurite directionality. The
polar histogram is a 3601 projection of data which accounts
for neurite length and direction. In the projection, the length
of a wedge is equivalent to the total length of neurite processes
in a specified direction. A fan-in diagram is generated to
further study axon and dendrite directionality. Statistics for
determining dendritic length are performed in Prism using the
unpaired t-test.
Results
Inkjet-printed patterns
Inkjet printing was used to produce predefined substrate
patterns. To permit both the patterning of glass microscope
slides and the imaging of the printed patterns, a stock ink
solution was produced (100% Glucose, 1% Tween-20 in DI
water) and prepared for printing with either FITC-PLL or
R-BSA. Using these inks, we show that large grids, 72 mm (l) �22 mm (w), of lines and arrays of spots can be produced on
microscope slides (Fig. 2). Using the FITC-PLL ink, we
patterned lines measuring 90–100 mm wide; using two different
ink cartridges, we were able to print dual-labelled patterns of
both FITC-PLL and R-BSA inks (Fig. 2A–C). Fig. 2A shows
the entire image of a patterned grid. The details of single ink
and dual ink patterns are shown (Fig. 2B–C, grid of
625 squares). We also produced printed arrays of spots using
both ink formulations (Fig. 2D–F). The yield of good to
perfect slides is 12% for the FITC-PLL ink (50 out of 420
printed slides) and 50% for the R-BSA ink (20 out of 40
printed slides).
Primary, postnatal hippocampal neurons were cultured for
7–9 DIV on the printed and functionalized glass (see methods).
Fig. 2G shows the edge of the patterned area from one of the
microscope slides where patterned neurons and unpatterned
neurons are juxtaposed. Here the variation of the spatial
distribution of neurons and the morphology of the dendritic
field can be viewed for comparison.
Pattern analysis
The effectiveness of the substrate to influence neuronal align-
ment to the patterns was determined by implementing FFT
image processing methods to find the frequency and direction
of patterns within the images of neurons cultured on patterned
slides. For comparison, we also processed printed lines and
unpatterned neurons. Fig. 3A–C shows images and the corres-
ponding power spectrum of frequencies obtained from the
FFT process of patterned spot arrays without and with cells.
Distinct peaks for the coordinate axes (Fig. 3C inset, 01, 901,
1801, 2701) show increased frequencies of alignment for the
pattern alone. For neurons cultured on spot arrays, a similar
but attenuated power spectrum is obtained, whereas unpatterned
neurons show no alignment.
Images and FFT data of patterned parallel lines, with and
without neurons, show that neurons align to the pattern with
peaks appearing at both 01 and 1801 (Fig. 3D–F). The results
of randomly distributed neurons without patterns show a
noisy line without defined peaks, indicating no alignment for
unpatterned neurons.
Spatial statistics
To characterise the spatial distribution of patterned neurons
and unpatterned neurons, we used first- and second-order
Fig. 2 Printed patterns for neuronal culture. (A–F) Large-scale
patterns of fluorescein-conjugated poly-L-lysine (FITC-PLL) and rho-
damine-conjugated bovine serum albumin (R-BSA) are printed using
ink-jet printing. A large variety of printed patterns can be generated
from lines, to grids, to arrays of spots. (G) Patterned postnatal rat
neurons (P1-P2) were cultured on the spot-patterned and unpatterned
glass microscope slides from (F) above. The dendrites of neurons on
patterned spots are labelled with MAP2 antibodies. Patterned neurons
appear to show dendritic confinement compared to neurons on
adjacent internal controls (unpatterned surfaces). Scale bars are (A)
4 mm, (B) 320 mm, (C) 1 mm, (D) 1200 mm, (E) 600 mm, (F) 350 mm.

1172 Integr. Biol., 2011, 3, 1167–1178 This journal is c The Royal Society of Chemistry 2011
spatial point pattern analyses. Together, the events (cellular
centroids) represent a point pattern that we compare with a
null model of CSR (a homogeneous Poisson process).
Results of the first-order nearest neighbour point pattern
analysis show that the ratio R (observed : expected nearest
neighbour distances) of the patterned neurons is greater than
the ratio of the unpatterned neurons (Table 1). The c-score is
significant for patterned and unpatterned neurons, but the
patterned data c-scores are twice that of unpatterned neurons.
Diggles G test is a refined nearest neighbour analysis suited for
testing inter-event relationships at the scale of average NN
distances.31 Fig. 4A shows the observed G(w) and the simulated
G(w), the cumulative proportion of nearest neighbour distances
in the population. Based on G(w), the patterned neuron popula-
tion appears to depart more strongly from CSR than does the
unpatterned neurons. To compare the difference between the
observed G(w) and theoretical G(w), we subtract the G(w) from
the G(w) to obtain DG(w). By plotting DG(w) against the
distances (w), we determine the profile of deviation from CSR
for patterned and unpatterned neurons (Fig. 4B). The data shows
that on average, the DG(w) for patterned neurons is 1.47-times
greater than the DG(w) for unpatterned neurons.
A second-order point pattern analysis, Ripley’s K, is used to
determine clustering and dispersion of the spatial point pattern
data. When processing the point patterns with Ripley’s K(t),
the variance-stabilising L(t) transformation shows a robust
periodicity for patterned spots without neurons (Fig. 5A). The
magnitude of the periodicity decreases with increasing radii
distance (t), which approaches but does not converge upon
CSR. Negative values below the lower boundary of the
confidence envelope represent event dispersion up to a given
distance, whereas positive values above the upper boundary
represent event clustering up to that distance. Values within the
envelope suggest no departure from CSR.
Fig. 5B shows that point patterns of neurons on printed
spots have a profile and pattern similar to that observed in the
L(t) function of printed spot patterns without neurons. The
L(t) function shows periodicity in dispersion locally up to
smaller (t) radial distances (o1000 mm), and periodicity in
clustering beyond CSR up to larger (t) radial distances (1800 to
4000 mm). We expect that if the data were analysed with
different tessellation regimes, the plot characteristics would
shift toward step-wise profiles but the results would yield the
same trend in conformity. In other words, regardless of the
tessellation format, the patterned neuron data is expected to
continue to show similar characteristics of both the printed
spot patterns and unpatterned cells. For unpatterned neurons,
dispersion is observed for shorter radii (o750 mm) and to a
lesser degree than for patterns with and without neurons
(Fig. 5C).
To determine if the data are clustered or dispersed at
specified distances or intervals, we use the NDF, which is a
Fig. 3 Global alignment of neurons to ink-jet printed patterns. (A) Printed array ofB87 000 spots (5500 spots cm�2) 45–60 mm diameter, printed
with FITC-PLL ink. (B) Primary rat hippocampal neurons cultured on a patterned spot array for 9 DIV. (C) Power spectrum from 2-D FFT of
spot patterns and neurons with and without patterned substrates obtained from the corresponding images. (D) Printed parallel lines 60 mm (width) �20 mm (length). (E) Hippocampal neurons cultured on parallel line patters, 9 DIV. (F) Power spectrum from 2-D FFT of patterns, and neurons
with or without patterned parallel lines for substrates obtained from the corresponding images. (C, F) Data of FFT obtained from large-scale
images of panels shown here. Data for the printed patterns only (grey), patterned neurons (blue) and unpatterned neurons (orange) are
quantitative analyses of the patterns and patterned neurons of the images. Power spectrums show the radial summation of the frequencies for
(C) patterned spot arrays and (F) patterned parallel lines. (A-B) All scale bars are 1 mm in length.

This journal is c The Royal Society of Chemistry 2011 Integr. Biol., 2011, 3, 1167–1178 1173
non-cumulative test that is more suited for exploratory analysis.
As shown in Fig. 5D, the NDF of the patterned array of spots
displays a periodic oscillation between clustered and dispersed,
or regular, that diminishes in amplitude at further length
scales. The data for the patterned neurons shows a similar,
but greatly attenuated oscillation (Fig. 5E). The NDF of
unpatterned neurons does not show oscillations between
clustered and dispersed but resides within the 99% confidence
envelope 4150 mm (Fig. 5F); whereas o150 mm shows a
deviation from CSR similar to that of the patterns and patterned
neurons. The NDF of human colorectal adenocarcinoma cells
suggests little reason to reject the null model of CSR other than a
subtle departure between 50 mm and 100 mm.
Cellular morphometrics
To determine the influence of the printed spot patterns on
neurons at the cellular level, we analysed the circularity values
of the somatodendritic (MAP2) structure for each neuron in
the population for both patterned and unpatterned neuron
samples. Neurons cultured on arrays of patterned spots show
a statistically significant (p o 0.0001, unpaired t-test) increase
in the mean circularity above that of the unpatterned neuron
population (Fig. 6). At the cellular level, there is a statistically
significant (p o 0.0001, unpaired t-test) difference in the mean
dendritic length of patterned neurons (267 mm) compared to
unpatterned neurons (629 mm) (Fig. 7A–B). Axons and dendrites
of neurons recognize the patterned cues on the glass surface.
As shown in Fig. 7C, dendritic processes of neurons (7 DIV)
remain confined to the patterned spots, while axons recognize
the circular patterns of the spots by showing increased axonal
complexity.
Discussion
Inkjet printing for cell culture substrates
Established techniques for producing patterns that direct the
development of cells in culture include microcontact printing,32
microfluidic printing,19 and various other printing and litho-
graphic methods.33
Inkjet printing has advantages that make it an attractive
patterning method. Patterns of chemicals can be rapidly
achieved for patterning predetermined designs without detailed
photolithography or microfabrication processes. Our results
demonstrate that fluorescent inks can be developed for imaging
printed patterns and for generating patterns that guide neuron
development in culture. Different inks can be used on the same
samples for creating increasingly complex patterns (Fig. 2). By
extension, inks might be used for printing patterns on topographical
structures where conventional printing methods (microcontact
and microfluidic deposition) would not be suitable. In addition,
we envision that inks could be formulated with polymerizable
hydrogel solutions for printing and encapsulating chemo-
attractants and/or chemo-repellents for diffusive release. Alter-
natively such functionalized gels could be used as tactile signalling
cues in 2-D and 3-D to control cell growth and migration, and
include printed cues presented here. Through such approaches,
cell-based engineering and neurobiological studies could be
advanced with inkjet printing.
A wide range of studies could benefit from the advantages of
inkjet printing, but the current limitations of jetting fluids
must be overcome and technologies improved to advance the
usefulness of this method.
In our work, we use a commercially available materials
printer, the Fuji-Film Dimatix DMP-2831. The current technology
of this printer has stringent physicochemical requirements for
ink solutions; these specifications should be generally adhered
to for optimal printer functionality and best results. Specifically,
the recommended ink viscosity should be between 10–12 cP
and the ideal surface tension should be about 28–30 mN m�1.34
Table 1 Nearest neighbor analysis of primary hippocampal neurons
Patterned neurons Unpatterned neurons
Points analyzed 5199 3755Average NN Distance 162.3 mm 178.9 mmAverage CSR Distance 135.1 mm 158.9 mmVariance CSR Distance 1.0 mm 1.8 mmClark Evan’s R 1.2 1.1Clark Evan’s c-score 26.3 13.5
Fig. 4 First order spatial statistics. Diggle’s G function is a first-order
test that reveals the cumulative frequency distribution of events’
nearest neighbour distances. (A) This analysis produces a cumulative
frequency of nearest neighbour distances for cellular events with
patterns (black lines with filled circles) and without patterns (grey
lines with open circles). The simulated CSR is based on 99 replicate
simulations and is represented by the thin smooth lines without marks
positioned between the 99% confidence envelopes (dashed lines).
(B) The difference between CSR and the observed data for both patterned
and unpatterned neurons is shown. The following calculation gives the
difference between CSR and the observed G(w), (CSR� G(w) = DG(w)).The greatest deviation from CSR is between 100–110 mm. The inset plot
shows that the strength of departure from the model of CSR is B1.5�stronger for the patterned than the unpatterned neurons.

1174 Integr. Biol., 2011, 3, 1167–1178 This journal is c The Royal Society of Chemistry 2011
However, the physicochemical properties of biological solutions
are near that of water (about 1.0 cP and 72 mN m�1 at 25 1C),
which are far from the specifications for controlled printing
(Fig. 1). Nevertheless, for our results, the viscosity of our ink is
10–12 cP and the surface tension is 33–35 mN m�1, a recipe that
requires less surfactant and produces printed structures that are
adequate for the surface chemistry implemented here.
In terms of user-friendly functionality, the Dimatix DMP-2831
software is easy to operate and intuitive for some operations.
However, manually defining patterns for printing is extremely
cumbersome and time-consuming. Importing images is possible,
but the function is limited in the file types that can be accepted.
Nozzle tuning for optimizing ink ejection is an advanced and
beneficial function that enables precise control of droplet formation;
however, even with inks that meet the physicochemical require-
ments, tuning the jetting of the ink is time consuming and is
recommended for each cartridge.
We observe a noticeably different printing performance and
yield when printing our stock glucose-tween ink (whether
formulated in PBS or DI water) containing FITC-PLL or
R-BSA. For FITC-PLL dissolved in the stock ink at 50 mg mL�1,
a 12% yield was achieved, where with the same ink stock
containing R-BSA at 50 mg mL�1, the yield was 50%. It should
also be noted that the Dimatix DMP-2831 has a range of
different cartridge types that are resistant to a variety of
solvents, and jet either 1 pL or 10 pL drops. We believe that
with substantial advancements in the software usability, nozzle
development, and printer performance, Dimatix printers will
enable greater versatility for printing physiological solutions.
Spatial distribution of neurons with and without patterns
With the ability to print and image a variety of substrate
patterns, we tested the ability of synthetic substrates to guide
neuron development. Studies where neuron patterning directs
neuron growth often make use of biological ECM matrix
compounds (e.g. laminin, collagen),1,19 trophic factors (e.g. nerve
growth factor),35,36 or cellular ligands (i.e. neural cell adhesion
molecules),37 and patterned gene expression38,39 to study the
intrinsic and extrinsic influences regulating neuron differentiation,
growth and maturation. Here, we use synthetic poly-lysine
(PLL) and silane reagents to engineer spatially defined regions
that present neurons with a contrast in cell-to-substrate adhesivity.
While the influence of the pattern on the neuron is manifested in
Fig. 2, the quantitative results of the FFT pattern analysis shows
the global alignment of neuronal populations to the patterns
compared to unpatterned control cultures (Fig. 3).
To obtain a more quantitative representation of the spatial
relationships between the cellular events and the patterns, we use
multiple spatial statistical tests. Using multiple tests yields the
most informative perspective on the spatial distribution by
complementing each other, and minimizing the limited conclusions
afforded by the use of only one method. These tests, combined
with the pattern analysis and cellular morphometrics, provide
a thorough, quantitative, and comprehensive perspective of
dissociated neuron cultures. Furthermore, these measures are
useful means to discover how the spatial distribution of
neurons changes with respect to patterned guidance cues.
The results of first- and second-order spatial statistics
describe the spatial relationship of events within the neuronal
Fig. 5 Second order spatial statistics. (A–C) Ripley’s K-function (expressed as the variance-stabilised L-transformation) is a cumulative second-
order test that reveals aggregation and/or segregation of point patterns. When applied to our neuron data, the transform of the K-function reveals
(A) periodic regularity and dispersion of printed patterns over 3000 mm. (B) Patterned neurons show periodic segregation or dispersion of neurons
locally (o1000 mm), but aggregation or clustering globally. (C) Unpatterned neurons show similar clustering locally but without the periodicity
globally. For comparison, (A–C) are plotted to the same scale. The black line is L(t), which is the linear transformation of the K-function from
Ripley’s K-statistic, and the grey dashed lines are the 99% confidence envelopes produced from 99 simulations of CSR using the same data
intensity (i.e. same number of points per area). (D–F) The Neighbourhood Density Function (NDF) for patterns, patterned neurons and neurons
without patterns, respectively. (G) The NDF for unpatterned human colorectal adenocarcinoma (HT-29) cells.

This journal is c The Royal Society of Chemistry 2011 Integr. Biol., 2011, 3, 1167–1178 1175
population. For first-order NN analysis, the data shows that
both patterned and unpatterned neurons deviate from CSR,
but the patterned neuron population departs further from
CSR (Table 1). The analysis suggests the neuron populations’
pattern departs from a null model of CSR, and that patterned
cues intensify this departure. The null model of CSR is a valid
theoretical model considering that cells in dispersed cell culture
are assumed to be homogeneously dispersed when thoroughly
mixed during preparation and cell plating.
We used Diggle’s G refined NN analysis as a separate
independent measure, which provides a relatively ‘myopic’
cumulative frequency of distances to the neighbouring events
and to simulated CSR. That is, G(w) is only really informative
over length scales proportional to the mean NN distance.
Fig. 4A shows increasing neuron regularity or dispersion at
short distances (o400 mm). Because both patterned and
unpatterned neuron data deviate from CSR, we replot the
differences from CSR DG(w) against the distances (w)
(Fig. 4B), and the deviations of both populations against each
Fig. 6 Cellular morphometrics shows neuron alignment to patterns.
(A) Threshold images representative of patterned spots and (B)
dendritic fields (MAP2) of neurons on a patterned array of spots for
deriving centroid coordinates and cellular circularities. (C) MAP2
immunochemically labelled hippocampal neurons on patterned spots
and representative morphologies of cells with the respective circularities.
(D) There are more circular dendritic fields on patterned substrates
than on unpatterned control samples. Neuron totals are 14 000 to
16 000 per population, there is a significant difference (o0.0001, t-test)
in the mean circularity between patterned (blue diamonds) and
unpatterned populations (red diamonds). Scale bar = 50 mm.
Fig. 7 Patterned neurons show dendritic confinement. (A) Hippo-
campal neurons cultured on patterned microscope slides (blue polar
histogram) show shorter dendritic structures than (B) neurons cultured
on unpatterned spots (green polar histogram). (A–B) Fan diagrams for
each patterned and unpatterned dataset display the length and direction
of all dendritic branches for 450 neurons. Graphs are the same scale.
Rat hippocampal neurons cultured on a spot array demonstrate that
both dendritic and axonal neuritis can be guided by the printed
patterns. Nine spots are shown of over 87 000 spots printed per
microscope slide. Spots (B50 mm dia.) defined with ink-jet printing
and are outlined. Somas and dendrites (MAP2, red) are confined to
spots; axons (tau, green) recognize spot patterns (arrows).

1176 Integr. Biol., 2011, 3, 1167–1178 This journal is c The Royal Society of Chemistry 2011
other (Fig. 4B, inset) to determine the magnitude of the
differences. Both the NN and Diggle’s G analyses are in
agreement that both patterned and unpatterned neurons
deviate from CSR. On average the difference of the patterned
population from CSR is 1.47 times greater than the unpatterned
difference from CSR. In terms of analysis, not all statistical
tests have the same power. Diggle’s G is more suited for
determining data regularity, whereas Ripley’s K is more suited
for determining aggregation or clustering.23,40
To complement the NN analyses, to better understand the
spatial distribution of the patterned neurons, and to further
reveal the dispersion and clustering of cells at multiple scales
(t) we use second-order spatial statistics. Ripley’s L(t) trans-
formation for patterns and neurons (with or without patterns)
suggest dispersion up to radial distances of 500 mm from each
cellular event. Interestingly, the data of patterns without
neurons shows oscillations that traverse the lower 99% confidence
envelope between dispersion and CSR (Fig. 5A). From the NN
tests above, we anticipated that the pattern would influence
neurons cultured on the printed cues. This influence is particularly
evident when comparing the profiles for the L(t) transformation
data of the patterned and unpatterned neurons. The same trend
away from dispersion toward CSR is observed, but the patterned
neurons show a periodicity in L(t) reminiscent of the printed
patterns (Fig. 5B–C).
The NDF for patterns and neurons also shows character-
istic oscillations. Both Ripley’s K and the NDF assume first-
order homogeneity, which exists in cell culture when plated
evenly. The NDF is a non-cumulative test where the distance
classes are annuli, or O-rings, rather than circular areas. Thus
it more directly characterises spatial patterns of events in point
patterns, and is more intuitive to interpret than the cumulative
K-function. These combined statistical results provide evidence
that the printed patterns elicit governing cues that influence
the spatial distribution of neurons on patterns.
For Diggle’s G, Ripley’s K, and the NDF, determining the
appropriate w or t value should take into consideration
the error in the point position of data values, the resolution of
the grid or point-to-point spacing, and it should not be courser
than the average NN distances. For these reasons we analysed
the printed patterns, and neurons with and without patterns
using sample-relevant t values. We assume the point accuracy of
the neurons to be within 30 mm, which is more than twice the
average somal diameter. We also measured the noise or irregularity
of the printed patterns (i.e. the maximum difference or variance
in point-to-point position) to be 40 mm. The spot-to-spot grid
spacing (mean point-to-point spacing) is 150 mm. For these
reasons we analysed the data with the t-values of 30 mm, 40 mmand 150 mm. In summary, results for t = 30 and t = 40 are
essentially the same; the trend also holds true for t = 150 with
a decreased resolution and magnitude of deviation from a null
model of CSR (data not shown).
Three kinds of data suggest that cell fate and neuron
selection can influence neuron segregation and clustering.
First, in the nervous system neurons can be, but are not
always, outnumbered by glia.41 Second, contemporary neuron
culture protocols yield nearly pure neuron populations10 by
selecting against mitotic cells (e.g. glia and migroglia). Thus,
there is an unavoidable cellular selection process inherent in
the culturing primary neurons, a process that could influence
the spatial distribution of neurons in vitro. Lastly, a deviation
from CSR is further supported by the evidence that primary
hippocampal and hypothalamic neurons in culture exhibit a
density-dependent viability10 and development.42
To test the idea that cell selection processes influence spatial
distributions of cells in vitro, we plated cancerous cells that are
not anticipated to undergo culture selection biases that are
present with neurons. HT-29 Human cancerous colorectal
adenocarcinoma cells show a very high, but not perfect conformity
to CSR (Fig. 5G). Compared to neurons, HT-29 would retain
high viability because they are gently released from the culture
flasks and not harvested through mechanical tissue isolation
processes. Furthermore, HT-29 would not undergo a cell
selection process as cells from the brain do during serum-free
neuron cultures. To minimize confounds of cell division and
cell loss, HT-29 were allowed to attach for 4 h then they were
processed for analysis. To what extent these conditions (e.g.
substrates, cell selection, age of culture, etc.) influence the
deviation of neuron populations from CSR is undetermined
and will be a focus of further investigation.
Cellular morphometrics reveal dendritic confinement
In addition to spatial statistics, we also take a more conventional
approach and analyse cellular alignment to the patterns. We
used cellular morphometrics to determine neuronal conformity
to patterned spots. The range of circularities for cellular events
is shown in Fig. 6. The population shift of patterned neurons
toward an increase in circularity is statistically significant
(o0.0001, t-test) (Fig. 6D).
As a second measure of cellular confinement, we performed
neurite tracing of the dendrites of patterned and unpatterned
neurons. Hippocampal neurons cultured on patterned spot
arrays show, on average, 58% shorter dendritic structures
than unpatterned neurons (Fig. 7A–B). Our results suggest
that dendrites of neurons not only align to the pattern, but
also that their lengths are confined by it. Possible explanations
for the confinement of dendrites on patterned surfaces are
given in no order of preference.
One possibility is that fluorinated surfaces resist biochemical
accumulation. This may inhibit the deposition of cell and
media constituents on the glass surface resulting, in a lack of
surface-concentrated growth factors, a condition that could
delay dendritic growth.
Another possibility could be cellular and substrate-dependent
adhesion biases. The fluorinated-silane surface is a factor that
could promote an adhesion-selective process that determines
how neurons develop or what types of neurons are retained in
culture. At present there is limited research identifying what
neurons are eliminated from culture, during the culture process.
Substrates could have a role in biasing the retention of various
neuron types. What is known is that different neuronal
populations in culture can be retained based on the harvested
age of the animal.5 In summary, substrates may influence what
cells are lost, and also, what cells are retained.
There is the real possibility that a combined effect of one or
more of these scenarios influences how neurons are retained
and how they influence the spatial deviation of the population

This journal is c The Royal Society of Chemistry 2011 Integr. Biol., 2011, 3, 1167–1178 1177
from CSR. Axons also demonstrate pattern recognition. In
addition to pattern-dependent dendritic confinement, axons
recognize the patterned spots apart from fluorinated silane
surfaces. Fig. 7C shows labelled axons (tau) and dendrites
(MAP2) of neurons cultured from the hippocampus. The
image shows increased complexities of axonal branching when
axons are in contact with the adhesive PLL spot. A recent
report also shows that axons of magnocellular neurons from
the hypothalamic supraoptic nucleus can present different
axonal branching patterns, presumably due to different substrate
cell types, and that axons in culture can develop bilaterally
symmetric branching patterns when devoid of arborizing cues
and confounding neural networks.42 The observation that
axons increase branching when contacting changes in substrate
boundaries or geometries supports the general observation
that contrast, or substrate novelty, facilitates axonal branching.43,44
Our data suggests that neuronal somata align to highly
adhesive PLL adhesion pads which are contrasted by less
adhesive fluorinated silane regions surrounding PLL pads. In
the broader context, many extrinsic signals can be guidance cues
to influence intrinsic cellular programs. These can be coding or
non-coding cues. Coding cues confer specific signals to specific
receptors or receptor classes, whereas non-coding cues have a
generalized physical or chemical influence on the cell. Extrinsic
cues include adhesive and non-adhesive surfaces, topography,
soft or stiff substrates, and surface-bound or fluid phase chemicals.
In the context of our work, we used non-coding cues that
influence the spatial distribution of the neurons as neurons
align to the inkjet-printed patterns, compared to the conventional
approach of ‘random seeded’ unpatterned neurons in culture.
Conclusions
This large-scale high throughput approach combines inkjet
printing, microarray scanners, pattern analysis, point pattern
statistics and neurobiology to enable studies on the spatial
distribution of neurons in vitro. By studying 4000 to 5000
neurons per spatial point pattern, through multiple tests we
conclude that neuronal populations deviate from CSR locally,
at shorter distances (o200 mm), but global, larger-scale ana-
lyses suggest a conformity to CSR. In reviewing previously
published studies, we conclude that the technique of culturing
neurons introduces a selection process that can cause the
spatial distribution of cells to deviate from CSR. The under-
lying mechanism for a local deviation from CSR is unresolved
and will be a focus of future attention. Dendritic structures are
shorter and are confined by the patterned regions; axons
recognize the different adhesivities of the patterned and
blocked substrates.
Spatial statistical methods are widely used in the ecological
and geological disciplines where the ability to repeatedly test
the spatial distribution of events in point patterns is limited
and temporal resolution is typically restricted to a single
snapshot. We conclude that these same analyses are well suited
for cell culture studies where conditions are easily controlled,
reproducible, relatively quick, and time series data can be
acquired. In addition, cell culture studies provide additional
means to test statistical methods that can make use of data
reporting on both time and space.
Acknowledgements
We thank Brian Dorvel and Piyush Bajaj for insightful
discussions on surface chemistry and FFT analysis, respectively.
Funding was for this study was provided by National Science
Foundation (Science and Technology Center ‘Emergent Behaviours
of Integrated Cellular Systems’ Grant CBET-0939511) and the U.S.
ArmyMedical Research & Material Command (USAMRMC) and
the Telemedicine & Advanced Technology Research Center
(TATRC), under Contract #: W81XWH0810701.
References
1 G. Banker andK.Goslin,Culturing nerve cells, MIT Press, Cambridge,Mass., 1998.
2 L. C. Kapitein, K. W. Yau and C. C. Hoogenraad, Methods CellBiol., 2010, 97, 111–132.
3 S. C. Barber, A. Higginbottom, R. J. Mead, S. Barber andP. J. Shaw, Free Radical Biol. Med., 2009, 46, 1127–1138.
4 G. Melli and A. Hoke, Expert Opin. Drug Discovery, 2009, 4,1035–1045.
5 G. A. Banker and W. M. Cowan, Brain Res., 1977, 126, 397–342.6 J. Chen and K. Herrup, Reviews in the Neurosciences, 2008, 19,317–326.
7 M. M. McCarthy, Exp. Neurol., 2003, 184, 40–43.8 R. R. Romito-DiGiacomo, H. Menegay, S. A. Cicero andK. Herrup, J. Neurosci., 2007, 27, 8496–8504.
9 G. A. Banker and W. M. Cowan, J. Comp. Neurol., 1979, 187,469–493.
10 G. J. Brewer, J. R. Torricelli, E. K. Evege and P. J. Price,J. Neurosci. Res., 1993, 35, 567–576.
11 Y. Chen, B. Stevens, J. Chang, J. Milbrandt, B. A. Barres andJ. W. Hell, J. Neurosci. Methods, 2008, 171, 239–247.
12 S. Roth, S. Zhang, J. Chiu, E. K. Wirth and U. Schweizer, J. TraceElem. Med. Biol., 2010, 24, 130–137.
13 J. van der Valk, D. Brunner, K. De Smet, A. Fex Svenningsen,P. Honegger, L. E. Knudsen, T. Lindl, J. Noraberg, A. Price,M. L. Scarino and G. Gstraunthaler, Toxicol. in Vitro, 2010, 24,1053–1063.
14 L. M. McShane and M. Palmatier, Stat. Med., 1994, 13, 523–540.15 B. Heller, F. Schweingruber, D. Guvenc and A. Heller, J. Neurosci.
Methods, 2001, 106, 91–99.16 L. M. McShane, P. S. Albert and M. A. Palmatier, Biometrics,
1997, 53, 698–706.17 J. Illian, Statistical Analysis and Modelling of Spatial Point Patterns,
John Wiley, Chichester, England, Hoboken, NJ, 2008.18 N. E. Sanjana and S. B. Fuller, J. Neurosci. Methods, 2004, 136,
151–163.19 L. J. Millet, M. E. Stewart, R. G. Nuzzo and M. U. Gillette, Lab
Chip, 2010, 10, 1525–1535.20 L. J. Millet, M. E. Stewart, J. V. Sweedler, R. G. Nuzzo and
M. U. Gillette, Lab Chip, 2007, 7, 987–994.21 C. E. Ayres, B. S. Jha, H. Meredith, J. R. Bowman, G. L. Bowlin,
S. C. Henderson and D. G. Simpson, J. Biomater. Sci., Polym. Ed.,2008, 19, 603–621.
22 W. S. Rasband, ImageJ, U. S. National Institutes of Health,Bethesda, Maryland, USA, http://imagej.nih.gov/ij/, 1997–2011.
23 G. L. W. Perry, B. P. Miller and N. J. Enright, Plant Ecol., 2006,187, 59–82.
24 G. L. W. Perry, Environ. Modell. Software, 2004, 19, 559–569.25 P. J. Clark and F. C. Evans, Ecology, 1954, 35, 445–453.26 B. D. Ripley, J. R. Stat. Soc. B, 1977, 39, 172–212.27 P. M. Dixon, Encyclopedia of Environmetrics, 2002, 3, 1370–1383.28 F. H. C. Marriott, Appl. Stat., 1979, 28, 75–77.29 R. Condit, P. S. Ashton, P. Baker, S. Bunyavejchewin,
S. Gunatilleke, N. Gunatilleke, S. P. Hubbell, R. B. Foster,A. Itoh, J. V. LaFrankie, H. S. Lee, E. Losos, N. Manokaran,R. Sukumar and T. Yamakura, Science, 2000, 288, 1414–1418.
30 F. Goreaud and R. Pelissier, Journal of Vegetation Science, 1999,10, 433–438.
31 P. J. Diggle, Statistical Analysis of Spatial Point Patterns, London,UK, 2003.

1178 Integr. Biol., 2011, 3, 1167–1178 This journal is c The Royal Society of Chemistry 2011
32 A. P. Quist, E. Pavlovic and S. Oscarsson, Anal. Bioanal. Chem.,2005, 381, 591–600.
33 L. Gonzalez-Macia, A. Morrin, M. R. Smyth and A. J. Killard,Analyst, 2010, 135, 845–867.
34 J. Sumerel, J. Lewis, A. Doraiswamy, L. F. Deravi, S. L. Sewell,A. E. Gerdon, D. W. Wright and R. J. Narayan, Biotechnol. J.,2006, 1, 976–987.
35 N. Gomez, Y. Lu, S. Chen and C. E. Schmidt, Biomaterials, 2007,28, 271–284.
36 L. M. Yu, J. H. Wosnick andM. S. Shoichet, J. Neurosci. Methods,2008, 171, 253–263.
37 T. Esch, V. Lemmon and G. Banker, J. Neurosci., 1999, 19,6417–6426.
38 P. M. Heron, B. M. Sutton, G. M. Curinga, G. M. Smith andD. M. Snow, J. Neurosci. Methods, 2007, 159, 203–214.
39 T. Houchin-Ray, A. Huang, E. R. West, M. Zelivyanskaya andL. D. Shea, J. Neurosci. Res., 2009, 87, 844–856.
40 S. Barot, J. Gignoux and J. C. Menaut, Ecology, 1999, 80, 1987–2005.41 C. C. Hilgetag and H. Barbas, Brain Structure and Function, 2009,
213, 365–366.42 L. J. Millet, A. Bora, J. V. Sweedler and M. U. Gillette, ACS
Chem. Neurosci., 2010, 1, 36–48.43 D. W. Burmeister and D. J. Goldberg, J. Neurosci., 1988, 8,
3151–3159.44 G. S. Withers, C. D. James, C. E. Kingman, H. G. Craighead and
G. A. Banker, J. Neurobiol., 2006, 66, 1183–1194.