Embed Size (px)
Citation preview
Ultra.sound m Med & Biol., V o l 6, pp. 99-105 Pergamon Press Ltd.. 1980 Printed m Great Britain
Q U A N T I T A T I V E A S S E S S M E N T O F T H E C O M M O N
F E M O R A L T O P O P L I T E A L A R T E R I A L S E G M E N T
U S I N G C O N T I N U O U S W A V E D O P P L E R U L T R A S O U N D
K. N. HUMPHRIES, T. K. HAMES, S. W. J. SMITH and V. A. CANNON
Wessex Regional Medical Physics Department, Southampton General Hospital, Southampton, England
and
A. D. B. CHANT* Royal South Hants Hospital, Southampton, England
(First received 19 April 1979: and in tinalform 18 September 1979)
Abstract--The common femoral to popliteal segments of 123 patients with radiologically confirmed arterial disease have been compared with those of 43 volunteers apparently free from disease. The comparisons have been based upon parameters derived from Doppler-shifted, continuous wave ultra- sound.
Simultaneous recordings of the Doppler signal were made from over the common femoral artery and the popliteal artery; these were analyzed subsequently to reveal variations of maximum frequency with time. Fifteen parameters were obtained from each segment. Of these the Pulsatility Index (P.I.) the Damping Factor (A), the pulse wave transit time fiT), the rise time ratio (RTR) from each segment were examined in detail• The Doppler results from the patient groups were compared also with the findings from arteriography.
On the basis of these comparisons it was found that the RTR was simpler to measure than other more commonly used parameters such as Pulsatility Index and at least as sensitive for the differentiation between severe arterial disease and the mildly affected or normal state. However, none of these par- ameters was sufficiently sensitive to distinguish between mild to moderate disease and normal.
Key words: Arterial disease. Maximum frequency envelope, Pulsatility index, Damping factor, Pulse wave transit time, Rise time ratio.
INTRODUCTION
Recent developments in the use of continuous wave ultrasound in the assessment of lower limb arterial disease have concentrated on quantitative measurements taken from the Doppler-shifted signals. The work published can be categorized broadly by the type of processing used, that is by the zero-crossing technique (Fronek et al., 1976; Nicolaides et al., 1976) or spectral analysis (Woodcock, 1970; Gosling and King, 1974). The zero-crossing tech- nique provides a voltage output proportional to the mean velocity of blood cells and has the advantage of simplicity of providing on-line information. Spectral analysis, however, is the only method whereby the frequency and ampli- tude changes in the Doppler signal can be dis- played as a function of time. Gosling et al. (1973) have compared the use of these two methods and have argued in favour of spectral
*Consultant Surgeon.
U,M.B 6~2--A 99
analysis. Besides the very strong positive argu- ment that spectral analysis provides all the information available from the Doppler units, the zero-crossing technique has a number of inherent disadvantages. Artefacts and distortion of the output can occur during rapid changes in flow velocity and arterial wall movement and flow from other sources produce unwanted signals thereby giving rise to poor signal to noise ratios (Coghlan and Taylor, 1976, Lunt, 1976).
On the basis of these comments the Doppler signals in this laboratory have been analysed using an off-line spectrum analyser. The sub- sequent analysis of these signals has centred on probe-angle independent parameters because of the uncertainty of the angle subtended at the artery by the ultrasound beam.
The purpose of the study has been to investi- gate the sensitivity of the parameters available from the maximum frequency envelope of the Doppler signal as diagnostic indicators of arterial disease.
100 K.N. HUMPHRIES e t al.
FREQUBEY (KHZ)
Z.
FEMORAL
POPLITEAL
J.O0 MS TIME
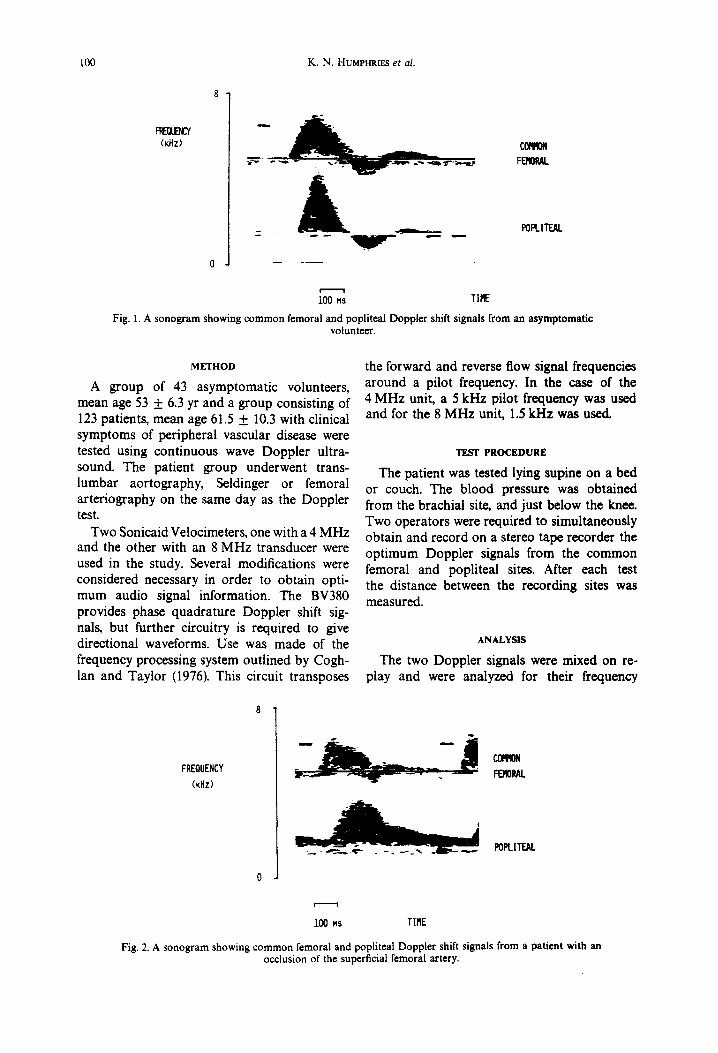
Fig. 1. A sonogram showing common femoral and popliteal Doppler shift signals from an asymptomatic volunteer.
METHOD
A group of 43 asymptomatic volunteers, mean age 53 + 6.3 yr and a group consisting of 123 patients, mean age 61.5 + 10.3 with clinical symptoms of peripheral vascular disease were tested using continuous wave Doppler ultra- sound. The patient group underwent trans- lumbar aortography, Seldinger or femoral arteriography on the same day as the Doppler test.
Two Sonicaid Velocimeters, one with a 4 MHz and the other with an 8 MHz transducer were used in the study. Several modifications were considered necessary in order to obtain opti- mum audio signal information. The BV380 provides phase quadrature Doppler shift sig- nals, but further circuitry is required to give directional waveforms. Use was made of the frequency processing system outlined by Cogh- lan and Taylor (1976). This circuit transposes
the forward and reverse flow signal frequencies around a pilot frequency. In the case of the 4 MHz unit, a 5 kHz pilot frequency was used and for the 8 MHz unit, 1.5 kHz was used.
TEST PROCEDURE
The patient was tested lying supine on a bed or couch. The blood pressure was obtained from the brachial site, and just below the knee. Two operators were required to simultaneously obtain and record on a stereo tape recorder the optimum Doppler signals from the common femoral and popliteal sites. After each test the distance between the recording sites was measured.
ANALYSIS
The two Doppler signals were mixed on re- play and were analyzed for their frequency
FREQUENCY
(KHz)
~ N FERORAL
POPLITEAL
i i
100 MS TIME
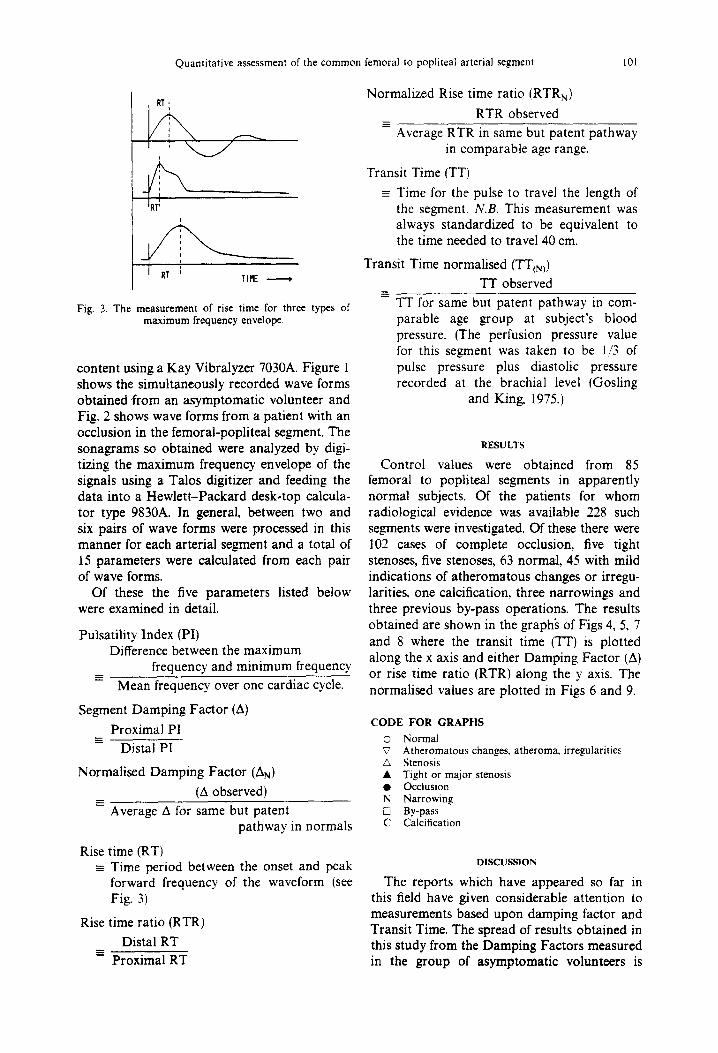
Fig. 2. A sonogram showing common femoral and popliteal Doppler shift signals from a patient with an occlusion of the superficial femoral artery.
Quantitative assessment of the common femoral to popliteal arterial segment 101
i I
TIME )
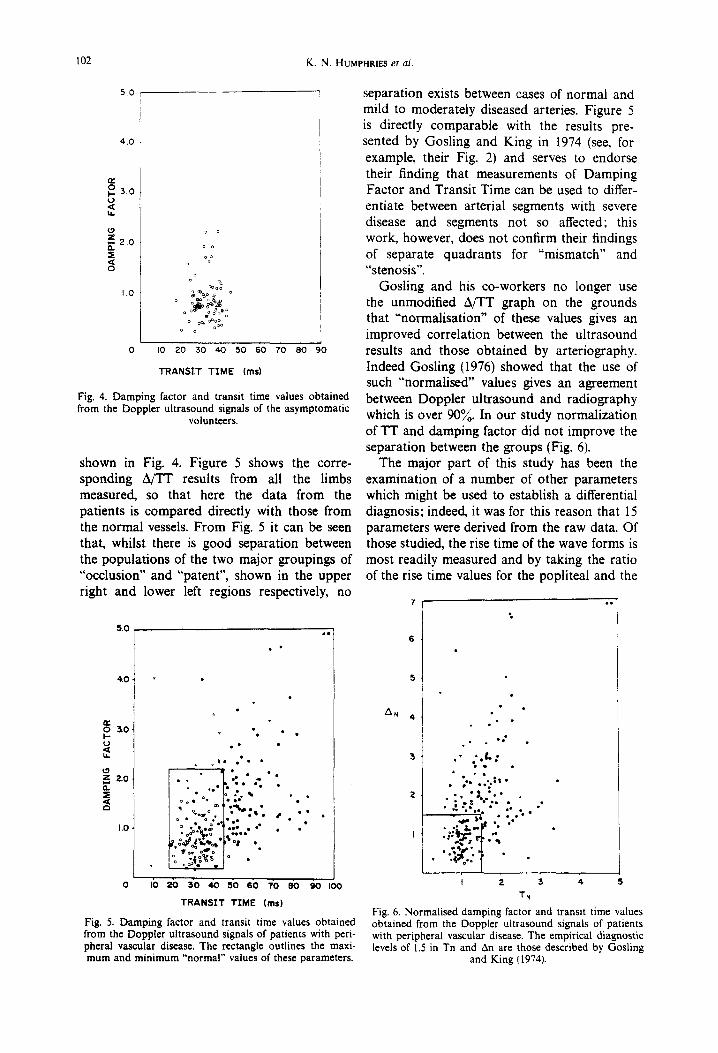
Fig. 3. The measurement of rise time for three types of maximum frequency envelope.
content using a Kay Vibralyzer 7030A. Figure 1 shows the simultaneously recorded wave forms obtained from an asymptomatic volunteer and Fig. 2 shows wave forms from a patient with an occlusion in the femoral-popliteal segment. The sonagrams so obtained were analyzed by digi- tizing the maximum frequency envelope of the signals using a Talos digitizer and feeding the data into a Hewlett-Packard desk.top calcula- tor type 9830A. In general, between two and six pairs of wave forms were processed in this manner for each arterial segment and a total of 15 parameters were calculated from each pair of wave forms.
Of these the five parameters listed below were examined in detail.
Pulsatility Index (PI) Difference between the maximum
frequency and minimum frequency
Mean frequency over one cardiac cycle.
Segment Damping Factor (A)
Proximal PI Distal PI
Normalised Damping Factor (AN)
(A observed)
Average A for same but patent pathway in normals
Rise time (RT) - Time period between the onset and peak
forward frequency of the waveform (see Fig. 3)
Rise time ratio (RTR)
Distal RT Proximal RT
Normalized Rise time ratio (RTRN)
RTR observed
Average RTR in same but patent pathway in comparable age range.
Transit Time (TT)
-- Time for the pulse to travel the length of the segment. N.B. This measurement was always standardized to be equivalent to the time needed to travel 40 cm.
Transit Time normalised (TT(N))
TT observed
TT for same but patent pathway in com- parable age group at subject's blood pressure. (The perfusion pressure value for this segment was taken to be 1/3 of pulse pressure plus diastolic pressure recorded at the brachial level (Gosling
and King 1975.)
RESULTS
Control values were obtained from 85 femoral to popliteal segments in apparently normal subjects. Of the patients for whom radiological evidence was available 228 such segments were investigated. Of these there were 102 cases of complete occlusion, five tight stenoses, five stenoses, 63 normal, 45 with mild indications of atheromatous changes or irregu- larities, one calcification, three narrowings and three previous by-pass operations. The results obtained are shown in the graph~ of Figs 4, 5, 7 and 8 where the transit time (TT) is plotted along the x axis and either Damping Factor (A) or rise time ratio (RTR) along the y axis. The normalised values are plotted in Figs 6 and 9.
CODE FOR GRAPHS
© Normal ~7 Atheromatous changes, atheroma~ irregularities
Stenosis • Tight or major stenosis • Occlusion N Narrowing ~_ By-pass C Calcification
DISCUSSION
The reports which have appeared so far in this field have given considerable attention to measurements based upon damping factor and Transit Time. The spread of results obtained in this study from the Damping Factors measured in the group of asymptomatic volunteers is
102 K.N. HUM~h'RES et al.
5.0
4,0
ee
R 3 . 0 tdl
t,l.
£,0
Z 2.0 IX, =E
E:I
1.0
o o
o o
%o o
o
O o;. oO o o o~ oOOOo
0 no 20 30 40 50 60 70 SO 90
TRANSIT TIME (ms)
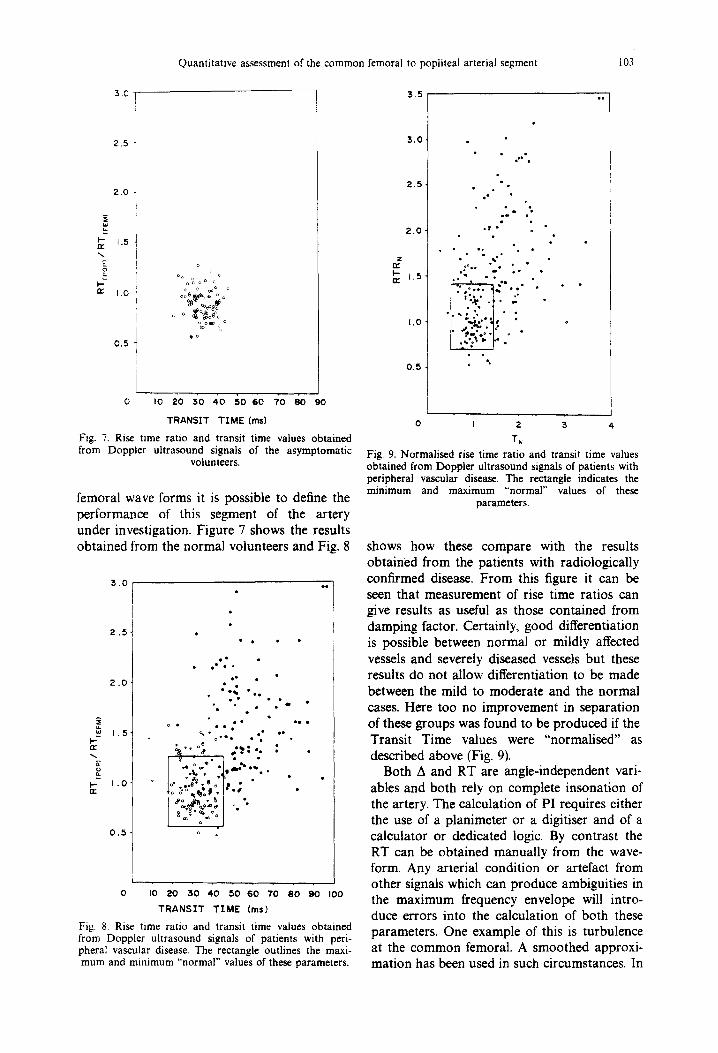
Fig. 4. Damping factor and transit time values obtained from the Doppler ultrasound signals of the asymptomatic
volunteers.
shown in Fig. 4. Figure 5 shows the corre- sponding A/TT results from all the limbs measured, so that here the data from the patients is compared directly with those from the normal vessels. From Fig. 5 it can be seen that, whilst there is good separation between the populations of the two major groupings of "occlusion" and "patent", shown in the upper right and lower left regions respectively, no
5.0
,~0 ¸
a e
o 3,O' k- L.)
m
O
O
0 t • • •
2..0- . , .~
• ,e • • -~oI% • •
ooQ o •
o • o •• •
1 .0 . o ~- • ~ •~ b •~.~ • " • • *~ 'a , • o . e • •
. _ ~ t : ~ . o . i
0 I 0 2 0 3 0 4 0 5 0 6 0 7 0 ( I 0 9 0 I00
TRANSIT TIME (ms)
Fig. 5. Damping factor and transit time values obtained from the Doppler ultrasound signals of patients with peri- pheral vascular disease. The rectangle outlines the maxi- mum and minimum "normal" values of these parameters.
separation exists between cases of normal and mild to moderately diseased arteries. Figure 5 is directly comparable with the results pre- sented by Gosling and King in 1974 (see, for example, their Fig. 2) and serves to endorse their finding that measurements of Damping Factor and Transit Time can be used to differ- entiate between arterial segments with severe disease and segments not so affected; this work, however, does not confirm their findings of separate quadrants for "mismatch" and "stenosis".
Gosling and his co-workers no longer use the unmodified A/TT graph on the grounds that "'normalisation" of these values gives an improved correlation between the ultrasound results and those obtained by arteriography. Indeed Gosling (1976) showed that the use of such "normalised" values gives an agreement between Doppler ultrasound and radiography which is over 90~o. In our study normalization of TT and damping factor did not improve the separation between the groups (Fig. 6).
The major part of this study has been the examination of a number of other parameters which might be used to establish a differential diagnosis; indeed, it was for this reason that 15 parameters were derived from the raw data. Of those studied, the rise time of the wave forms is most readily measured and by taking the ratio of the rise time values for the popliteal and the
5
AN 4
. - • ,&,,
• ~, , .~ . . t ,
. i . . ; k . . ' . • ..
. o i • 1 6 - . "
w
!
TN
Fig. 6. Normalised damping factor and transit time values obtained from the Doppler ultrasound signals of patients with peripheral vascular disease. The empirical diagnostic levels of 1.5 in Tn and An are those described by Gosling
and King (1974).
Quantitative assessment of the common femoral to popliteal arterial segment 103
3 . C
2 . 5
2 . 0
ua
I - 1.5 n,."
o
1 .0
0 . 5
o
o o o ~ o o ~ c
o~ ~ o pc
o o ~ o
~o
o I o z• 3o 40 r,o 6o "/o 8o 9o
T R A N S I T T I M E ( m s )
Fig. 7. Rise time ratio and transit time values obtained from Doppler ultrasound signals of the asymptomatic
volunteers.
femoral wave forms it is possible to define the performance of this segment of the artery under investigation. Figure 7 shows the results obtained from the normal volunteers and Fig. 8
3 . 0
2 . 5
2 . 0
w 1 . 5 I..-
1 . 0 n"
0 . 5
• ° , o ~ .,
Q • ° •
" e , , o
• • e e
• dbe % e~,• °
) . ; " . o ;
0 I0 20 30 40 50 60 7'0 80 90 I00
TRANSIT TIME (ms)
Fig, 8, Rise time ratio and transit time values obtained from Doppler ultrasound signals of patients with peri- pheral vascular disease. The rectangle outlines the maxi- mum and minimum "normal" values of these parameters.
3 . 5
3 . 0 .
2 . 5 .
2 . 0
1.5
I .O
0 . 5
o , l ' o
• o
.- . • tr t •
°~° , °
, ° ° • •
.~,.. ":i'. ! "':"
I ,."o" 1". %
0 I 2 3 4,
T~ Fig. 9. Normalised rise time ratio and transit time values obtained from Doppler ultrasound signals of patients with peripheral vascular disease, The rectangle indicates the minimum and maximum "normal" values of these
parameters.
shows how these compare with the results obtained from the patients with radiologically confirmed disease. From this figure it can be seen that measurement of rise time ratios can give results as useful as those contained from damping factor. Certainly, good differentiation is possible between normal or mildly affected vessels and severely diseased vessels but these results do not al low differentiation to be made between the mild to moderate and the normal cases. Here too no improvement in separation of these groups was found to be produced if the Transit Time values were "normalised" as described above (Fig. 9).
Both A and RT are angle-independent vari- ables and both rely on complete ins•nat ion of the artery. The calculation of PI requires either the use of a planimeter or a digitiser and of a calculator or dedicated logic. By contrast the RT can be obtained manually from the wave- form. Any arterial condition or artefact from other signals which can produce ambiguities in the maximum frequency envelope will intro- duce errors into the calculation of both these parameters. One example of this is turbulence at the c o m m o n femoral. A smoothed approxi- mation has been used in such circumstances. In
104 K.N. HUMPHRIES et al.
COMMON FEMORAL
POPLIT~L
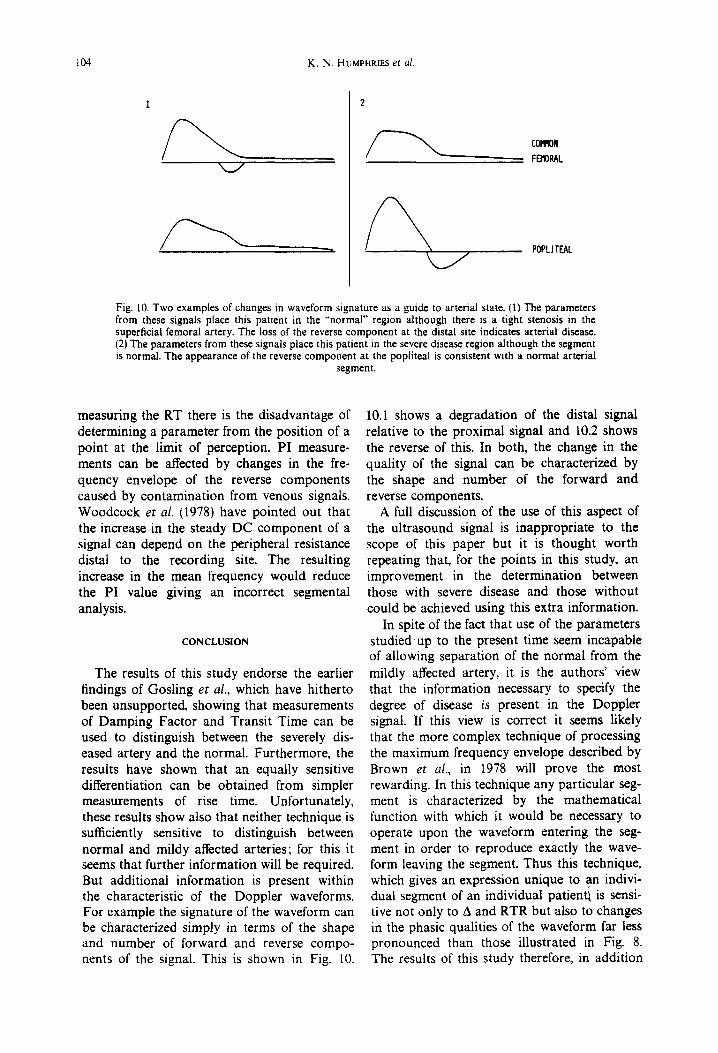
Fig. 10. Two examples of changes in waveform signature as a guide to arterial state. (I) The parameters from these signals place this patient in the ~'normal" region although there is a tight stenosis in the superficial femoral artery. The loss of the reverse component at the distal site indicates arterial disease. (2) The parameters from these signals place this patient in the severe disease region although the segment is normal. The appearance of the reverse component at the popliteal is consistent with a normal arterial
segment.
measuring the RT there is the disadvantage of determining a parameter from the position of a point at the limit of perception. PI measure- ments can be affected by changes in the fre- quency envelope of the reverse components caused by contamination from venous signals. Woodcock et al. (1978) have pointed out that the increase in the steady DC component of a signal can depend on the peripheral resistance distal to the recording site. The resulting increase in the mean frequency would reduce the PI value giving an incorrect segmental analysis.
CONCLUSION
The results of this study endorse the earlier findings of Gosling et al., which have hitherto been unsupported, showing that measurements of Damping Factor and Transit Time can be used to distinguish between the severely dis- eased artery and the normal. Furthermore, the results have shown that an equally sensitive differentiation can be obtained from simpler measurements of rise time. Unfortunately, these results show also that neither technique is sufficiently sensitive to distinguish between normal and mildy affected arteries; for this it seems that further information will be required. But additional information is present within the characteristic of the Doppler waveforms. For example the signature of the waveform can be characterized simply in terms of the shape and number of forward and reverse compo- nents of the signal. This is shown in Fig. 10.
10.1 shows a degradation of the distal signal relative to the proximal signal and 10.2 shows the reverse of this. In both, the change in the quality of the signal can be characterized by the shape and number of the forward and reverse components.
A full discussion of the use of this aspect of the ultrasound signal is inappropriate to the scope of this paper but it is thought worth repeating that, for the points in this study, an improvement in the determination between those with severe disease and those without could be achieved using this extra information.
In spite of the fact that use of the parameters studied up to the present time seem incapable of allowing separation of the normal from the mildly affected artery, it is the authors' view that the information necessary to specify the degree of disease is present in the Doppler signal. If this view is correct it seems likely that the more complex technique of processing the maximum frequency envelope described by Brown et al., in 1978 will prove the most rewarding. In this technique any particular seg- ment is characterized by the mathematical function with which it would be necessary to operate upon the waveform entering the seg- ment in order to reproduce exactly the wave- form leaving the segment. Thus this technique, which gives an expression unique to an indivi- dual segment of an individual patient~ is sensi- tive not only to A and RTR but also to changes in the phasic qualities of the waveform far less pronounced than those illustrated in Fig. 8. The results of this study therefore, in addition
Quantitative assessment of the common femoral to popliteal arterial segment 105
to any intrinsic value they may have, serve to enhance the optimism with which the tech- niques of Brown et al., must be regarded even though this technique has yet to be evaluated thoroughly.
REFERENCES
Brown, J. M., Naharski, Z. T., Woodcock, J. P. and Morris S. J. (1978) Transfer-function modelling of arteries. Med. Biol. En 9. Comput. 16, 161-164.
Coghlan, B. A. and Taylor, M. G. (1976) Directional Doppler techniques for detection of blood velocities. Ultrasound Med. Biol. 2, 181-188.
Coghlan, B. A., Taylor, M. G. and King, D. H. (1974) On-line display of Doppler-shifted spectra by a real-time compression analyser. Cardiovascular Applications of Ultrasound (Edited by Reneman, R. S.), pp. 55-56. North,Holland, Amsterdam.
Fronek, A., Coel, M. and Bernstein, E. F. (1976) Quantita- tive ultrasonographic studies of lower extremity flow velocities in health and disease. Circulation. 53, 957-960.
Gosling, R. G. ( ) Extraction of physiological informa- tion from spectrum-analysed Doppler-shifted continu- ous-wave ultrasound signals obtained non-invasively from the arterial system; Monograph 21 in I.E.E. Medi-
cal Electronics Monographs. Vot. 4. Peter Peregrinus, Stevenage, U.K.
Gosling, R. G. and King, D. M. (1974) Arterial assessment using Doppler-shift ultrasound. Proc. Roy. Soc. Med. 67, 447-449.
Gosling, R. G. and King, D. M. (1973) Continuous wave ultrasound as an alternative and complement to X-rays in vascular examinations. In Cardiovascular Applications of Ultrasound. (Edited by Reneman, R. S.), Chap. 22. pp. 266-282.
Gosling, R. G., King, D. M., Newman, D. L. and Wood- cock, J. P. (1972) Transcutaneous measurement of arter- ial blood-velocity by ultrasound. In Ultrasonics for Industry, Conference Papers pp. 16-23 (1969). lliffe, London.
Nicolaides, A. N., Gordon-Smith, I. C., Dayandas, J. and Eastcott, M. M. G. (1976) The value of Doppler blood velocity tracings in the detection of aortoiliac disease in patients with intermittent claudication. Surgery. 80, 774--778.
Woodcock, J. P. (1970) The significance of changes in the velocity/time waveform in occlusive arterial disease of the leg. Proc. Conf. Ultrasonics Biol. Med. UBIOMED, pp. 5-10. Jallanna-Warsaw.
Woodcock, J. P. and Skidmore, R. (1978) Physiological interpretation of Doppler shift waveforms from the caro- tid and peripheral circulation. In Doppler Ultrasound in the Study of the Central and Peripheral Circulation (Edited by Woodcock, . I .P . and Sequeira, R. F.), Chap. 9.