Embed Size (px)
Citation preview
1
Original Scientific Articles
Title of this article
Quantitative Assessment of Superficial Venous Insufficiency Using Duplex Ultrasound and Air Plethysmography
Brief title
Quantitative Assessment of Superficial Venous Insufficiency
The authors
Takashi Yamaki M.D. Motohiro Nozaki M.D. Kenji Sasaki M.D.
Correspondence to :
Takashi Yamaki M.D.
Department of Plastic and Reconstructive Surgery
Tokyo Women’s Medical University
8-1, Kawada-cho, Shinjuku-ku, Tokyo
162-8666, JAPAN
TEL : 81-3-3353-8111
FAX: 81-3-3225-0940
E-mail : [email protected]
Presented at the Eleventh Annual Meeting the American Venous Forum, Dana Point,
CA. Feb. 18-21, 1999 No competing interests declared.

2
ABSTRACT
Objective : The purpose of this study was to quantitatively evaluate
venous reflux in limbs with isolated superficial venous insufficiency
using color duplex ultrasound. In addition, air plethysmography (APG)
was used to investigate possible correlations of duplex-derived peak
velocity, duration of reflux, and CEAP classification.
Methods : One hundred and forty-six legs in 109 patients with
isolated superficial venous insufficiency refluxing throughout the length
of the limb were selected for prospective study by duplex scan.
Reflux was defined as duration of reflux > 0.5 seconds. This study
was conducted in a university hospital. Venous reflux was evaluated
with the patients standing, by the duration of reflux, retrograde peak
velocity, reflux volume at the saphenofemoral and saphenopopliteal
junction as well as the greater saphenous vein in the thigh. Values
obtained by APG were the venous volume (VV), venous filling index
(VFI), ejection fraction (EF), and residual venous fraction (RVF). A
significant difference was defined as p < 0.05.
Three groups of limbs were analized. Group A limbs with a
retrograde peak velocity > 30 cm/s and a duration of reflux < 3
second ; Group B with a retrograde peak velocity > 30 cm/s and a
duration of > 3 s, and Group C with a retrograde peak velocity < 30 cm/s
and a duration of reflux > 3 s.
Results : Group A and B contained 103 limbs and 24 of these
were in CEAP C5 and C6. Group C contained 43 limbs, none of
which were in Class 5 and 6. APG demonstrated significant reflux
in group A, and VFI were significantly higher compared to group B
and group C (p = .0007, p = .0064, respectively). A significant correlation
was demonstrated between peak retrograde reflux velocity and VFI.
Conclusions : Severe chronic venous insufficiency is found in limbs
with high reflux velocity (> 30 cm/s) and the duration of reflux does
not correlate with severe chronic insufficiency.
Key words : chronic venous insufficiency, duplex scans, air
plethysmography

3
INTRODUCTION
Chronic venous insufficiency (CVI), including chronic edema,
hyperpigmentation, and frank ulceration is caused by primary valvular
incompetence and postthrombotic venous damage. Recently, duration of
reflux > 0.5 seconds has been widely used to define presence of
valvular reflux. Such reflux can be detected easily. As several
investigators have reported that the duration of reflux correlates with
the severity of venous reflux.1,2 we have chosen to study this
phenomenon.
The role of superficial insufficiency in the production of venous
ulceration has been described by many.3,4,5,6 Labropoulos7 reported that
ulceration occurred when the entire greater saphenous vein (GSV) was
involved although his study paid little attention to duration of reflux.
Neither was retrograde peak velocity analyzed in relation to the
severity of venous reflux. Labropoulos stated that the incidence of
venous ulceration due to isolated superficial venous insufficiency was
23%.7 Our study shows an incidence of 38.7%.8
The present study was undertaken to quantitatively correlate venous
reflux with isolated superficial veins using color duplex ultrasound and
air plethysmography. The principle objective was to investigate possible
correlation of the duplex-derived peak velocity and duration of reflux
with the CEAP classification (clinical, etiologic, anatomic and
pathophysiologic) of each limb.9
METHODS
From May, 1994 to December, 1998, 613 limbs in 492 patients
with primary varicose veins were subjected to duplex examination of
the venous system in the Department of Plastic and Reconstructive
Surgery at Tokyo Women’s Medical University. The examination
included greater saphenous, lesser saphenous, common femoral, superficial
femoral, popliteal, gastrocnemius, mid-thigh and calf perforating veins.
The saphenosfemoral and saphenopopliteal junctions were assessed with
the patients standing with distal manual compression followed by
sudden release.7 The remainder of venous system was examined with
the patients sitting. Superficial venous incompetence was detected when
the duration of reflux was greater > 0.5 seconds.10 Deep vein and

4
perforating vein reflux were also determined if the duration of relux
exceeded 0.5 seconds. Perforating vein incompetence was examined with
the patients in the sitting position facing the examiner.7,8 According
to this examination criteria, 146 limbs in 109 patients with isolated
superficial venous insufficiency were selected for present study. These
had venous reflux along the entire segment of either GSV (from
groin to ankle) or LSV (from popliteal fossa to ankle). The clinical
manifestations of these limbs were classified according to the CEAP
method of reporting in venous disease.9 All of the patients could be
classified into varicose veins (class 2), edema (class 3), skin changes
(class 4), or chronic ulceration (class 5 or class 6). The mean age of
the patients was 52.9±11.5 years. Reflux in the GSV was found in
111 limbs (LSV in 27, and both the GSV and LSV in 8). A
total of 36 limbs were classified as class 2, 18 as class 3, 68 as
class 4, 16 as class 5, and 8 as class 6. Patients with arterial
insufficiency were identified based on an ankle-brachial pressure index <
0.8 and were excluded from the study.
According to the duration of reflux along with the retrograde
peak velocity, limbs were categorized into three groups : those with a
retrograde peak velocity > 30 cm/sec and a duration of reflux < 3 seconds
(Group A), peak velocity > 30 cm/sec and duration of reflux > 3seconds
(Group B), and retrograde peak velocity < 30 cm/sec and a duration of
reflux > 3 seconds (Group C).
In Group A, there were 26 men and 43 women ranging in age
from 33 to 73 (mean 56 years). In Group B, there were 8 men
and 26 women with ages ranging from 24 to 74 years (mean 53
years). In Group C, there were 9 men and 34 women with ages
ranging from 24 to 86 years (mean 53 years).
Color duplex scan : A color duplex scanner (LOGIQ 500MD :, GE
Medical Sytems, Milwaukee, Wisconsin, USA) with a 5 to 10 MHz
transducer was used for this study. The duration of reflux and
retrograde peak velocity were measured at the saphenofemoral junction
(SFJ), in the GSV in the thigh, and in the lesser saphenous vein
(LSV) at the saphenopopliteal junction (SPJ).8 Reflux flow calculated
using the equation :

5
Reflux Flow (ml/sec) = Peak Velocity x Area (r2).
The vessel cross-sectional area was calculated from the diameter,
assuming a circular shape.
APG : APG measurements were performed as described by
Nicolaides11 using APG Model 1000 (ACI Medical Inc., Sun Valley,
California, USA) following color duplex scanning. The data obtained
by APG were the venous volume on standing (VV), the venous
filling index (VFI), the ejection fraction (EF) and the residual venous
fraction (RVF). VFI is the average rate of increase in the VV.
Calf muscle pump function is indicated by EF which is a measure
of the percentage of the ejection volume after one tiptoe maneuver.
RVF is a measure of the percentage of the VV remaining in the
calf after 10 tiptoe maneuvers which is thought to reflect the
ambulatory venous pressure.12 A total of 12 normal volunteers
underwent APG-testing for comparison.
Statistics. Statistical analysis was performed using Wilcoxon’s
non-parametric rank sum test. Values are expressed as the mean±the
standard deviation. A significant difference was recorded when the p
value was < 0.05. Correlations between duplex and APG-derived
parameters are analyzed using Pearson’s correlation coefficient method.
Complete correlations are considered when correlation coefficient was
1.00 or -1.00.
RESULTS
According to this examination criteria, superficial combined with
deep vein incompetence was detected in 75 limbs, and superficial
combined with perforating vein incompetence was found in 75 limbs.
Concomitant superficial, deep and perforating vein incompetence was
detected in 51 limbs. Deep combined with perforating vein
incompetence was detected in 9 limbs. Isolated deep and perforating
vein incompetence were detected in 19 and 15 limbs respectively.
Isolated superficial venous reflux was detected in 369 limbs in 303
patients. This accounts for 60.2 % of all limbs examined. A total of
146 limbs were examined by both color duplex ultrasound and APG.

6
The correlation between the duration of reflux and the retrograde
peak velocity measured at the SFJ and SPJ with the clinical
symptoms are shown in Figure 1.
In Group A, 17 limbs were class 5 and 6, 37 were class 4,
and 15 were class 2 and 3. Overall, 54 of 69 limbs were in
class 4, 5 and 6 (78.2%).
In Group B, 7 limbs were class 5 and 6, 20 were class 4,
and 7 were class 2 and 3. Overall, 27 of 34 were in class 4,
5, and 6 (79.4%).
In Group C, no limbs were in class 5 and 6, 11 were in
class 4, and 32 were in class 2 and 3. Overall, only 11 of 43
limbs were in class 4, 5, and 6 (25.6%) (Table I A, B).
The incidence of venous ulceration in Group A and Group B was
23.4% and 20.6% respectively. None of the limbs in Group C
showed chronic ulceration.
There were significant differences between the retrograde peak
velocity and the reflux volume between the three groups (Table II).
There was a significant difference in the duration of reflux between
Group A and Group B and Group C. However, the GSV diameter in
Group A did not differ from those in Group B.
The APG data are presented in Table III. There was no
significant difference between the EF values of the three groups, but,
significant difference was found in VFI between the groups. The
RVF values were significantly higher in Group A than in Group B.
The only value which is statistically significant difference between
Group B and Croup C was VFI.
VFI and RVF values in normal volunteers were significantly
lower than Group C, however, there was no significant difference in
EF values between the normal volunteers and the patients with
venous insufficiency.
The correlation between duplex-derived and APG-derived parameters
are presented in Table IV. No significant correlations were found
between the duration of reflux and any of the APG-derived
parameters measured at the SFJ and GSV (Table V). On the other
hand, there was a significant correlation between the peak velocity at
the SFJ and GSV, and the APG-derived value for VFI. Similarly,

7
there was a significant correlation between the peak velocity and VFI
at the SPJ.
DISCUSSION
There are several noninvasive methods for assessing venous reflux.
Recently, color duplex ultrasound and APG have replaced both
ascending and descending phlebography, and venous pressure
measurements in the evaluation of reflux. Duplex scan allows direct
visualization of the anatomical location and extent of the venous
incompetence as does phlebography. But duplex-derived retrograde peak
velocity cannot be determined by phlebography or venous pressure
measurement.
Venous reflux can be elicited manually or by pneumatic
tourniquet release in order to measure the retrograde peak velocity.
Szendro examined standing subject by manual compression of the calf
muscles followed by sudden release and found that 95% of healthy
limbs had the duration of reflux in the deep veins less than 0.5
s.13 Sarin, using manual calf compression in the standing position,
showed that the duration of reflux of limbs with significant venous
reflux exceeded 0.5 s in both the deep and superficial veins.14 van
Bemmelen studied duration of deep venous reflux in 32 limbs and
found that the duration of reflux in 95% of the limbs was < 0.5
seconds. 15 Araki found that there was no difference between
pneumatic tourniquet release and manual compression and release16 so
we used manual compression because it is more comfortable for the
patients.
APG, a noninvasive diagnostic tool, has proved to be an attractive
tool for evaluating venous function. Christopoulos reported that an
increase in the VFI correlates with the clinical severelity of venous
disease. 17 Normal lims have a VFI < 2 ml/sec, and VFIs > 5 ml/sec are
considered abnormal.11 A VFI > 7 ml/sec is associated with a high
incidence of severe chronic venous insufficiency,11 and the VFI is
considered to be a good predictor of venous reflux.18 Although, there
was a significant difference in VFI between limbs with group C and
those with normal volunteers, the limbs with group C is considered
by no means abnormal in this regard. The EF and RVF reflect

8
calf muscle-pump function, and RVF is thought to provides a useful
assessment of the ambulatory venous pressure.19 EFs less than 40%,
and RVFs greater than 40% are considered to be abnormal.9
The role of superficial venous insufficiency in the development of
venous ulceration has been demonstrated by several authors. Shami3
obtained favorable results with performing saphenous vein stripping for
patients with ulcer. Labropoulos20 reported 84% of his patients with
leg ulceration had superficial reflux. He also noted that venous
ulceration is highly associated with reflux throughout of the length of
the GSV or with extensive reflux in both the GSV and LSV.7 In
this study we have found that if duplex-derived duration of reflux
and the peak velocity are taken into account, ulceration is associated
with incompetence along the entire GSV as well as high retrograde
peak velocity.
The present study suggests that a burst of reflux, like a water
hammer with superficial venous reflux peak velocity > 30 cm/sec
combined with duration of reflux < 3 seconds (Group A) is highly
associated with severe CVI.
Several investigators have tested the relationship between
APG-derived parameters and clinical severity. Nicolaides’ laboratory
reported a good correlation of VFI with the incidence of ulceration,17
and Nicolaides showed that the combination of VFI and EF had
prognostic significance for the development of ulceration.11 On the
other hand, van Bemmmelen reported that APG parameters do not
effectively distinguish limbs with chronic venous insufficiency from
limbs with uncomplicated varicose veins.21 He described that as a
group, VFIs of legs with ulcers and dermatitis were significantly
higher compared to those with varicose veins, but he found a great
deal of individual overlap. He also showed that combination of VFI
and EF do not improve the discrimination.
Correlation of APG-derived parameters with duplex-derived parameters
are also demonstrated by several investigators. Weingarten showed that
the VFI is the only APG measurement that correlates with the
duration of reflux and that the RVF is the only measurement which
significantly correlates the mean total-limb reflux time.1 Welch et al.
reported that the duration of reflux of the superficial femoral vein

9
and popliteal vein increased as the clinical symptoms progress, but
found no correlation between the duration of reflux at the SFJ, in
the GSV and the clinical severity.2 Rodriguez also tested venous
reflux at SFJ, GSV and LSV, and showed that duration of reflux
in individual veins did not reflect the magnitude of the reflux volume,
and that even total duration of reflux did not correlate with the
APG-derived VFI.22
In the current study, we found that increased duration of reflux
does not correlate with APG-derived VFI. However, there is a
significant correlation between VFI and peak velocity at the SFJ and
SPJ, and a moderate correlation at GSV reflux. However, EFs and
RVFs have only poor correlations with duplex-derived parameters.
Retrograde flow calculated by duplex scanning is another parameter
of venous reflux. Bergan demonstrated a lack of correlation between
the total quantity of reflux and clinical manifestation.23 In contrast,
Vasdekis stated that the flow at peak reflux > 10 ml/sec is highly
associated with skin changes.24 He also found that reflux volume in
limbs with only superficial venous insufficiency with skin changes is
significantly greater than those with no skin changes. van Bemmelen
suggests the reason for this discrepancy between duplex scanning and
APG is that they do not measure the same reflux because of the
effect of arterial inflow on plethysmographic measurement.
In this study, the duration of reflux in individual veins showed
only weak correlations with the APG-derived parameters and clinical
severity in patients with isolated superficial incompetence. If we
consider the the duration of reflux alone in the evaluation of venous
reflux, such superficial incompetence alone did not correlate with ulcer
formation. However, we found a significant correlation between the
retrograde peak velocity and the duration of reflux measured at the
SFJ and the SPJ. EF and RVF weakly correlate with overall reflux.
These findings suggest that the retrograde peak reflux velocity > 30 cm/s
and the duration of reflux < 3 s is a better indicator of severe
chronic insufficiency. A large volume can reflux at high peak
velocity in short amount of time, and a low volume can reflux at
a slow velocity in a longer period of time. The criteria for venous
incompetence using duplex-derived retrograde peak velocity along with

10
furation of reflux could have strong impacts on clinical evaluation of
CVI.
In conclusion, proposed criteria based on the duplex-derived
parameters is immediately useful in the quantitative evaluation of
superficial venous insufficiency. Only APG-derived VFI correlates with
venous reflux, and EF and RVF do not have important role in the
discrimination of the clinical severity. It could be that stripping of
GSV would be an appropriate operation in patients with Group A and
Group B because a large amount of reflux causes the severe chronic
symptoms. However, less radical methods, including high flush ligation
at the SFJ (including ligation of groin tributary veins) combined with
sclerotherapy and duplex-guided sclerotherapy for GSV incompetence
could be indicated in patients with group C.
Ackowledgments
We thank Dr. John J Bergan, Department of Surgery, University
of California, San Diego, for valuable comments.

11
REFERENCES
1. Weingarten MS, Czeredarczuk M, Scovell S, et al. A correlation
of air plethysmography and color- flow - assissted duplex scanning in
the quantification of chronic venous insufficiency. J Vasc Surg
1996 ; 24 : 750-4
2. Welch HJ, Young CM, Semegran AB, et al. Duplex assessment
of venous reflux and chronic venous insufficiency : the significance
of deep vein reflux. J Vasc Surg 1996 ; 24 : 755-62
3. Shami SK, Sarin S, Cheatle TR, et al. Venous ulcers and the
superficial venous system. J Vasc Surg 1993 ; 17 : 487-90
4. Christopoulous D, Nicolaides AN, Szendro G. Venous reflux :
quantitation and correlation with clinical severelity of venous
disease. Br J Surg 1988 ; 75 : 352-6
5. Christopoulous D, Nicolaides AN, Galloway JMD, et al.
Objective noninvasive evaluation of venous surgical results. J Vasc
Surg 1988 ; 8 : 683-7
6. Bello M, Scriven M, Hartshorne T, et al. Role of superficial
venous surgery in the treatment of venous ulceration. Br J Surg
1999 ; 86 : 755-9
7. Labropoulos N, Leon M, Nicolaides AN, et al. Superficial venous
insufficiency : correlation of anatomic extent of reflux with clinical
symptoms and signs. J Vasc Surg 1994 ; 20 : 953-8
8. Yamaki T, Nozaki M, Sasaki K. Color duplex ultrasound in the
assessment of primary venous leg ulceration. Dermatol Surg 1998 ;
24 : 1124-1128.
9. Porter JM, Moneta GL. International consensus commitee on
chronic venous disease. Reporting standard in venous disease : an
update. J Vasc Surg 1995 ; 21 : 635-45.
10. Nicolaides AN, Sumner DS. Investigation of patients with deep
venous thrombosis and chronic venous insufficiency. London : Med-
Orion Publishing Co., 1991 : 1-73
11. Nicolaides AN, Christopoulos D. Quantification of venous reflux
and outflow obstruction with air plethysmography. In : Bernstain EF,
editor. Vascular diagnosis. St. Louis : Mosby, 1993 : 915-21.
12. Nicolaides AN, Hussein MK, Szendro G, et al. The relation of

12
venous ulceration with ambulatory venous pressure measurements. J
Vasc Surg 1993 ; 17 : 414-9
13. Szendro G, Nicolaides AN, Zukowski AJ, et al. Duplex scanning
in the assessment of deep venous incompetence. J Vasc Surg
1986 ; 4 :237-42
14. Sarin S, Sommerville K, Farrah J, et al. Duplex ultrasonography
for assessment of venous valvular function of the lower limb. Br
J Surg 1994 ; 81 : 1591-5
15. van Bemmelen PS, Bedford G, Beach K, et al. Quantitative
segmental evaluation of venous valvular reflux with duplax
ultrasound scanning. J Vasc Surg 1989 ; 10 : 425-31
16. Araki CT, Back TL, Padberg FT Jr, et al. Refinements in the
ultrasonic detection of popliteal vein reflux. J Vasc Surg 1993 ;
18 : 742-8
17. Christopoulos D, Nicolaides AN, Szendro G. Venous reflux :
quantification and correlation with the clinical severelity of chronic
venous disease. Br J Surg 1988 ; 75 : 352-6
18. Criado E, Farber MA, Marson WA, et al. The role of air
plethysmography in the diagnosis of chronic venous insufficiency. J
Vasc Surg 1998 ; 27 : 660-70
19. Comerota AJ, Harada RN, Eze AR, et al. Air plethysmography :
a clinical review. Int Angiol 1995 ; 14 : 45-52
20. Labropoulos N, Leon M, Geroulakos G, et al. Venous
hemodynamic abnormalities in patients with leg ulceration. Am J
Surg 1995 ; 169 : 572-4
21. van Bemmelen PS, Mattos MA, Hodgson KJ, et al. Does air
plethysmography correlate with duplex scanning in patients with
chronic venous insufficiency ? J Vasc Surg 1993 ; 18 : 796-807
22. Rodriguez AA, Whitehead CM, McLaughlin RL, et al. Duplex-
derived valve closure times fail to correlate with reflux flow
volumes in patienta with chronic venous insufficiency. J Vasc
Surg 1996 ; 23 : 606-10
23. Bergan JJ. Clinical application of duplex testing in treatment of
primary venous stasis, varicose veins. In : van Bemmelen PS,
Bergan JJ, eds. Quantitative measurement of venous incompetence.
Austin : RG Landis, 1992 : 78-104

13
24. Vasdekis SN, Clarke H, Nicolaides AN. Quantification of venous
reflux by means of duplex scanning. J Vasc Surg 1989 ; 10 :670-7

14
Figure 1. A.
010
20
30
40
50
60
70
80
90100
110
120
130
140
150
160170
180
190
200
210
220
0 1 2 3 4 5 6 7 8
△△
○
△○
△○
○○○
△○
○
○
○
duration of reflux (s)
retr
ogra
depe
akve
loci
ty(c
m/s
)
△△
△
○
△△
△
○
9
○
△
○
10 11
○
○
○
△
△
△
○
○
△○
○○
○
○ ○○○ △
○△
○△ ○
△○○
△ Class 3○ Class 2
0.5

15
Figure 1. B.
G
G
G
G
G
G
G
G
G
G
GG
G
GG
G
G
G
G
G
G
G
G
G G
G
G
G
G
G
G
GG
GG
G
010
20
30
40
50
60
70
80
90100
110
120130
140
150
160
170
180
190
200
210
220
0 1 2 3 4 5 6 7 8
▲
▲
▲
▲
▲
■
■
■
▲
duration of reflux (s)
retr
ogra
depe
akve
loci
ty(c
m/s
)
▲
G
■
G
GG
▲▲
G
G
GG
G
▲
G
G
9
G
10 11
G
▲
G
G
■
■
■
G
G
G
G
G
G
GG▲
▲ G
▲ ■
GG G■
GG G
GG
▲▲
G▲
■
G Class 4Class 5Class 6
0.5
16
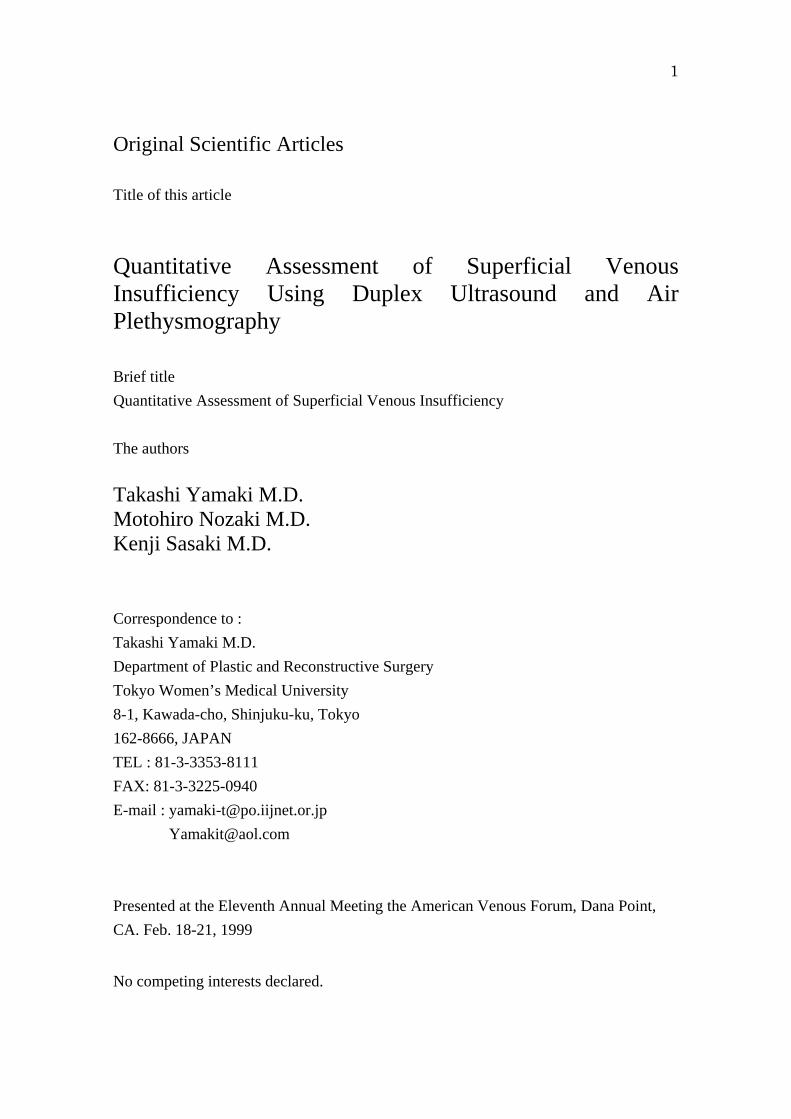
Table I.
CEAP Classification Group A Group B Group C Total
Class 2 10 2 24 36
Class 3 5 5 8 18
Class 4 37 20 11 68
Class 5 12 4 0 16
Class 6 5 3 0 8

17
Table II.
Blood Flow
Parameter
Duration of
reflux (s)
Peak velocity
(cm/s)
Diameter
(cm)
Refluxed volume
(ml/s)
Group A 2.02±0.65* 79.90±42.23* 1.17±0.23 122.80±107.68†
Group B 4.00±1.12 60.99±22.98¶ 1.05±0.25¶ 102.80±65.82¶
Group C 4.87±2.84 15.79±7.99 0.74±0.22 15.34±12.46
Values are the mean±SD.
*Group A versus Group B, p < .0001 †Group A versus Group B, p = .0002 ¶Group B versus Group C, p < .0001

18
Table III.
APG Parameter VFI (s) EF (%) RVF (%)
Group A 6.13±2.55* 41.50±17.35 50.79±17.68+
Group B 4.97±1.86† 44.35±16.13 33.82±17.79
Group C 2.73±1.26‡ 53.33±16.27 23.32±16.20¶
Normal volunteers 0.97±0.34 58.81±13.03 4.38±5.22
Values are the mean±SD.
*Group A versus Group B, p = .0007 + Group A versus Group B, p = .036 †Group B versus Group C, p = .0064 ‡Group B versus Normal volunteers, p = .0022 ¶Group B versus Normal volunteers, p = .0076

19
Table IV.
Duration of reflux (s) APG
VFI EF RVF
SFJ -0.413 0.034 -0.272
GSV -0.447 -0.039 -0.277
LSV -0.530 -0.089 -0.293

20
Table V.
Peak velocity (ml/s) APG
VFI EF RVF
SFJ 0.726 -0.062 0.299
GSV 0.579 0.069 0.333
LSV 0.704 -0.014 0.445
21
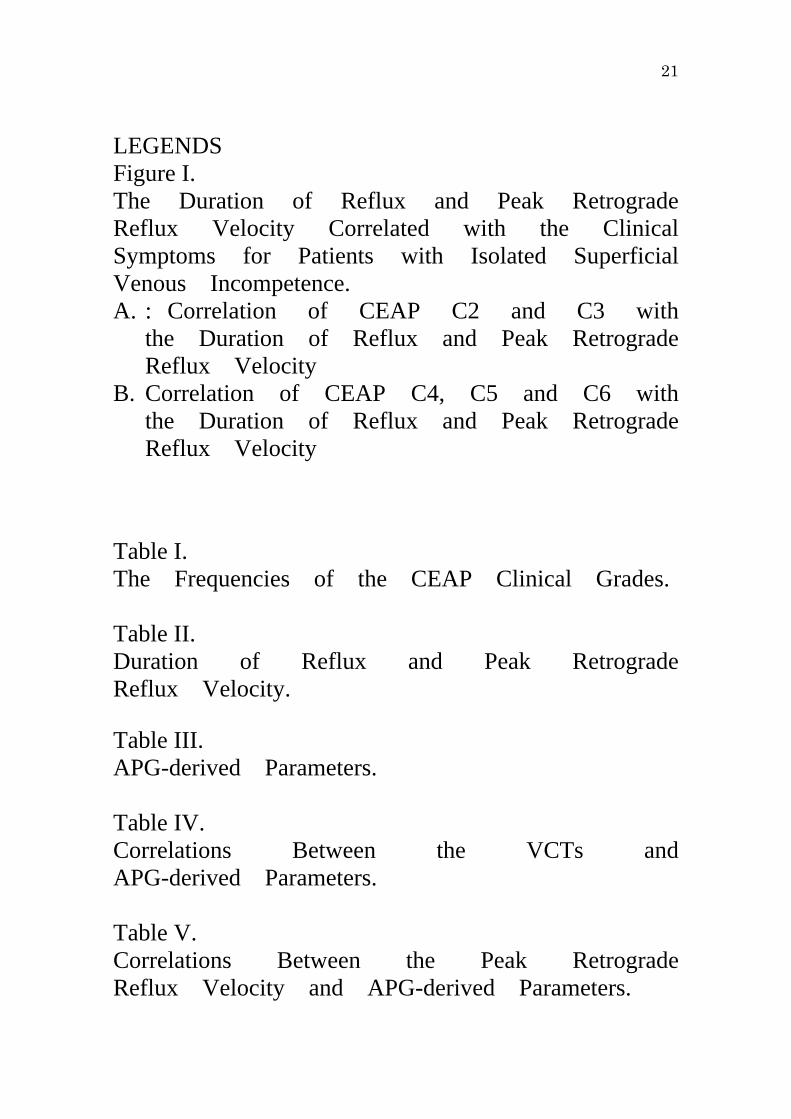
LEGENDS Figure I. The Duration of Reflux and Peak Retrograde Reflux Velocity Correlated with the Clinical Symptoms for Patients with Isolated Superficial Venous Incompetence. A. : Correlation of CEAP C2 and C3 with
the Duration of Reflux and Peak Retrograde Reflux Velocity
B. Correlation of CEAP C4, C5 and C6 with the Duration of Reflux and Peak Retrograde Reflux Velocity
Table I. The Frequencies of the CEAP Clinical Grades. Table II. Duration of Reflux and Peak Retrograde Reflux Velocity.
Table III. APG-derived Parameters. Table IV. Correlations Between the VCTs and APG-derived Parameters. Table V. Correlations Between the Peak Retrograde Reflux Velocity and APG-derived Parameters.