Embed Size (px)
Citation preview

QUANTITATIVE ASSESSMENT OF LOCALIZED GROWTH RATES AND GENE
EXPRESSION PATTERNS IN PSEUDOMONAS AERUGINOSA BIOFILMS
By
Ailyn Cecilia Pérez-Osorio
A dissertation submitted in partial fulfillment of the requirements for the degree
of
Doctor of Philosophy
in
Microbiology
MONTANA STATE UNIVERSITY Bozeman, Montana
January 2009

© COPYRIGHT
by
Ailyn Cecilia Pérez-Osorio
2009
All Rights Reserved

ii
APPROVAL
of a dissertation submitted by
Ailyn Cecilia Pérez-Osorio
This dissertation has been read by each member of the dissertation committee and has been found to be satisfactory regarding content, English usage, format, citations, bibliography, style and consistency, and is ready for submission to the college of Graduate Studies.
Dr. Michael J. Franklin
Approved for the Department of Microbiology
Dr. Michael J. Franklin
Approved for the College of Graduate Studies
Dr. Carl A. Fox

iii
STATEMENT OF PERMISSION TO USE
In presenting this dissertation in partial fulfillment of the requirements for a
doctoral degree at Montana State University, I agree that the Library shall make it
available to borrowers under rules of the Library. I further agree that copying of this
dissertation is allowable only for scholarly purposes, consistent with “fair use” as
prescribed in the U.S. Copyright Law. Requests for extensive copying or reproduction of
this dissertation should be referred to ProQuest Information and Leaning, 300 North Zeeb
Road, Ann Arbor, Michigan 48106, to whom I have granted “the exclusive right to
reproduce and distribute my dissertation in and from microform along with the non-
exclusive right to reproduce and distribute my abstract in any format in whole or in part.”
Ailyn Cecilia Perez-Osorio January 2009

iv
DEDICATION
I wish to dedicate this work to my family and to those friends who have in one way or another, inspired, motivated, advised and loved me during my years as a graduate student. Their words and actions filled my life with enthusiasm.
I am most humbled and in deep admiration of The One who created the microbial world and left it for us to discover it.

v
ACKNOWLEDGMENTS
I hold immense gratitude towards Dr. Michael J. Franklin for being a wonderful
mentor. He encouraged me to develop my scientific skills, provided continuous feedback
and guidance, and hosted a very nurturing work place. His support made this work
possible. I wish to thank Kerry Williamson, Denise Oh, Jessica Richards, Aaron Law and
Svetlana Sarkisova for their assistance at the lab with many of my experiments, and for
their pleasant company and positive attitude. I thank the members of my committee, Dr.
Jean Starkey, Dr. Martin Teintze, Dr. Brendan M. Mumey and Dr. Randall W. Babbitt for
their oversight while I fulfilled the requirements of this graduate program. My gratitude
also goes to the Microbiology Department faculty and staff for their willingness and
eagerness to always guide and assist me. I would like to acknowledge Kate McInnerney,
Barry Pyle, Sue Broadaway and Jeany Gripentrog.
The encouragement and computer advice given by Jory Lenz is especially
appreciated. I also thank Leonor Osorio for help in editing this dissertation.
This dissertation work was supported by Public Health Service grant AI-065906
(M.J.F.) from the National Institute of Allergy and Infectious Diseases and by the
American Society for Microbiology Robert D. Watkins Graduate Research Fellowship
(A.P.L.). The Montana State University INBRE Functional Genomics Core Facility
supported by NIH grant P20-RR16455 is also acknowledged. I wish to also thank the
Ferguson Scholars Program for financial support.

vi
TABLE OF CONTENTS 1. HETEROGENEITY OF PSEUDOMONAS AERUGINOSA BIOFILMS ...............1
Introduction ..............................................................................................................1 Pseudomonas aeruginosa: an Overview ..................................................................3 Biofilms and their Enhanced Ability to Survive ......................................................7 The Heterogeneous Nature of Biofilms ...................................................................9 Assessing Biofilm Heterogeneity ..........................................................................12 Concluding Remarks ..............................................................................................13
References ..............................................................................................................16 2. LOCALIZED GENE EXPRESSION IN PSEUDOMONAS AERUGINOSA
BIOFILMS .............................................................................................................23
Abstract ..................................................................................................................23 Introduction ............................................................................................................24 Materials and Methods ...........................................................................................26
Bacterial Strains and Growth Conditions ........................................................26 Cryoprocessing of Biofilms .............................................................................28 Laser Capture Microdissection Microscopy (LCMM) ....................................28 RNA Extraction ..............................................................................................29 Primers and Dual-labeled Probes ....................................................................29 InVitroTranscription .......................................................................................30 Quantitative Real Time Reverse Transcriptase PCR ......................................31 Validation of qRT-PCR Efficiency,Linearity and Reproducibility .................33 Statistical Analysis ..........................................................................................33
Results ....................................................................................................................33 GFP Fluorescence Correlates with gfp mRNA Amounts ...............................33 Stratified gfp Expression in IPTG-induced Biofilms ......................................36 Localized Expression of the Housekeeping Gene acpP .................................36 Uniform Amounts of 16S rRNA throughout Biofilms ..................................39 Stratified Expression of Quorum Sensing-regulated Genes ..........................40 Limits of Detection for Localized mRNA and rRNA Amounts in Biofilms ...41
Discussion ..............................................................................................................43 References ..............................................................................................................49
3. STRATIFIED GROWTH RATE AND TRANSCRIPTIONAL ACTIVITY OF
PSEUDOMONAS AERUGINOSA BIOFILMS .....................................................56
Abstract ..................................................................................................................56 Introduction ............................................................................................................57

vii
TABLE OF CONTENTS – CONTINUED Materials and Methods ...........................................................................................60
Strains and Conditions .....................................................................................60 Cryogenic Processing and LCMM...................................................................61 Nucleic Acids Extraction .................................................................................61 In vitro Transcription and PCR Standards .......................................................62 Real Time qRT-PCR ........................................................................................63 qPCR ................................................................................................................65 Statistical Analysis ...........................................................................................66
Results ....................................................................................................................67 Simultaneous Recovery of DNA and RNA or qRT-PCR and qPCR ..............67 Quantification of 16S rRNA and 16S rDNA from Planktonic Cultures and from Biofilms .................................................................................................68 Biofilms are Populations of Cells whose Growth Rate Differ at the Micrometer Scale .............................................................................................71 Relative Abundances of mRNA vary along the Biofilm Strata .......................74
Discussion ..............................................................................................................78 References ..............................................................................................................85
4. RESPONSES TO CALCIUM IN DEVELOPING PSEUDOMONAS
AERUGINOSA BIOFILMS: A GENE EXPRESSION SURVEY.........................90
Abstract ..................................................................................................................90 Introduction ............................................................................................................91 Materials and Methods ...........................................................................................92
Strains and Conditions ....................................................................................94 RNA Extraction ..............................................................................................95 Microarray Analysis.........................................................................................95 Quantitation of mRNA by Realtime Reverse-Transcription PCR ...................96
Results ....................................................................................................................98 Global Evaluation of Gene Expression in Biofilms .........................................98
T3SS Secreted Factors ..............................................................................98 Other Genes ............................................................................................101
Discussion ............................................................................................................105 References ............................................................................................................111
5. THESIS SYNTHESIS .........................................................................................114 Future Directions .................................................................................................117

viii
TABLE OF CONTENTS – CONTINUED APPENDICES .....................................................................................................119
APPENDIX A: Isolation of RNA and DNA from Biofilm Samples Obtained by Laser Capture Microdissection Microscopy ..............................................................................................120
APPENDIX B: qRT-PCR of Microbial Biofilms ..........................................134

ix
LIST OF TABLES
Table Page
1.1 qRT-PCR Primer and Probe Sequences and Labels ..............................................31
4.1 Primers used for qRT-PCR ...................................................................................97

x
LIST OF FIGURES
Figure Page
2.1 Localized GFP fluorescence of drip-flow reactor cultivated biofilms and colony biofilms .........................................................................................35
2.2 Stratified expression of acpP mRNA in biofilms ..................................................37 2.3 Box plot of 16S rRNA in biofilms ........................................................................39 2.4 Expression of quorum-sensing regulated genes aprA and phzA1 in
P. aeruginosa PAO1 biofilms, cultivated in drip-flow reactors .....................41 2.5 Limits of detection for microdissected biofilm samples and for
planktonic cultures for (A) gfp, (B) acpP, and (C) 16S rRNA ........................42 3.1 Dynamic range and sensitivity of qPCR and qRT-PCR from P. aeruginosa planktonic cells .........................................................................68 3.2 Quantification of 16S ribosomal RNA and DNA from planktonic cells ...............70 3.3 Quantification of 16s ribosomal DNA from biofilms ............................................71 3.4 Quantification of 16s ribosomal RNA from biofilms ...........................................72 3.5 16s rRNA to rDNA ratio used in the estimation of growth rates ..........................73 3.6 Copies of rpoS mRNA transcripts per cell in biofilms ..........................................75 3.7 Copies of rhlR mRNA transcripts per cell in biofilms ..........................................77 3.8 Copies of acpP mRNA transcripts per cell in drip flow biofilms..........................77 3.9 Copies of 16s rRNA per cell in biofilms ...............................................................78 4.1 Genes induced in biofilms grown with low [Ca2+] ...............................................99
4.2 Relative mRNA expression levels of exoS, exoT, and exoY in biofilms and planktonic cultures of P. aeruginosa .............................................................100
4.3 Exotoxin A and PA1169 relative mRNA expression levels induced during
biofilm growth ...............................................................................................102

xi
LIST OF FIGURES - CONTINUED Figure Page
4.4 Relative mRNA expression levels of PA1169 in biofilms and planktonic cultures ..................................................................................102
4.5 Genes induced by low [Ca2+] independently of mode of growth ........................103 4.6 Genes induced by planktonic growth at high [Ca2+] .........................................104 4.7 acpP relative mRNA expression levels in biofilms and planktonic cultures.......104

xii
ABSTRACT
This dissertation work provides evidence of heterogeneity in the distribution of
gene expression and growth rates among surface associated cells of Pseudomonas aeruginosa. Currently, methodologies used for characterizing biofilm heterogeneity are constrained by the need of in vitro biofilm growth and by the need to genetically manipulate bacteria.
This dissertation describes findings obtained by using LCMM, qRT-PCR, qPCR and microarrays. Through combining LCMM with qRT-PCR a housekeeping gene and two quorum sensing induced genes were found to be differentially expressed at the periphery of P. aeruginosa biofilms. qPCR also enabled the growth rate of cells in discrete locations of biofilms to be determined. Cells localized to the deep layers of biofilms were found in a growth state analogous to stationary phase in planktonic cultures, while cells localized to the biofilm periphery were slightly more active with growth rates that approached cells growing exponentially in planktonic cultures. By elucidating the growth rates of subpopulations within the biofilm it was subsequently possible to determine that the most active cells had approximately 7 copies of the mRNA of housekeeping and stationary phase associated genes. Each of the least active cells, those found in the deeper sections of the biofilms, had less than one copy of any of the mRNAs measured. No significant differences in the distribution of 16S rRNA were found along the sections analyzed. The microarray studies revealed several genes, known to be involved in the pathogenesis of P. aeruginosa, to be undergoing active transcription in young biofilms under conditions of low calcium concentrations. This is significant because calcium homeostasis is known to be out of balance in the lungs of cystic fibrosis patients, where P. aeruginosa biofilms grow causing life threatening infections.
These results suggest that spatial and temporal heterogeneity within biofilms underscores their ability to not only survive in diverse and sometimes harsh environmental conditions, but to exploit those environments. The methods described in this work are suitable for characterizing heterogeneity of gene expression and growth rate in biofilms collected from their natural environment. These also represent an alternative method for assessing the distribution of populations in multispecies biofilms.

1
CHAPTER 1
HETEROGENEITY OF PSEUDOMONAS AERUGINOSA BIOFILMS
Introduction
Bacteria are equipped with a variety of survival strategies that allow them to
proliferate in most environments they encounter. For example, the same bacterium can
grow planktonically, freely swimming in liquid bodies or humid environments, or
attached to surfaces as part of a sessile community. To successfully colonize either
environment, cells must be able to express a suitable set of phenotypic traits. When
planktonic cells attach to a surface, they begin to form clonal microcolonies and grow at
relatively constant rates as they undergo a series of phenotypic switches leading to the
formation of a biofilm (56). They cease to make flagella, switch to Type IV pili, and
synthesize copious amounts of extracellular polymeric substances (63). In comparison to
planktonic organisms, biofilms show decreased antimicrobial and antibiotic
susceptibility, are more resistant to host mediated immune responses, and are able to
withstand a wider range of environmental challenges. A considerable body of literature
has been devoted to the characterization of many species and their ability to colonize
specialized niches of medical or environmental relevance (14, 18, 26, 27, 52 48).
However, the implications of biofilm growth require further exploration since
physiological characteristics appear to be complicated by the heterogeneous nature of
these communities.

2
In biofilms, uneven distribution of nutrients and environmental cues, such as
signaling compounds, influence cellular physiology and metabolic activity (63).
Additionally, as waste products and endogenous signaling compounds are secreted in
response to the stratified conditions, complexity is increased and steeper chemical
gradients are formed. The formation of complex structures such as microcolonies or
mushroom like cell aggregates and the formation of channels also contribute to the
formation of heterogeneous conditions at the microscale level. Therefore, many of the
unique properties attributed to biofilms may be explained by the resulting heterogeneous
physiological states adopted by these cells.
The environmental heterogeneity within biofilms may provide an adaptation
advantage to the biofilm by encouraging phenotypic differentiation among members of
the same genotype. Consequently, within short distances of each other, subpopulations of
cells can form which are able to withstand various environmental challenges. More
research is needed to address the effect of various environmental pressures at the cellular
level in biofilms. As attempts are made to improve the management of biofilm related
issues, it is paramount that we continue to seek to understand biofilm physiology and the
adaptation strategies used by these cells.
In the clinical setting, the majority of persistent bacterial infections are thought to
be in association with biofilms (9), making these infections a leading cause of health-
related problems (14, 15). The opportunistic pathogen P. aeruginosa forms biofilms with
significant prevalence in hospital acquired infections. It is also the primary
microorganism responsible for severe lung infections in patients with cystic fibrosis (CF).

3
Since important lessons have been learned from studying the ability of P.
aeruginosa to form biofilms, this organism will be used as a model to address biofilm
related issues in the following sections of this chapter. The role of P. aeruginosa in the
clinical setting and its ability to inflict biofilm associated infections will be described.
The physiological heterogeneity among biofilm cells, its implications, and the methods
available to study localized metabolic activities of biofilms will also be addressed.
Pseudomonas aeruginosa: an Overview
Pseudomonas aeruginosa is a gram-negative rod of approximately 1 um3 that is
ubiquitous in soil, plants, water and other humid environments (17). In order to meet its
nutritional requirements, this bacterium is capable of utilizing many organic compounds.
In the absence of oxygen, it can use nitrate as electron acceptor. Due to its ability to
infect compromised tissues, P. aeruginosa is considered an opportunistic pathogen and is
responsible for as much as 10% of nosocomial infections (21, 42, 54). Within the 6.3
Mbp of the P. aeruginosa genome is a complex collection of genes dedicated to enhance
its adaptability to a number of growth conditions. In the hospital setting, P. aeruginosa
has been isolated from flowers, vegetables, respiratory equipment, medicines, sinks,
mops, and even disinfectant solutions (58). Biofilms comprised of this pathogen have
become an increasing problem in hospitals, because they are very resistant to disinfection
techniques and tend to colonize a number of surfaces, such as indwelling medical
devices. Hospitalized patients are also commonly colonized at burn wound sites and often
become ill with pneumonia or urinary tract infections due to P. aeruginosa (15, 18, 21,
4
60, 66). Among immunocompromised patients commonly affected by this pathogen are
those afflicted with acute leukemia, HIV, or patients who have received organ transplants
(21). The impact of P. aeruginosa on patients at hospitals is also well illustrated by the
20% increase in gastrointestinal carriage that occurs within 72 hours of admission (58).
Pulmonary disease in CF patients is exacerbated by infections with several
pathogens that predominantly involve P. aeruginosa biofilms. These lung infections are
associated with an increase in the morbidity and mortality rates seen in patients suffering
from CF. The genetic disorder CF is most prevalent in the Caucasian population (2). It
affects the CF transmembrane regulator (CFTR), which is a protein that functions as an
ion channel (32). Organs that depend on mucus homeostasis, such as the lung, are
adversely affected by this mutation. The abnormal chloride and sodium transport in the
upper respiratory tract epithelium encourages the reabsorption of water from the
extracellular space. The thickened mucus overwhelms the normal beating function of
lung epithelium and creates a suitable environment for increased microbial growth (38,
43) . Upon establishment of infection, clearing of these organisms from the lung is very
difficult and at times, impossible. Without proper management, these infections can lead
to a rapid decrease in lung function, which is the primary cause of illness and death in CF
patients. The vast majority of CF patients suffer from P. aeruginosa pulmonary infections
by the time they reach adulthood (6, 23). These infections can be controlled by the use of
antibiotic therapy, which reduces overt symptoms by decreasing the bacterial burden in
the lung. Therapy does not completely clear the underlying biofilms, thus allowing them
to act as reservoirs. Such treatments, in conjunction with other therapies for clearing the

5
airways and controlling inflammation, have remarkably prolonged the life expectancy of
these patients (1, 30).
The extracellular polysaccharide matrix embedding the cells of P. aeruginosa
biofilms can enhance antibiotic resistance to troublesome levels (37). P. aeruginosa is
able to secrete alginate, an extracellular polysaccharide that forms a thickened matrix in
the strains that switch to a mucoid phenotype. This phenotypic switch correlates with the
permanent establishment of P. aeruginosa in the lung (35, 50). Mucoid P. aeruginosa has
been found in chronic infections of over 90% of CF patients who present increased
inflammation, tissue destruction and a decline in pulmonary function, all of which are
intimately related to the poor prognosis of CF patients (11, 22, 51, 35). Additionally,
phenazine pigments have been shown to be very toxic toward the respiratory epithelium,
inhibiting ciliary beating in vitro (70). Other extracellular products include elastases,
alkaline protease, exotoxin A and protease IV, all of which degrade host
immunoregulatory proteins such as surfactants, complement, immunoglobulin and
bacterial peptides (21). Robust antibiotic production toward the Type III secretion system
is detected in early P. aeruginosa infection of CF patients (39). The effector proteins
secreted by this system are directly injected into the host cell cytosol, where they can
alter immune responses, cause injury, and induce apoptosis (21). Furthermore,
membrane bound virulence factors such as lipopolysaccharide, flagella, and pili can
exacerbate the immune response in the lung by interacting with cellular receptors of the
lung epithelium (39).

6
In their sequencing study, Stover et al. identified a large number of transport
systems specialized in nutrient intake; of these, about 150 genes were classified as outer
membrane proteins and over 30 as drug efflux systems (64). The intrinsic antibiotic
resistance and advanced ecological versatility of P. aeruginosa can be partially attributed
to the presence of four operons that encode multidrug resistance pumps. These are
membrane transporter proteins that, when active, serve to export a number of antibiotics
(41) and a variety of other substances, such as detergents, organic solvents, antiseptics,
charged and neutral compounds, and heavy metal ions (46, 48, 57). In addition, ten per
cent of this pathogen’s 5,570 open reading frames are dedicated to regulatory functions,
enabling and/or enhancing host invasion upon sensing environmental clues (65).
The switch of planktonic cells into sessile growth is accompanied by several
important phenotypic changes. These allow the pathogen to attach to a surface, form
microcolonies, differentiate into mature biofilms, and encourage dispersal for
colonization of new surfaces (15). During planktonic growth and the initial surface
interactions necessary for attachment, flagella and Type IV pili are known to be
important (49). In their biofilm development study, through a proteomic approach, Sauer
and associates found that more than 50% of proteins undergo changes in expression when
planktonic cells become surface associated and develop into a mature biofilm (56).
Among these genes is a small portion of quorum sensing regulated proteins that
underwent upregulation. It is worth noting that flagella are no longer made by these
matured biofilms until the cells are ready for detachment. Others have also characterized
the changes in expression profiles using global transcriptional approaches by taking

7
advantage of DNA microarray technology. One study found 73 genes differentially
expressed in 5 day old biofilms (69). Among these genes, rpoS, a sigma factor that
influences the transcription of other P. aeruginosa genes during stationary phase, was
found to have profound roles in the suppression and regulation of biofilm thickness,
antibiotic resistance to tobramycin, and in the expression of virulence factors (71).
Following colonization, factors such as elastase, hemolysin, cytotoxins, siderophores, and
pyocyanin aid in the establishment of infection (25). The severity of the infection, in
terms of prognosis, recovery time, as well as long term implications, can also be affected
by alginate, the production of toxins, the release of lipopolysaccharide, and the formation
of small colony variants (21, 34, 25). In the late stages of development, mature biofilms
experience hollowing events while undergoing seeding dispersal. These cells exhibit
increased motility and experience increased levels of prophage conversion to the
superinfective lytic form; presumably as a mechanism that enhances biofilm dispersal. In
addition, some clinical P. aeruginosa isolates stop producing quorum sensing signaling
molecules and acute virulence determinants while undergoing detachment (34).
Biofilms and their Enhanced Ability to Survive
Biofilms are the predominant form in which earth’s microbial biomass exist; they
participate in carbon and inorganic nutrient cycling (14, 26, 52). Because of their growth
versatility, high microbial biomass, and other physical properties, biofilms are especially
suitable for the bioremediation of toxic chemicals and for the production of chemicals in
industrial settings (61, 63). Likewise, their ability to adapt, colonize, and persist in such

8
diverse settings affects aspects of everyday life. The presence of biofilms on surfaces
instigates biofouling and biocorrosion, both of which affect the performance of many
types of materials, including metals and plastics that are important to our food industry,
water systems, marine equipment and medical devices (7, 8, 13, 68).
Biofilms are difficult to eradicate from most environments, and in general, the
response of planktonic cells to these eradication attempts is poorly correlated to the
response of the same cells growing as biofilms (31). Sessile cells are better suited to
overcome antimicrobial challenges by using several strategies. Penetration of biocides
into the exopolysaccharide matrix encasing biofilm has been shown to be dependant on
the properties of individual compounds and their affinity to the matrix (44). This
protective layer can additionally serve as a barrier to attacks of the immune system by
preventing the direct contact of opsonizing antibodies and other protective processes of
the host (15). Cells in the deep layers of a biofilm have been shown to experience nutrient
and oxygen limitation. Therefore, they exist in a slow growing state that allows them to
serve as a reservoir of live cells resistant to eradication techniques that target the
metabolizing populations. Additional strategies that allow sessile cells to survive in the
host following antibiotic therapy include traditional mechanisms of development of
resistance to antibiotics, generally known to occur in planktonic cells as the result of
intense selective pressure and the formation of colony variants, which has been described
as a biofilm specific phenotype (15, 29, 30, 59).

9
Due to the importance of controlling and managing biofilms, there is a need to
understand how local environments affect bacterial activities during colonization, growth
and persistence on surfaces of medical, industrial and environmental relevance.
The Heterogeneous Nature of Biofilms
Heterogeneity in biofilms has been studied at the spatial and temporal levels
whereby genotypically identical cells undergo differentiation depending on the forces
driving the selection of specific traits. Phenotypic changes, related to the regulation of
gene expression, and genotypic changes, as the result of mutations, have been observed.
Regardless of the number of species living within a biofilm, the primary consequence of
heterogeneous environmental conditions to each individual species is an increase in the
diversity of the population, enhancing the potential of each species for survival (53).
Perhaps the increase in antibiotic resistance seen in biofilms and their inherent ability to
persist and adapt to changing environmental conditions can be in part explained by the
population diversity contained within each biofilm.
Population diversity can arise from the accumulation of mutations affecting a few
members of the community. The mutation rate in biofilms appears to be in part driven by
an increase in the oxidative stress of cells living in deep pockets (10). In fact, in one
study by Koh et al. (36) it was shown that biofilms of Serratia marcescens had
significantly higher frequencies in the emergence of variant colonies as compared to
planktonic cultures. Small colony variants (SCV) have been observed in biofilms of P.
aeruginosa, Vibrio cholerae and Streptococcus pneumoniae (3, 10, 72). Spontaneous

10
mutations, single nucleotide polymorphisms, faulty repair of double stranded DNA
breaks and gene transfer have all been associated with the emergence of SCV (10, 27, 33,
47). These variants are characterized by a rough phenotype and generally form biofilms
with antibiotic susceptibility profiles extensively different from those of their wildtype
counterparts (3, 28, 33, 36, 72).
The mutations seen in some members of the biofilm community can also be
attributed to exposure to subinhibitory concentrations of drugs, leading to an increase in
antibiotic resistance. This enhanced resistance to antibiotic treatment is often achieved by
the subpopulations of cells directly exposed to subinhibitory levels of these drugs. In P.
aeruginosa, an increase in antibiotic resistance seen in some biofilms starts as the result
of a mutation that affects a repressor gene (either nalB or nfxB) of a multidrug (MDR)
efflux pump, resulting in an increase in the expression of the mexAB-oprM or mexCD-
oprJ pumps, leading to an increase in antibiotic resistance at the biofilm substratum (16,
55). Furthermore, genetic diversity in the population also results from ecological
selection in multispecies biofilms, where the swapping of genes commonly takes place.
The survival of a population is dependent on the level of genetic plasticity of an organism
in the face of continuous changes in the environment in which it exists.
Population diversity can also result from regulatory differences that govern the
state of subpopulations of cells without the involvement of mutations. Metabolic
heterogeneity is observed within micrometer scale distances in a biofilm due to the
uneven distribution and penetration of nutrients and oxygen as well as gradients in
osmotic pressure and pH (63). Availability of chitin can induce stratified levels of

11
chitinolytic gene expression in P. aeruginosa biofilms (5). Another example where
nutritional sources regulate gene expression in biofilms is the repressor/anti-repressor
system SinR and SinI of Bacillus subtilis (12). The gene expression of these genes is
stratified and regulated differently, with sinI only being expressed by small
subpopulations and sinR being expressed throughout the entire biofilm. Perhaps the
discovery of a mechanism involving a shutdown in the expression of enzymes that confer
protection against DNA damage under oxidative conditions may explain the increase in
the emergence of SCV in biofilms seen as the result of oxidative damage (10, 20).
Subinhibitory levels of antimicrobials can also induce the regulation of gene expression
in addition to being a force that can drive the emergence of antibiotic resistant mutants.
P. aeruginosa can regulate antimicrobial resistance through the transcriptional regulator
PsrA, which responds to subinhibitory levels of cationic antimicrobial peptides (24). This
organism can also respond to low concentrations of imipenem by upregulating the
expression of beta-lactamase encoded by ampC in cells localized to the periphery of the
biofilm (4). Many other genes involved in the regulation of antibiotic susceptibility and
other biofilm associated traits have also been described. In some instances, the
parameters under which these are most active have not been identified, yet they do show
stratified activities within a biofilm. Among these regulatory genes is pvrR of P.
aeruginosa, ascribed with the function of controlling the conversion between antibiotic-
resistant and antibiotic-susceptible variants (19). The production of periplasmic glucans
by P. aeruginosa has been associated with increased resistance to three different classes
of antibiotics; this phenotype is conferred by the gene ndvB (45).

12
Assessing Biofilm Heterogeneity As described here, biofilms are heterogeneous communities that are actively
interacting with the environment that surrounds them. The nature of this interaction is not
only driven by the location of cells in a biofilm or the exposure to certain compounds, but
also by the developmental process that occurs over time. The attachment, growth,
maturation, and dispersal stages of a biofilm have been well documented through
genomic and proteomic approaches. These studies have provided valuable information
regarding the main phenotypic characteristics that differentiate these cells from
planktonic cells (62). These studies are generally done at the global scale by harvesting
biofilms in masse. Since biofilms have very specialized populations of cells, other
investigators have taken advantage of the use of reporter genes and imaging tools, such as
confocal scanning laser microscopy, to gain insights about the spatial and temporal
contributions to the expression of genes in single and mixed species biofilms.
In their review, Stewart and Franklin address in detail some of the techniques that
are most commonly used for the characterization of biofilm heterogeneity (63). Stains,
such as CTC, LIVE/DEAD BacLight, and the DNA synthetic activity assay, can
elucidate the growth rate of cells at discrete locations in biofilms. The use of fluorescence
in situ hybridization (FISH) probes can be very useful in identifying species distribution
in multispecies communities. When combined with microautoradiography, the metabolic
activity of different species can be assessed. FISH probes have also been used to assess
the location of transcriptional activity of a gene with limited expression levels by
combining this technique with in situ reverse-transcription amplification.

13
A more quantitative approach for the assessment of gene expression at the
localized level in biofilms is discussed in the following chapters of this work. The
approach uses laser capture microdissection microscopy to assess the expression of
several transcripts from one sample within a biofilm. This method allows for the isolation
of cells from defined areas within any biofilm and does not require a priori genetic
manipulation of the cells; therefore, it is suitable for studying biofilms directly from their
natural environments. Like other methods, it is destructive, so the assessment of temporal
aspects of biofilm growth needs to be done by sampling several time points from
different biofilms. The quantitative aspect of this method involves the isolation of
ribonucleic acids and their amplification using quantitative reverse transcription
polymerase chain reaction (PCR). Traditionally, a normalizer gene is needed to serve as
a reference point in the comparison of the levels of mRNAs (67). Due to the remarkable
changes in gene expression seen among different growth stages of bacterial growth, the
use of internal RNA standards is questionable in such gene expression studies (67). In
fact, known housekeeping genes are not stably expressed along the biofilm (40).
Therefore, the quantitative aspect of this method is limited by the availability of internal
controls. As an alternative to mRNA internal controls, the use of 16S rRNA or 16S rDNA
is proposed.
Concluding Remarks
The clever phenotypic adaptation that microorganisms undergo to inhabit surfaces
is advantageous in the colonization of a varied range of ecological niches. Similarly, such

14
adaptation enables these organisms to develop enhanced survival capabilities necessary
for the successful preservation of the species in the environment. The opportunistic
pathogen P. aeruginosa represents an organism with a wide range of adaptation strategies
that enable it to thrive in soil, water and in many other environments. The unfortunate
encounter with this organism, as well as other pathogens with similar adaptation
capabilities (i.e. Acinetobacter baumannii), can result in the establishment of infections
that are very difficult to manage. P. aeruginosa has intrinsic survival mechanisms that
can concomitantly induce substantial tissue destruction. Often, the symptoms of these
infections result from the secretion of extracellular factors, contact dependent tissue
damage, and host mediated hyperinflammatory responses.
Understanding the heterogeneous nature of biofilms has led to the development of
treatment strategies that include the use of combined antibiotic therapy, where two or
more drugs are used to treat certain infections, and the use of surgical procedures to
mechanically remove biofilms from deep sites as well as from chronic wounds.
Mechanical removal of biofilms, although highly effective, can not be performed on all
sites where infections occur because it often requires surgery. New therapies are needed
to reduce the length and severity of biofilm associated infections, and their development
is dependent on our ability to continue to understand biofilm physiology. The benefits of
characterizing biofilms elsewhere in nature include the (i) assessment of diversity, (ii)
discovery of new enzymes or metabolic activities, (iii) discovery of new insights for the
control of biofouling and (iv) elucidation of conditions that allow the optimization of

15
bioreactor performance. These, among many other applications, will benefit from
research that is sensitive to the dynamic nature of biofilm composition.
In the following chapters, we use P. aeruginosa while we aim to grasp more
insights about biofilm development and the relationship between structure and metabolic
activity of localized cells. Specifically, in the second chapter we explore the potential for
the study of stratified gene expression in biofilms by using a methodology that combines
laser capture microdissection with quantitative reverse transcriptase polymerase chain
reaction. By using this method, we observe that many transcripts, including the
housekeeping gene acpP, have stratified gene expression that localize to the periphery of
biofilm. The stratified nature of biofilms is further demonstrated in chapter three, where
gene expression studies use the 16s rDNA as a normalization strategy to reveal
expression levels of several transcripts including rpoS and rhlR at the cellular level. In
this chapter, the elucidation of cellular ribosome content at discrete regions of the biofilm
is also discussed. The last chapter of this dissertation contains a survey of the expression
levels of various virulence factors during the initial stages of biofilm development. This
chapter highlights the need for the development of the methods described in the
preceding chapters and provides future directions for research of P. aeruginosa biofilms.

16
References Cited
1. 11/29/07, posting date. Building Strength: Therapies for CF. Cystic Fibrosis
Foundation. [Online.] 2. 01/23/08, posting date. Who gets Cystic Fibrosis? Cystic Fibrosis Foundation.
[Online.] 3. Allegrucci, M., and K. Sauer. 2007. Characterization of colony morphology
variants isolated from Streptococcus pneumoniae biofilms. J Bacteriol 189:2030-8.
4. Bagge, N., M. Hentzer, J. B. Andersen, O. Ciofu, M. Givskov, and N. Hoiby.
2004. Dynamics and spatial distribution of beta-lactamase expression in Pseudomonas aeruginosa biofilms. Antimicrob Agents Chemother 48:1168-74.
5. Baty, A. M., III, C. C. Eastburn, S. Techkarnjanaruk, A. E. Goodman, and G. G.
Geesey. 2000. Spatial and Temporal Variations in Chitinolytic Gene Expression and Bacterial Biomass Production during Chitin Degradation. Applied and Environmental Microbiology 66:3574-3585.
6. Bauernfeind, A., G. Emminger, G. Horl, S. Ott, B. Przyklenk, and C. Weisslein-
Pfister. 1987. Bacteriological effects of anti-Pseudomonas aeruginosa chemotherapy in cystic fibrosis. Infection 15:403-6.
7. Beech, I. B., J. A. Sunner, C. R. Arciola, and P. Cristiani. 2006. Microbially-
influenced corrosion: damage to prostheses, delight for bacteria. Int J Artif Organs 29:443-52.
8. Beech, I. B., J. A. Sunner, and K. Hiraoka. 2005. Microbe-surface interactions in
biofouling and biocorrosion processes. Int Microbiol 8:157-68. 9. Bjarnsholt, T., K. Kirketerp-Moller, P. O. Jensen, K. G. Madsen, R. Phipps, K.
Krogfelt, N. Hoiby, and M. Givskov. 2008. Why chronic wounds will not heal: a novel hypothesis. Wound Repair Regen 16:2-10.
10. Boles, B. R., and P. K. Singh. 2008. Endogenous oxidative stress produces
diversity and adaptability in biofilm communities. Proc Natl Acad Sci U S A 105:12503-8.
11. Bonfield, T. L., M. W. Konstan, P. Burfeind, J. R. Panuska, J. B. Hilliard, and M.
Berger. 1995. Normal bronchial epithelial cells constitutively produce the anti-

17
inflammatory cytokine interleukin-10, which is downregulated in cystic fibrosis. Am J Respir Cell Mol Biol 13:257-61.
12. Chai, Y., F. Chu, R. Kolter, and R. Losick. 2008. Bistability and biofilm
formation in Bacillus subtilis. Mol Microbiol 67:254-63. 13. Coetser, S. E., and T. E. Cloete. 2005. Biofouling and biocorrosion in industrial
water systems. Crit Rev Microbiol 31:213-32. 14. Costerton, J. W., Z. Lewandowski, D. E. Caldwell, D. R. Korber, and H. M.
Lappin-Scott. 1995. Microbial Biofilms. Ann. Rev. Microbiol.:711-745. 15. Costerton, J. W., P. S. Stewart, and E. P. Greenberg. 1999. Bacterial biofilms: a
common cause of persistent infections. Science 284:1318-1322. 16. De Kievit, T. R., M. D. Parkins, R. J. Gillis, R. Srikumar, H. Ceri, K. Poole, B. H.
Iglewski, and D. G. Storey. 2001. Multidrug efflux pumps: expression patterns and contribution to antibiotic resistance in Pseudomonas aeruginosa biofilms. Antimicrob Agents Chemother 45:1761-70.
17. Deziel, E., Y. Comeau, and R. Villemur. 2001. Initiation of biofilm formation by
Pseudomonas aeruginosa 57RP correlates with emergence of hyperpiliated and highly adherent phenotypic variants deficient in swimming, swarming, and twitching motilities. J Bacteriol 183:1195-204.
18. Donlan, R. M., and J. W. Costerton. 2002. Biofilms: survival mechanisms of
clinically relevant microorganisms. Clin Microbiol Rev 15:167-93. 19. Drenkard, E., and F. M. Ausubel. 2002. Pseudomonas biofilm formation and
antibiotic resistance are linked to phenotypic variation. Nature 416:740-3. 20. Driffield, K., K. Miller, J. M. Bostock, A. J. O'Neill, and I. Chopra. 2008.
Increased mutability of Pseudomonas aeruginosa in biofilms. J Antimicrob Chemother 61:1053-6.
21. Driscoll, J. A., S. L. Brody, and M. H. Kollef. 2007. The epidemiology,
pathogenesis and treatment of Pseudomonas aeruginosa infections. Drugs 67:351-68.
22. Fitz Simmons, S. C. 1993. The changing epidemiology of cystic fibrosis. J.
Pediatr. 122:1-9. 23. Gilligan, P. H. 1991. Microbiology of airway disease in patients with cystic
fibrosis. Clin Microbiol Rev 4:35-51.

18
24. Gooderham, W. J., M. Bains, J. B. McPhee, I. Wiegand, and R. E. Hancock. 2008. Induction by cationic antimicrobial peptides and involvement in intrinsic polymyxin and antimicrobial peptide resistance, biofilm formation, and swarming motility of PsrA in Pseudomonas aeruginosa. J Bacteriol 190:5624-34.
25. Govan, J. R. W., and V. Deretic. 1996. Microbial pathogenesis in Cystic Fibrosis:
Mucoid Pseudomonas aeruginosa and Burkholderia cepacia. Microbiological Reviews 60:539-574.
26. Hall-Stoodley, L., J. W. Costerton, and P. Stoodley. 2004. Bacterial biofilms:
from the natural environment to infectious diseases. Nat Rev Microbiol 2:95-108. 27. Hansen, S. K., P. B. Rainey, J. A. Haagensen, and S. Molin. 2007. Evolution of
species interactions in a biofilm community. Nature 445:533-6. 28. Haussler, S. 2004. Biofilm formation by the small colony variant phenotype of
Pseudomonas aeruginosa. Environ Microbiol 6:546-51. 29. Hoiby, N. 1993. Antibiotic therapy for chronic infection of pseudomonas in the
lung. Annu Rev Med 44:1-10. 30. Hoiby, N. 2002. Understanding bacterial biofilms in patients with cystic fibrosis:
current and innovative approaches to potential therapies. J Cyst Fibros 1:249-54. 31. Hoyle, B. D., and J. W. Costerton. 1991. Bacterial resistance to antibiotics: the
role of biofilms. Prog Drug Res 37:91-105. 32. Kerem, B., J. M. Rommens, J. A. Buchanan, D. Markiewicz, T. K. Cox, A.
Chakravarti, M. Buchwald, and L. C. Tsui. 1989. Identification of the cystic fibrosis gene: genetic analysis. Science 245:1073-80.
33. Kirisits, M. J., L. Prost, M. Starkey, and M. R. Parsek. 2005. Characterization of
colony morphology variants isolated from Pseudomonas aeruginosa biofilms. Appl Environ Microbiol 71:4809-21.
34. Kirov, S. M., J. S. Webb, Y. O'May C, D. W. Reid, J. K. Woo, S. A. Rice, and S.
Kjelleberg. 2007. Biofilm differentiation and dispersal in mucoid Pseudomonas aeruginosa isolates from patients with cystic fibrosis. Microbiology 153:3264-74.
35. Koch, C., and N. Hoiby. 1993. Pathogenesis of cystic fibrosis. Lancet 341:1065-9. 36. Koh, K. S., K. W. Lam, M. Alhede, S. Y. Queck, M. Labbate, S. Kjelleberg, and
S. A. Rice. 2007. Phenotypic diversification and adaptation of Serratia marcescens MG1 biofilm-derived morphotypes. J Bacteriol 189:119-30.

19
37. Lam, J., R. Chan, K. Lam, and J. W. Costerton. 1980. Production of mucoid microcolonies by Pseudomonas aeruginosa within infected lungs in cystic fibrosis. Infect Immun 28:546-56.
38. Lattner, D., H. C. Flemming, and C. Mayer. 2003. 13C-NMR study of the
interaction of bacterial alginate with bivalent cations. Int J Biol Macromol 33:81-8.
39. Lau, G. W., D. J. Hassett, and B. E. Britigan. 2005. Modulation of lung epithelial
functions by Pseudomonas aeruginosa. Trends Microbiol 13:389-97. 40. Lenz, A. P., K. Williamson, B. Pitts, P. S. Stewart, and M. J. Franklin. 2008.
Localized gene expression in Pseudomonas aeruginosa Biofilms. Appl Environ Microbiol 74:4463-71.
41. Li, X. Z., D. Ma, D. M. Livermore, and H. Nikaido. 1994. Role of efflux pump(s)
in intrinsic resistance of Pseudomonas aeruginosa: active efflux as a contributing factor to beta-lactam resistance. Antimicrob Agents Chemother 38:1742-52.
42. Lyczak, J. B., C. L. Cannon, and G. B. Pier. 2000. Establishment of Pseudomonas
aeruginosa infection: lessons from a versatile opportunist. Microbes Infect 2:1051-60.
43. Lyczak, J. B., C. L. Cannon, and G. B. Pier. 2002. Lung infections associated
with cystic fibrosis. Clin Microbiol Rev 15:194-222. 44. Mah, T. F., and G. A. O'Toole. 2001. Mechanisms of biofilm resistance to
antimicrobial agents. Trends Microbiol 9:34-9. 45. Mah, T. F., B. Pitts, B. Pellock, G. C. Walker, P. S. Stewart, and G. A. O'Toole.
2003. A genetic basis for Pseudomonas aeruginosa biofilm antibiotic resistance. Nature 426:306-10.
46. Mao, W., M. S. Warren, D. S. Black, T. Satou, T. Murata, T. Nishino, N. Gotoh,
and O. Lomovskaya. 2002. On the mechanism of substrate specificity by resistance nodulation division (RND)-type multidrug resistance pumps: the large periplasmic loops of MexD from Pseudomonas aeruginosa are involved in substrate recognition. Mol Microbiol 46:889-901.
47. McEllistrem, M. C., J. V. Ransford, and S. A. Khan. 2007. Characterization of in
vitro biofilm-associated pneumococcal phase variants of a clinically relevant serotype 3 clone. J Clin Microbiol 45:97-101.

20
48. Morita, Y., T. Murata, T. Mima, S. Shiota, T. Kuroda, T. Mizushima, N. Gotoh, T. Nishino, and T. Tsuchiya. 2003. Induction of mexCD-oprJ operon for a multidrug efflux pump by disinfectants in wild-type Pseudomonas aeruginosa PAO1. J Antimicrob Chemother 51:991-4.
49. O'Toole, G. A., and R. Kolter. 1998. Initiation of biofilm formation in
Pseudomonas fluorescens WCS365 proceeds via multiple, convergent signalling pathways: a genetic analysis. Mol. Microbiol. 28:449-461.
50. Pedersen, S. S., N. Hoiby, F. Espersen, and C. Koch. 1992. Role of alginate in
infection with mucoid Pseudomonas aeruginosa in cystic fibrosis. Thorax 47:6-13.
51. Pedersen, S. S., H. Moller, F. Espersen, C. H. Sorensen, T. Jensen, and N. Hoiby.
1992. Mucosal immunity to Pseudomonas aeruginosa alginate in cystic fibrosis. Apmis 100:326-34.
52. Potera, C. 1998. Studying slime. Environ Health Perspect 106:A604-6. 53. Rainey, P. B., A. Buckling, R. Kassen, and M. Travisano. 2000. The emergence
and maintenance of diversity: insights from experimental bacterial populations. Trends Ecol Evol 15:243-247.
54. Rosenthal, V. D., D. G. Maki, A. Mehta, C. Alvarez-Moreno, H. Leblebicioglu, F.
Higuera, L. E. Cuellar, N. Madani, Z. Mitrev, L. Duenas, J. A. Navoa-Ng, H. G. Garcell, L. Raka, R. F. Hidalgo, E. A. Medeiros, S. S. Kanj, S. Abubakar, P. Nercelles, and R. D. Pratesi. 2008. International Nosocomial Infection Control Consortium report, data summary for 2002-2007, issued January 2008. Am J Infect Control 36:627-37.
55. Sanchez, P., J. F. Linares, B. Ruiz-Diez, E. Campanario, A. Navas, F. Baquero,
and J. L. Martinez. 2002. Fitness of in vitro selected Pseudomonas aeruginosa nalB and nfxB multidrug resistant mutants. J Antimicrob Chemother 50:657-64.
56. Sauer, K., A. K. Camper, G. D. Ehrlich, J. W. Costerton, and D. G. Davies. 2002.
Pseudomonas aeruginosa displays multiple phenotypes during development as. Journal of Bacteriology 184:1140-1154.
57. Schweizer, H. P. 2003. Efflux as a mechanism of resistance to antimicrobials in
Pseudomonas aeruginosa and related bacteria: unanswered questions. Genet Mol Res 2:48-62.

21
58. Shooter, R. A., K. A. Walker, V. R. Williams, G. M. Horgan, M. T. Parker, E. H. Asheshov, and J. F. Bullimore. 1966. Faecal carriage of Pseudomonas aeruginosa in hospital patients. Possible spread from patient to patient. Lancet 2:1331-4.
59. Singh, P. K., A. L. Schaefer, M. R. Parsek, T. O. Moninger, M. J. Welsh, and E.
P. Greenberg. 2000. Quorum-sensing signals indicate that cystic fibrosis lungs are infected. 407:762-764.
60. Singh, P. K., A. L. Schaefer, M. R. Parsek, T. O. Moninger, M. J. Welsh, and E.
P. Greenberg. 2000. Quorum-sensing signals indicate that cystic fibrosis lungs are infected with bacterial biofilms. Nature 407:762-4.
61. Singh, R., D. Paul, and R. K. Jain. 2006. Biofilms: implications in bioremediation.
Trends Microbiol 14:389-97. 62. Southey-Pillig, C. J., D. G. Davies, and K. Sauer. 2005. Characterization of
temporal protein production in Pseudomonas aeruginosa biofilms. J Bacteriol 187:8114-26.
63. Stewart, P. S., and M. J. Franklin. 2008. Physiological heterogeneity in biofilms.
Nat Rev Microbiol 6:199-210. 64. Stover, C. K., X. Q. Pham, A. L. Erwin, S. D. Mizoguchi, P. Warrener, M. J.
Hickey, F. S. Brinkman, W. O. Hufnagle, D. J. Kowalik, M. Lagrou, R. L. Garber, L. Goltry, E. Tolentino, S. Westbrock-Wadman, Y. Yuan, L. L. Brody, S. N. Coulter, K. R. Folger, A. Kas, K. Larbig, R. Lim, K. Smith, D. Spencer, G. K. Wong, Z. Wu, I. T. Paulsen, J. Reizer, M. H. Saier, R. E. Hancock, S. Lory, and M. V. Olson. 2000. Complete genome sequence of Pseudomonas aeruginosa PA01, an opportunistic pathogen. Nature 406:959-64.
65. Stover, K. 1999. Presented at the ASM general meeting, Chicago, Illinois. 66. Van Delden, C., and B. H. Iglewski. 1998. Cell-to-cell signaling and
Pseudomonas aeruginosa infections. Emerg Infect Dis 4:551-60. 67. Vandecasteele, S. J., W. E. Peetermans, R. Merckx, and J. Van Eldere. 2001.
Quantification of expression of Staphylococcus epidermidis housekeeping genes with Taqman quantitative PCR during in vitro growth and under different conditions. J Bacteriol 183:7094-101.
68. Videla, H. A., and L. K. Herrera. 2005. Microbiologically influenced corrosion:
looking to the future. Int Microbiol 8:169-80.

22
69. Whiteley, M., M. G. Bangera, R. E. Bumgarner, M. R. Parsek, G. M. Teitzel, S. Lory, and E. P. Greenberg. 2001. Gene expression in Pseudomonas aeruginosa biofilms. Nature 413:860-4.
70. Wilson, R., D. A. Sykes, D. Watson, A. Rutman, G. W. Taylor, and P. J. Cole.
1988. Measurement of Pseudomonas aeruginosa phenazine pigments in sputum and assessment of their contribution to sputum sol toxicity for respiratory epithelium. Infect Immun 56:2515-7.
71. Xu, K. D., M. J. Franklin, C. H. Park, G. A. McFeters, and P. S. Stewart. 2001.
Gene expression and protein levels of the stationary phase sigma factor, RpoS, in continuously-fed Pseudomonas aeruginosa biofilms. FEMS Microbiol Lett 199:67-71.
72. Yildiz, F. H., X. S. Liu, A. Heydorn, and G. K. Schoolnik. 2004. Molecular
analysis of rugosity in a Vibrio cholerae O1 El Tor phase variant. Mol Microbiol 53:497-515.

23
CHAPTER 2
LOCALIZED GENE EXPRESSION IN PSEUDOMONAS AERUGINOSA BIOFILMS
Permission for reproduction pending. Original Publication from Lenz, A. P., K.
Williamson, B. Pitts, P. S. Stewart, and M. J. Franklin. 2008. Localized gene expression in Pseudomonas aeruginosa Biofilms. Appl Environ Microbiol 74:4463-71.
The cryoprocessing of biofilm samples was carried out by Kerry Williamson and Betsey Pitts. Images were taken by Betsey Pitts. The laser capture microdissection microscopy was carried out by Dr. Michael J. Franklin. Statistics were performed under the advice of Jill Finkel. Kate McInnerney and Paula J. Wilderman assisted with the experimental protocols.
Abstract
Gene expression in biofilms is dependent on bacterial responses to the local
environmental conditions. Most techniques for studying bacterial gene expression in
biofilms characterize average values over the entire population. Here, we describe the
use of laser capture microdissection microscopy (LCMM) combined with multiplex
quantitative real time reverse transcriptase polymerase chain reaction (qRT-PCR) to
isolate and quantify RNA transcripts from small groups of cells at spatially resolved sites
within biofilms. The approach was first tested and analytical parameters determined for
Pseudomonas aeruginosa containing an IPTG-inducible gene for the green fluorescent
protein (gfp). The results show that amounts of gfp mRNA were greatest in the top zones
of the biofilms, and that gfp mRNA levels correlated with the zone of active GFP-
fluorescence. The method was then used to quantify transcripts from wild-type P.
aeruginosa biofilms for a housekeeping gene, acpP; the 16S rRNA; and two genes

24
regulated by quorum-sensing, phzA1 and aprA. The results demonstrated that the amount
of acpP mRNA was greatest in the top 30 µm of the biofilm, with little or no mRNA for
this gene at the base of the biofilms. In contrast, 16S rRNA amounts were relatively
uniform throughout biofilm strata. Using this strategy, the RNA amounts of individual
genes are determined, and therefore results are dependent on both gene expression and
the half-life of transcripts. Therefore, the uniform amount of rRNA throughout the
biofilms is likely due to the stability of the rRNA within ribosomes. Levels of aprA
mRNA showed stratification, with the greatest amounts localized to the upper 30 µm
zone. The results demonstrate that mRNA levels for individual genes are not uniformly
distributed throughout biofilms, but may vary by orders of magnitude over small
distances. The LCMM/qRT-PCR technique can be used to resolve and quantify this
RNA variability at high spatial resolution.
Introduction
Bacteria thrive in spatially defined microenvironments, and therefore are exposed
to local environmental conditions that may vary at the micrometer scale (53). When
growing on surfaces in biofilms, bacteria are typically distributed in a heterogeneous
manner. The cell distribution reflects heterogeneities in the properties of the surface and
the concentration gradients of chemicals dissolved in the interstitial fluid within the
biofilm matrix (22, 27, 38, 54). These physical and chemical heterogeneities in the
biofilms promote differences in bacterial enzymatic activities at different regions (25, 61,
64) and influence gene expression in different zones within biofilms (4, 9, 13, 14, 52, 55).

25
Most studies of gene expression by bacteria in biofilms report levels that reflect
the average gene expression over the entire population (2).Techniques are often
insensitive to the diverse range of activities that occur among cells at different locations
within the biofilm, and therefore do not account for the contribution of specific
parameters, such as the role of changing environmental conditions on the regulation of
gene expression (2). However, due to the importance of understanding bacterial activities
in situ, several approaches have been developed to evaluate local gene expression within
biofilms. One approach uses fluorescent reporter genes fused to promoter regions of
interest and epifluorescence microscopy (14, 33, 55, 65). Although useful, this technique
requires prior genetic manipulation of the bacteria and reintroduction of the constructed
strains back into the environment. Expression of the reporter gene may induce
physiological changes in the cells of the constructed strains that do not occur in the wild-
type cell. Thus, this approach precludes the ability to study gene expression in the wild-
type strain in its native state. Fluorescent in situ hybridization (FISH) has been used to
detect specific RNA sequences in bacterial cells in their native assemblages (1, 15, 32).
This approach is most useful for studying high abundance RNAs, such as rRNAs, but less
useful for detecting mRNA transcripts in low abundance. Measurements of cellular
activity may be obtained by combining FISH with microautoradiography or Raman
spectroscopy following uptake of labeled substrates into cellular material (26, 56). To
measure gene expression of cells in biofilms, in situ reverse transcription polymerase
chain reaction (IS-RT-PCR) has been developed to amplify mRNA present in low copy

26
number (29). The approach uses fluorescently labeled probes to detect individual cells
expressing a gene of interest, but is limited by lack of mRNA quantification.
Here, we developed a strategy based on advances in laser capture microdissection
microscopy (LCMM) (7, 16-18, 39, 48, 49) and multiplex quantitative real time reverse
transcriptase PCR (qRT-PCR) (10, 23, 24, 34) for quantitative assessment of any gene
expressed by bacteria in their native environment. The approach allows quantification of
low abundance mRNA transcripts without the need to genetically manipulate the cells or
expose cells to labeled substrates. We used this strategy to study the vertical distribution
of RNA transcripts in Pseudomonas aeruginosa biofilms. In particular, we characterized
the distribution of housekeeping gene, acpP, the 16S rRNA, and two genes regulated by
quorum sensing, phzA1 and aprA. The results demonstrate that RNA abundances for
individual genes are not uniformly distributed throughout biofilms, and that cells in
relatively close proximity to each other may have vast differences in abundances of
individual RNA transcripts.
Materials and Methods
Bacterial Strains and Growth Conditions
P. aeruginosa PAO1 and P. aeruginosa PAO1 (pAB1) were used for these
studies. Plasmid pAB1 allows IPTG-induction of the green fluorescent protein (GFP)
(3). Inocula of P. aeruginosa containing pAB1 were supplemented with 150 µg/ml of
carbenicillin. Two biofilm growth conditions were used: colony biofilms and biofilms
cultivation in drip-flow reactors (61, 64). For colony biofilms, planktonic cultures of P.

27
aeruginosa were incubated overnight at 370C in Luria-Bertani broth (LB) (6). Cultures
were diluted in sterile LB to an optical density of 0.4 (600 nm, 1-cm path length) and 25
µl was used to inoculate sterilized black, polycarbonate membrane filters (13 mm
diameter, 0.2 µm pore size; GE Water & Process Technologies). The filters were placed
on LB agar (Difco Laboratories) and incubated for a total of 52 h at 370C. The
membranes containing the colonies were transferred to fresh LB agar every 12 h. For
IPTG induction of the GFP in strains containing pAB1, membranes were transferred to
LB agar containing 1.0 mM IPTG, and incubated for an additional 4 h.
Biofilms were also cultivated on stainless steel coupons in continuous flow by
using drip flow reactors (64). The reactor consisted of a once flow-through system
containing a medium reservoir, pump, silicon tubing, drip flow chamber, and a waste
container. Biofilm minimal medium (BMM) (42) contained (per liter): 9.0 mM sodium
glutamate, 50 mM glycerol, 0.02 mM MgSO4, 0.15 mM NaH2PO4, 0.34 mM K2HPO4,
145 mM NaCl, 20 µl trace metals, and 1 ml vitamin solution. Trace metal solution
contained (per liter of 0.83 M HCl); 5.0 g CuSO4.5H2O, 5.0 g ZnSO4.7H2O, 5.0 g
FeSO4.7H2O, 2.0 g MnCl2.4H2O. Vitamins solution contained (per liter): 0.5 g thiamine,
1 mg biotin. The pH of the medium was adjusted to 7.0. Prior to inoculation into the
system, each strain was incubated in BMM for 18 h at 37oC. The cultures were
transferred to fresh BMM for 4 h to reach an O.D.600 of 0.2. The inoculum was diluted
20-fold in 0.85% NaCl, and 5 ml was used to inoculate steel coupons for 25 min. BMM
was then pumped through the reactors at 1.2 ml/min for 72 h. Reactors were maintained

28
at 37oC throughout the incubation. For biofilms where induction of the GFP was
necessary, BMM was supplemented with 1.0 mM IPTG for the final 4 h of incubation.
Cryoprocessing of Biofilms
Following incubation, biofilms were cryoembedded by flash freezing the stainless
steel slides containing drip-flow cultivated or colony biofilms on dry ice. Biofilms were
immersed in Tissue-Tek O.C.T. compound (Sakura Finetechnical Co.). Vertical transects
of the biofilms were obtained by sectioning the solidified O.C.T. containing biofilms with
a cryomicrotome. Thin sections (5 µm) vertical transects of the biofilms were placed
onto membrane-coated microscope slides (P.A.L.M. microlaser technologies). The
microscope slides were maintained on dry ice until examination and sampling.
Laser Capture Microdissection Microscopy (LCMM)
LCMM (Zeiss/P.A.L.M. Laser-MicroBeam System) was used to dissect and
capture sections from different regions within the biofilms. Microscope slides containing
the O.C.T.-embedded biofilms were thawed on the microscope stage for 5 sec. The
biofilms were then examined using 10x to 40x objective lenses. Areas of the biofilms
ranging from 500 to 100,000 µm2 were obtained using the laser catapult parameter
(LCP), allowing dissected samples to be catapulted into 40 µl of lysis buffer (0.3 M
sucrose and 0.02 M sodium acetate at pH 4.5) contained in the caps of 0.5 ml
microcentrifuge tubes.

29
RNA Extraction
RNA extraction followed the phenol-chloroform-based protocol of Chomczynski
and Sacchi (11) as modified by Barton et al. (5). The samples, obtained by laser
catapulting in 40 µl lysis buffer, were mixed by inversion with additional buffer (160 µl
of lysis buffer and 200 µl of 2% sodium dodecyl sulfate). An aliquot of luciferase (lucI)
RNA (1.7x10⁴ transcript copies) (Promega) was added as a spike-in control to assay for
RNA loss during sample preparation. Samples were centrifuged for 10 sec, then
transferred to a 1.5 ml microcentrifuge tube containing water-saturated phenol (400 µl),
then heated in a water bath at 650C for 5 min with frequent vortexing. The aqueous layer,
formed after 25 min of centrifugation was extracted with an equal volume of
phenol:chloroform:isoamyl-alcohol (25:24:1) in a heavy Phase-Lock gel tube
(Eppendorf). RNA was precipitated by adding 3 µl of PolyAcryl Carrier (Molecular
Research Center, Inc.), 32 µl of 0.25 µM sodium acetate and 1200 µl of absolute ethanol.
Resuspended RNA was treated with DNase using the Turbo DNA-free kit (Ambion, Inc.)
in 10 µl reactions for 20 min. RNA was diluted to a final volume of 25 µl to reduce
interference from possible PCR inhibitors. Total RNA was quantified using a NanoDrop
fluorescence spectrophotometer (NanoDrop Technologies, Inc) with Molecular Probes
Ribogreen (Invitrogen). All samples were stored at -800C until analysis by qRT-PCR.
Primers and Dual-labeled Probes
PCR primer and dual-labeled probe sequences are shown in Table 1.1. The
primers were designed using the Primer3 Program (41) or with Primer Express software v
2.0 (Applied Biosystems). Primers were assayed for melting temperature, primer dimers,

30
and secondary structure using Mfold (30, 67) and Oligo Analyzer version 3.0 (Integrated
DNA Technologies, Inc.). Primers were purchased from Integrated DNA Technologies.
InVitroTranscription
RNA standards were generated by in vitro transcription (IVT) (19). The gene of
interest was amplified from P. aeruginosa PAO1 genomic DNA by using gene specific
primers containing a T7 promoter (Table 1.1). The PCR products were purified and used
for IVT with the MEGAscript T7 kit (Ambion); which included a DNase treatment
(TURBO DNase for 15 min at 370C). IVT RNA products were purified using the
RNeasy mini kit (QIAGEN), and analyzed by electrophoresis on a RNA Nanochip using
the Bioanalyzer 2100 (Agilent Technologies). RNA standards were quantified using UV
absorption at 260 nm, aliquoted, and stored at -800C.
The copy number of RNA standards was calculated using the following formula:
molecules/µL = (Xg/µL RNA/M.W.)*Avogadro’s constant. Copy numbers per reaction
were assigned to each standard using Rotor Gene software version 6.0 (Corbett
Research). For each standard, the concentration was plotted against the cycle number at
which the fluorescence exceeded the background (CT- threshold cycle). The slope of the
calibration curve was used to determine the reaction efficiency (E) of the CT according to
the equation E = 10[-1/slope] – 1, where an E of 1 indicates an exponential amplification of
the product. The efficiency of serially diluted samples was evaluated to determine assay
sensitivity and to ensure assay compatibility with different probes in the multiplex
reactions.

31
Table 1.1. qRT-PCR Primer and Probe Sequences and labels.
aFAM, 6-carboxyfluorescein; BHQ-1, black hole quencher 1; JOE, carboxy-4 ,5 -dichloro-2 , 7 -dimethoxyfluorescein; and ROX, carboxy-X-rhodamine. bAnnealing temperature for PCR reaction. cPrimer concentrations used in acpP, gfp, and lucI triplex reactions (nM). dPrimer concentrations used in acpP, aprA, and phzA1 triplex reactions (nM). ePrimers sequences used by Matsuda et al. (31). The acquisition step of the 16S rRNA assay was performed at 720C. Quantitative Real Time Reverse Transcriptase PCR (qRT-PCR)
One step qRT-PCR was used for all mRNA quantifications. qRT-PCR reactions
(25 µl) containing 2-3 µl of template RNA were used according to the manufacturer’s
instructions. Three kits were used depending on the type of reaction. QuantiTect Probe

32
RT-PCR and QuantiTect Multiplex RT-PCR NR kits (Qiagen) were used for dual-labeled
probe analysis and multiplex dual-labeled probe analysis. QuantiTect SYBR Green RT-
PCR kit was used for SYBR green labeling analysis.
Primer and probe concentrations were determined by performing the optimization
protocol recommended by the Rotor Gene system (Real time summary, Version 1.7).
Every assay contained negative controls (samples lacking reverse transcriptase or
template), and positive controls (samples with appropriate standards added). Standard
RNA, derived from IVT, and the external spike-in control RNA, lucI, were serially
diluted in 8 µL/mL of PolyAcryl Carrier (Molecular Research Center, Inc.) to
accommodate 101 - 106 molecules per reaction. Cycling parameters were established
according to kit instructions for single probe assays or for multiplex assays (Corbett
Research). Three replicates were used to generate standard curves. Each sample was
assayed in duplicate. Primer specificity (single PCR product) was confirmed by
electrophoresis using a Bioanalyzer 2100 and a DNA 500 chip (Agilent Technologies).
Transcript amounts for acpP, gfp, aprA, phzA1 and lucI were calculated from
calibration curves, with a normalization factor of x/1.7x104, since 1.7x10⁴ lucI RNA
transcripts were added to each sample immediately after laser capture as a spike-in
control. To quantify relative amounts of 16S rRNA, CT values were log transformed
(LT) using the following equation; LT = (amplification- Ct)*1010, where CT and
amplification values were derived from the Rotor Gene software comparative
quantitation analysis (40).

33
Validation of qRT-PCR Efficiency, Linearity and Reproducibility
qRT-PCR efficiencies were calculated from the slope of each calibration curve
run in multiplex reactions. A qRT-PCR efficiency (E) of 1 indicates an exponential
amplification of the product. We observed high efficiency for acpP (0.91), gfp (0.93) and
lucI (1.02) when run in multiplex reactions using dual-labeled probes. Standard curves
for these transcripts exhibited linear responses from 50 to 500,000 transcripts (r2 > 0.98
for each). The efficiencies for multiplex reactions were: aprA (1.04), phzA1 (1.04) and
acpP (0.86), lucI (0.94). These transcripts exhibited linear responses from approximately
300 to 30,000 transcript copies (r2 > 0.96 for each).
SYBR Green based qRT-PCR was used to measure 16S rRNA. This assay had an
efficiency of 0.95 and was linear from 10 and 100,000 transcripts (r2 > 0.99). Inter-
experimental precision was approximately 16%, and intra-sample precision was 11%.
These calculations were based on calculated copies per reaction and their variation from
the mean. We chose to obtain the reproducible measure from calculated copies per
reaction and not from CT values to avoid underestimating the true variability (28).
Statistical Analysis
Since data sets obtained from qRT-PCR do not have uniform distributions, difference
between means were calculated using the two-tailed Mann-Whitney test.

34
Results
GFP Fluorescence Correlates with gfp mRNA Amounts
To quantify RNA levels from small groups of cells from within a larger
surrounding biofilm population, we first developed a system where mRNA transcript
numbers could be determined and compared to a spatially defined phenotypic trait. For
this we used a strain of P. aeruginosa with an IPTG-inducible gene for the green
fluorescent protein (gfp). GFP fluorescence was assayed by microscopy and gfp mRNA
abundance was assayed by LCMM/qRT-PCR. When biofilms of this strain are incubated
for 52 h in the absence of IPTG, then induced with IPTG for the final 4 h of incubation, a
band of green fluorescence is observed at the top 30 µm zone of the biofilm (Fig. 2.1, A)
(8, 61). This fluorescent band is observed whether the IPTG is applied from the bottom
of the biofilm in the colony biofilm format (Fig 2.1, B), or from the liquid medium in drip
flow-cultivated biofilms (Fig. 2.1, A). The LCMM was used to dissect and capture cells
from the top fluorescent layer in the IPTG-induced biofilms, and from the equivalent top
zone of control biofilms not amended with IPTG. The captured dissects ranged from 500
to 48,000 µm2 (Fig. 2.1, B). Figure 2.1, C shows the gfp mRNA copy abundances for 26
samples after normalizing to 60,000 um3 biofilm volume. On average, in IPTG-induced
biofilms, the copy number of gfp mRNA was 250-fold greater than from the biofilm
samples not induced with IPTG (P < 0.001), where no fluorescent zone was observed. Of
the 12 samples taken from biofilms where no IPTG was added, nine had gfp mRNA
levels below the detection limit, indicating little or no expression of this gene in the

35
absence of inducing agent. The other three samples had transcript levels above the
detection limits, but approximately 100-fold less than the IPTG-induced biofilms. Of the
26 samples from the IPTG-induced biofilms, one sample showed no gfp mRNA
transcripts. The lack of gfp mRNA in this sample was not due to sampling error or
mRNA degradation, since the lucI spike-in control was not anomalous and since the
sample contained 16S rRNA (described below).
Fig. 2.1. Localized GFP Fluorescence of (A) Biofilm Cultivated in Drip-flow Reactor, (B) Colony Biofilm. Biofilms were incubated without inducing agent for 72 and 52 h, respectively, then induced with 1 mM IPTG for the final 4 h. (B) The LCMM was used to obtain microdissected samples from regions within the biofilm ranging from 500 to 60,000 µm2. (C) qRT-PCR of gfp mRNA obtained from the top fluorescent zone of the IPTG-induced biofilms (n=26) and from the equivalent top zone of the non-induced biofilms (n=12). Sections were normalized to 60,000 µm3 for comparison. Each point represents an individual measurement. *The points plotted at 101 are below detection limits (+IPTG - 1 sample, -IPTG - 9 samples). A two-tailed Mann-Whitney test between IPTG-induced and non-induced biofilm was used (P<0.01). The LCMM was also used to obtain biofilm sections from the middle (n=7) and bottom (n=13) of the biofilm. #101 indicates below detection (middle, 7 samples; bottom, 6 samples).

36
Stratified gfp Expression in IPTG-induced Biofilms
Since GFP requires oxygen for activity, there is the possibility that it is expressed
throughout the biofilm, but only shows fluorescence in the oxygen-exposed top layer. To
determine if gfp expression, as opposed to GFP activity, is greatest at the top of the
biofilms, LCMM was used to sample the non-fluorescent zones of the IPTG-induced
biofilms. The results show little gfp mRNA amounts in the underlying portions of the
biofilm compared to the top 30 µm fluorescent zone (P < 0.001 top vs. middle or bottom
layers) (Fig. 2.1, C). No gfp expression was observed for any of the samples in the
middle zone, and six samples in the bottom zone had no gfp expression. Some of the
samples in the bottom zones had low amounts of gfp expression, that were approximately
1000-fold less than in the top fluorescent zone. Therefore, in this system, the deeper
biofilm zones are not fluorescent due to low levels of gfp expression, rather than to lack
of GFP activation with oxygen. These results demonstrate that it is possible to use
LCMM and qRT-PCR to quantify RNA amounts of a regulated gene that is not
homogenously distributed throughout a stratified biofilm.
Localized Expression of the Housekeeping Gene acpP
By using multiplex qRT-PCR, it is possible to assay RNA amounts of several
genes simultaneously. In addition to gfp and the lucI spike-in control, we chose to assay
the gene for the acyl carrier protein, acpP, as an internal housekeeping gene control.
AcpP is required for fatty acid biosynthesis, and therefore required for production of new
cell membrane material. Interestingly, acpP mRNA amounts are not uniform throughout

37
these biofilms. In the colony biofilms (Fig. 2.2, A), acpP mRNA abundances reflected
gfp amounts, with the greatest amounts in the top 30 µm zone of the biofilm (P < 0.001
top vs. middle or bottom layers). None of the samples isolated from the middle of the
colony biofilms had acpP mRNA amounts that were above the detection limit by qRT-
PCR. Similarly, most samples from the bottom of the biofilm had acpP mRNA that were
below dection limit. Several of the samples from the bottom of the biofilm had
detectable levels of acpP, but each of these samples had approximately 100-fold less than
the average amounts in the top 30 µm of the biofilm. The results indicate that in these
biofilms, which averaged 200 µm thick, the top 30 µm contain cells with high abundance
of acpP mRNA, suggesting that these cells are likely synthesizing new membrane
material, whereas the deeper portions of the biofilms had much less expression of this
gene.
Fig. 2.2. Stratified Expression of acpP mRNA in Biofilms. qRT-PCR was performed on acpP obtained from the top (n=26 and 21), middle (n=8 and 11) or bottom (n=15 and 18) of colony biofilms and drip flow biofilms. Two-tailed Mann-Whitney test results demonstrated significant differences in acpP expression (P<0.01 for values for the top layer compared to those for the middle or bottom layer). The number of samples below the level of detection are shown as 101 for colony biofilms (top, 1 sample; middle, 8 samples; bottom, 11 samples) and drip flow biofilms (top, 0 samples; middle, 1 sample; bottom, 14 samples).

38
The drip-flow cultivated biofilms also showed greatest acpP abundance in the top
30 µm zone of the biofilm. However, these biofilms had greater variability in mRNA
amounts than the colony biofilms (Fig. 2.2, B). Most samples from the bottom of the
drip-flow biofilm had acpP mRNA levels that were below detection (14 of 18 samples),
and the average abundance of acpP was 100-fold less at the base of the biofilm compared
to the top zone. The middle of the biofilm showed a large range of variability in acpP
mRNA amounts, with an average that was approximately tenfold less than at the top of
the biofilm. The drip flow biofilms have more structural features than the colony
biofilms (as shown in Fig. 2.2 A, B), with increased amounts of water channels and
mushroom-like features. The increased variability observed in Fig. 2.2, B for the middle
of the biofilms likely reflects the proximaty of the dissected sample to adjacent water
channels, which affects nutrient and oxygen availability. The results for acpP for both the
colony biofilms and for the drip-flow biofilms indicate that there is signficant variability
in expression of this housekeeping gene, that is dependent on location of the cells within
a biofilm. The results also demonstrate that acpP may not provide a good internal
housekeeping gene control for normalizing the activity of other genes, since its
expression is not uniform throughout these biofilms.

39
Fig. 2.3. Box Plot of 16S rRNA in Biofilms. Sections from the top (n=10 and 12), middle (n =11 and 8) or bottom (n =12 and 17) biofilm layers from colony biofilms or drip flow biofilms respectively, were analyzed by SYBR Green-based qRT-PCR. CT values were log transformed and adjusted to 60,000 µm3. Line indicates the median; 50% of observations are within the box; bars indicate samples with the minimum and maximum value. Two-tailed Mann-Whitney test for comparisons between top and bottom levels of 16S rRNA in colony biofilms showed no significant differences (P > 0.5). In addition, no significant difference was observed for the different layers of the drip flow biofilms.
Uniform Amounts of 16S rRNA throughout Biofilms
In contrast to the heterogeneous pattern observed for acpP and gfp, the 16S rRNA
amounts were relatively constant in the different biofilm layers (Fig. 2.3). No statistically
significant difference was observed for the 16S rRNA gene product at the top versus the
middle or bottom of the biofilms, cultivated in either the colony biofilm or the drip-flow
biofilm format (P > 0.1 for each analysis). In addition, the average amounts of 16S
rRNA was fairly consistent among all of the biofilms and biofilm zones. Although the
expression of rRNA varies with cell growth (35, 43), the homogenous distribution of 16S
rRNA is likely due to the higher stability of rRNA contained within ribosomes. The
abundance of individual RNAs measured here by qRT-PCR is dependent on both
expression and half-life of the transcript. Whereas the half-life of the acpP and gfp

40
mRNAs is short, the rRNA contained within ribosomes is more stable. These results are
consistent with visual observations of the 16S rRNA using FISH probing, which showed
relatively constant amounts of 16S rRNA throughout a biofilm (63). The results also
suggest that the 16S rRNA may be used as an internal control for comparison of
induction of genes that are differentially regulated through the biofilms. However, rRNA
must be used with caution as an internal control, since the abundance of rRNA is often
much higher than that of any mRNA species.
Stratified Expression of Quorum Sensing-regulated Genes
Bacterial cells within biofilms communicate through small diffusible chemical
signals by quorum sensing (QS) (20, 21, 36, 37). We assayed the localized expression of
two genes, aprA (encoding alkaline protease) and phzA1 (necessary for pyocyanin
biosynthesis) known to be regulated by QS (46, 57), and that have been shown by
proteomics to be upregulated in P. aeruginosa biofilms (42). P. aeruginosa PAO1
biofilms, cultivated in drip flow reactors were cryoembedded and thin-sectioned for
LCMM, then assayed for aprA and phzA1 expression along vertical transects of the
biofilms. Amounts of aprA mRNA showed a similar trend to that observed for gfp and
acpP, with the greatest expression in the outermost 30 µm portion of the biofilm (P <
0.001) (Fig. 2.4, A). Expression of aprA averaged 1000-fold higher than in the bottom of
the biofilms, where most samples had expression that was below detection limit. The
middle of the biofilms had intermediate aprA expression, that averaged approximately
100-fold less than the top of the biofilms. In contrast, phzA1 amounts, although greater at

41
the top of the biofilm, were more uniformly distributed at the different levels (P > 0.1)
(Fig. 2.4, B), possibly due to the lower overall expression of phzA1 compared to aprA.
The 16S rRNA gene product was used as an internal control and showed uniform
amounts throughout these biofilms (P > 0.5). The differences observed between the
expression patterns of aprA and phzA1 demonstrate that factors other than QS, such as
the physiological status of the cells, may also influence expression of genes that are
regulated by QS.
Fig. 2.4. Expression of Quorum-sensing Regulated Genes aprA and phzA1 in P. aeruginosa PAO1 Biofilms that were Cultivated in Drip-flow Reactors. (A) aprA mRNA obtained from the top (n =20), middle (n =11) and bottom (n =17) of biofilms. The mRNA levels in some samples were below the level of detection (top, 1 sample; middle, 4 samples; bottom, 13 samples). (B) phzA1 mRNA from the same samples. The mRNA levels in some samples were below the level of detection (top, 8 samples; middle, 4 samples; bottom, 11 samples). Two-tailed Mann-Whitney test results demonstrated significant differences in aprA expression (P < 0.01 for values for the top layer compared to those for the middle or bottom layer). Two-tailed Mann-Whitney test results demonstrated no significant differences in phzA expression expression (P > 0.1 for values for the top layer compared to those for the middle or bottom layer.
Limits of Detection for Localized mRNA and rRNA Amounts in Biofilms
To determine the range of detection limits for LCMM/qRT-PCR, biofilm samples
were dissected from the top zone of IPTG-induced colony biofilms. The amounts of gfp,

42
acpP, and 16S rRNA were quantified and plotted against sample volume. Since samples
were taken from cryoembedded biofilms, viable cell counts could not be determined.
However, assuming a cell volume of approximately 1 µm3 (51), a 500 µm2 area of a 5µm
thick section contains approximately 2,500 cells. For acpP and gfp, a linear relationship
was observed between the sample volume and the number of mRNA transcripts, ranging
from 1x10³ to 1x105 µm3 (r2 = 0.94 for acpP, r2 = 0.90 for gfp) (Fig. 2.5, A, B).
Therefore, this technique is useful for quantifying mRNA transcripts from approximately
2,000 cells. Similarly, log transformed CT values of 16S rRNA also correlated with
sample size (r2 = 0.90) (Fig. 2.5, C). Due to the higher cellular amounts of 16S rRNA,
the detection limit for rRNA is much less than 1,000 cells.
Fig. 2.5. Limits of Detection for Microdissected Biofilm Samples and for Planktonic Cultures for (A) gfp, (B) acpP, and (C) 16S rRNA. Detection limits were based on biofilm volume using 5 µm thick sections of the top zones of the biofilms. Detection limits for planktonic cells were based on the number of CFU of serially diluted cultures. Dual-labeled probes were used in multiplex reactions for gfp (r2=0.89 biofilm cells and r2=0.99 for planktonic cells), and for acpP (r2=0.94 biofilm cells and r2=0.99 for planktonic cells). Levels of 16S rRNA were measured using the SYBR Green based chemistry of qRT-PCR (r2=0.87 for biofilm cells and r2=0.99 for planktonic cells).

43
The detection limits of qRT-PCR for gfp, acpP, and 16S rRNA were also
determined for exponentially growing planktonic cells, allowing comparison of the
mRNA transcripts with viable cell counts. RNA was extracted from serially diluted
planktonic P. aeruginosa (pAB1) cultures containing from 1 to 109 cells, determined as
colony forming units (CFU) (Fig. 2.5, A, B, C). Linear responses were observed for cell
numbers and mRNA transcripts, gfp (r2 = 0.97) and acpP (r2 = 0.99). A linear response
was also observed for the 16S rRNA (r2 = 0.99). According to the regression analysis,
there are approximately 40 gfp and 900 acpP mRNA transcripts per cell growing in
planktonic culture.
These results allowed comparison of the gene expression levels of exponentially
growing planktonic cells and of cells growing in the top zone of the IPTG-induced colony
biofilms (Fig. 2.5, A, B, C). Planktonic cells had mRNA levels of gfp and acpP per cell
that were higher than the expression in the equivalent volume of the biofilm. RNA
amounts were approximately 40-fold, 250-fold, and 33-fold greater in planktonic cells for
gfp, acpP and 16S rRNA, respectively, than in the top biofilm zone. Therefore, although
mRNA amounts are highest at the top zone of these biofilms, the amounts in biofilms are
less than for exponentially growing planktonic cultures.
Discussion
The goals of this research were twofold; (i) to develop methodology to quantify
bacterial gene expression from small groups of bacterial cells isolated from biofilms,
without prior genetic manipulation of the cells, and (ii) to use the method to determine if

44
local conditions found within biofilms result in spatial variation of bacterial gene
expression. By using cryosectioning of biofilms and LCMM, we were able to isolate and
extract RNA from small groups of bacterial cells isolated from different regions within
biofilms. Multiplex qRT-PCR allowed quantification of gene expression of up to four
genes simultaneously from these small groups of cells.
The approach was validated using an artificially induced tracer gene (gfp), a
housekeeping gene (acpP), an RNA spike-in control (lucI), an internal control (16S
rRNA), and two genes regulated by quorum sensing. For gfp and acpP, the qRT-PCR
approach using dual-labeled probes was sensitive for detecting less than 1,000 mRNA
transcripts. For exponentially growing planktonic cells, where transcripts ranged from
100 to 400 copies per cell (Fig. 2.5, A, B, C), the qRT-PCR approach may be useful for
estimating mRNA abundances from less than 10 cells. At the oxygen interface of these
biofilms, we estimate that the number of transcripts for gfp and acpP is approximately 40
to 250-fold less per cell than for exponentially growing planktonic cells (Fig. 2.5). We
measured expression of these genes for approximately 2,000 biofilm-associated cells.
However, based on the detection limits obtained for planktonic cultures, it should be
possible to investigate gene expression from even smaller numbers of biofilm cells by
using this approach.
The GFP-fluorescent zone of the biofilm correlated with gfp mRNA amounts
(Fig. 2.1, A, B, C). GFP amounts were significantly greater when comparing IPTG-
induced biofilm cultures with non-induced samples, and when comparing the GFP-
fluorescent zone with the non-fluorescent deeper areas of the biofilms. Variation in gfp

45
mRNA at different regions of the biofilms was expected given the localized nature of the
fluorescent zone. Interestingly, a similar active zone of acpP mRNA amounts was also
observed (Fig. 2.2, A, B). Housekeeping genes, such as acpP, often serve as internal
controls in qRT-PCR experiments to normalize expression of regulated genes (45). In
biofilms, gradients of pH, oxygen, nutrients, and waste products are established at
different depths in biofilms (53, 54). These variable environmental factors contribute to
varying metabolic activity of the bacteria. Since the AcpP analyzed in this study is
required for the synthesis of fatty acids and new membrane material, the results suggest
that the cells in the upper 30 µm of these biofilms are likely the most active in membrane
synthesis. The cells in the deeper portions of the biofilm are likely in slow-growth state.
These results are consistent with other studies that indicate that P. aeruginosa cells in
deeper portions of the biofilm are less metabolically active (60). In the prior study,
transmission electron microscopy was used to demonstrate that P. aeruginosa cells
located in the top layer of a biofilm, at the air/biofilm interface, are more susceptible to
antibiotic killing than those in the deeper portions (60), even though the antibiotics
penetrate through biofilms (3, 60, 66). The prior study suggested that the cells in the
deeper portions of the biofilm are more tolerant to the antibiotics, due primarily to their
slow growth rate. The results here, showing localized expression of acpP, further
supports that cells in deeper portions of these P. aeruginosa biofilms are not as
metabolically active as those at the top of the biofilm.
Due to the differential expression of acpP throughout the biofilms, acpP may not
be used as an internal control for normalizing activity of genes differentially expressed in

46
biofilms. Using FISH probing, 16S rRNA showed a fairly uniform distribution in P.
aeruginosa biofilms (63). The qRT-PCR results here confirm those results by
demonstrating little variability in 16S rRNA amounts along vertical layers of the biofilm
(Fig. 2.3, A, B). These results were similar in all conditions tested including, colony
biofilms, drip-flow-cultivated biofilms, as well as biofilms supplemented with IPTG.
Expression of ribosomal RNAs is highly regulated in bacteria (35). 16S rRNA has been
shown to vary according to cellular activity, with slower metabolisms having lower levels
of 16S rRNA (43). Although the top portion of these biofilms may be most active in
membrane biogenesis, the cells at the top of the biofilm are not equivalent in growth to
exponentially growing planktonic cells (Fig. 2.5, A, B, C). The final abundance of rRNA
per cell, as measured here, was approximately 33-fold less for cells at the top of the
biofilm compared to exponentially growing planktonic cells. Reduced growth of these
cells (as indicated by the lower acpP and rRNA amounts) combined with the stability of
rRNA within ribosomes of cells in the deeper protion of the biofilms may explain the
relative uniformity in rRNA abundance throughout the biofilm layers observed here and
in the previous study (63).
The results indicate rRNA may be used as a technical control, for determining if
cell material is captured by the laser catapult method and retained during RNA sample
preparation. However, the abundance of 16s rRNA (which is much higher than any of
the mRNA species tested) is a drawback to using it as an internal control for quantify
relative expression of other genes. In order to identify an appropriate alternative
transcript that combines an average level of abundance with a uniform distribution along

47
the biofilm layers it may be necessary to develop genome wide approaches that look at
global distributions of gene expression throughout subpopulations within the biofilm.
Genes regulated by quorum sensing are responsive to small diffusible molecules,
such as acyl homoserine lactones, whose concentration increase with increasing cell
density (20, 21, 36, 37). Since cells in biofilms are at high density, quorum sensing is
one factor that plays a role during biofilm development (12, 47). Here, we assayed
expression of two genes regulated by QS, and found differences in their expression
patterns. Amounts of aprA mRNA showed stratification and were from 100 to 1000-fold
greater at the top of the drip-flow biofilms, compared to the middle or bottom layers (Fig
4). In contrast, phzAl amounts, although slightly higher at the top of the biofilm, had
more equivalent average amounts throughout the biofilms compared to aprA. The results
demonstrate genes that are regulated by high cell density may show stratification and
heterogeneity of expression in response to growth in biofilm microenvironments. The
results for aprA are in contrast to a previous study using reporter genes to characterize
local expression of other QS-regulated gene, lasI and rhlI (13). The prior studies
demonstrated that the greatest percentage of cells expressing lasI and rhlI were near the
biofilm substratum. Difference between the QS-regulated genes shown here and those in
the prior study are likely due to the difference in biofilm cultivation systems. Whereas
the lasI/rhlI study used flow-through biofilms, we used drip-flow biofilms that resulted in
much thicker biofilms. The thicker biofilms likely resulted in steeper chemical gradients
of oxygen and nutrients (53, 54), thereby possibly reducing the metabolic activity of

48
bacteria in the deeper portions of the biofilms. QS may be affected by cell density, as
well as other factors such as the metabolic status of the cells.
Global proteomic and transcriptomic studies have been performed to characterize
physiological differences of P. aeruginosa growing in biofilms versus cells growing in
planktonic cultures (44, 50, 58, 59, 62). Studies have also compared changes in protein
profiles and gene expression during biofilm developmental processes (44). Those studies
have been useful for identifying genes uniquely expressed in biofilms. Here, we
demonstrate that gene expression differences occur not only between planktonic and
biofilm-associated cells, but also for cells at different locations within biofilms. The
results may help explain some of the differences observed between global transcriptional
and proteomic data. Since proteins in general have a longer half-life than mRNA,
proteomic data would represent the accumulation of protein and cell material in biofilms
up to the time of sampling (i.e. from all layers of the biofilms). However, due to the short
half-life of the mRNA, the transcriptional studies would assay only those genes actively
transcribed at the time of sampling. The results here suggest transcription of individual
genes may vary dramatically in different regions of the biofilms. Combining LCMM and
qRT-PCR will be useful for characterizing the spatial and temporal aspects of these
localized gene expression events.

49
References
1. Amann, R. I. 1995. Fluorescently labelled, rRNA-targeted oligonucleotide probes
in the study of microbial ecology. Mol. Ecol. 4:543-554. 2. An, D., and M. R. Parsek. 2007. The promise and peril of transcriptional profiling
in biofilm communities. Current Opinion in Microbiology 10:292-296. 3. Anderl, J. N., M. J. Franklin, and P. S. Stewart. 2000. Role of antibiotic
penetration limitation in Klebsiella pneumoniae biofilm resistance to ampicillin and ciprofloxacin. Antimicrob Agents Chemother 44:1818-24.
4. Bagge, N., M. Schuster, M. Hentzer, O. Ciofu, M. Givskov, E. P. Greenberg, and
N. Hoiby. 2004. Pseudomonas aeruginosa biofilms exposed to imipenem exhibit changes in global gene expression and beta-lactamase and alginate production. Antimicrob Agents Chemother 48:1175-87.
5. Barton, H. A., Z. Johnson, C. D. Cox, A. I. Vasil, and M. L. Vasil. 1996. Ferric
uptake regulator mutants of Pseudomonas aeruginosa with distinct alterations in the iron-dependent repression of exotoxin A and siderophores in aerobic and microaerobic environments. Mol Microbiol 21:1001-1017.
6. Bertani, L., and G. Bertani. 1970. Preparation and characterization of temperate,
non-inducible bacteriophage P2 (host: Escherichia coli). The Journal of General Virology 2:201-212.
7. Bonner, R. F., M. Emmert-Buck, K. Cole, T. Pohida, R. Chuaqui, S. Goldstein,
and L. A. Liotta. 1997. Laser capture microdissection: molecular analysis of tissue. Science 278:1481,1483.
8. Borriello, G., E. Werner, F. Roe, A. M. Kim, G. D. Ehrlich, and P. S. Stewart.
2004. Oxygen limitation contributes to antibiotic tolerance of Pseudomonas aeruginosa in biofilms. Antimicrob Agents Chemother 48:2659-64.
9. Branda, S. S., J. E. Gonzalez-Pastor, S. Ben-Yehuda, R. Losick, and R. Kolter.
2001. Fruiting body formation by Bacillus subtilis. Proceedings of the National Academy of Sciences 98:11621-11626.
10. Bustin, S. A., V. Benes, T. Nolan, and M. W. Pfaffl. 2005. Quantitative real-time
RT-PCR--a perspective. J Mol Endocrinol 34:597-601.

50
11. Chomczynski, P., and N. Sacchi. 1987. Single-step method of RNA isolation by acid guanidinium thiocyanate-phenol-chloroform extraction. Analytical Biochemistry 162:156-159.
12. Davies, D. G., M. R. Parsek, J. P. Pearson, B. H. Iglewski, J. W. Costerton, and E.
P. Greenberg. 1998. The involvement of cell-to-cell signals in the development of a bacterial biofilm. Science 280:295-298.
13. De Kievit, T. R., R. Gillis, S. Marx, C. Brown, and B. H. Iglewski. 2001.
Quorum-sensing genes in Pseudomonas aeruginosa biofilms: their role and expression patterns. Appl Environ Microbiol 67:1865-73.
14. De Kievit, T. R., M. D. Parkins, R. J. Gillis, R. Srikumar, H. Ceri, K. Poole, B. H.
Iglewski, and D. G. Storey. 2001. Multidrug efflux pumps: expression patterns and contribution to antibiotic resistance in Pseudomonas aeruginosa biofilms. Antimicrob Agents Chemother 45:1761-70.
15. DeLong, E. F., G. S. Wickham, and N. R. Pace. 1989. Phylogenetic stains:
ribosomal RNA-based probes for the identification of single cells. Science 243:1360-3.
16. Emmert-Buck, M. R., R. F. Bonner, P. D. Smith, R. F. Chuaqui, Z. Zhuang, S. R.
Goldstein, R. A. Weiss, and L. A. Liotta. 1996. Laser capture microdissection. Science 274:998-1001.
17. Espina, V., J. D. Wulfkuhle, V. S. Calvert, A. VanMeter, W. Zhou, G. Coukos, D.
H. Geho, E. F. Petricoin, 3rd, and L. A. Liotta. 2006. Laser-capture microdissection. Nat Protoc 1:586-603.
18. Fend, F., M. R. Emmert-Buck, R. Chuaqui, K. Cole, J. Lee, L. A. Liotta, and M.
Raffeld. 1999. Immuno-LCM: laser capture microdissection of immunostained frozen sections for mRNA analysis. Am J Pathol 154:61-6.
19. Fey, S. J., A. Nawrocki, M. R. Larsen, A. Gorg, P. Roepstorff, G. N. Skews, R.
Williams, and P. M. Larsen. 1997. Proteome analysis of Saccharomyces cerevisiae: a methodological outline. Electrophoresis 18:1361-72.
20. Fuqua, C., and E. P. Greenberg. 2002. Listening in on bacteria: acyl-homoserine
lactone signalling. Nat Rev Mol Cell Biol 3:685-95. 21. Fuqua, C., S. C. Winans, and E. P. Greenberg. 1996. Census and consensus in
bacterial ecosystems: the LuxR-LuxI family of quorum-sensing transcriptional regulators. Annu Rev Microbiol 50:727-51.

51
22. Geesey, G. G., R. J. Gillis, R. Avci, D. Daly, M. Hamilton, P. Shope, and G. Harkin. 1996. Influence of surface features on bacterial colonization and subsequent substratum chemical changes on 316L stainless steel. Corr. Sci. 38:73-95.
23. Gibson, U. E., C. A. Heid, and P. M. Williams. 1996. A novel method for real
time quantitative RT-PCR. Genome Res 6:995-1001. 24. Heid, C. A., J. Stevens, K. J. Livak, and P. M. Williams. 1996. Real time
quantitative PCR. Genome Res 6:986-94. 25. Huang, C. T., K. D. Xu, G. A. McFeters, and P. S. Stewart. 1998. Spatial patterns
of alkaline phosphatase expression within bacterial colonies and biofilms in response to phosphate starvation. Appl Environ Microbiol 64:1526-31.
26. Huang, W. E., K. Stoecker, R. Griffiths, L. Newbold, H. Daims, A. S. Whiteley,
and M. Wagner. 2007. Raman-FISH: combining stable-isotope Raman spectroscopy and fluorescence in situ hybridization for the single cell analysis of identity and function. Environ Microbiol 9:1878-89.
27. Lewandowski, Z., and H. Beyenal. 2001. Limiting-current-type microelectrodes
for quantifying mass transport dynamics in biofilms. Methods Enzymol 337:339-59.
28. Livak, K. J., and T. D. Schmittgen. 2001. Analysis of relative gene expression
data using real-time quantitative PCR and the 2-[Delta][Delta]CT Method. Methods 25:402-408.
29. Magnuson, T. S., A. L. Neal, and G. G. Geesey. 2004. Combining in situ reverse
transcriptase polymerase chain reaction, optical microscopy, and X-ray photoelectron spectroscopy to investigate mineral surface-associated microbial activities. Microb. Ecol. 48:578-588.
30. Mathews, D. H., J. Sabina, M. Zuker, and D. H. Turner. 1999. Expanded
sequence dependence of thermodynamic parameters improves prediction of RNA secondary structure. Journal of Molecular Biology 288:911-940.
31. Matsuda, K., H. Tsuji, T. Asahara, Y. Kado, and K. Nomoto. 2007. Sensitive
quantitative detection of commensal bacteria by rRNA-targeted reverse transcription-PCR. Appl Environ Microbiol 73:32-9.
32. Moller, S., A. R. Pedersen, L. K. Poulsen, E. Arvin, and S. Molin. 1996. Activity
and three-dimensional distribution of toluene-degrading Pseudomonas putida in a multispecies biofilm assessed by quantitative in situ hybridization and scanning

52
confocal laser microscopy. Applied and Environmental Microbiology 62:4632-4640.
33. Moller, S., C. Sternberg, J. B. Anderson, B. B. Christensen, J. L. Ramos, M.
Givskov, and S. Molin. 1998. In situ gene expression in mixed-culture biofilms: evidence of metabolic interactions between community members. Appl. Environ. Microbiol. 64:721-732.
34. Nolan, T., R. E. Hands, and S. A. Bustin. 2006. Quantification of mRNA using
real-time RT-PCR. Nat Protoc 1:1559-82. 35. Nomura, M., R. Gourse, and G. Baughman. 1984. Regulation of the synthesis of
ribosomes and ribosomal components. Annual Review of Biochemistry 53:75-117.
36. Passador, L., J. M. Cook, M. J. Gambello, L. Rust, and B. H. Iglewski. 1993.
Expression of Pseudomonas aeruginosa virulence genes requires cell-to-cell communication. Science 260:1127-1130.
37. Pearson, J. P., K. M. Gray, L. Passador, K. D. Tucker, A. Eberhard, B. H.
Iglewski, and E. P. Greenberg. 1994. Structure of the autoinducer required for the expression of Pseudomonas aeruginosa virulence genes. Proc. Natl. Acad. Sci. USA 91:197-201.
38. Rasmussen, K., and Z. Lewandowski. 1998. Microelectrode measurements of
local mass transport rates in heterogeneous biofilms. Biotechnol Bioeng 59:302-9. 39. Roberts, E., L. Charboneau, V. Espina, L. Liotta, E. Petricoin, and K. Dreher.
2004. Application of laser capture microdissection and protein microarray technologies in the molecular analysis of airway injury following pollution particle exposure. J Toxicol Environ Health A 67:851-61.
40. Roussel, Y., A. Harris, M. H. Lee, and M. Wilks. 2007. Novel methods of
quantitative real-time PCR data analysis in a murine Helicobacter pylori vaccine model. Vaccine 25:2919-2929.
41. Rozen, S., and H. Skaletsky. 2000. Primer3 on the WWW for general users and
for biologist programmers. In: Krawetz S and Misener S (eds). Humana Press, Totowa, NJ.
42. Sarkisova, S., M. A. Patrauchan, D. Berglund, D. E. Nivens, and M. J. Franklin.
2005. Calcium-induced virulence factors associated with the extracellular matrix of mucoid Pseudomonas aeruginosa biofilms. J. Bacteriol. 187:4327-4337.

53
43. Sarmientos, P., and M. Cashel. 1983. Carbon starvation and growth rate-dependent regulation of the Escherichia coli ribosomal RNA promoters: differential control of dual promoters. Proc Natl Acad Sci U S A 80:7010-3.
44. Sauer, K., A. K. Camper, G. D. Ehrlich, J. W. Costerton, and D. G. Davies. 2002.
Pseudomonas aeruginosa displays multiple phenotypes during development as a biofilm. J Bacteriol 184:1140-54.
45. Savli, H., A. Karadenizli, F. Kolayli, S. Gundes, U. Ozbek, and H. Vahaboglu.
2003. Expression stability of six housekeeping genes: a proposal for resistance gene quantification studies of Pseudomonas aeruginosa by real-time quantitative RT-PCR. J Med Microbiol 52:403-408.
46. Schuster, M., C. P. Lostroh, T. Ogi, and E. P. Greenberg. 2003. Identification,
timing, and signal specificity of Pseudomonas aeruginosa quorum-controlled genes: a transcriptome analysis. J Bacteriol 185:2066-79.
47. Shrout, J. D., D. L. Chopp, C. L. Just, M. Hentzer, M. Givskov, and M. R. Parsek.
2006. The impact of quorum sensing and swarming motility on Pseudomonas aeruginosa biofilm formation is nutritionally conditional. Mol Microbiol 62:1264-77.
48. Simone, N. L., R. F. Bonner, J. W. Gillespie, M. R. Emmert-Buck, and L. A.
Liotta. 1998. Laser-capture microdissection: opening the microscopic frontier to molecular analysis. Trends Genet 14:272-6.
49. Simone, N. L., C. P. Paweletz, L. Charboneau, E. F. Petricoin, 3rd, and L. A.
Liotta. 2000. Laser capture microdissection: beyond functional genomics to proteomics. Mol Diagn 5:301-7.
50. Southey-Pillig, C. J., D. G. Davies, and K. Sauer. 2005. Characterization of
temporal protein production in Pseudomonas aeruginosa biofilms. J Bacteriol 187:8114-26.
51. Steinberger, R. E., A. R. Allen, H. G. Hansma, and P. A. Holden. 2002.
Elongation correlates with nutrient deprivation in Pseudomonas aeruginosa unsaturated biofilms. Microbial Ecology 43:416-423.
52. Sternberg, C., B. B. Christensen, T. Johansen, A. Toftgaard Nielsen, J. B.
Andersen, M. Givskov, and S. Molin. 1999. Distribution of bacterial growth activity in flow-chamber biofilms. Appl Environ Microbiol 65:4108-17.
53. Stewart, P. S. 2003. Diffusion in biofilms. J Bacteriol 185:1485-91.

54
54. Stewart, P. S., and M. J. Franklin. 2008. Physiological heterogeneity in biofilms. Nat Rev Microbiol 6:199-210.
55. Teal, T. K., D. P. Lies, B. J. Wold, and D. K. Newman. 2006. Spatiometabolic
stratification of Shewanella oneidensis biofilms. Appl Environ Microbiol 72:7324-7330.
56. Wagner, M., P. H. Nielsen, A. Loy, J. L. Nielsen, and H. Daims. 2006. Linking
microbial community structure with function: fluorescence in situ hybridization-microautoradiography and isotope arrays. Curr Opin Biotechnol 17:83-91.
57. Wagner, V. E., D. Bushnell, L. Passador, A. I. Brooks, and B. H. Iglewski. 2003.
Microarray analysis of Pseudomonas aeruginosa quorum-sensing regulons: effects of growth phase and environment. J Bacteriol 185:2080-95.
58. Waite, R. D., A. Paccanaro, A. Papakonstantinopoulou, J. M. Hurst, M. Saqi, E.
Littler, and M. A. Curtis. 2006. Clustering of Pseudomonas aeruginosa transcriptomes from planktonic cultures, developing and mature biofilms reveals distinct expression profiles. BMC Genomics 7:162.
59. Waite, R. D., A. Papakonstantinopoulou, E. Littler, and M. A. Curtis. 2005.
Transcriptome analysis of Pseudomonas aeruginosa growth: comparison of gene expression in planktonic cultures and developing and mature biofilms. J Bacteriol 187:6571-6.
60. Walters, M. C., 3rd, F. Roe, A. Bugnicourt, M. J. Franklin, and P. S. Stewart.
2003. Contributions of antibiotic penetration, oxygen limitation, and low metabolic activity to tolerance of Pseudomonas aeruginosa biofilms to ciprofloxacin and tobramycin. Antimicrob Agents Chemother 47:317-23.
61. Werner, E., F. Roe, A. Bugnicourt, M. J. Franklin, A. Heydorn, S. Molin, B. Pitts,
and P. S. Stewart. 2004. Stratified growth in Pseudomonas aeruginosa biofilms. Appl. Environ. Microbiol. 70:6188-6196.
62. Whiteley, M., M. G. Bangera, R. E. Bumgarner, M. R. Parsek, G. M. Teitzel, S.
Lory, and E. P. Greenberg. 2001. Gene expression in Pseudomonas aeruginosa biofilms. Nature 413:860-4.
63. Xu, K. D., G. A. McFeters, and P. S. Stewart. 2000. Biofilm resistance to
antimicrobial agents. Microbiology 146:547-549. 64. Xu, K. D., P. S. Stewart, F. Xia, C.-T. Huang, and G. A. McFeters. 1998. Spatial
physiological heterogeneity in Pseudomonas aeruginosa biofilm is determined by oxygen availability. Appl. Environ. Microbiol. 64:4035-4039.

55
65. Yarwood, J. M., D. J. Bartels, E. M. Volper, and E. P. Greenberg. 2004. Quorum
sensing in Staphylococcus aureus biofilms. J Bacteriol 186:1838-50. 66. Zheng, Z., and P. S. Stewart. 2002. Penetration of rifampin through
Staphylococcus epidermidis biofilms. Antimicrob Agents Chemother 46:900-903. 67. Zuker, M. 2003. Mfold web server for nucleic acid folding and hybridization
prediction. Nucleic Acids Res 31:3406-15.

56
CHAPTER 3
STRATIFIED GROWTH RATE AND TRANSCRIPTIONAL ACTIVITY IN
PSEUDOMONAS AERUGINOSA BIOFILMS
The cultivation and cryoprocessing of biofilm samples was carried out by Kerry
Williamson. The laser capture microdissection microscopy was carried out by Dr. Michael J. Franklin. Statistics were performed under the advice of Dr. Marty Hamilton. The SYBR Green reagent was kindly provided by Sue Broadaway. Equipment and other resources were kindly shared by Dr. Jim Burrit’s and Dr. Al Jesaitis’ laboratory crews.
Abstract
The generation of gradients from nutrients and waste products, and other localized
environmental conditions along biofilm depths drive a diverse array of cellular activities
within a biofilm. By combining qRT-PCR with laser capture microdissection microscopy
(LCMM) we can target defined regions within a biofilm for gene expression studies. Here
we evaluate the use of 16S rRNA to rDNA ratio of planktonic samples as a predictive
tool in assessing the growth state of cells isolated from discrete regions of a biofilm.
Following the determination of growth rate for biofilm samples, 16s rDNA content per
cell is assigned using the corresponding 16S rDNA content for cells growing
planktonically at such growth rate. Since quantificiation of 16S rDNA can be used to
estimate cell numbers, we additionally have a normalization method for biofilm samples.
We used this normalization strategy to estimate the cellular rpoS, rhlR, and acpP mRNA
and ribosome content in biofilms. We determined that biofilm cells growing at the top
layer (air interphase) have a growth rate that falls between the logarithmic and stationary
57
phase of planktonic cells. In contrast, cells in the deeper portions of the biofilms,
represented by the middle and bottom layers, have a growth rate that is not significantly
different from the growth rate of planktonic cells during stationary phase (P > 0.5). The
cellular rpoS, rhlR, and acpP mRNA and ribosome content was highest in the top layer.
The content was dependant on whether the biofilm was grown in a drip flow reactor or on
a polycarbonate membrane as a colony biofilm. Colony biofilms had 10 to 20 fold more
transcripts than drip flow biofilms, which had an average of 7 transcripts for rpoS, rhlR,
and acpP mRNA at the top layer. Most cells at the bottom and middle layers had less
than one transcript per cell. The average 16S rRNA amount was slightly higher at the top
of the biofilms as compared to the levels found in the other layers. The combination of
qRT-PCR with LCMM and the presently described 16S nucleic acid assays provide a
new methodology and normalization strategy for the study of biofilm physiology and
composition. These methods can now be incorporated to study environmental samples of
medical and ecological relevance.
Introduction
Bacterial biofilms are inhabited by populations of cells that respond differentially
to the heterogeneous conditions formed along the interstitial solution (5, 12, 16, 34).
Since gradients of nutrients, waste products, and signaling compounds are established in
the biofilms (19, 25, 34), the physiological responses of the biofilm-associated bacteria
depend not only on the impinging solution and the nature of the substratum, but also upon
the location of the cells within the biofilm (18). Metabolic activities associated with

58
multispecies biofilm communities generate additional chemical gradients that may
overlap or intersect along the biofilm depths. Therefore, bacteria in biofilms are exposed
to many unique environmental conditions that may not be adequately replicated by cells
growing in planktonic culture.
The chemical gradients formed within biofilms result in heterogeneous levels of
gene expression, and therefore biofilm-associated cells are different from planktonic cells
and from cells in close proximity to other cells (1, 8, 9, 18, 33, 36, 50). When analyzing
physiological responses of biofilms, approaches must be used that can spatially resolve
cellular activities. Quantitative reverse transcriptase real time PCR (qRT-PCR) allows
sensitive quantification of RNA transcripts from very low numbers of cells, possibly
down to the single-cell level. We recently used laser capture microdissection microscopy
(LCMM) in combination with qRT-PCR to isolate subsets of bacterial cells from
biofilms, and analyzed how expression of individual genes was affected by the location
of the cells within the biofilms (18). Those studies demonstrated that mRNA abundances
for individual genes may vary by several orders of magnitude over relatively short
distances within biofilms.
In typical qRT-PCR experiments genes whose expression levels are relatively
uniform over a variety of different growth conditions are used as internal controls to
normalize the expression levels of other genes whose expression is responsive to changes
in conditions (37, 39, 40). It was apparent from our LCMM/qRT-PCR studies, that it
would be difficult to identify an mRNA transcript that could be used as an internal
control, since even a commonly used housekeeping gene, acpP, had vastly different

59
expression levels at different regions in the biofilms (18). Since the differential
expression of acpP may have been due to different growth rates of the cells in the
different biofilm zones, it is likely that other housekeeping genes will also vary in
expression levels. However, the prior studies indicated that 16S rRNA had relatively
uniform abundances throughout P. aeruginosa biofilms cultivated using two different
approaches (18, 49). The relative uniformity of the rRNA was likely due to the non-
optimal growth rate of the most active cells at the biofilm periphery (43), and the stability
of the rRNA within ribosomes of cells in deeper regions of the biofilms (11, 48),
compared to the short half-life of mRNA (26).
Studies directed toward ribosomal RNA, particularly 16S rRNA, have been
particularly useful in environmental microbiology. 16S rRNA is used as a taxonimic
indicator to understand species distribution in populations (10, 44), and as a target for
fluorescent in situ hybridization (FISH) (48). The relative abundances of rRNA in cells
have been assessed using FISH as an indicator of bacterial growth rate in biofilms (4).
Since regulation of rRNA synthesis has been shown to be dependent on the growth status
of cells during planktonic growth (6, 14, 20, 27, 29, 31), we hypothesized that rRNA
levels can also be an useful indicator of the growth states of biofilm associated bacteria.
To test this, we used the rRNA to rDNA ratio obtained from planktonic cells growing at
logarithmic or stationary phase as a predictive tool in the assessment of the growth state
of cells isolated from discrete regions of a biofilm. Furthermore, we evaluated the extent
to which growth rate differences may influence rRNA and mRNA relative abundances in
biofilms. From biofilm associated cells growing at various depths, we quantified the

60
mRNA content of rpoS, rhlR and acpP, and normalized these values to 16S rDNA copies
per cell. Using this approach we corroborated the stratification of growth rates among
cells growing in biofilms, in which highest cellular rRNA and mRNA levels were found
near the air interphase.
Since primers may be directed against rDNA and rRNA for any bacterium or
archaea, this approach is useful for defining the taxonomy and the growth status of
organisms inhabiting multispecies biofilms of medical or environmental importance.
Materials and Methods
Strains and Conditions
P. aeruginosa PAO1 cultures were grown to logarithmic or stationary phase at 37 oC in
Luria-Bertani broth (LB) (2) in an orbital shaker incubator at 220 rpm. Colony biofilms of P.
aeruginosa were inoculated with planktonic cultures grown overnight at 37 oC in LB. Inocula
were adjusted to an optical density of 0.4 by dilution in LB (600 nm; 1-cm path length), and 25
µl was used to inoculate pre-sterilized (by UV treatment), individual, black polycarbonate
membrane filters (13 mm diameter, 0.2 µm pore size; GE Water & Process Technologies)
placed on LB-Miller agar (Difco Laboratories) supplemented with 4.5 g/L of NaCl. Plates were
incubated at 37oC for 72 h, and membranes were transferred to fresh LB-Miller agar every 12 h.
The final transfer was 4 h prior to LCMM analysis. Biofilms were also cultivated on stainless
steel coupons placed in a drip flow reactor under continuous flow of Biofilm minimal medium
(BMM) (49, 30). Prior to inoculation into the system, cells were incubated in BMM for 18 h at
37 oC and transferred to fresh BMM for 4 h to reach an O.D.600 of 0.2. The inoculum was diluted
61
20-fold in BMM, and 5 ml was used to inoculate steel coupons for 25 min under static
conditions. The flow rate at which BMM was pumped through the reactors was set at 1.2 ml/min
for 96 h. Reactors were maintained at 37oC throughout the incubation.
Cryogenic Processing and LCMM
Biofilms were cryoembedded on dry ice using Tissue-Tek O.C.T. compound
(Sakura Finetechnical Co.). The embedded biofilms were thin sectioned (5 µm) using a
cryomicrotome at - 20 oC. Thin sections were placed onto membrane coated microscope
slides (P.A.L.M. Microlaser technologies) and maintained on dry ice until observation
and laser microdissection. Laser capture microdissection microscopy (LCMM) was
performed using the Zeiss/P.A.L.M. Laser-MicroBeam System using the 20x objective
lens. LCMM was used to dissect and capture 24,000 µm2 areas of the biofilm from the
top, middle, and bottom sections of the biofilms.
Nucleic Acids Extraction
Overnight planktonic cultures were grown from frozen stocks of P. aeruginosa
PAO1 at 37 oC in LB in an orbital shaker incubator at 220 rpm for 10 – 12 h. Cultures
were diluted 1:50 in LB and allowed to grow for another 2 h as described above. These
cultures were then diluted to an O.D.600 of 0.3, and 1:100 volume of inoculum was used
for to grow logarithmic phase (grown for 4 h) and stationary phase (grown for 10h)
planktonic cultures. These were serially diluted over four orders of magnitude and 10 µL
of the diluted culture were mixed with 1 mL of TriReagent for the nucleic acid
extractions. Microdissected areas of the biofilms were captured by laser catapult into 30

62
µL of TriReagent TM (Molecular Research Center, Inc.) contained in the caps of
microcentrifuge tubes. Samples obtained by LCMM were added to 0.5 ml of
TriReagent. An aliquot of PolyAcryl carrier (Molecular Research Center, Inc.) 3 µl of
1:10 dilution, was added to each sample. As a spike-in control to account for RNA
degradation and loss, 1.7x10⁴ copies of luciferase RNA (lucI) (Promega, Corp.) was
added to the TriReagent just prior to the extraction. The extraction mix was heated to 65
oC for 5 minutes with occasional vortexing. Samples were cooled prior to adding
bromochloropropane to separate the layers. RNA isolation proceeded as described by the
TriReagent manufacturer. Purified RNA was treated with DNase to remove
contaminating genomic DNA, using the Turbo DNA-free kit (Ambion, Inc.). The
organic layer was maintained on ice until the DNA extraction could be resumed.
PolyAcryl carrier (3 µl of 1:10 dilution) was added to the organic layer to facilitate DNA
precipitation. DNA extraction proceeded according the TriReagent manufacturer’s
instructions. RNA and DNA were stored at -80 oC. For further details regarding these
methods see Pérez-Osorio and Franklin (23).
In vitro Transcription and PCR Standards
To generate standard curves for qRT-PCR and qPCR, target RNA and DNA were
generated by in vitro transcription (IVT) (18) and PCR, respectively. Primers were
designed using Primer3 (28) and were purchased from Integrated DNA Technologies.
For IVT, The forward primer, 5’-
TAATACGACTCACTATAGGGGGTGGTTCAGCAAGTTGGAT-3’ and the reverse
primer, 5’-TAAGGTTCTTCGCGTTGCTT-3’ were used to amplify an internal fragment

63
of the16S rRNA gene. RNA standard for lucI and acpP were generated by IVT using
primers described previously (18). To make the RNA standards necessary to quantify
rpoS, the forward primer, 5’-
TAATACGACTCACTATAGGGTCGACCTGGATCTGACGAA-3’ and the reverse
primer, 5’-TGACCACGATGATGAAGTGC-3’, were used; and to quantify rhlR, the
forward primer, 5’-TAATACGACTCACTATAGGGCTGGATGTTCTTGTGGTGGA -
3’and the reverse primer, 5’-CTGGGCTTCGATTACTACGC-3’ were used. Following
IVT, products were analyzed by electrophoresis using a Bioanalyzer 2100 using an RNA
Nano chip (Agilent Technologies). RNA standards were aliquoted, stored at -80 oC and
quantified using UV absorption at 260 nm prior to each assay. DNA standards were PCR
amplified from genomic P. aeruginosa PA01 DNA using the same primers used for
generating the RNA IVT standards. DNA standard were purified using phenol:chloroform
and analyzed by gel electrophoresis. The DNA standards were aliquoted to small
volumes and stored at -80 oC. DNA standards were quantified using the Rotor-Gene 6000
(Corbett Research) instrument using the PicoGreen nucleic acid quantification kit
(Molecular Probes) prior to each assay. Standard curves were generated by qRT-PCR or
qPCR of serially diluted RNA or DNA in 8 µL/mL of polyacryl carrier (Molecular
Research Center, Inc.) to accommodate 102 - 108 molecules per reaction.
Real Time qRT-PCR
The one step QuantiTect Probe RT-PCR kit (Qiagen) was used to measure 16S
rRNA and lucI mRNA in a duplex 25 µL reaction, using the dual-labeled probe approach
(24). Primers and probes for16S RNA were forward primer, 5’-

64
CAAAACTACTGAGCTAGAGTACG-3’ (20), reverse primer, 5’-
GCCACTGGTGTTCCTTCCTA-3’ and probe, 5’-JOE-
TCTACGCATTTCACCGCTACACAGGA-BHQ1-3’ . Primers and probes for lucI and
acpP were described previously (Lenz, 2008). The QuantiTect SYBR Green RT-PCR kit
was used for SYBR Green labeling analysis of rpoS and rhlR in 25 µL reactions (24).
Primers for rpoS were forward primer, 5’- CGATCATCCGCTTCCGACCAG -3’ and
reverse primer, 5’- CTCCCCGGGCAACTCCAAAAG-3'. Primers for rhlR were forward
primer, 5’- CTCAGGATGATGGCGATTTC-3’ and reverse primer, 5’-
AATTTGCTCAGCGTGCTTTC-3’. Reactions were assembled using a CAS1200 liquid
handling system (Corbett Research).
Final primers and probe concentrations for 16S rRNA and lucI duplex reactions
were: 16S rRNA forward and probe, 100 nM; 16S rRNA reverse, 300 nM; lucI forward
and reverse, 400 nM; and lucI probe, 200nM. The acpP primers and probe were adjusted
to a final concentration of 400 nM each primer and 200 nM, for the probe. All rpoS and
rhlR reactions were performed with primers at a final concentration of 300 nM. We used
the Rotor-Gene 6000 (Corbett Research) instrument for all of our assays. The following
parameters were used for the reactions with dual-labeled probes: hold cycle at 50 °C for
30 minutes; followed by a denaturation step at 95°C for 15 minutes, then 45 cycles at
94°C for 15 seconds and 59°C for 60 seconds. Data were acquired during the 59oC
annealing step. The combined annealing and acquisition step for acpP was 60°C. For
SYBR Green reactions the parameters used were: hold cycle at 50 °C for 30 minutes;
followed by a denaturation step at 95°C for 15 minutes; then 45 cycles at 94°C for 15

65
seconds, 60°C for 30 seconds, 72°C for 30 seconds and an additional step during the
cycling for data acquisition at 84°C for 15 seconds, which allows measurements to be
taken at a temperature where non-specific amplification products do not contribute to the
fluorescence signal. Three technical replicates were performed for each standard, and two
technical replicates were performed for each experimental sample. Primer specificity
was confirmed by electrophoresis using a Bioanalyzer 2100 and a DNA 500 chip
(Agilent Technologies). Reverse transcriptase negative controls, non-template controls
and a mix of appropriate standards (positive controls) were included in each assay.
Transcript copy numbers were calculated for each standard, using the formula,
molecules/µL = (Xg/µL RNA/M.W.)*Avogadro’s constant. Using the Rotor Gene
software version 1.7, Build 75 (Corbett Research), each standard was plotted against the
cycle number at which the fluorescence exceeded the background (CT- threshold cycle).
The slope of the calibration curve was used to determine the reaction efficiency (E) of the
CT according to the equation E = 10[-1/slope] – 1. An E of 1 indicates an exponential
amplification of the product. The slope of the calibration curve was also used to calculate
transcript copies per reaction. Levels of lucI recovered after RNA extraction, were used
to control for samples where significant RNA loss was observed.
qPCR
The QuantiTect Probe PCR kit (Qiagen) was used to measure 16S rDNA levels.
Primer concentrations for 16S rDNA assays were; 100 nM for the forward primer, 300
nM for the reverse primer and 100 nM for the dual-labeled probe. Reactions conditions
were: hold cycle at 95 °C for 15 minutes; followed by 45 cycles of 94°C for 15 seconds

66
and 59°C for 60 seconds. Data were acquired during the 59 oC anneal step. DNA copy
number was determined using the calibration curve generated qPCR of known amounts
of 16S rDNA. Non-template and positive standards were included in every assay as
negative and positive controls, respectively.
Statistical Analysis
To determine if the duplex reactions could be used quantitatively, we evaluated
several aspects of their performance. The linear range of standards had an excellent
correlation coefficient of 0.999 between 1x101 and 1x10⁸ copies of 16S rRNA and
between 1x10² and 7x10⁸ copies of 16S rDNA. The lucI assay was also linear between
1x10² and 1x10⁷ copies (R2= 0.999). Similar linear results were observed in duplex
reactions when the 16S rRNA assay was multiplexed with the lucI. The efficiency for
these assays was 0.94 for the 16S qRT-PCR and qPCR; and 0.99 for both 16S rRNA and
lucI qRT-PCR assays in the duplex reactions. The acpP qRT-PCR assay had a linear
range between 5x101 and 5x10⁵ (R2= 0.999) and an efficiency of 0.94. The evaluation of
the characteristics of the SYBR Green assays indicate a correlation coefficient of above
0.995 between 2x10² and 2x10⁶copies of rpoS and rhlR, and an efficiency of 0.91 for
each one of these assays. The variability within all assays (technical replicates within an
assay) and between replicate assays (technical replicates from separate assays) averaged
5%.
The geometric mean of the 16S rRNA to rDNA ratio of planktonic and biofilm
samples was used in the estimation of 16S rDNA copies per cell in biofilm samples. The
significance of the difference between the median of the 16S rRNA to 16S rDNA ratio

67
from the top, middle and bottom samples from biofilms and from planktonic cells
harvested during stationary and exponential growth was assessed using a Mood’s test
followed by the Fisher’s Exact test; allowing us to determine the appropriate ratio and
16S rDNA copy number per cell to use from planktonic cultures for the estimation of 16S
rDNA copies per cell in biofilm samples. When reporting the average level of expression
of mRNA transcripts the geometric mean of all measurements was used. The significance
of the difference between the medians was calculated using a Mood’s test followed by the
Fisher’s Exact test.
Results
Simultaneous Recovery of DNA and RNA or qRT-PCR and qPCR
To quantify the number of 16S rRNA molecules and 16S rDNA copies present in
a P. aeruginosa cell, we first needed to evaluate an appropriate method to extract both
RNA and DNA from samples with low cell numbers. To this end, we tested the
TriReagent for its effectiveness in the simultaneous isolation of DNA and RNA from
planktonic cultures of P. aeruginosa. Extractions were performed on serially diluted
cultures ranging from 2 x 10³ to 1x10⁸cells, as determined by direct microscopic counts.
The qRT-PCR and qPCR measurements were made quantitatively using a dual-labeled
probe assay for 16S rRNA or 16S rDNA. The 16S rRNA assay was used as a stand alone
assay and as a multiplexed assay where both 16S rRNA levels and the spike-in lucI
control RNA were measured from the same reaction. We used this spike-in control to
check for the possibility of RNA loss during the nucleic acid extraction steps. We found

68
DNA and RNA extractions combined with qPCR and qRT-PCR analyses to be linear
over a range of four orders of magnitude (R2 > 0.93) (Fig. 3.1). In addition, the recovery
of RNA and DNA was effective for simultaneous analysis of RNA and DNA from as few
as 2,000 cells, validating the sensitivity and efficiency of the qRT-PCR and qPCR assays
for use with small samples obtained from biofilms by laser microdissection.
Figure 3.1. Dynamic Range and Sensitivity of qPCR and qRT-PCR from P. aeruginosa Planktonic Cells. RNA and DNA simultaneously obtained from 2 x 10³ to 2 x 10⁸ cells as determined by direct microscopic counts had a linear range that extended from 5 x 10³ to 5 x 10⁸ copies of 16S rRNA (r2 > 0.94), and between 1 x 10² and 1 x 10⁷ copies of 16S rDNA (r2 > 0.97). The results of qRT –PCR and qPCR showed high efficiency (E > 0.97) and high linearity (r2 > 0.99) for all assays. 16S rRNA was isolated from logarithmic phase (●) and stationary phase (▲). 16S rDNA was isolated from logarithmic phase (■) and stationary phase (♦).
Quantification of 16S rRNA and 16S rDNA from Planktonic Cultures and from Biofilms
Bacteria growing in biofilms are often organized into dense communities of cells
that are difficult to quantify. Generally, quantification of cells is performed
computationally, following fluorescently staining and scanning confocal laser

69
microscopy (SCLM), or by biofilm dispersal and microscopic direct counts (DC) or
colony forming unit (CFU) counts. Our goal was to quantify cells from LCMM samples,
so that gene expression could be evaluated on a per cell basis in biofilms. Since CFU and
microscopic counts are not possible on these cryoembedded samples, we chose to use
qPCR as a sensitive approach to measure the number of genome copies per sample,
allowing an estimate of cell numbers. Genome copy number often varies depending on
the growth rate of the bacteria. Therefore, we first measured the number of genome
copies in planktonic cells growing in logarithmic and stationary phase, by qPCR of the
16S rDNA. P. aeruginosa PAO1 has four copies of the 16S rDNA gene, and therefore if
each cell contained one copy of the genome, we predict a copy number of four for the
16S rDNA. Planktonic cells growing in log phase had on average eleven copies of 16S
rDNA per cell (Fig. 3.2), while stationary phase cells averaged seven copies of 16S
rDNA per cell, indicating that log phase cells had between two to three genome copies
per cell, in good agreement with multiple genomic initiation events that occur in rapidly
growing bacteria. Stationary phase cultures had one to two genome copies per cell.
16S rRNA was also measured for planktonic cells growing in log and stationary
phase to determine the ribosome copy number for these cells. In agreement with
previous observations, log phase cells had on average, 7.3x10⁴ copies of 16S rRNA per
cell, as measured by qRT-PCR (Fig. 3.2), while stationary phase cultures had on average
seven-fold less 16S rRNA levels, at 1.2x10⁴ copies per cell (21).

70
Figure 3.2. Quantification of 16S Ribosomal RNA and DNA from Planktonic Cells. The values for rRNA and rDNA from planktonic cells allowed us to estimate the
ribosomal copy number on a per cell basis for bacteria growing at defined locations in
biofilms. Laser microdissection was used to capture subsections of P. aeruginosa
biofilms and qRT-PCR and qPCR experiments were performed to quantify 16S rRNA
and 16S rDNA. For these experiments, colony biofilms were incubated for 72 h at 37oC
with change in medium every 12 h. We also evaluated drip flow biofilms that were
grown for four days. These biofilms reached an average thickness of 400 µm2. Biofilms
were cryoembedded and thin-sectioned to obtain vertical transects (5 µm width). Areas
of 2.4 x 104 µm2 were obtained from the top (air interphase), middle, and bottom of
biofilms (in colony biofilms, this region is in close proximity to the membrane that sits on
top of the substratum and in drip flow biofilms, the bottom was adjacent to the steel
slide). Therefore, the final volume of the samples was approximately 1.2 x 105 µm3.
Using qPCR the 16S rDNA amounts averaged 2 x 10⁵ copies per sample for the top,

71
middle, and bottom of the biofilms (Fig. 3.3), indicating that the cell spacing was
relatively uniform throughout these colony and drip flow biofilms.
Figure 3.3. Quantification of 16s Ribosomal DNA from Biofilms. The LCMM was used to obtain 120,000 µm3 volume biofilms from the top, middle and bottom of colony biofilms (CB) and drip flow biofilms (DFB). 16s rDNA levels were investigated by qPCR.
The average 16S rRNA amounts was slightly higher at the top and midle of
colony biofilms as compared to their bottom portion (Fig. 3.4) (P < 0.05), while in drip
flow biofilms, the ribosomal content along the biofilm is relatively uniform, in agreement
with previous studies (49).
Biofilms are Populations of Cells whose Growth Rate Differ at the Micrometer Scale
To estimate the relative growth status of cells in the different regions of the
biofilm, we compared their rRNA to rDNA ratio with that of planktonic cells in log or
stationary phase (Fig. 3.5). In colony biofilms, cells growing at the top and middle layers
have a 16S rRNA to 16S rDNA ratio that falls between the ratio of log and stationary

72
phase planktonic cells. This observation, suggests that cells at the top or middle of the
biofilm are not replicating as quickly as log-phase planktonic cultures. In contrast, cells
located at the bottom layer of these biofilms have a lower 16S rRNA/rDNA ratio that is
not significantly different from planktonic cells in stationary phase (P > 0.1). The
rRNA/rDNA ratio of cells at the bottom of the biofilm is significantly different from
planktonic cells in log phase (P < 0.05). Therefore, the cells in the deep portion of
colony biofilm are in a stationary-phase-like growth state.
Figure 3.4 . Quantification of 16s Ribosomal RNA from Biofilms. The LCMM was used to obtain 120,000 µm3 volume biofilms from the top, middle and bottom of colony biofilms (CB) and drip flow biofilms (DFB). 16s rRNA levels were investigated by qRT-PCR.
We also examined the growth rates of biofilm cells growing in the drip flow reactor.
These cells receive their nutrients through the top layer or air interphase by a continuous
flow of minimal media. These biofilms are generally more structured with channels and
mushroom like structures (18). The rRNA/rDNA ratio of these cells indicates a growth
rate that is between log and stationary phase in planktonic cultures for all layers. These

73
biofilms also display stratification of their growth rates with cells isolated from the top
growing at a rate that is significantly higher than cells found at the middle and bottom
layers (P < 0.05).
Figure 3.5. 16s rRNA to rDNA ratio used in the estimation of growth rates. The 16s rRNA/rDNA ratio from planktonic cells grown to logarithmic and stationary phase can be compared to the ratio of cells isolated from the top, middle and bottom of colony biofilms and drip flow biofilms to estimate the growth rate of these cells. Differences between logarithmic phase and stationary phase are significant. Cells in the top and middle layer of colony biofilms have a higher growth rate than cells growing at the bottom or during growth as planktonic stationary cells. Cells in the top of drip flow biofilms are characterized by a growth rate that exceeds the growth rate of cells at the middle and bottom layers as well as the growth rate of planktonic stationary cells. All differences were considered significant with a P-value < 0.05. Since we know the 16S rRNA content in planktonic cells at log and stationary
phase we can use these numbers as a basis for comparing biofilm samples that are
growing at analogous growth rates. To determine the number of 16S rDNA copies
present in biofilm samples, we compared the 16S rRNA/rDNA ratio of planktonic cells
growing at log phase to colony biofilm cells growing at the top and middle layer, and to
drip flow biofilm cells growing at the top layer; and calculated that these cells have 6.9
(top CB), 4.7 (middle CB) and 7.6 (top DFB) copies of 16S rDNA per cell. The 16S

74
rRNA/rDNA ratio of stationary phase cells served as an indicator that allowed us to
estimate that in the bottom layer of colony biofilms, cells contain approximately 5 copies
of 16S rDNA, and in the middle and bottom layers of drip flow biofilms, cells contain 8.8
and 8.5 copies of 16S rDNA respectively. These biofilms have cells that contain on
average between one to two chromosomes.
Cells in colony biofilms were found to occupy a volume of 4 µm3 at the top of
these biofilms and at the deeper layers these were more densely packed to about 2 µm3.
This is in agreement with a decrease in cell size that has been observed during stationary
growth. Since colony biofilms grown by Walters et al. appear to be more densely packed
and cells occupy between 1-2 µm3 less volume than our biofilms (43), we speculate that
our DNA extraction may not be 100% efficient in biofilm samples. We do not see this
problem with our planktonic extraction. In drip flow biofilms, we also observe low DNA
yields because our calculations show that each cell occupies approximately 6 µm3. We
expect drip flow biofilms to allow for more spacing between cells since they are more
structured communities that have channels and other structural formations, yet these
observations seem slightly high.
Relative Abundances of mRNA Vary along the Biofilm Strata
Cells isolated from subsections of biofilms using the LCMM technique have been
shown to contain varying concentrations of mRNA depending on the location from which
the samples were obtained (18). Currently there are no known appropriate reference
genes that show little or no variation across the biofilm strata, making this normalization

75
method inappropriate for its use on reverse transcription PCR quantitative studies.
Normalization of mRNA data obtained from these samples can be more easily achieved
by estimating the cell quantities obtained from a biofilm subsection. As we have already
shown, this is possible by simultaneously isolating RNA and DNA from cells and using
the ratio between these two parameters to calculate cell numbers based on known
quantities of rDNA from planktonic cells. By applying this normalization technique to
biofilm samples we were able to determine the expression levels of rpoS, rhlR and acpP
as well as the ribosomal content in each cell.
Figure 3.6. Copies of rpoS mRNA transcripts per cell in biofilms. Copies per cell (Y axis) are approximate numbers calculated as described in the text. Samples were obtained from biofilm sections isolated from the top (T), middle (M) and bottom (B) of colony biofilms and drip flow biofilms. The geometric mean ( ─ ) of the measured mRNA levels is denoted. Below the red line are samples with very low or undetectable levels of mRNA. The significance of the difference between the medians was determined by using a Mood’s median test followed by the Fisher’s Exact test. *** (P < 0.005), ** (P < 0.01), * (P < 0.05).
During stationary phase, the sigma factor RpoS has been shown to regulate genes
that respond to environmental challenges and to induce the production of pathogenic

76
determinants (35). In colony biofilms, the expression of rpoS was localized to the top
layer and the concentration of this transcript in each cell significantly exceeded the levels
present in planktonic cells during the stationary state by 10 fold in a manner that is
consistent with previous observations (Fig. 3.6) (42, 47). This pattern was also observed
in drip flow biofilms, where the cells growing at the top layers bore most of the
expression, with the caveat that expression levels were analogous to the levels observed
in the planktonic cultures. These cells had 5 and 10 transcripts per cell during log and
stationary phase, respectively (not shown).
The transcriptional regulator RhlR coordinates the expression of pathogenic
determinants and a plethora of other genes upon activation through autoinducer signals of
the quorum sensing system. Its expression is density dependent, since quorum sensing
does not occur until the population of cells reaches a threshold density, and it has been
shown that its expression is maximal during the transition from logarithmic phase into
stationary phase in planktonic cultures. In biofilms, expression of rhlR was mostly
detected at the top layer. The top of colony biofilms had 20 times more rhlR transcripts
than planktonic cells, while the middle and bottom layers had cells with little or no rhlR
transcripts (Fig. 3.7). Drip flow biofilms had lower levels of rhlR expression that peaked
at approximately 5 transcripts per cell in the top layers, analogously to the rhlR levels
found in planktonic cells under non inducing conditions (Fig. 3.7 and not shown).

77
Figure 3.7. Copies of rhlR mRNA transcripts per cell in biofilms. See Figure 3.6 for details.
In addition, we measured the concentration of housekeeping gene acpP in cells
collected from drip flow biofilms and found approximately 10 acpP mRNA transcripts
per cell at the top layer, while the other layers did not contain more than one copy of
acpP mRNA (Fig 3.8).
Figure 3.8. Copies of acpP mRNA transcripts per cell in drip flow biofilms. See Figure 3.6 for details.

78
Ribosomal RNA was also quantified using the same methodology from colony
and drip flow biofilms and cellular content was found to vary between the depths
examined, and therefore, form subtle spatial patterns (Fig 3.9). The top of colony
biofilms and drip flow biofilms had between 3x10⁴ and 4x10⁴ copies of 16S rRNA,
respectively. In the middle layer, cells had between 1x10⁴ and 2x10⁴ copies, respectively.
And in the bottom layer, cells from colony biofilms had 6x10³ copies and cells from drip
flow biofilms had on average 2x10⁴ copies.
Figure 3.9. Copies of 16s rRNA per cell in biofilms. See Figure 3.6 for details
Discussion
Chemical gradients in biofilms result in discrete localized microenvironments
(34). Bacteria respond to these local environmental conditions with diverse
transcriptional and enzymatic activities (18, 34). Techniques such as fluorescent in situ
hybridization (FISH) combined with microautoradiography (MAR) have been developed
to localize bacteria and to characterize their enzymatic activities in situ (13, 15, 17, 22,

79
41). In addition, fluorescent reporter genes combined with SCLM have been used to
characterize localized transcriptional activities of the biofilm bacteria (33, 36, 45). With
improvements in the sensitivity of techniques such as qRT-PCR for gene expression
studies, it is now possible to analyze gene expression levels from very small numbers of
bacterial cells isolated from any biofilm. This method offers the advantage of not
requiring prior genetic manipulation to insert reporter genes or the use of in-vitro grown
biofilms. Therefore, it is applicable to study any microbial community, including
multispecies biofilms from anywhere in nature. In a previous study, we combined qRT-
PCR with laser capture microdissection microscopy (LCMM) to study gene expression
(in terms of mRNA abundances) for cells captured from local sites within biofilms (18).
The results of that study indicated that expression levels of genes, including
housekeeping genes, may vary by orders of magnitude over relatively small distance
within biofilms.
Since RNA isolation must be performed quickly to avoid degradation, cell
enumeration is difficult from the LCMM sample. In addition, sharp differences in
housekeeping transcript levels along biofilm strata (18) have created a need to select
appropriate internal controls for normalization of genes in the qRT-PCR studies.
Therefore, the goals of the present study were to: (i) determine if genome copy number
could be used as an estimate of cell numbers from biofilm samples, and (ii) determine if
16S rDNA and/or 16S rRNA could be used to normalize expression of genes responsive
to the local environmental conditions. By generating data on genome copy number and
16S rRNA amounts it was also possible to use the ratio of rRNA to rDNA to estimate the

80
growth status of cells at different regions in the biofilms, as previously done for
planktonic cells (29), and to determine the relative rpoS, rhlR and acpP mRNA copy
number as well as ribosome copy number for cells within biofilms.
We first established that both RNA and DNA can be efficiently extracted from the
same sample containing as few as 2,000 planktonic cells of P. aeruginosa. Secondly, we
evaluated the design of the quantitative assay for the sensitive detection and
quantification of 16S rDNA, 16S rRNA, rpoS, rhlR and acpP. The assays were validated
to have excellent efficiency, a broad dynamic range exceeding four orders of magnitude,
and sensitivity. The uniform distribution of 16S rDNA in different regions of these
biofilms in addition to the increased precision, compared to 16S rRNA levels, suggests
that rDNA may provide the most useful internal control for transcriptional studies of cells
isolated from a biofilm by LCMM. This assumes that the growth rate of the cells in the
biofilms is fairly uniform, and that there are between one and two genome copies per cell.
Normalization by qPCR of 16S rDNA in planktonic cells was similar to normalizing by
DC or CFU counts, with cells growing in log phase having sevenfold more 16S rRNA per
cells than cells in stationary phase. Given that the methods (qPCR, DC, and CFU counts)
of normalization yielded similar results, we conclude that normalization by 16S rDNA is
a reliable option for transcriptional characterization of samples with limited quantities of
cells. The qPCR method offers the advantage that cell cultivation is not required, and
that it is more sensitive than direct microscopic counts (7, 38).
The 16S rRNA assay was developed as a quantitative strategy to validate its
applicability as an internal control. We had previously identified this assay as a plausible

81
normalization option, but only evaluated the results by the use of a comparative approach
(18). Here, the quantitative assay was based on TaqMan chemistry allowing multiplex
assays with the lucI analysis. The quantitative 16S rRNA assay was confirmed to have
excellent characteristics in all aspects of its performance, including sensitivity and
reproducibility (low coefficient of variation between technical replicates and between
assays).
By using these assays, we were able to quantify levels of 16S rDNA and 16S
rRNA from planktonic cells and from biofilm sections. We found that planktonic cells
had between 7 and 11 copies of 16S rRNA representing between one or two and a half
genomes per cell of P. aeruginosa growing at stationary or exponential phase,
respectively.
Although 16S rRNA can be easily detected from samples with limited nucleic
acids due to its high abundance, DNA is a preferred internal control because bacterial
DNA content is constant among cells growing at the same rate. The abundance of DNA
does not pose a problem when normalizing mRNAs whose expression levels are often
several orders of magnitude under the levels found for 16S rRNA (32, 38, 39). We have
demonstrated in the present study that 16S rDNA normalization of biofilm localized gene
expression studies serves as an accurate, sensitive, and feasible alternative that represents
a preferred internal control to other less appropriate alternatives as such as normalization
using 16S rRNA and using housekeeping mRNAs.
We consider important to take into account the growth phase of cells, since
differences in DNA content may introduce bias in RNA to DNA ratios. When we applied

82
16S rDNA normalization to 16S rRNA levels and to rpoS, rhlR and acpP mRNAs
obtained from localized areas within biofilms, we were able to demonstrate that the top
biofilm layer have growth rates that fall between exponential phase and stationary phase.
The middle and bottom layer of these biofilms have a growth rate that resembles a
stationary phase planktonic culture. The difference in rRNA/rDNA ratio between top and
bottom layers is likely not due to differences in cell density nor to uneven distribution of
structural extracellular DNA. The measured mRNA levels of rpoS, rhlR and acpP in
biofilms show stratification between the top, middle and bottom of colony and drip flow
biofilms and indicate that the top layer contains the majority of active cells. Small
differences in 16S rRNA content were observed in these biofilms, where cells growing at
the top had twice as many 16s rRNA copies as cells growing at the middle and bottom
layers.
For studies where global transcriptional activities from biofilms are evaluated, an
approach that involves homogenizing the whole biofilm is often used. Here we show that
results from such studies can be attributed to the cells localized at the air interphase,
where the population of cells that contribute to most of the transcriptional activity can be
found. In addition, the increased concentrations of rpoS and rhlR transcripts in biofilms,
provide further insight into the notion that in biofilms there are cells undergoing a
transition from log to stationary phase (47). Furthermore, the stratification of mRNA
expression along the biofilm, particularly the increased transcriptional levels observed in
cells living near the top of the biofilm serves to identify the cells living near the air

83
interphase as the population of cells that is transitioning from log to stationary phase (46,
47).
Overall, levels of mRNA obtained from P. aeruginosa planktonic cells and from
both biofilm systems appear to be in agreement with a few mRNA copies being produced
by each bacterial cell (3, 39).
The stratification in the overall cellular activity in biofilms provides an adaptation
advantage to cells that exist in a slow metabolic state. These cells are protected from
direct environmental challenges by the cells living in the air interphase of the biofilm,
since outer cells can not only provide a protective barrier to these challenges but can also
attempt to metabolize harmful substances before they penetrate to deeper layers. In
addition, because of their metabolic state, cells living deeper than 30 µm within the
biofilm have assumed a living style that enables their survival upon encountering
stressful conditions, since they are already living under nutrient and oxygen deprivation.
P. aeruginosa cells living in the outer layer of the biofilm may also have their
own physiological strategies to overcome exposure to certain challenges. We show that
these cells have an increased level of rpoS and rhlR; both of which are important
transcriptional regulators. This opens the possibility that these cells may also have
increased transcriptional activities of pathogenic determinants known to be regulated by
rpoS and rhlR such as alginate, exotoxin A and elastase (35).
Transcriptional studies provide invaluable insights to our understanding of
biofilm heterogeneity. Biofilms grow in many different environmental settings and may
display several phenotypic traits depending on the conditions that allow them to grow.

84
Therefore, to enhance our understanding of biofilm physiology and its relevance to
biofilm associated infection processes, biocontrol, or bioremediation, it is important to
emulate the conditions in which the biofilm is found in its original form. The use of
LCMM in combination with qRT-PCR provides an alternative to growing in-vitro
biofilms, allowing us to investigate the contribution of any environment to biofilm
architecture and growth patterns as we are now able to study gene expression in biofilms
directly isolated from environmental sources.

85
References
1. Bagge, N., M. Schuster, M. Hentzer, O. Ciofu, M. Givskov, E. P. Greenberg, and N. Hoiby. 2004. Pseudomonas aeruginosa biofilms exposed to imipenem exhibit changes in global gene expression and beta-lactamase and alginate production. Antimicrob Agents Chemother 48:1175-87.
2. Bertani, L., and G. Bertani. 1970. Preparation and characterization of temperate,
non-inducible bacteriophage P2 (host: Escherichia coli). The Journal of General Virology 2:201-212.
3. Bon, M., S. J. McGowan, and P. R. Cook. 2006. Many expressed genes in
bacteria and yeast are transcribed only once per cell cycle. Faseb J 20:1721-3. 4. Boye, M., T. Ahl, and S. Molin. 1995. Application of a strain-specific rRNA
oligonucleotide probe targeting Pseudomonas fluorescens Ag1 in a mesocosm study of bacterial release into the environment. Appl Environ Microbiol 61:1384-90.
5. Bradshaw, D. J., P. D. Marsh, K. M. Schilling, and D. Cummins. 1996. A
modified chemostat system to study the ecology of oral biofilms. J Appl Bacteriol 80:124-30.
6. Condon, C., C. Squires, and C. L. Squires. 1995. Control of rRNA transcription in
Escherichia coli. Microbiol Rev 59:623-45. 7. Dalwai, F., D. A. Spratt, and J. Pratten. 2007. Use of quantitative PCR and culture
methods to characterize ecological flux in bacterial biofilms. J Clin Microbiol 45:3072-6.
8. De Kievit, T. R., R. Gillis, S. Marx, C. Brown, and B. H. Iglewski. 2001.
Quorum-sensing genes in Pseudomonas aeruginosa biofilms: their role and expression patterns. Appl Environ Microbiol 67:1865-73.
9. De Kievit, T. R., M. D. Parkins, R. J. Gillis, R. Srikumar, H. Ceri, K. Poole, B. H.
Iglewski, and D. G. Storey. 2001. Multidrug efflux pumps: expression patterns and contribution to antibiotic resistance in Pseudomonas aeruginosa biofilms. Antimicrob Agents Chemother 45:1761-70.
10. DeLong, E. F., G. S. Wickham, and N. R. Pace. 1989. Phylogenetic stains:
ribosomal RNA-based probes for the identification of single cells. Science 243:1360-3.

86
11. Deutscher, M. P. 2003. Degradation of stable RNA in bacteria. J Biol Chem 278:45041-4.
12. Gilbert, P., D. J. Evans, and M. R. Brown. 1993. Formation and dispersal of
bacterial biofilms in vivo and in situ. J Appl Bacteriol 74 Suppl:67S-78S. 13. Ito, T., J. L. Nielsen, S. Okabe, Y. Watanabe, and P. H. Nielsen. 2002.
Phylogenetic identification and substrate uptake patterns of sulfate-reducing bacteria inhabiting an oxic-anoxic sewer biofilm determined by combining microautoradiography and fluorescent in situ hybridization. Appl Environ Microbiol 68:356-64.
14. Kemp, P. F., S. Lee, and J. Laroche. 1993. Estimating the Growth Rate of Slowly
Growing Marine Bacteria from RNA Content. Appl Environ Microbiol 59:2594-2601.
15. Kindaichi, T., T. Ito, and S. Okabe. 2004. Ecophysiological interaction between
nitrifying bacteria and heterotrophic bacteria in autotrophic nitrifying biofilms as determined by microautoradiography-fluorescence in situ hybridization. Appl Environ Microbiol 70:1641-50.
16. Larsen, T., and N. E. Fiehn. 1996. Resistance of Streptococcus sanguis biofilms to
antimicrobial agents. Apmis 104:280-4. 17. Lee, N., P. H. Nielsen, K. H. Andreasen, S. Juretschko, J. L. Nielsen, K. H.
Schleifer, and M. Wagner. 1999. Combination of fluorescent in situ hybridization and microautoradiography-a new tool for structure-function analyses in microbial ecology. Appl Environ Microbiol 65:1289-97.
18. Lenz, A. P., K. Williamson, B. Pitts, P. S. Stewart, and M. J. Franklin. 2008.
Localized gene expression in Pseudomonas aeruginosa Biofilms. Appl Environ Microbiol 74:4463-71
19. Lewandowski, Z., and H. Beyenal. 2001. Limiting-current-type microelectrodes
for quantifying mass transport dynamics in biofilms. Methods Enzymol 337:339-59.
20. Matsuda, K., H. Tsuji, T. Asahara, Y. Kado, and K. Nomoto. 2006. Sensitive
Quantitative Detection of Commensal Bacteria by rRNA-targeted Reverse Transcription (RT)-PCR. Appl Environ Microbiol:AEM.01224-06.
21. Nomura, M., R. Gourse, and G. Baughman. 1984. Regulation of the synthesis of
ribosomes and ribosomal components. Annu Rev Biochem 53:75-117.

87
22. Ouverney, C. C., and J. A. Fuhrman. 1999. Combined microautoradiography-16S rRNA probe technique for determination of radioisotope uptake by specific microbial cell types in situ. Appl Environ Microbiol 65:1746-52.
23. Perez-Osorio, A. C., and M. J. Franklin. 2008. qRT-PCR of Microbial Biofilms.
Cold Spring Harb. Protoc. 2008:pdb.prot5066-. 24 Perez-Osorio, A. C., and M. J. Franklin. 2008. Isolation of RNA and DNA from
Biofilm Samples Obtained by Laser Capture Microdissection Microscopy. Cold Spring Harb. Protoc. 2008:pdb.prot5065-.
25. Rasmussen, K., and Z. Lewandowski. 1998. Microelectrode measurements of
local mass transport rates in heterogeneous biofilms. Biotechnol Bioeng 59:302-9. 26. Rauhut, R., and G. Klug. 1999. mRNA degradation in bacteria. FEMS Microbiol
Rev 23:353-70. 27. Reznikoff, W. S., D. A. Siegele, D. W. Cowing, and C. A. Gross. 1985. The
regulation of transcription initiation in bacteria. Annu Rev Genet 19:355-87. 28. Rozen, S., and H. Skaletsky. 2000. Primer3 on the WWW for general users and
for biologist programmers. Methods in Molecular Biology 132:365-386. 29. Sabersheikh, S., and N. A. Saunders. 2004. Quantification of virulence-associated
gene transcripts in epidemic methicillin resistant Staphylococcus aureus by real-time PCR. Mol Cell Probes 18:23-31.
30. Sarkisova, S., M. A. Patrauchan, D. Berglund, D. E. Nivens, and M. J. Franklin.
2005. Calcium-induced virulence factors associated with the extracellular matrix of mucoid Pseudomonas aeruginosa biofilms. J. Bacteriol. 187:4327-4337.
31. Sarmientos, P., and M. Cashel. 1983. Carbon starvation and growth rate-
dependent regulation of the Escherichia coli ribosomal RNA promoters: differential control of dual promoters. Proc Natl Acad Sci U S A 80:7010-3.
32. Schwartz, T., S. Walter, S. M. Marten, F. Kirschhofer, M. Nusser, and U. Obst.
2007. Use of quantitative real-time RT-PCR to analyse the expression of some quorum-sensing regulated genes in Pseudomonas aeruginosa. Anal Bioanal Chem 387:513-21.
33. Sternberg, C., B. B. Christensen, T. Johansen, A. Toftgaard Nielsen, J. B.
Andersen, M. Givskov, and S. Molin. 1999. Distribution of bacterial growth activity in flow-chamber biofilms. Appl Environ Microbiol 65:4108-17.

88
34. Stewart, P. S., and M. J. Franklin. 2008. Physiological heterogeneity in biofilms. Nat Rev Microbiol 6:199-210.
35. Suh, S. J., L. Silo-Suh, D. E. Woods, D. J. Hassett, S. E. West, and D. E. Ohman.
1999. Effect of rpoS mutation on the stress response and expression of virulence factors in Pseudomonas aeruginosa. J Bacteriol 181:3890-7.
36. Teal, T. K., D. P. Lies, B. J. Wold, and D. K. Newman. 2006. Spatiometabolic
Stratification of Shewanella oneidensis Biofilms. Applied and Environmental Microbiology 72:7324-7330.
37. Thellin, O., W. Zorzi, B. Lakaye, B. De Borman, B. Coumans, G. Hennen, T.
Grisar, A. Igout, and E. Heinen. 1999. Housekeeping genes as internal standards: use and limits. J Biotechnol 75:291-5.
38. Vandecasteele, S. J., W. E. Peetermans, A. Carbonez, and J. Van Eldere. 2004.
Metabolic activity of Staphylococcus epidermidis is high during initial and low during late experimental foreign-body infection. J Bacteriol 186:2236-9.
39. Vandecasteele, S. J., W. E. Peetermans, R. Merckx, and J. Van Eldere. 2001.
Quantification of expression of Staphylococcus epidermidis housekeeping genes with Taqman quantitative PCR during in vitro growth and under different conditions. J Bacteriol 183:7094-101.
40. Vandesompele, J., K. De Preter, F. Pattyn, B. Poppe, N. Van Roy, A. De Paepe,
and F. Speleman. 2002. Accurate normalization of real-time quantitative RT-PCR data by geometric averaging of multiple internal control genes. Genome Biol 3:RESEARCH0034.
41. Wagner, M., P. H. Nielsen, A. Loy, J. L. Nielsen, and H. Daims. 2006. Linking
microbial community structure with function: fluorescence in situ hybridization-microautoradiography and isotope arrays. Curr Opin Biotechnol 17:83-91.
42. Waite, R. D., A. Paccanaro, A. Papakonstantinopoulou, J. M. Hurst, M. Saqi, E.
Littler, and M. A. Curtis. 2006. Clustering of Pseudomonas aeruginosa transcriptomes from planktonic cultures, developing and mature biofilms reveals distinct expression profiles. BMC Genomics 7:162.
43. Walters, M. C., 3rd, F. Roe, A. Bugnicourt, M. J. Franklin, and P. S. Stewart.
2003. Contributions of antibiotic penetration, oxygen limitation, and low metabolic activity to tolerance of Pseudomonas aeruginosa biofilms to ciprofloxacin and tobramycin. Antimicrob Agents Chemother 47:317-23.

89
44. Ward, D. M., M. J. Ferris, S. C. Nold, and M. M. Bateson. 1998. A natural view of microbial biodiversity within hot spring cyanobacterial mat communities. Microbiol Mol Biol Rev 62:1353-70.
45. Werner, E., F. Roe, A. Bugnicourt, M. J. Franklin, A. Heydorn, S. Molin, B. Pitts,
and P. S. Stewart. 2004. Stratified growth in Pseudomonas aeruginosa biofilms. Applied and Environmental Microbiology 70:in press.
46. Whiteley, M., M. R. Parsek, and E. P. Greenberg. 2000. Regulation of quorum
sensing by RpoS in Pseudomonas aeruginosa. J Bacteriol 182:4356-60. 47. Xu, K. D., M. J. Franklin, C. H. Park, G. A. McFeters, and P. S. Stewart. 2001.
Gene expression and protein levels of the stationary phase sigma factor, RpoS, in continuously-fed Pseudomonas aeruginosa biofilms. FEMS Microbiol Lett 199:67-71.
48. Xu, K. D., G. A. McFeters, and P. S. Stewart. 2000. Biofilm resistance to
antimicrobial agents. Microbiology 146:547-549. 49. Xu, K. D., P. S. Stewart, F. Xia, C.-T. Huang, and G. A. McFeters. 1998. Spatial
physiological heterogeneity in Pseudomonas aeruginosa biofilm is determined by oxygen availability. Applied and Environmental Microbiology 64:4035-4039.
50. Yang, L., K. B. Barken, M. E. Skindersoe, A. B. Christensen, M. Givskov, and T.
Tolker-Nielsen. 2007. Effects of iron on DNA release and biofilm development by Pseudomonas aeruginosa. Microbiology 153:1318-28.

90
CHAPTER 4
RESPONSES TO CALCIUM IN DEVELOPING PSEUDOMONAS AERUGINOSA
BIOFILMS: A GENE EXPRESSION SURVEY
The hybridization of microarrays and microarray data processing were carried
in part by Kate McInnerney.
Abstract Pseudomonas aeruginosa is an opportunistic pathogen able to form biofilms
on pulmonary tissue of cystic fibrosis patients. These biofilm-associated bacteria are
characterized by their ability to secrete a wide array of virulence factors that inhibit
the immune response and contribute to the chronic nature of the pulmonary
infections. Calcium concentration influences virulence-factor production including
enzymes and toxins secreted by the Type II and III secretion systems. Here, we used
microarrays to identify factors expressed during biofilm-associated growth at low (0
mM) and high (10 mM) Ca2+ concentrations. The results were then compared to
planktonically-cultivated cells. We identified genes for exotoxins ExoS, ExoT, and
ExoY, as having increased expression during early biofilm formation. Quantitative
RT-PCR was used to verify the expression of these genes in continuous-flow biofilms
over time. At low [Ca2+], the expression of exoS and exoT showed a tenfold increase
in biofilms during the first day of growth as compared to planktonic cells; exoY had
100-fold increased expression. As the biofilms developed the expression of these
genes decreased and by the third day of growth had similar expression levels to

91
planktonic cells. When the biofilms were exposed to calcium, exotoxin expression in
biofilms had levels comparable to that of planktonic cells. The results suggest that
biofilm matrix material may chelate available calcium, causing increased expression
of exotoxin genes during the early stages of biofilm development. The lipoxygenase
encoding gene loxA and the exotoxin A gene were also found to be expressed
significantly higher in these biofilms as compared to planktonic cells. Therefore,
temporal and spatial factors as well as secretion of exotoxins and lipoxygenase may
all take part in the lack of effectiveness seen by neutrophils and other immune
responses in the clearing of P. aeruginosa PAO1 biofilms associated with lung
infections.
Introduction
Pseudomonas aeruginosa is an opportunistic pathogen able to form biofilms
on pulmonary tissue of cystic fibrosis (CF) patients (18, 27). These biofilm-associated
bacteria are characterized by their ability to secrete a wide array of virulence factors
that inhibit immune responses and contribute to the chronic nature of the pulmonary
infections (4, 26). An important factor regarding the CF lung environment is the
abnormal chloride transport in and out of upper respiratory tract epithelium (15, 18).
The defective cystic fibrosis transmembrane regulator (CFTR) induces a thickening
of lung epithelial secretions, which in turn provide an enriched environment suitable
for microbial growth. The CFTR defect also affects available ion concentrations,
including calcium ions, in the extracellular environment of the lung (8, 13). Models

92
using planktonic P. aeruginosa have demonstrated that calcium can influence
virulence factor production, including enzymes and toxins secreted by the Type II and
III secretion systems (21, 24, 20, 33). The Type III secretion system (T3SS) operates
by using a syringe-like structure that is activated by the host cell in a contact-
dependent manner. Upon activation, the T3SS “injects” its effectors directly into the
host cell cytosol (7). The T3SS-secreted toxins, ExoS, ExoT and ExoY can inactivate
host cell function by disturbing the cytoskeleton of the cell, and by inducing
inflammatory and apoptotic pathways that ultimately result in host cell death (7, 9,
15, 16, 28, 32, 33). Since the T3SS-toxins inhibit cytoskeletal remodeling, they are
likely involved in the lack of neutrophil polarity observed in previous studies (12).
A secretable 15-lipoxygenase (LO) was characterized in P. aeruginosa. It is
encoded by the loxA (PA1169) gene, which is homologous to other LOs found in
eukaryotes (29). LOs are important mediators of the immune response; some LOs
participate in the catalysis of lipoxin precursors while others catalyze the conversion
of arachidonate into leukotrienes (1, 29). Lipoxins can stop the action of neutrophils
as well as promote the resolution of inflammation, whereas leukotrienes are often
involved in the pro-inflammatory response (1, 29). LoxA, specifically, produces an
active enzyme able to catalyze the conversion of arachidonate to lipoxin precursors
(29). Since some P. aeruginosa infections have an altered inflammatory response and
the predominant infections in these patients are biofilm associated; it is of interest to
study the activity of lipoxygenases during biofilm development and their role as
modulators of the immune response.

93
Studies have shown that bacteria growing in biofilms are physiologically
different from the same cells growing in planktonic culture (21). Proteomic analyses
have demonstrated that as much as 50% of the P. aeruginosa proteome differs
between planktonic cells and biofilm cells (21). Using microarray analysis and
quantitative real-time PCR, we show that P. aeruginosa exotoxins as well as exotoxin
A are upregulated in the early stages of biofilm development. The activation of the
transcription of exoS, exoT and exoY appears to diminish as the biofilm matures and
by the third day of growth, the expression of these genes returns to planktonic like
levels. This series of events follow previously described patterns of T3SS activity in
CF patients with P. aeruginosa lung infections, in which microbial isolates fail to
produce T3SS effectors during chronic infections, while being readily detected in
patients with acute infections (3, 11). Secondly, through the present study we identify
a 10-fold increased expression of PA1169 in P. aeruginosa biofilms. Identifying for
the first time a condition where PA1169 may be actively translated. Biofilm growth is
an important hallmark of P. aeruginosa infections. Therefore, characterization of the
programmed activities used by this microorganism during the initial stages of biofilm
formation may lead to a better understanding of the molecular events involved in the
establishment of acute and/or chronic infections and provide new alternatives for
prevention and early treatment.

94
Materials and Methods Strains and Conditions
P. aeruginosa PA01 strain was grown in biofilm minimal medium (BMM)
(24). When used, CaCl2 • 2H2O was added to a final concentration of 10.0 mM.
Biofilms harvested for microarray analysis were grown on the walls of silicone tubing
(0.3 m length, size 18 tubing with interior volume of 15 ml), following details
outlined by Sauer et al. (25). The tubing biofilms were maintained inside a 37 oC
incubator for 24 hours. Biofilms harvested for qRT-PCR experiments were grown on
glass slides in a drip flow reactor placed inside a 37 oC incubator. Cultures for both
biofilm systems were first grown for 18 hours in BMM, diluted 1:100 and allowed to
reach an approximate OD600 of 0.2 after four hours at 37 oC, shaking in an orbital
shaker incubator set at 220 rpm. Inocula were diluted to an OD600 of 0.02, and either 5
ml or 12 ml aliquots were transferred to each chamber of the drip-flow reactor or
tubing biofilm, respectively. Cells were allowed to attach for 25 minutes before
resuming the flow. Following inoculation, sterile BMM was pumped through the
tubing at a rate of 1.5 ml/min. Drip flow biofilms were grown for 24 hours intervals
for up to five days. Planktonic cultures were diluted 1:100 from a culture grown for
22 hours and allowed to grow for 18 additional hours in an orbital shaker incubator
set at 37 oC. Subsequently, another 1:100 dilution was used to inoculate cultures that
were allowed to reach early logarithmic (EL), mid logarithmic (ML), late logarithmic
(LL) and stationary (SS) growth phases. Criteria used to determine each of these
growth phases was approximately 4 hours of growth and an OD600 < 0.1 for EL, 6

95
hours of growth and an OD600 at around 0.3 for ML, 8 hours of growth and an OD600
at or below 0.4 for LL, and a 24 hour culture with an OD600 > 0.4.
RNA Extraction
Biofilms grown in the silicone tubing were harvested either by slicing open
the biofilm containing section and scraping the biomass or by using a 3 ml syringe
plunger adjusted to a 1 ml glass pipette to push the biomass out of the interior of the
tubing. Biofilms from the drip-flow reactors were scraped off the glass slides. The
biomass was directly deposited into lysis buffer (0.3 M sucrose, 0.02 M Na acetate,
pH 4.5) and subsequently mixed with 2 % SDS 1:1. Planktonic cultures were
centrifuged for 10 min at 7,000 g at 4 oC to pellet the cells prior to resuspending in
lysis buffer and mixing with 2 % SDS 1:1. RNA was extracted by further mixing the
lysis buffer and SDS solution with an equal volume of water saturated phenol and
heated for 5 min at 65 oC. RNA was precipitated from the aqueous layer formed after
centrifugation using a final concentration of 0.25 M sodium acetate and 3 volumes of
ethanol. Precipitation was carried out at -80 oC for 18 hours. Total RNA was treated
with DNase I (Invitrogen, Corp.) to remove contaminating genomic DNA and further
purified using an RNeasy mini kit (Qiagen). RNA was assessed for quality on a
Bioanalyzer RNA chip (Agilent).
Microarray Analysis
RNA from cultures grown under low and high calcium conditions from 24
hours old tubing biofilms or from stationary phase planktonic cultures was obtained.

96
10 µg of total RNA were used for cDNA synthesis. Two biological replicate assays
were used to represent each condition. In vitro transcribed sequences corresponding
to the Bacillus Subtilis genes dap, thr, phe, lys and trp were used as spike in controls
and added to the cDNA synthesis reaction. cDNA was purified, fragmented and biotin
labeled following Affymetrix recommendations (Affymetrix, Inc.). cDNA was
hybridized to Affymetrix P. aeruginosa Gene Chip genome, midi format, for 16
hours. Washing, staining and scanning were done with Affymetrix fluidic station and
the Affymetrix GeneChip Scanner 3000. All arrays had hybridization to over 80 % of
the genes represented. Spot intensities were normalized by GC-RMA and by genes to
median normalization using GeneSpring 7.1 (Silicon Genetics). A two-way ANOVA
test was used to determine the significance of the difference between the means of the
genes at the fifth percentile level (P < 0.05). Clustering analysis was done using the
MultiExperimentViewer: MeV.
Quantitation of mRNA by Realtime Reverse-Transcription PCR
Messenger RNA measurements were performed with a QuantiTect Sybr
Green RT-PCR Kit (Qiagen) or with the iScript™ cDNA Kit together with the iQ™
SYBR Green SuperMix (Bio-Rad) using a Rotor Gene 3000 (Corbett Research).
Aliquots of 2-4 µl representing 100 ng of total RNA were used for qRT-PCR assays.
Primer sequences outlined in Table 4.1 were used at a final concentration of 0.5 µM.
Reverse transcriptase negative controls and non-template controls were included in
every assay. Positive controls were included in some assays and consisted of in vitro

97
transcribed RNA transcripts specific for acpP, exoS, exoT, exoY, and PA1169. These
transcripts were prepared using Ambion’s Megascript T7 Kit (Applied Biosystems).
Ten-fold serial dilutions of positive controls ranging from 2 to 20,000 approximate
copies were used as standards to determine qRT-PCR calibration curves. Cycling
conditions used were: hold cycle at 50 °C for 30 minutes; followed by a denaturation
step at 95°C for 15 minutes; then 45 cycles at 94°C for 15 seconds, 60°C for 30
seconds, 72°C for 30 seconds. The specificity of the primers was checked during an
additional cycling step where the temperature was increased gradually between 72 oC
and 99 oC to obtain a melting curve for each amplicon. In order to obtain the cycle
measurement for the exponential amplification of each product, amplification curves
generated during the 60 oC annealing step were evaluated by using the same threshold
for all qRT-PCR assays. Each sample was measured by at least one assay in which
three technical replicates were included. Measurements from technical replicates were
combined using their geometric mean. All the primers had excellent linearity between
2 and 20,000 transcript copies with an R2 of 0.99 or higher and an efficiency of
amplification between 0.9 and 1.0.
Table 4.1. Primers used for qRT-PCR. Sequences Given in the 5’-3’ Direction.
Gene name Forward Reverse acpP ATCGTCGCTGAACAACTCG CCTGAACGGTGGTGATCTTT exoS AGAGAGCGAGGTCAGCAGAG ATGCCGGTGTAGAGACCAAG exoT ATGCGGTAATGGACAAGGTC CTGGTACTCGCCGTTGGTAT exoY GGTTGAAAGAATCGTCACCACGCT CAGCCAGGTTCAGCTTGCGTATTT toxA GGAGCGCAACTATCCCACT TGGTAGCCGACGAACACATA PA1169 GCGGAACAACAGCGATCTAT CCTTTGACATTGCCGAAGTT

98
Results Global Evaluation of Gene Expression in Biofilms
T3SS Secreted Factors: Models using planktonic P. aeruginosa have
demonstrated that calcium concentrations influence virulence factor production, (21,
24, 20, 33) we therefore, examined factors expressed during growth at low (0 mM)
and high (10 mM) Ca2+ concentrations ([Ca]2+) in cells cultivated in a biofilm reactor
for 24 hours or grown planktonically to stationary phase using microarrays. We
identified the genes encoding the T3SS and the exotoxins, exoS, exoT, and exoY, as
having increased expression in the biofilms grown with low [Ca]2+ (Fig. 4.1).
Quantitative real time polymerase chain reaction (qRT-PCR) was used to verify the
expression of the exotoxin genes in continuous-flow biofilms over a period of five
days of growth. At low [Ca2+], exoS and exoT showed tenfold increased expression in
biofilms compared to planktonic cells, during the first day of growth. These biofilms
also had a 100-fold increased levels of exoY transcription as compared to planktonic
conditions. As the biofilms developed, the expression of these genes decreased and by
the third day of growth had similar levels to those found in planktonic cells at any
point in their growth phase (Fig. 4.2). When the biofilms were exposed to calcium,
exotoxin expression levels in biofilms were comparable to levels found in planktonic
cells (Fig. 4.1).

99
Figure 4.1. Genes induced in biofilms grown with low [Ca2+]. Cluster analysis of P. aeruginosa PA01 grown in BMM with (10 mM) and without calcium supplementation (0 mM). Biofilms (BF) were harvested after growing for 24 hours. Planktonic cultures (Pk) were harvested during stationary phase. Color coding: Green, down regulated genes; black, no change; red, up regulated genes.

100
Biofilm Planktonic
Figure 4.2. Relative mRNA expression levels of exoS, exoT, and exoY in biofilms and planktonic cultures of P. aeruginosa. Each curve represents a single qRT-PCR experiment normalized to the median of an experiment were a quantitative analysis based on a standard curve was done. Therefore, graphs have arbitrary units that are very similar to actual mRNA copies per 100 ng of total RNA. Values are comparable between biofilm and planktonic experiments. Abbreviations: Biofilms harvested after growth for 24 hours (D1), 48 hours (D2), 72 hours (D3), 96 hours (D4), and 120 hours (D5). Planktonic cultures harvested at early log (EL), mid log (ML), late log (LL) and stationary phase (SS).

101
In order to test if exotoxin expression is down regulated due to intracellular
toxin accumulation during later stages of biofilm growth, we exposed mature biofilms
to neutrophils and after a period of exposure analyzed gene expression using qRT-
PCR. Biofilms were grown in a drip-flow reactor using BMM with 0 mM [Ca 2+] for
24 or 72 hours prior to neutrophil treatment. In control experiments, RNA was
extracted from biofilms following addition of Hank’s Balanced Salts. Biofilms were
exposed to neutrophils diluted in Hank’s Balanced Salts for 60 minutes. Contact
between the biofilm cells and the neutrophils did not induce additional exotoxin
expression than what we measured under the control condition (not shown). We
attributed these results to our inability to measure exotoxin expression from the cells
in direct contact with the neutrophils. Further experiments await more appropriate
methodology.
Other Genes: Among the genes with known virulence activity induced during
the first day of biofilm growth is exotoxin A (toxA), a pathogenic determinant whose
activity targets protein synthesis to bring it to a halt and ultimately kill, in this
manner, the host cell (6). In the biofilms, its expression was ten times that of the cells
growing planktonically, remaining at steady levels throughout the growth stages
examined (Fig. 4.3).

102
Figure 4.3. Exotoxin A and PA1169 relative mRNA expression levels induced during biofilm growth. toxA and PA1169 expression in biofilms are tenfold upregulated as compared to planktonic cells. See Figure 4.1 legend for details. Expression of toxA remains constant as the biofilm matures. Each curve represents a single qRT-PCR experiment normalized to the median of one of the experiments. Values are in arbitrary units. Abbreviations: Biofilms harvested after growth for 24 hours (D1), 48 hours (D2), 72 hours (D3), 96 hours (D4), and 120 hours (D5).
From our microarray results as well as our qRT-PCR experiments we
observed a 10-fold induction in the expression of PA1169 in P. aeruginosa during the
first day of biofilm growth that is not seen during planktonic growth or during later
stages of biofilm development (Fig. 4.3, Fig. 4.4). Prior to our studies, no
documentation was available regarding inducing conditions for PA1169. This gene
encodes a secretable 15-lipoxygenase with functional activity in mediating the
biosynthesis of lipoxins, a family of important immunomodulators (29).
Biofilm Planktonic
Figure 4.4. Relative mRNA expression levels of PA1169 in biofilms and planktonic cultures. Details: See Figure 4.2 legend.

103
Another interesting finding from our initial microarray survey was the
increased expression of PA3552-59 in low [Ca2+] (Fig. 4.5). This operon has been
attributed with the function of supplying biofilms with an exopolysaccharide matrix
that is distinct from alginate (19). These results were obtained regardless of growth in
biofilms or in planktonic cultures. While low calcium levels favor the expression of
this operon, high [Ca2+] appears to repress its activation (Fig. 4.5).
Figure 4.5. Genes induced by low [Ca2+] independently of mode of growth. Details: See Figure 4.1 legend.
The calcium response appears to be modulated by PA2656-57 during
planktonic growth. This operon has the characteristics of a two component system
that is closely related to other two component systems involved in the regulation of
essential divalent cations or anions (22). Even though its function has not been
ascribed, preliminary data from our lab indicates that it is involved in regulating the
response to very high [Ca2+] (Fig. 4.6). This type of response is only observed only
when the media has a [Ca2+] of at least 10 mM (not shown).

104
Figure 4.6. Genes induced by planktonic growth at high [Ca2+]. Details: See Figure 4.1 legend.
In addition, the housekeeping control acpP was monitored through these
experiments and showed little variation during growth associated with biofilms. Its
activity did vary as the planktonic cells reached stationary phase, when its expression
had an approximate decrease of 10-fold as compared to cells in the early stages of
exponential growth (Fig. 4.7).
Figure 4.7. acpP relative mRNA expression levels in biofilms and planktonic cultures. Each curve represents a single qRT-PCR experiment normalized to the median of one of the experiments. Values are in arbitrary units. Abbreviations: Biofilms harvested after growth for 24 hours (D1), 48 hours (D2), 72 hours (D3), 96 hours (D4), and 120 hours (D5). Planktonic cultures harvested at early log (EL), mid log (ML), late log (LL) and stationary phase (SS).

105
Discussion
Biofilms are known to be physiologically different from their planktonic
counterparts with respect to their pathogenesis during infection processes (2). Since
calcium plays a role in biofilm structure by augmenting its thickness and allowing for
a larger reservoir of extracellular virulence factors (24, 14), we examined gene
expression of the P. aeruginosa strain PA01, grown under low and high [Ca2+], by
using microarrays as a tool to identify mediators of biofilm related pathogenesis.
At low [Ca2+], an increase in expression level of the T3SS and the exotoxins S,
T and Y was observed in cells cultivated in biofilm reactors (Fig. 4.7). Generally,
while working with planktonic cells, it is necessary to chelate calcium from the low
calcium media in order to see a small increase in the expression of these genes (33).
These results applied only to biofilms that were only one day old (Fig. 4.2).
Therefore, induction of the T3SS and its effectors appears to be closely related to
early stages of biofilm development during growth in environments with low [Ca2+].
The lungs of patients with CF have increased [Ca2+] in their sputum as compared to
asthmatic patients, with levels approaching 1 mM (8). Yet, during the initial stages of
lung infections, the T3SS effectors are actively synthesized, even though increased
levels of [Ca2+] completely abrogate their expression in vitro, an observation that was
previously reported (33).
Therefore, a few possible explanations remain to be examined; either the
biofilm matrix - which may or may not include extracellular DNA- formed in the lung
is chelating available calcium and keeping it away from the cells, or the calcium

106
measured from the lung secretions is not readily available as free calcium but instead
exists bound to calcium binding proteins such as calmodulin and calcitonin (31).
Alginate is known to bind calcium, and such phenomenon results in the
thickening of the extracellular matrix (24). Most P. aeruginosa strains isolated from
early lung infections in CF patients have not undergone the phenotypic switch that
allows them to make alginate (17). Is there another, yet unidentified
exopolysaccharide matrix that may bind available calcium during infections with non-
mucoid strains?
Our finding in regards to the putative exopolysaccharide operon PA3552-59
also preclude the possibility of a calcium binding role for its products; this operon is
predominantly active during planktonic growth, not biofilm growth; and high [Ca2+]
represses its expression (Fig. 4.1).
In the present study, we also corroborate a decreased exotoxin expression in
mature biofilms by doing experiments in vitro. The temporal patterns observed may
be the result of several factors including intracellular accumulation of toxins, a
change in overall metabolism of the cells or accumulation of mutations that alter the
T3SS expression (5, 16, 23).
To explore the first of these possibilities, we attempted to induce exotoxin
expression in biofilms by activating the T3SS, using direct bacteria to host cell-
interaction with human neutrophils. We were unable to measure any significant
changes in the expression of exotoxins S, T or Y. Because we observed that the
decrease in exotoxin expression is directly correlated with the increase in biofilm

107
biomass obtained by prolonged periods of biofilm growth, we suspect that our results
could be attributed to a localized response in the exotoxin activity, where those cells
coating the edge of the biofilm may be the most transcriptionally active population.
Since we did not have the ideal methodology to answer this question, nor for
exploring if the only cells that come into contact with neutrophils are the ones
experiencing a significant increase in the expression of T3SS effectors, further
research is needed. Yet, it is plausible that T3SS and its effectors become activated as
an adaptation strategy for initial colonization and switch off soon after, until
additional cues such as dispersal and reattachment induce their expression.
Characterization of exotoxin expression in response to neutrophil exposure and in
response to variations in calcium concentrations has the potential to provide new
approaches to treatment as a deeper understanding of the molecular events involved
in the establishment of chronic infections with P. aeruginosa is developed.
The tenfold upregulation in biofilms as compared to cells growing
planktonically observed in the expression of toxA (Fig. 4.3), was shown to be yet
another environmental cue that serves to induce its expression among the many other
signals known to have this type of effect (6).
The upregulation of PA1169 in early biofilms implies a potential involvement
of this gene in the modulation of the immune system during the stages when P.
aeruginosa is getting established in its new host. In CF patients, active infections with
this pathogen are characterized by a rapid decline in lung function that results from
the strong inflammatory response that it induces (10, 30). Our observations indicate

108
that P. aeruginosa may use immunomodulatory enzymes such as the PA1169
encoded LoxA to quiet initial attacks by the immune system while it forms a
protective barrier, such as the one provided by a robust exopolysaccharide matrix that
forms as the biofilm develops.
The role of PA2657-59 as a two component system able to respond to very
high levels of calcium ions during planktonic growth remains to be further
investigated. PA2665 encodes a putative two-component sensor that is homologous to
both PhoQ and PmrB; histidine kinases in P. aeruginosa involved in the response to
conditions of limiting phosphate and magnesium, respectively. The response
regulator PA2657 is also closely related to the PhoP and PmrA response regulators
(22). Together, these form a tight cluster of highly homologous two-component
systems that may be functionally related in the response to divalent cations or anions.
Together these findings indicate that spatial as well as temporal changes occur
in the biofilms of P. aeruginosa that allow it to form robust biofilms by taking
advantage of several with immunnomodulatory strategies. The mechanisms guiding
these phenotypic characteristics may have important implications to models of
infection and in particular to the lung infections seen in CF patients. Future work
include the verification of activity of the LO protein in biofilms, mutational studies of
the LO gene and exotoxins and more ample examination of the effects of T3SS
exotoxins to neutrophil behavior. In addition, there is a need for studies where the
spatial characterization of biofilms can be done while allowing us to peek at their
macromolecular composition from a global viewpoint. These will aid in our ability to

109
discern the range of functions performed by populations of cells that may experience
distinct environmental conditions, within short distances, and in turn, provide insights
for the design of new treatment options.

110
References
1. Bannenberg, G. L., J. Aliberti, S. Hong, A. Sher, and C. Serhan. 2004. Exogenous
pathogen and plant 15-lipoxygenase initiate endogenous lipoxin A4 biosynthesis. J Exp Med 199:515-23.
2. Beloin, C., and J. M. Ghigo. 2005. Finding gene-expression patterns in bacterial
biofilms. Trends Microbiol 13:16-9. 3. Corech, R., A. Rao, A. Laxova, J. Moss, M. J. Rock, Z. Li, M. R. Kosorok, M. L.
Splaingard, P. M. Farrell, and J. T. Barbieri. 2005. Early immune response to the components of the type III system of Pseudomonas aeruginosa in children with cystic fibrosis. J Clin Microbiol 43:3956-62.
4. Döring, G., M. Maier, E. Muller, B. Zoubair, B. Tummler, and A. Kharazmi.
1987. Virulence factors of Pseudomonas aeruginosa. Antibiot. Chemother. 39:136-148.
5. Filopon, D., A. Merieau, G. Bernot, J. P. Comet, R. Leberre, B. Guery, B. Polack,
and J. Guespin-Michel. 2006. Epigenetic acquisition of inducibility of type III cytotoxicity in P. aeruginosa. BMC Bioinformatics 7:272.
6. Gaines, J. M., N. L. Carty, J. A. Colmer-Hamood, and A. N. Hamood. 2005.
Effect of static growth and different levels of environmental oxygen on toxA and ptxR expression in the Pseudomonas aeruginosa strain PAO1. Microbiology 151:2263-75.
7. Galan, J. E., and A. Collmer. 1999. Type III secretion machines: bacterial devices
for protein delivery into host cells. Science 284:1322-8. 8. Halmerbauer, G., C. Gartner, D. Koller, M. Schierl, J. Kuhr, J. Forster, R.
Urbanek, and T. Frischer. 2000. Eosinophil cationic protein and eosinophil protein X in the nasal lavage of children during the first 4 weeks of life. SPACE Collaborative Study Team. Allergy 55:1121-6.
9. Iglewski, B. H., J. C. Sadoff, M. J. Bjorn, and E. S. Maxwell. 1978. Pseudomonas
aeruginosa exoenzyme S: An adenosine diphosphate ribosyltransferase distinct from toxin A. Proc. Natl. Acad. Sci. 75:3211-3215.
10. Jaffar-Bandjee, M. C., A. Lazdunski, M. Bally, J. Carrere, J. P. Chazalette, and C.
Galabert. 1995. Production of elastase, exotoxin A, and alkaline protease in sputa during pulmonary exacerbation of cystic fibrosis in patients chronically infected by Pseudomonas aeruginosa. J Clin Microbiol 33:924-9.

111
11. Jain, M., D. Ramirez, R. Seshadri, J. F. Cullina, C. A. Powers, G. S. Schulert, M.
Bar-Meir, C. L. Sullivan, S. A. McColley, and A. R. Hauser. 2004. Type III secretion phenotypes of Pseudomonas aeruginosa strains change during infection of individuals with cystic fibrosis. J Clin Microbiol 42:5229-37.
12. Jesaitis, A. J., M. J. Franklin, D. Berglund, M. Sasaki, C. I. Lord, J. B. Bleazard,
J. E. Duffy, H. Beyenal, and Z. Lewandowski. 2003. Compromised host defense on Pseudomonas aeruginosa biofilms: characterization of neutrophil and biofilm interactions. J Immunol 171:4329-39.
13. Kilbourn, J. P. 1980. Bacterial flora and ion content of cystic fibrosis sputum.
Pediatr Res 14:259-60. 14. Lattner, D., H. C. Flemming, and C. Mayer. 2003. 13C-NMR study of the
interaction of bacterial alginate with bivalent cations. Int J Biol Macromol 33:81-8.
15. Lau, G. W., D. J. Hassett, and B. E. Britigan. 2005. Modulation of lung epithelial
functions by Pseudomonas aeruginosa. Trends Microbiol 13:389-97. 16. Lee, V. T., R. S. Smith, B. Tummler, and S. Lory. 2005. Activities of
Pseudomonas aeruginosa effectors secreted by the Type III secretion system in vitro and during infection. Infect Immun 73:1695-705.
17. Li, Z., M. R. Kosorok, P. M. Farrell, A. Laxova, S. E. West, C. G. Green, J.
Collins, M. J. Rock, and M. L. Splaingard. 2005. Longitudinal development of mucoid Pseudomonas aeruginosa infection and lung disease progression in children with cystic fibrosis. Jama 293:581-8.
18. Lyczak, J. B., C. L. Cannon, and G. B. Pier. 2002. Lung infections associated
with cystic fibrosis. Clin Microbiol Rev 15:194-222. 19. Matsukawa, M., and E. P. Greenberg. 2004. Putative exopolysaccharide synthesis
genes influence Pseudomonas aeruginosa biofilm development. J Bacteriol 186:4449-56.
20. Olson, J. C., and D. E. Ohman. 1992. Efficient production and processing of
elastase and LasA by Pseudomonas aeruginosa require zinc and calcium ions. J. Bacteriol. 174:4140-4147.
21. Patrauchan, M. A., S. A. Sarkisova, and M. J. Franklin. 2007. Strain-specific proteome responses of Pseudomonas aeruginosa to biofilm-associated growth and to calcium. Microbiology 153:3838-51.

112
22. Richard, J. 2008. The Two-Component Signal Transduction Systems of Pseudomonas Aeruginosa. Master thesis. Montana State University, Bozeman, Mont.
23. Rietsch, A., M. C. Wolfgang, and J. J. Mekalanos. 2004. Effect of metabolic
imbalance on expression of type III secretion genes in Pseudomonas aeruginosa. Infect Immun 72:1383-90.
24. Sarkisova, S., M. A. Patrauchan, D. Berglund, D. E. Nivens, and M. J. Franklin.
2005. Calcium-induced virulence factors associated with the extracellular matrix of mucoid Pseudomonas aeruginosa biofilms. J. Bacteriol. 187:4327-4337.
25. Sauer, K., A. K. Camper, G. D. Ehrlich, J. W. Costerton, and D. G. Davies. 2002.
Pseudomonas aeruginosa displays multiple phenotypes during development as a biofilm. J Bacteriol 184:1140-54.
26. Stover, C. K., X. Q. Pham, A. L. Erwin, S. D. Mizoguchi, P. Warrener, M. J.
Hickey, F. S. Brinkman, W. O. Hufnagle, D. J. Kowalik, M. Lagrou, R. L. Garber, L. Goltry, E. Tolentino, S. Westbrock-Wadman, Y. Yuan, L. L. Brody, S. N. Coulter, K. R. Folger, A. Kas, K. Larbig, R. Lim, K. Smith, D. Spencer, G. K. Wong, Z. Wu, and I. T. Paulsen. 2000. Complete genome sequence of Pseudomonas aeruginosa PA01, an opportunistic pathogen. Nature 406:959-64.
27. Tummler, B., J. Bosshammer, S. Breitenstein, I. Brockhausen, P. Gudowius, C.
Herrmann, S. Herrmann, T. Heuer, P. Kubesch, F. Mekus, U. Romling, K. D. Schmidt, C. Spangenberg, and S. Walter. 1997. Infections with Pseudomonas aeruginosa in patients with cystic fibrosis. Behring Inst Mitt:249-55.
28. Vallis, A. J., T. L. Yahr, J. T. Barbieri, and D. W. Frank. 1999. Regulation of
ExoS production and secretion by Pseudomonas aeruginosa in response to tissue culture conditions. Infect Immun 67:914-20.
29. Vance, R. E., S. Hong, K. Gronert, C. N. Serhan, and J. J. Mekalanos. 2004. The
opportunistic pathogen Pseudomonas aeruginosa carries a secretable arachidonate 15-lipoxygenase. Proc Natl Acad Sci U S A 101:2135-9.
30. Wieland, C. W., B. Siegmund, G. Senaldi, M. L. Vasil, C. A. Dinarello, and G.
Fantuzzi. 2002. Pulmonary inflammation induced by Pseudomonas aeruginosa lipopolysaccharide, phospholipase C, and exotoxin A: role of interferon regulatory factor 1. Infect Immun 70:1352-8.
31. Wolf, P., C. Hall, and J. P. Kilbourn. 1986. Demonstration of calcitonin and
calmodulin by immunoperoxidase in the cystic fibrosis lung. Chest 89:327-30.

113
32. Yahr, T. L., J. Goranson, and D. W. Frank. 1996. Exoenzyme S of Pseudomonas aeruginosa is secreted by a type III pathway. Mol Microbiol 22:991-1003.
33. Yahr, T. L., L. M. Mende-Mueller, M. B. Friese, and D. W. Frank. 1997.
Identification of type III secreted products of the Pseudomonas aeruginosa exoenzyme S regulon. J Bacteriol 179:7165-8.

114
CHAPTER 5
THESIS SYNTHESIS
The goal of the present work was to develop methods to assess heterogeneity in
biofilms from the gene expression perspective. It is recognized that chemical gradients
and other localized environmental conditions, along biofilm depths, direct a diverse array
of cellular activities. These result in the formation of sub-populations that represent a
complex system, whose characterization is far from over. The first chapter of this
dissertation addressed the implications of the heterogeneity found in biofilms. The
medical implications of such complexity are highlighted in this chapter as well.
A method for the measurement of gene expression in small groups of cells
localized to the various strata of biofilms was described in chapter 2. This method uses
LCMM to collect cells from a biofilm that has been cryoembedded and thinsectioned to
allow the collection of samples from spatially resolved sites. The LCMM technique was
complemented by quantifying RNA extracted from the collected samples by the use of
qRT-PCR. The method was then validated by using a strain of Pseudomonas aeruginosa
containing an IPTG-inducible gene for the green fluorescent protein (gfp). Its biofilms
display a zone of active GFP- fluorescence at the periphery. Fluorescence was correlated
with the distribution of gfp mRNA. By using the validated methods described in chapter
2, several discoveries were made. Highest gene expression was observed in the top 30
µm stratum of the biofilms; this was determined by quantifiying the expression of the
housekeeping gene, acpP and two genes regulated by quorum-sensing, phzA1 and aprA.

115
Additionaly, quantification of 16S rRNA amounts indicated that it is distributed relatively
uniformmly throughout biofilm strata. Through the studies described in chapter 2, it was
demonstrated that mRNA levels for individual genes are not uniformly distributed
throughout biofilms, but may vary by orders of magnitude over small distances. Since
16S rRNA levels were found to be homogeneously distributed throughout the biofilms, it
is likely that such distribution is a consequence of the stability conferred by the formation
of rRNA/ribosome complexes. As demonstrated in chapter 2, the LCMM/qRT-PCR
technique can be used to resolve and quantify RNA variability at high spatial resolution.
The evaluation and validation of the use of 16S rRNA to rDNA ratio as a
predictive tool in assessing the growth state of cells was described in chapter 3. The
growth rate of planktonic cells was used to determine the growth rates from biofilm
samples. Using this information, allows the application of 16S rDNA as a normalizing
control. Subsequently, cellular rpoS, rhlR, and acpP mRNA and ribosome content in
biofilms was determined. Through the study presented in chapter 3 it was found that cells
growing at the biofilm periphery have a growth rate that falls between the logarithmic
and stationary phase of planktonic cells. Cells living deeper in the biofilms have a
relatively slower growth rate. The cellular rpoS, rhlR, and acpP mRNA was highest in
those cells collected from the outermost layer near the air interphase, which had an
average of 7 transcripts of rpoS, rhlR, and acpP mRNA. Most cells at the bottom and
middle layers had less than one transcript per cell. By subjecting 16S rRNA to the 16S
rDNA normalization strategy, it was found that the average 16S rRNA amount was
slightly higher at the top of the biofilms as compared to the middle or the bottom layers.

116
Chapter 3 provides normalization strategies in addition to the ones suggested in chapter 2
and solidifies the observation that differences in growth rates and mRNA transcription
along spatially related sites occur in biofilms.
The methods presented in chapters 2 and 3 can be incorporated to study
environmental samples of medical and ecological relevance, since they do not require a
priori genetic manipulation of the strains nor their in vitro cultivation.
In chapter 4, a genome wide approach for the characterization of biofilms was
used. Genes encoding the exotoxins ExoS, ExoT, and ExoY were identified as having
between 10 and 100 fold increased expression during early biofilm formation under
calcium limiting conditions. Their expression was verified using qRT-PCR on samples
from biofilms grown in continuous-flow reactors over time. As the biofilms developed,
the expression of these genes decreased, and by the third day of growth, they had
expression levels similar to those of planktonic cells. When the biofilms were exposed to
calcium, exotoxin expression in biofilms had levels comparable to those of planktonic
cells, suggesting that the biofilm matrix may chelate available calcium, allowing for an
increased expression of exotoxin genes during the early stages of biofilm development.
The lipoxygenase encoding gene loxA and the exotoxin A gene were also found to be
expressed at significantly greater levels in these biofilms as compared to planktonic cells.
The study presented in chapter 4, highlights that temporal factors, in addition to the
spatial factors observed through the studies addressed by chapters 2 and 3, affect the
development of P. aeruginosa biofilms. In addition, this chapter stresses that secretion of
immune mediating factors during early biofilm formation may impede the timely clearing

117
of infections by the host’s the immune system. Such clearing is crucial in the prevention
of the establishment of difficult to treat biofilm associated infections.
Future Directions
To develop a clear picture of biofilm complexity, it is necessary to create new and
more sophisticated methodologies. In addition, more research is needed to fully
comprehend the implications of the intricate details of sessile growth in the microbial
world. Various levels of understanding are needed to fully characterize biofilm
physiology. The genetic makeup of an organism, including the function of the products
encoded, is an important element that can not be studied in isolation from the context in
which these functions become relevant. In some cases, this context can be represented by
planktonic growth under various environmental parameters. In others, biofilm growth is
more appropriate. Yet, as biofilms are recognized as heterogeneous populations, the
context in which some of these genetically encoded functions are driven becomes
relevant only when considered from the spatial and temporal perspective.
Global gene expression studies are great resources for elucidating the effects of
environmental parameters. Current methodologies can not measure the state of global
gene expression from limited quantities of bacterial mRNA. The development of a
technique that combines the LCMM approach with global gene expression profiling will
provide a more complete description of the transcriptional state of most genes in cells
localized to specific strata within biofilms. Amplification strategies for bacterial mRNA
that allow tandem application with microarray technology are being evaluated in the

118
Franklin lab as an extension to the presently described work. Following the development
of this method, questions regarding the localization of specific activities of many genes in
response to antibiotic treatments, or to interaction with cells of the innate immune system
or to many other parameters of medical and ecological relevance can begin to be
addressed. To address the temporal aspects of biofilm localized activities through the use
of this technique, it will be necessary to design time course studies where biofilms are
harvested from reproducible environments. Alternatively, studies may be performed in
environments where all other parameters can be accounted for, in their correlation with
the progression of time.
The complete appreciation of the physiological states of these complex microbial
communities is the first step towards the development of improved biofilm managing
solutions. The research is, therefore, not over; the problem is still at hand and the daily
struggle against biofilm associated infections, the effects of biocorrosion and the need for
more effective bioreactor designs is a constant reminder of this.

119
APPENDICES

120
APPENDIX A
ISOLATION OF RNA AND DNA FROM BIOFILM SAMPLES OBTAINED BY
LASER CAPTURE MICRODISSECTION MICROSCOPY

121
Isolation of RNA and DNA from Biofilm Samples Obtained by Laser Capture
Microdissection Microscopy
Original publication reproduced with permission from Perez-Osorio, A. C., and M. J. Franklin. 2008. Isolation of RNA and DNA from Biofilm Samples Obtained by Laser Capture Microdissection Microscopy. Cold Spring Harb. Protoc. 2008:pdb.prot5065.-.
Introduction
The metabolic activities of bacteria growing in biofilms result in spatial gradients
of oxygen, nutrients, and waste products. Because bacteria respond to local
environmental conditions through changes in gene expression, mRNA levels of
individual genes may vary spatially among bacteria within the biofilm. This article
describes an approach to isolate RNA for quantification from cells at localized sites
within biofilms. Biofilm thin sections are generated by embedding biofilms in
cryoembedding resin, freezing the embedded biofilms on dry ice, and cutting with a
cryomicrotome. The sections are placed on membrane coated microscope slides and
maintained on dry ice. Laser capture microdissection microscopy (LCMM) is used to
dissect small subsets of cells at different regions within the biofilms, and RNA is
extracted from the samples using either hot phenol or TRIreagent. A TRIreagent-based
DNA extraction method is also presented.

122
Materials
Reagents: All reagents to prepared in this protocol are to be made with DEPC-treated H2O Tissue-Tek O.C.T. compound (Sakura Finetechnical Co.)
Membrane-coated microscope slides (P.A.L.M. microlaser technologies)
DEPC-treated water
Lysis buffer (0.3 M sucrose and 0.02 M sodium acetate at pH 4.5)
2% sodium dodecyl sulfate (SDS)
Luciferase RNA diluted to 1E+04 molecules per µL (Promega)
H2O-equilibrated phenol (Acros Organics)
1.5 mL heavy Phase-Lock gel tubes (Eppendorf)
H2O-equilibrated phenol:chloroform:isoamyl alcohol (25:24:1)
PolyAcryl carrier (MRC, Inc.)
Sodium Acetate 3 M
Ethanol, 75% and 100%
TRI Reagent (MRC. Inc)
Bromochloropropane (BCP, MRC. Inc)
Sodium Hydroxide 0.08 M
HEPES 0.1 M
TURBO DNA-free DNase Treatment (Ambion, includes TURBO DNase Buffer, TURBO DNase and DNase Inactivation Reagent)

123
Equipment:
Water bath, prewarmed to 65oC
Table top microcentrifuge cooled to 4 oC
Optional: Speed vacuum
Methods
Cryoprocessing of Biofilms
Maintain samples in RNAse-free zones on dry ice at all times.
1. Cultivate the biofilm using an appropriate system designed by the investigators,
preferably on a heat-conducting surface or on a membrane that can be placed on a
heat-conducting surface. If the biofilm has been cultivated on a membrane, place it
on a stainless steel slide.Place biofilms cultivated on membranes on a stainless steel
slide.
2. Cover biofilms with O.C.T. compound at room temperature.
3. Freeze biofilms and embedding resin by pressing the stainless steel slide onto a
block of dry ice.
Keep track of the orientation of the biofilm.
4. Once frozen, remove the biofilm and resin from the slide (by twisting the slide),
invert the biofilm on the dry ice, and cover the opposite side of the biofilm with
O.C.T. compound.
Mark the O.C.T. to remember the orientation of the biofilm.
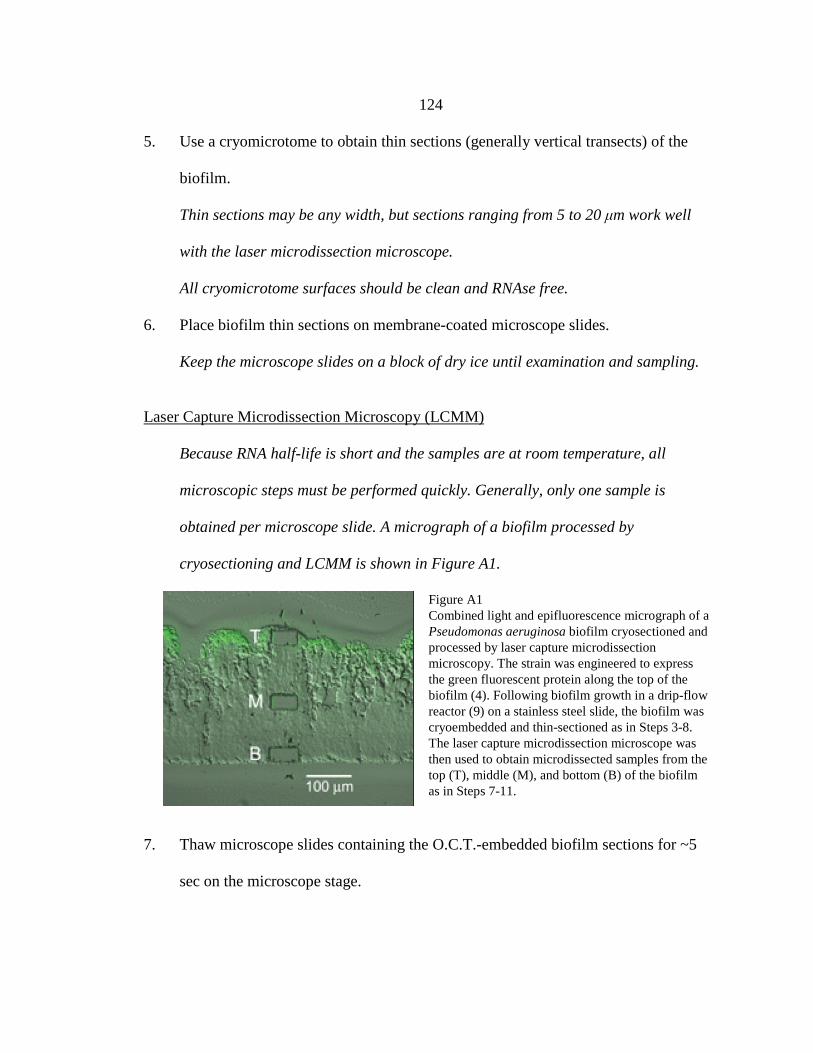
124
5. Use a cryomicrotome to obtain thin sections (generally vertical transects) of the
biofilm.
Thin sections may be any width, but sections ranging from 5 to 20 µm work well
with the laser microdissection microscope.
All cryomicrotome surfaces should be clean and RNAse free.
6. Place biofilm thin sections on membrane-coated microscope slides.
Keep the microscope slides on a block of dry ice until examination and sampling.
Laser Capture Microdissection Microscopy (LCMM)
Because RNA half-life is short and the samples are at room temperature, all
microscopic steps must be performed quickly. Generally, only one sample is
obtained per microscope slide. A micrograph of a biofilm processed by
cryosectioning and LCMM is shown in Figure A1.
Figure A1 Combined light and epifluorescence micrograph of a Pseudomonas aeruginosa biofilm cryosectioned and processed by laser capture microdissection microscopy. The strain was engineered to express the green fluorescent protein along the top of the biofilm (4). Following biofilm growth in a drip-flow reactor (9) on a stainless steel slide, the biofilm was cryoembedded and thin-sectioned as in Steps 3-8. The laser capture microdissection microscope was then used to obtain microdissected samples from the top (T), middle (M), and bottom (B) of the biofilm as in Steps 7-11.
7. Thaw microscope slides containing the O.C.T.-embedded biofilm sections for ~5
sec on the microscope stage.

125
8. Examine the sections using any of the objective lenses, depending upon the
dissection area desired (generally 10X to 40X).
9. Use the dissecting laser to outline areas of the sections for sampling, generally
ranging from 50 to 100,000 µm2.
10. Use the microscope microcentrifuge swinging arm to position the cap of a 1.5-mL
microcentrifuge tube containing 40 µL of LCMM lysis buffer ~1 mm above the
microscope slide.
Alternatively, 30 µL of TRI reagent may be used instead of LCMM lysis buffer. See
Discussion.
11. Obtain the samples by using the laser pressure catapult (LPC), which catapults the
dissected sample into the LCMM lysis buffer contained in the microcentrifuge tube
cap.
RNA Extraction from LCMM-captured Samples
If LCMM lysis buffer was used during the microdissection in Step 10, extract the
RNA using the hot phenol method (Steps 12-29). If TRI reagent was used, extract
the RNA with the TRI reagent method (Steps 30-42). After RNA extraction, proceed
to DNAse treatment (Step 43).
RNA Extraction with Hot Phenol
12. Mix 160 µL of LCMM lysis buffer with 200 µL of 2% SDS.

126
13. After LCMM, immediately add the 360 µL of LCMM lysis buffer/SDS mixture
from Step 12 and 1.5 µL of luciferase control RNA to the microcentrifuge tube
containing the sample in the cap.
The control RNA is used to quantify RNA loss during sample preparation.
14. Cap the tube, mix by inversion, and quickly vortex for 1 sec. Repeat the mixing and
vortexing three times.
15. Centrifuge the tube in a microcentrifuge at maximum speed for 10 sec at room
temperature, and transfer the sample to a new tube containing 400 µL of H2O-
equilibrated phenol. Vortex for 5 sec.
16. Incubate for 5 min in a water bath at 65ºC. Vortex again every minute during this
incubation step. Transfer the tube to ice.
17. Centrifuge the tube in a microcentrifuge at maximum speed for 25 min at 4ºC.
18. Centrifuge a 1.5-mL Phase-Lock Gel tube in a microcentrifuge for 30 sec at 12,000-
16,000g.
Perform this step immediately before use in Step 19.
19. Transfer the upper layer from the tube in Step 17 to the pelleted Phase-Lock Gel
tube.
20. Add 400 µL of phenol:chloroform:isoamyl alcohol (25:24:1) and mix by inversion.
21. Centrifuge in a microcentrifuge at maximum speed for 5 min at 4ºC. Transfer the
aqueous (upper) phase to a 1.5-mL tube.
Discard the organic phase.
22. (Optional) Add 1.5 µL of 1:10 diluted PolyAcryl carrier.

127
Use a carrier substance whenever possible to aid in the precipitation of samples
with very little RNA. See Discussion.
23. Add 30 µL of 3 M sodium acetate (pH 4.5) and mix. Add 1.1 mL of 100% ethanol
and vortex for 5 sec.
24. Incubate for 10 min at room temperature to precipitate the RNA. Store the sample
overnight at –80ºC.
25. Centrifuge the sample in a microcentrifuge at maximum speed for 10 min at 4ºC.
Carefully decant the supernatant.
26. Add 1.4 mL of 75% ethanol to the pellet and vortex for 5 sec. Centrifuge the
samples in a microcentrifuge at maximum speed for 10 min at 4ºC. Carefully decant
the supernatant.
27. Repeat Step 26.
28. Air-dry the pellet for 5-10 min.
29. Alternatively, use a vacuum concentrator to dry the samples for 7 min.
Samples may be frozen and stored at –80°C.
RNA Extraction with TRI Reagent 30. Aliquot 470 µL of TRI reagent to a 1.5-mL tube. Just before Step 31, add 3 µL of
1:10 diluted PolyAcryl carrier and 1.5 µL of luciferase control RNA.
This method does not work well for LCMM applications without a carrier
compound. The control RNA is used to quantify RNA loss during sample
preparation.

128
31. Add 150 µL of the TRI reagent mixture made in Step 30 to the 500-µL tube
containing the LCMM sample from Step 11.
32. Cap the tube. Mix by inversion and quickly vortex for 1 sec. Repeat three times.
33. Centrifuge the tube in a microcentrifuge at maximum speed for 10 sec at room
temperature. Transfer the sample into the tube containing the remainder of the TRI
reagent mixed in Step 30 and vortex for 5 sec.
34. Incubate for 5 min in a water bath at 65ºC. Vortex every minute during this
incubation step. Transfer the tube to ice.
35. Add 50 µL of BCP and vortex for 15 sec. Incubate for 10 min at room temperature.
36. Centrifuge in a microcentrifuge at 12,000g for 15 min at 4ºC. Transfer the top,
aqueous phase to a new tube. Keep the interphase and organic phase on ice while
finishing the RNA protocol.
The interphase and organic phase contain the DNA, which can be isolated by
continuing with Step 48.
37. Add 250 µL of isopropanol and vortex for 5 sec. Incubate for 10 min at room
temperature.
38. Centrifuge in a microcentrifuge at 12,000g for 15 min at 4ºC. Carefully decant the
supernatant.
39. Add 1.4 mL of 75% ethanol to the RNA pellet and vortex for 5 sec. Centrifuge in a
microcentrifuge at maximum speed for 10 min at 4ºC, and carefully decant the
supernatant.
40. Repeat Step 39.

129
At this point in the protocol, samples may be frozen and stored at –80°C. In this
case, centrifuge the sample in a microcentrifuge at maximum speed for 10 min at
4°C just before Step 41.
41. Air-dry the pellet for 5-10 min.
42. Resuspend the RNA in 5 µL of DEPC-treated H2O and keep on ice.
Samples may be frozen at this point and stored at –80°C.
DNAse Treatment
43. Make a mixture of 3 µL of DEPC-treated H2O, 1 µL of 10X TURBO DNase
Buffer, and 1 µL of TURBO DNase in a 500-µL tube.
44. Add the 5 µL RNA sample from Step 42 and mix gently. Incubate for 20 min in a
water bath at 37ºC.
45. Add 2 µL of DNase Inactivation Reagent and mix well. Incubate for 2 min at room
temperature, mixing two to three times during this incubation period.
46. Centrifuge in a microcentrifuge at maximum speed for 2 min at 4ºC.
47. Transfer the RNA to a new tube and keep on ice until it is used for qRT-PCR (see
qRT-PCR of Microbial Biofilms [Pérez-Osorio and Franklin 2008]).
Samples may be frozen at this point and stored at –80°C.
DNA Extraction
In certain experiments, it may be necessary to isolate DNA from LCMM-
generated biofilm samples. The method here describes the TRI reagent approach for
isolating DNA from the interphase and organic phase of the TRI reagent protocol.

130
48. Remove any remaining aqueous phase from the DNA sample generated in Step36.
The DNA is in the underlying interphase and organic phase.
49. Add 3 µL of 1:10 diluted PolyAcryl Carrier and mix well. Add 150 µL of 100%
ethanol and mix samples for 30 sec by inversion.
50. Incubate for 2-3 min at room temperature.
51. Centrifuge in a microcentrifuge at 2,000g for 5 min at 4ºC. Decant the supernatant.
52. Add 1.4 mL of 75% ethanol and vortex for 5 sec. Incubate for 10 min at room
temperature.
53. Centrifuge in a microcentrifuge at maximum speed for 5 min at 4ºC. Carefully
decant the supernatant.
54. Repeat Steps 52 and 53.
55. Air-dry the sample for 5-10 min.
56. Resuspend the DNA pellet in 23 µL of 8 mM NaOH.
Samples can be stored overnight at 4°C.
57. Centrifuge in a microcentrifuge at maximum speed for 10 min at room temperature.
Transfer the supernatant to a new tube, and discard the cell debris that is left behind.
58. Adjust the pH of the DNA by adding 6.9 µL of 0.1 M HEPES.
Discussion
Bacteria growing in biofilms are physiologically distinct from cells growing
planktonically. Global proteomic and transcriptomic studies have revealed extensive
difference in protein abundances and gene expression profiles of cells cultured in

131
biofilms versus their planktonic counterparts (e.g. 5, 7). The global studies generally
analyze entire homogenized biofilm population. However, environmental conditions
such as oxygen and nutrient concentrations may vary depending on the distance of the
cells within the biofilm from the oxygen or nutrient source. Therefore, the physiological
responses of bacteria to the local environmental conditions within biofilms may vary
greatly even for cells in close proximity to each other (6).
LCMM allows investigators to separate and isolate individual cells or small group
of cells from surrounding tissue or matrix material (1, 3). LCMM has now been applied
to biofilm studies (4), where biofilms are cryoembedded and thin-sectioned Bacterial
cells are then isolated by LCMM from different regions of the biofilm, and RNA is
extracted from the cells. An advantage of this approach is that it does not require genetic
manipulation of the cells (as is the case for reporter gene studies) and therefore may be
used on wild-type cells isolated from their native environment. A drawback of this
approach is that it is destructive, and therefore only endpoint analyses are possible.
This article describes two methods for extracting RNA from the microdissected
samples. The hot-phenol method (2, 8) is an inexpensive approach that provides excellent
RNA recovery. It can be used when only RNA is needed. The TRI reagent method allows
isolation of both RNA and DNA, but it requires a carrier compound if very small
amounts of RNA are isolated (e.g., with laser microdissected biofilm samples). It should
not be used when the carrier interferes with downstream techniques. An advantage to
extracting both DNA and RNA from individual samples is that quantitative PCR may be
performed on the DNA, providing an estimate of the number of DNA copies per sample.

132
This in turn may be used as a normalization factor to estimate the number of bacterial
cells obtained by LCMM for each sample.
LCMM and Quantitative RT-PCR have revealed orders of magnitude differences
in gene expression of bacteria at different positions in biofilms (4). Lenz et al. (4) discuss
details regarding the analytical parameters of this approach, including reproducibility and
limits of detection for individual genes. The LCMM/qRT-PCR approach may now be
used to better understand why certain subsets of cells within biofilms are more resistant
to antibiotics and host defenses, based on their gene expression patterns. It may also be
used to localize the bacteria within biofilms with the greatest metabolic response toward
certain substrates.
Acknowledgements
We would like to thank Kerry Williamson, Betsey Pitts, and Paula J. Wilderman
for their assistance in developing these protocols. This work was supported by Public
Health Service grant AI-065906 (M.J.F.) from the National Institute of Allergy and
Infectious Diseases, and the American Society for Microbiology Robert D. Watkins
Graduate Research Fellowship (A.P.L.). We acknowledge the Montana State University
INBRE Functional Genomics Core Facility supported by NIH grant P20-RR16455.

133
References Cited
1. Bonner, R. F., M. Emmert-Buck, K. Cole, T. Pohida, R. Chuaqui, S. Goldstein,
and L. A. Liotta. 1997. Laser capture microdissection: molecular analysis of tissue. Science 278:1481-1483.
2. Chomczynski, P., and N. Sacchi. 1987. Single-step method of RNA isolation by
acid guanidinium thiocyanate-phenol-chloroform extraction. Analytical Biochemistry 162:156-159.
3. Emmert-Buck, M. R., R. F. Bonner, P. D. Smith, R. F. Chuaqui, Z. Zhuang, S. R.
Goldstein, R. A. Weiss, and L. A. Liotta. 1996. Laser capture microdissection. Science 274:998-1001.
4. Lenz, A. P., K. Williamson, B. Pitts, P. S. Stewart, and M. J. Franklin. 2008.
Localized gene expression in Pseudomonas aeruginosa Biofilms. Appl Environ Microbiol. 74:4463-4471
5. Sauer, K., A. K. Camper, G. D. Ehrlich, J. W. Costerton, and D. G. Davies. 2002.
Pseudomonas aeruginosa displays multiple phenotypes during development as a biofilm. J Bacteriol 184:1140-1154.
6. Stewart, P. S., and M. J. Franklin. 2008. Physiological heterogeneity in biofilms.
Nat Rev Microbiol 6:199-210. 7. Waite, R. D., A. Papakonstantinopoulou, E. Littler, and M. A. Curtis. 2005.
Transcriptome analysis of Pseudomonas aeruginosa growth: comparison of gene expression in planktonic cultures and developing and mature biofilms. J Bacteriol 187:6571-6576.
8. Wilderman, P. J., N. A. Sowa, D. J. FitzGerald, P. C. FitzGerald, S. Gottesman,
U. A. Ochsner, and M. L. Vasil. 2004. Identification of tandem duplicate regulatory small RNAs in Pseudomonas aeruginosa involved in iron homeostasis. Proc Natl Acad Sci U S A 101:9792-9797.
9. Xu, K.D., P.S. Stewart, F. Xia, C.T. Huang, and G.A. McFeters (1998) Spatial
physiological heterogeneity in Pseudomonas aeruginosa biofilm is determined by oxygen availability. Appl Environ Microbiol. 64:4035-4039.

134
APPENDIX B
qRT-PCR OF MICROBIAL BIOFILMS

135
qRT-PCR of Microbial Biofilms
Original publication reproduced with permission from Perez-Osorio, A. C., and
M. J. Franklin. 2008. qRT-PCR of Microbial Biofilms. Cold Spring Harb. Protoc. 2008:pdb.prot5066-.
Introduction
Bacteria growing in biofilms often express a different subset of genes compared
to the same strains growing planktonically. Quantitative reverse transcriptase real time
PCR (qRT-PCR) can be used effectively to quantify the number of RNA transcripts of
specific genes from bacteria growing in biofilms. qRT-PCR has a large dynamic range
and may be used to verify gene expression data obtained from microarrays. In addition,
qRT-PCR is sensitive, and therefore may be used to quantify gene expression from
biofilm samples where only a small amount of biological material is available, as in
samples obtained by laser capture microdissection microscopy (LCMM). The most
commonly used qRT-PCR methods are the SYBR Green and dual-labeled probe
(Taqman) approaches. Both approaches use reverse transcription to convert mRNA to
cDNA, followed by PCR amplification of the cDNA. This article describes steps
involved in aspects of qRT-PCR including (1) primer design, (2) primer and probe
performance testing, (3) qRT-PCR using the Corbett Rotor-Gene system, and (4) data
export and analysis.

136
Materials
Reagents Primers, forward and reverse, sequence-specific (25X; 7.5 µM)
Primer-probe mix
To make the primer-probe mix, adjust primers and dual-labeled probe to a 75X
concentration. For example, if it has been determined by optimization that the primers
work best at a final concentration of 300 nM, their concentration in the stock solution
should be 22.5 µM. Likewise, for a final 200 nM probe concentration, adjust its stock
solution to 15 µM. Mix equal volumes of each of the primers and probe just prior to each
assay.
QuantiTect SYBR Green RT-PCR kit (QIAGEN)
QuantiTect RT Mix (includes Omniscript Reverse Transcriptase and Sensiscript Reverse
Transcriptase)
2X QuantiTect SYBR Green RT-PCR Master Mix (includes HotStarTaq DNA pol,
QuantiTect SYBR Green RT-PCR Buffer, dNTP mix, including dUTP, SYBR
Green I, ROX passive reference dye, 5 mM MgCl2)
RNase-free H2O
QuantiTect Multiplex RT-PCR Kit (QIAGEN) (optional; for multiplex reactions with
three or more primer-probe sets)
RNA diluted to less than 5 ng/µl
RNA (diluted to <5 ng/µL) that has been isolated from microdissected biofilms

137
Target gene DNA (positive control template for qRT-PCR; see Steps 19, 21, and 23)
Equipment:
Computer (Internet-connected)
Ice
Microcentrifuge tubes and caps, 100 µL (Corbett Life Science)
Real-time PCR system
Rotor-Gene 3000 or 6000 (or equivalent) (Corbett Life Science)
PC
Software
Internet Resources:
The following web resources are particularly useful for designing qRT-PCR primers and
probes:
Primer3Plus (http://www.bioinformatics.nl/cgi-bin/primer3plus/primer3plus.cgi)
(Rozen and Skaletsky 2000); mfold (http://frontend.bioinfo.rpi.edu/applications/mfold/)
(Zuker 2003); IDT OligoAnalyzer (http://www.idtdna.com/scitools/scitools.aspx); and
BLAST (http://blast.ncbi.nlm.nih.gov/Blast.cgi).
For additional information regarding qRT-PCR using the Corbett Rotor-Gene
system and data analysis software, see the Corbett Life Science website
(http://www.corbettlifescience.com). A useful source of information from other qRT-
PCR users is the discussion group QPCR listserver (http://tech.groups.yahoo.

138
com/group/qpcrlistserver/?v=1&t=search&ch=web&pub=groups&sec=group&slk=1)
and the qPCR reference website http://www.gene-quantification.info/).
Method
Primer and Dual-labeled Probe Design Primer and dual-labeled probe specificity and performance are crucial to accurate
qRT-PCR. Test the properties of primers and probes in silico before purchase. Then
evaluate the primer-probe combinations for performance in qRT-PCR.
In Silico Design of PCR Primers and Dual-Labeled Probes 1. Paste the sequence name and gene sequence of interest into the appropriate boxes
within the "Main" tab of Primer3Plus.
2. In the "General Settings" tab, modify the following parameters:
i. Specify product size.
The recommended product size for SYBR Green analysis is between 190 bp
and 250 bp, optimally 225 bp. The recommended product size for dual-labeled
probe analysis is between 70 bp and 120 bp, optimally 80 bp.
ii. Specify primer G+C content of 45%-55%.
This parameter should be relaxed if a primer sequence cannot be found under
this restriction.
iii. Use the default settings for other parameters in General Settings.
3. In the "Advanced Settings" tab, modify the following parameters:
i. Set "Max Poly-X" = 3.

139
ii. Set "Number to return" = 10.
iii. Set "Max 3' Stability" = 8.
iv. (Optional) For additional design stringency, set "Max Self
Complementarity" = 3.
v. (Optional) For additional design stringency, set "Max 3' Self
Complementarity" = 0.
vi. The default settings may be used for other parameters in Advanced
Settings.
The parameters may also be modified or relaxed to obtain primers and
probes for difficult gene sequences.
4. Use the "Internal Probe" tab when designing a dual-labeled hybridization probe.
Modify internal probe settings as follows:
i. "Hyb Oligo Size" = minimum 20, optimum 26, maximum 30.
ii. "Hyb Oligo Tm" = minimum 67, optimum 68, maximum 70.
iii. "Hyb Oligo Max Poly-X" = 3.
Virtual Evaluation of Primers 5. After the primers have been designed, check them for the following characteristics:
i. Primers should have a G+C content close to 50%.
ii. Primers should not contain strings of the same base longer than 3
nucleotides.
iii. Each primer should not have more than two to three Gs or Cs in the last
five bases of its 3' end.

140
iv. Primers should not contain a T at the 3' end.
v. Primers should not fold into secondary structures, including high-energy
hairpins (test with mfold or IDT OligoAnalyzer). The melting temperature
(Tm) for secondary structures that do form should be lower than the
temperatures used during reverse transcription and cycling.
vi. Primers should be specific for their target. Run a computer search (e.g.,
with BLAST) against the genome of the target DNA sequence to verify
that each primer and particularly the 8-10 bases of their 3' end are unique.
vii. Primers should be near the 3' end of the cDNA to avoid RNA degradation
problems.
6. Evaluate the target gene sequence.
i. The melting temperature (Tm) for secondary structures that form should
be lower than the temperatures used during reverse transcription and
cycling.
ii. The G+C content should be ~50%.
iii. There should be no strings with more than five identical bases in the
sequence.
Virtual Evaluation of Dual-labeled Probes
7. After the probe has been designed, check it for the following characteristics:
i. The probe should have a 3' phosphate group to eliminate the possibility of
the probe acting as a primer and extending.

141
ii. The probe-template hybrid should have a Tm that is 8°C -10°C higher than
the Tm for the primer-template hybrids.
iii. The 5' end of the probe should not have a G residue.
iv. The probe sequence should not have more G than C residues. If it does,
switch the template strand to which the probe hybridizes.
8. After evaluating the primers in silico, test their performance in a SYBR Green-
based qRT-PCR using each primer at 300 nM (see Steps 19 and 20). The reaction
should produce significantly increased fluorescence (as much as 50-fold higher than
baseline fluorescence) and a low threshold cycle (CT) value.
See Troubleshooting.
9. Evaluate amplicon characteristics by melt curve analysis (see Step 20ii). It is
important for the melt curve profile to have only one peak.
The melt curve is a measure of the change in fluorescence of the PCR products as
temperature increases; a melt curve of a reaction that produces a single amplicon
will have only one peak, at the Tm of the specific PCR product.
10. Check the specificity of RT-PCR product(s) by agarose gel electrophoresis. A
single band, representing the specifically amplified product, should be visible. Use
a gel that can resolve this band from nonspecifically amplified bands.
11. Check the reaction efficiency. Create a standard curve by performing qRT-PCR
with template that has been serially diluted over five to seven orders of magnitude.
Use the slope of the standard curve to calculate efficiency:
i. Efficiency = 10(-1/slope)-1

142
ii. The resulting efficiency should fall between 90% and 110%.
12. Ensure good assay linearity and sensitivity. Linearity is measured by the r2 value
derived from the standard curve regression analysis. Sensitivity refers to the last
standard that retains linear characteristics, giving a measure of the detection and
quantification limits of the assay.
13. Optimize and/or redesign primer pairs that fail to perform as desired.
Dual-Labeled Probe Performance
14. After evaluating the primers and probe in silico, test primer performance in the
absence of the probe by using the SYBR Green-based assay (Steps 19 and 20).
15. Select a primer pair with good performance characteristics, and use them to test the
probe in dual-labeled probe-based qRT-PCR using the probe at 200 nM (Steps 21
and 22). The reaction should produce a two- to fivefold increase in fluorescence and
a low CT value.
See Troubleshooting.
16. Optimize and/or redesign primer-probe sets that fail to perform well.
Multiplex Assay Performance 17. To determine if primer-probe sets can be used together in multiplex reactions, select
two or more primer-probe sets with excellent performance characteristics in
singleplex reactions (see Steps 14-16). Test their performance in a multiplex
reaction using dual-labeled probe-based qRTPCR as described in Steps 21 and 22.

143
Ensure that all primer-probe sets have similar reaction efficiencies in singleplex
reactions before using them together in a multiplex reaction (see Step 11).
18. Check the performance of the primer-probe sets in the multiplex reaction; their
reaction characteristics should be similar to those obtained in singleplex reactions.
They should each produce a two- to fivefold increase in fluorescence and a low CT
value. Each primer-probe set should show good reaction efficiency (see Step 11).
See Troubleshooting.
qRT-PCR
Three methods for qRT-PCR are described here: the SYBR Green method (Steps 19
and 20), the duallabeled probe approach (Steps 21 and 22), and the multiplex dual-
labeled probe approach (Steps 23 and 24). Use the primers and probes designed in Steps
1-7, and follow the steps below in combination with the recommendations from the
thermal cycler’s manufacturer.
SYBR Green Based qRT-PCR
19. Assemble the following 25-µL reaction in a 100-µL microcentrifuge tube on ice:
If the RNA volume is changed, ensure a final reaction volume of 25 µL by adjusting
the amount of RNAse-free H2O.
In addition to the samples to be analyzed, include a negative control reaction
without RNA, a DNA contamination control reaction for each sample without RT
mix, and a positive control reaction in each assay.

144
RNAse-free water 5.25 µL 2x QuantiTect SYBR Green RT-PCR mix 12.5 µL 25x Forward primer 1 µL 25x Reverse primer 1 µL QuantiTect RT mix 0.25 µL RNA 5 µL Total 25 µL
20. Perform the RT-PCR.
i. Program the thermal cycler to perform the following reverse transcription
and PCR cycles. Acquire fluorescence data during the 72ºC extension.
No. of cycles
Reverse Transcription
Denaturation Annealing Extension
1 30 min at 50ºC
1 15 min at 95ºCa
45 15 sec at 94ºC
30 sec at annealing temperature (ideally 60ºC)b
30 sec at 72ºC
aThe initial 15 min at 95ºC is to activate the HotStarTaq DNA polymerase. bAnnealing temperature depends on primer melting temperatures.
ii. Verify the specificity and identity of the RT-PCR products by performing
a melt curve analysis: Add a melting step that ramps from 72ºC to 99ºC,
rises by 1ºC in each step, and waits for 30 sec on the first step and 5 sec
each step afterward.
iii. Set the gain of the SYBR Green channel at 10 and do not perform a gain
optimization.
21. Assemble the following 25-µL reaction in a 100-µL microcentrifuge tube on ice:
If the RNA volume is changed, ensure a final reaction volume of 25 µL by adjusting
the amount of RNAse-free H2O.
145
In addition to the samples to be analyzed, include a negative control reaction (one
without RNA), a DNA contamination control reaction (one without RT mix), and a
positive control reaction in each assay.
RNAse-free H2O 6.25 µL
2X QuantiTect Probe RT-PCR Master Mix 12.5 µL
Primer-probe mix 1 µL
QuantiTect RT mix 0.25 µL
RNA 5 µL
22. Perform the RT-PCR.
i. Program the thermal cycler to perform the following reverse transcription
and PCR cycles. Acquire fluorescence data during the annealing step.
No. of
cycles
Reverse
Transcription
Denaturation Annealing/Extension
1 30 min at 50ºC
1 15 min at 95ºCa
45 15 sec at 94ºC 60 sec at annealing temperature
(ideally 60ºC)b
aThe initial 15 min at 95ºC is to activate the HotStarTaq DNA polymerase. bAnnealing temperature depends on primer melting temperatures.
ii. Perform a gain optimization on the tube position with highest template
concentration before the first acquisition.

146
Multiplex Dual-Labeled Probe-Based qRT-PCR
23. Assemble the following 25-µL reaction in a 100-µL microcentrifuge tube on ice:
If the RNA volume is changed or more primer-probe mixes are used, ensure a final
reaction volume of 25 µL by adjusting the amount of RNAse-free H2O.
In addition to the samples to be analyzed, include a negative control reaction
without RNA, a DNA contamination control reaction for each sample without RT
mix, and a positive control reaction in each assay.
For multiplex reactions that use three or more primer-probe sets, the QuantiTect
Multiplex RTPCR kit is available.
RNAse-free H2O 5.25 µL
2X QuantiTect Probe Master Mix 12.5 µL
Primer-probe mix A 1 µL
Primer-probe mix B 1 µL
QuantiTect RT mix 0.25 µL
RNA 5 µL
24. Perform the RT-PCR.
i. Program the thermal cycler to perform the following reverse transcription
and PCR cycles. Acquire fluorescence data during the annealing step.

147
No. of
cycles
Reverse
Transcription
Denaturation Annealing/Extension
1 30 min at 50ºC
1 15 min at
95ºCa
45 15 sec at
94ºC
30 sec at annealing temperature
(ideally 60ºC)b
aThe initial 15 min at 95ºC is to activate the HotStarTaq DNA polymerase. bAnnealing temperature depends on primer melting temperatures.
ii. Perform a gain optimization on the tube position with highest template
concentration before the first acquisition.
Data Analysis
Two methods for analyzing the qRT-PCR data with Corbett’s Rotor-Gene
software are presented here. For the Standard Curve Analysis (Steps 25-32), a standard
calibration curve must be included in the assay. In Comparative Quantitation Data
Analysis (Steps 33-38), the relative concentrations of samples are determined without a
calibration curve and without threshold lines. Consult the help menu of the Rotor-Gene
software for more information about these analysis methods.
Standard Curve Analysis
25. Determine the starting amounts for each dilution of the standard curve. Assign a
concentration to each standard within the "Edit Sample" menu of the Rotor-Gene
software.

148
These assigned concentrations can be arbitrary, following the dilution pattern of
the sample (i.e.100, 10, and 1 ng/µL, for a 10-fold dilution series). They can also be
relative concentrations derived from transcript-calculated copies when using
transcript-specific standards.
26. Identify and label unknown samples within the "Edit Sample" menu.
27. When acquiring data from multiple channels (i.e., in multiplex assays), assign a
page to each channel within the "Edit Sample" menu; this will allow a separate
analysis per channel.
28. Under the "Analysis" window, select the "Quantitation" tab. Select the appropriate
channel and choose a page to analyze.
29. Ensure that all standards have been selected for analysis, and then use the
"Autofind" feature located on the right side of the screen to calculate the position of
the threshold line.
30. When running a series of assays over a period of time, select the threshold from an
assay with good linearity and low variability (<12%) among standards.
31. Select all samples and export the data from the "Quantitative Result" window into
spreadsheet program.
32. Combine technical replicates by calculating the geometric mean or by using the
"replicate calculated value" given by the Rotor-Gene software.
Comparative Quantitation Data Analysis
33. Under the "Analysis" window of the Rotor-Gene software, and under the "Other"
tab, select the "Comparative Quantitation" tool.

149
34. Select the appropriate channel and choose a page to analyze.
35. Select all samples and export the data from the "Comparative Quantitation" window
into a spreadsheet program.
36. Combine technical replicates by calculating the geometric mean or by using the
"replicate calculated value" given by the Rotor-Gene software.
37. Consider using samples with reaction amplification above 1.6, and screen for
unusually low takeoff numbers.
A 100% efficient reaction has a reaction amplification value of 2.
38. Log-transform (LT) the threshold cycle (CT) values using the following equation:
LT = (amplification-takeoff)*1010, where 1010 is an arbitrary value.
Troubleshooting
Problem: Primers do not perform well at 300 nM.
[Step 8]
Solution: Optimize the working concentrations of the primers.
1. Develop a matrix in which one primer is tested at various concentrations while
the other primer is kept at one concentration. Do this for both primers.
2. Final primer concentrations to test are: 50 nM, 100 nM, 300 nM, 600 nM, and
900 nM.
3. Choose primer concentrations that result in the highest increase in fluorescence
and the lowest CT value.
Problem: Primer-probe set does not perform well.
[Step 15]

150
Solution: Optimize the working concentration of the probe.
1. Develop a matrix in which both primers are kept at a constant concentration
while the concentration of the probe is modified.
2. Final probe concentrations to test are: 50 nM, 100 nM, 200 nM, and 300 nM.
3. Select the primer-probe combination that results in the highest increase in
fluorescence and the lowest CT value.
Problem: Primer-probe sets perform worse in multiplex reactions than in singleplex
reactions.
[Step 18]
Solution: Optimize the multiplex reaction by varying the ratios between primer sets. To
do this, keep primer and probe concentrations constant but alter the ratio between sets
until all sets have reaction characteristics similar to those obtained in singleplex
reactions.
Discussion
Because qRT-PCR is an important approach for studying gene expression of
bacteria in their native environments, it has been applied to many studies in
environmental microbiology (2, 5, 7). qRT-PCR is very sensitive (it can detect as few as
100 RNA transcripts), so it is particularly useful for biofilm research, where gene
expression can be quantified directly from very little starting material, as in subsections

151
of biofilms obtained by LCMM (3). For such quantitation to be accurate, it is important
that appropriate protocols be used (1, 4, 6).
This article describes two qRT-PCR methods: the SYBR Green and dual-labeled
probe approaches. In SYBR Green-based qRT-PCR, a fluorescent dye binds to double-
stranded DNA in the PCR, and a CT value is obtained during exponential increase in the
number of amplicons. In the dual-labeled probe approach, a probe specific for the PCR
product, containing a fluorescent label and a fluorescencequenching molecule, is
degraded by Taq polymerase as the amount of PCR product increases. This degradation
results in an increase in fluorescence intensity from which a CT value may be obtained.
Although the SYBR Green approach is cost-effective, the dual-labeled probe
approach allows analysis of multiple genes simultaneously (multiplexing), because
different fluorescently labeled probes can be used for different genes.
Acknowledgements
We thank Kerry Williamson and Kathleen McInnerney for their help in developing
these protocols. This work was supported by Public Health Service grant AI-065906
(MJF) from the National Institute of Allergy and Infectious Diseases, and the American
Society for Microbiology Robert D. Watkins Graduate Research Fellowship (APL). We

152
acknowledge the Montana State University INBRE Functional Genomics Core Facility
supported by NIH grant P20-RR16455.

153
References Cited
1. Bustin, S. A. 2004. An A-Z manual of Quantitative PCR. IUL Press, La Jolla,
CA. 2. Fey, A., S. Eichler, S. Flavier, R. Christen, M. G. Hofle, and C. A. Guzman.
2004. Establishment of a real-time PCR-based approach for accurate quantification of bacterial RNA targets in water, using Salmonella as a model organism. Appl Environ Microbiol 70:3618-23.
3. Lenz, A. P., K. Williamson, B. Pitts, P. S. Stewart, and M. J. Franklin. 2008.
Localized gene expression in Pseudomonas aeruginosa Biofilms. Appl Environ Microbiol. 74:4463-4471.
4. Livak, K. J., and T. D. Schmittgen. 2001. Analysis of Relative Gene
Expression Data Using Real-Time Quantitative PCR and the 2-[Delta][Delta]CT Method. Methods 25:402-408.
5. Matsuda, K., H. Tsuji, T. Asahara, Y. Kado, and K. Nomoto. 2007. Sensitive
Quantitative Detection of Commensal Bacteria by rRNA-targeted Reverse Transcription (RT)-PCR. Appl Environ Microbiol. 73:32-39.
6. Nolan, T., R. E. Hands, and S. A. Bustin. 2006. Quantification of mRNA
using real-time RT-PCR. Nat Protoc 1:1559-82. 7. Roussel, Y., A. Harris, M. H. Lee, and M. Wilks. 2006. Novel methods of
quantitative real-time PCR data analysis in a murine Helicobacter pylori vaccine model. Vaccine 25:2919-2929.
8. Rozen, S., and H. Skaletsky. 2000. Primer3 on the WWW for general users
and for biologist programmers. Methods Mol. Biol., 132:365-386. 9. Zuker, M. 2003. Mfold web server for nucleic acid folding and hybridization
prediction. Nucleic Acids Research 31:3406-3415.