Embed Size (px)
Citation preview
METHODSpublished: 16 February 2016
doi: 10.3389/fphys.2016.00044
Frontiers in Physiology | www.frontiersin.org 1 February 2016 | Volume 7 | Article 44
Edited by:
Paolo Allegrini,
Consiglio Nazionale delle Ricerche,
Italy
Reviewed by:
Maarten Wijnants,
Radboud University Nijmegen,
Netherlands
Malgorzata Turalska,
Duke University, USA
*Correspondence:
Anirban Bhaduri
Specialty section:
This article was submitted to
Fractal Physiology,
a section of the journal
Frontiers in Physiology
Received: 22 September 2015
Accepted: 01 February 2016
Published: 16 February 2016
Citation:
Bhaduri A and Ghosh D (2016)
Quantitative Assessment of Heart Rate
Dynamics during Meditation: An ECG
Based Study with Multi-Fractality and
Visibility Graph. Front. Physiol. 7:44.
doi: 10.3389/fphys.2016.00044
Quantitative Assessment of HeartRate Dynamics during Meditation: AnECG Based Study withMulti-Fractality and Visibility GraphAnirban Bhaduri 1* and Dipak Ghosh 1, 2
1Deepa Ghosh Research Foundation, Kolkata, India, 2C. V. Raman Centre for Physics and Music, Jadavpur University,
Kolkata, India
The cardiac dynamics during meditation is explored quantitatively with two chaos-based
non-linear techniques viz. multi-fractal detrended fluctuation analysis and visibility
network analysis techniques. The data used are the instantaneous heart rate (in
beats/minute) of subjects performing Kundalini Yoga and Chi meditation from PhysioNet.
The results show consistent differences between the quantitative parameters obtained
by both the analysis techniques. This indicates an interesting phenomenon of change
in the complexity of the cardiac dynamics during meditation supported with quantitative
parameters. The results also produce a preliminary evidence that these techniques can
be used as a measure of physiological impact on subjects performing meditation.
Keywords: meditation, ECG, MF-DFA, visibility graph, fractal
1. INTRODUCTION
The control of thought, attention and emotion is a difficult problem. Thinking of nothing or rathernot thinking of something, is the most difficult challenge faced by every human being at differentstages of life. An accomplished football player, a singer, musician, physicist or amedical surgeon: theperformance of all of them depends only on their ability to focus or concentrate. This concentration,in turn, is largely dependent on their ability to resist distraction and controlling of their impulsesand emotions. Meditation often involves an internal effort to self-regulate the mind in some way.Meditation, though for a long time was avoided as a scientific theme due to its complex natureand religious connotations, is studied with different neuro-scientific experimental tools, in therecent times. Moreover, it is often said to be influencing stress-dependent diseases such as anxiety,hypertensive disorders, tension headaches etc. It has been an intriguing source of discussion in therecent literature of neuroscience (Lutz, 2008; Grant et al., 2013; Berger, 2014). Meditation has beendescribed as a clinically relevant method for the cure of stress-related problems (Everly and Lating,2012) and its clinical effectiveness is also established in different research works (Austin, 1998).
In-spite of numerous popular reports, scientific research in the area of assessing potential healthbenefits of various types of meditation methods, is scanty in the domain of physiologic effects. Wepropose to analyse the non-stationary cardiac dynamics during meditation quantitatively, with twochaos-based non-linear techniques viz. multi-fractal detrended fluctuation analysis and visibilitynetwork analysis.
The rest of the paper is organized as per following. Section 2.1 describing previous works insimilar area of research, Section 2.2 describing the non-linear methods in the light of Chaos Theory,Section 2.3 showing how we have calculated the MF-DFA (multi-fractal detrended fluctuation

Bhaduri and Ghosh Heart Rate Dynamics during Meditation
analysis) parameter, Section 2.4, detailing out the visibilitygraph technique, Section 3.1 describing the data and Section3.2 discussing the results. The paper ends with discussion andconclusion in Section 4.
2. MATERIALS AND METHODS
2.1. Earlier Works and MethodsProbably a first of its kind of analysis of the heart ratedynamics during meditation was reported by Peng and Mietus(1999) measuring the heart beat signals of subjects performingKundalini Yoga and Chi meditation. In a further work by Pengand Henry (2004), it was suggested that different meditationsevoke common effects on the heart rate, supporting the conceptof a meditation paradox with a variety of meditative techniquesproducing active instead of quiescent cardiac dynamics.
The findings of Peng was interesting but conventionalmethods like Fourier analysis were used as techniques for analysiswhich had been challenged for quite sometime for non-stationarysignals.
In any signal the spectrum may cover wide range offrequencies and also includes the spurious harmonics which isgenerally left unattended during analysis with the conventionalmethods. As for example Fourier spectral analysis is based onlinear super-positions of trigonometric functions. Additionalharmonic components, as is common in most natural non-stationary time-series of which heart rate signal is not anexception, may produce a deformed wave profile. Thosedeformations are the well known consequence of non-linearcontributions. Thereby application of conventional and standardmethodology to analyse a time series like heart beat where non-stationary and non-linear components induce spurious harmoniccomponents, makes little sense with respect to the results (Sarkarand Barat, 2008; Conte et al., 2009).
In the recent years, we have witnessed a spur of interest instudying complex systems, natural or man-made in the lightof rigorous chaos based non-linear methods. A lot of workshad been reported where the study of EEG, ECG, or EMGhad been done with non-linear methodologies (Acharya et al.,2005; Ahmadlou et al., 2010; Rodriguez-Bermudez and Garcia-Laencina, 2015). Jiang et al. (2013) had studied heart beat signalsusing visibility graph methods but no quantitative assessmenton the change of ECG patterns due to meditation had beenanalyzed.
In view of this we attempt to quantify the change of heart-beatpatterns during meditation with data for Chi and Kundalini Yogausing two most recent and rigorous techniques.
2.2. Chaos Fractals and Non-LinearMethodsThe word fractal was first introduced by Mandelbrot and Ness(1968). Fractal is a geometrical pattern which is repeated atsmall or large scales to produce self similar irregular shapes orsurfaces that Euclidean geometry cannot explain. Such fractalstructures can be seen in natural objects such as a fern leaves,trees, snow-flakes and even clouds or galaxies in space. The
most important feature of fractals is its property of self-similarity. An arbitrary region of a fractal looks very similarbut not necessarily identical to the entire region. Fractals canbe classified into two categories : mono-fractals and multi-
fractals. Mono-fractals are those whose scaling propertiesare same in different regions of a system. Multi-fractals
are complicated self-similar objects, consisting of differentlyweighted fractals, with different non-integer dimensions. Thus,the fundamental characteristic of multi-fractality is that thescaling properties may be different in different regions. Therebya single scaling exponent can not describe the dynamics,with the minutest detail. Many natural systems do notshow mono-fractal properties and thereby requires a multi-fractal analysis of the data as proposed by Kantelhardt et al.(2002).
Calculation of fractal dimension or rather measuring the selfsimilarity had been a major area in the field study of chaos. Tilldate there are several methods proposed for measuring FractalDimension (FD).
1. Spectral Analysis2. Rescaled Range Analysis3. Fluctuation Analysis (FA)4. Detrended Fluctuation Analysis (DFA)5. Wavelet Transform Modulus Maxima (WTMM)6. Detrended Moving Average (DMA) etc7. Multi-fractal Detrended Fluctuation Analysis (MF-DFA)8. The latest addition in the above list is PSVG or Power of
Scale-freeness of a Visibility Graph.
2.3. Multi-Fractal Detrended FluctuationAnalysisMulti-Fractal Detrended fluctuation analysis algorithm wasdeveloped for detecting the long-range correlation and thefractal properties in stationary and non-stationary time series(Hausdorff et al., 1996). The first successful application ofMultifractal Detrended Fluctuation Analysis (MF-DFA) methodwas done by Kantelhardt et al. (2002) during the study ofthe scaling behavior of various non-stationary scale invarianttime series. Following are the steps for Calculation of width
of mutifractal spectrum used here to analyse the heart-beatdynamics.
1. Suppose for each sample signal x(i) for i = 1, 2, . . . ,N, is thewaveform of N time instants . The mean of this time-series iscalculated as x̄ = 1
N
∑Ni=1 x(i) Then the integrated series is
computed as per Equation 1 of Kantelhardt et al. (2002).
Y(i) =
i∑
k=1
[x(k)− x̄], i = 1, 2, . . . ,N
2. The integrated time series is divided into Ns non-overlappingbins (where Ns = int(N/s) and s is the length of the bin) andthe fluctuation function is computed. For each s the local RMSvariation is calculated as function F(s, v) as per Equation 2 of
Frontiers in Physiology | www.frontiersin.org 2 February 2016 | Volume 7 | Article 44

Bhaduri and Ghosh Heart Rate Dynamics during Meditation
Kantelhardt et al. (2002).
F2(s, v) ≡1
s
s∑
i=1
{Y[(v− 1)s+ i]− yv(i)}2,
where i = 1, 2, . . . , s and v = 1, 2, . . . ,Ns
Here yv(i) is the least square fitted polynomial of the bin v.yv(i) is defined as yv(i) =
∑mk=0 Ck(i)
m−k, where Ck is the kthco-efficient of the fit polynomial with degree m. Here we havetakenm as 1.
3. The qth order overall RMS variation for each scale s, is denotedby Fq(s) which is calculated as per Equation 4 of Kantelhardtet al. (2002) as shown below.
Fq(s) ≡
{
1
Ns
Ns∑
v=1
[F2(s, v)]q2
}
1q
For our experiment we have calculated q-th order RMSvariation Fq(s) for 100 equidistant values of q in between therange of−5 to+5.
4. The steps 2 and 3 are repeated and Fq(s) is calculated forvarious values of s. If the time-series is long range co-related,the Fq(s) vs. s for each q, will show power law behavior asbelow.
Fq(s) ∝ sh(q)
If such a scaling exists log2(Fq(s)) will depend linearly onlog2 s, where h(q) is the slope. The exponent h(q) depends onq. Here h(q) is the generalized Hurst exponent. This h(q) ofMF-DFA is related to the scaling exponent τ(q) as per Equation13 of Kantelhardt et al. (2002) as shown below.
τ(q) = qh(q)− 1
5. Multi-fractal signal have multiple Hurst exponents, hence τ(q)depends non-linearly on q. If α is singularity strength andthe singularity spectrum is f (α), f (α) is related to h(q) as perEquation 15 of Kantelhardt et al. (2002).
α = h(q)+ qh′(q) and f (α) = q[α − h(q)]+ 1
The resulting multi-fractal spectrum f (α) is an arc where thedifference between themaximum andminimum α is called themulti-fractal spectrum width. The width of the spectrum givesa measure of the multi-fractality of the time-series. Greatervalue of this width indicates presence of greater amount ofmulti-fractality in the series.
MF-DFA method is a robust tool to perform scaling analysis incase of non-linear time-series. Results obtained by this methodturn out to be more reliable in comparison to methods likewavelet analysis, discrete WT, WTMM, DMA, BMA, MDFA,CDFA etc (Kantelhardt et al., 2002; Oswiecimka et al., 2006;Serranoa and Figliola, 2009; Huang et al., 2011). The onlylimitation of this technique is that it requires longer time-serieswhich is sometimes difficult to obtain from real dataset. In the
present work we make comparisons between the multi-fractalspectral width derived from the heart rate signals and discuss thevisible differences.
2.4. Visibility GraphA radically different but rigorous method named Visibility graphanalysis is reported by Lacasa et al. (2008). Recently this methodis extensively used over finite time-series data set and hasproduced reliable result in several domains of science and socialscience as well. Visibility graph is a simple method to convert afractal time series into a scale-free graph, and its structure hasbeen shown to be related to the fractality (self-similarity) andcomplexity of the time series (Lacasa et al., 2008; Dick, 2012).The reliability of this methodology has been confirmed withextensive simulation of artificial fractal series and real (small)series concerning Gait disease Lacasa et al. (2009).
In a visibility graph each node of the graph represents atime sample of the time series, and an edge between two nodesshows the corresponding time samples can view each other. Thevisibility graph algorithm maps time series X to its VisibilityGraph. Suppose the ith point of the time series is Xi. Two vertices(nodes) of the graph,Xm andXn, are connected via a bidirectionaledge if and only if the below equation is valid.
Xm+j < Xn + (n− (m+ j)
n−m) · (Xm − Xn) (1)
where ∀j ∈ Z+ and j < (n−m)
As shown in Figure 1 Xm and Xn can see each other if theEquation 1 is satisfied. According to the logic the two sequentialpoints of the time series can see each other hence all sequentialnodes are connected together.
We should be converting the time series to positive planesas the above algorithm is valid for positive X-values in the timeseries.
As per the definition of a degree of a node in the graph - VGis the number of connections or edges the node has with othernodes. The degree distribution P(k) of overall network formedfrom the time series is then the fraction of nodes with degree k inthe network. Thus if there are a total of n nodes the network andnk of them have degree k, we have P(k) = nk/n.
We say that two quantities satisfy the power law where onequantity varies as a power of another. The scale-freeness propertyof Visibility Graph states that the degree distribution of its nodes
FIGURE 1 | Visibility Graph for time series X.
Frontiers in Physiology | www.frontiersin.org 3 February 2016 | Volume 7 | Article 44
Bhaduri and Ghosh Heart Rate Dynamics during Meditation
satisfies Power Law i.e., P(k) = k−λp , where λp is a constantand it is known as Power of Scale-freeness in Visibility Graph
(PSVG). PSVG, denoted by λp here, which is calculated as thegradient of log2[P(k)] vs. log2[1/k], corresponds to the amountof complexity as well as fractality of the time series, and alsoindicates the FD or the Fractal Dimension of the signal Lacasaet al. (2008, 2009). Ahmadlou et al. applied the visibility graphalgorithm to convert time series to graphs, while preserving thedynamic characteristics such as complexity (Ahmadlou et al.,2010). The concept that each pattern and behavior in a fractaltime series is repeated frequently, in different scales, has beenproved by Ahmadlou et al. for visibility graph, by calculatingthe PSVG-s of a time series in multiple scale (Ahmadloua et al.,2012).
It has been proved that there exists a linear relationshipbetween the PSVG- λp and the Hurst exponent H of theassociated time series (Lacasa et al., 2009). Therefore, thevisibility algorithm provides an alternative method to computethe Hurst exponent. Also it has been shown, for example,that gait cycle (the stride interval in human walking rhythm)is a physiological signal that displays fractal dynamics andlong-range correlations in healthy young adults. The visibilityalgorithm predicts gait dynamics slow pace, in perfect agreementwith previous results based on the usual method of detrendedfluctuation analysis (Lacasa et al., 2009). The visibility graph isan algorithm that maps a time series into a graph. In doingso, classic methods of complex network analysis can be appliedto characterize time series from a brand new viewpoint. Graphtheory techniques can provide an alternative method to quantifylong-range dependence and fractality in time series.
The present work is devoted to the comparative analysis ofthe Power of Scale-freeness of Visibility Graph (PSVG) of normalheart rate time-series during different meditation states.
3. RESULTS
3.1. DataWe have taken the data from MIT-BIH Physionet databasehttp://physionet.org/physiobank/database/meditation/data/referred in the work done by Peng and Mietus (1999). The
detailed description of the data is available in the website. Itbasically contains Heart Rate (Beats/minute) data recorded forpre-meditation and meditation states, for two groups of subjectsperforming Chi and Kundalini Yoga meditation respectively.The naming convention for the data followed in the subsequenttexts of this paper are as per the website.
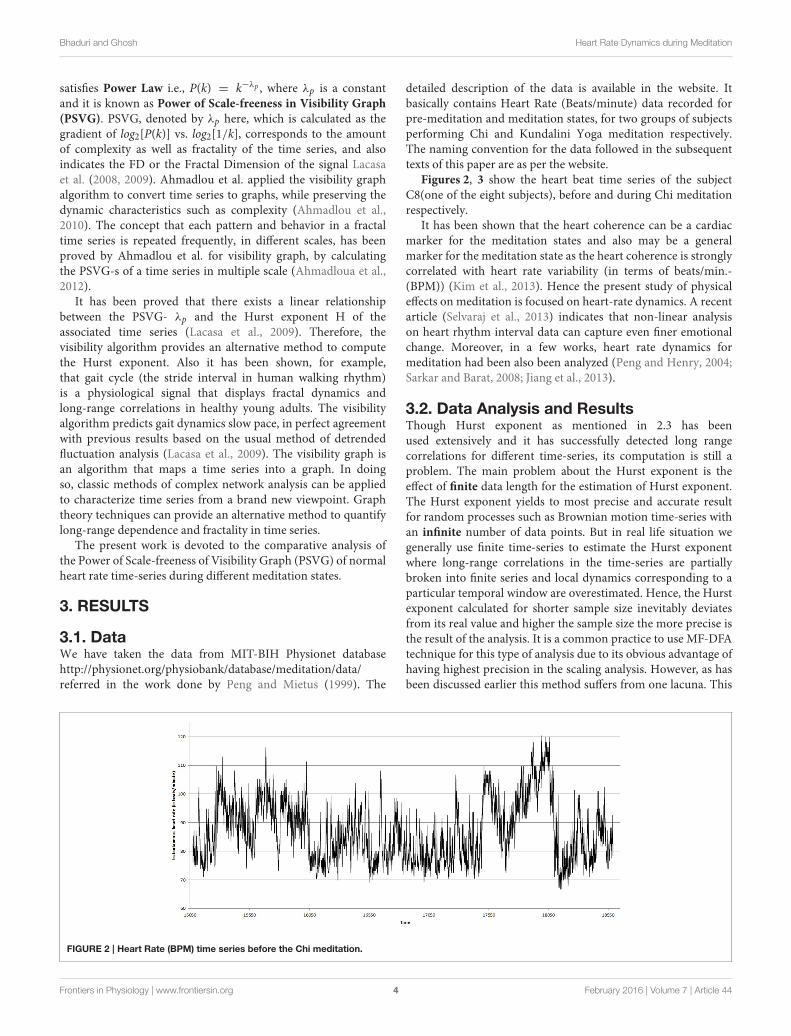
Figures 2, 3 show the heart beat time series of the subjectC8(one of the eight subjects), before and during Chi meditationrespectively.
It has been shown that the heart coherence can be a cardiacmarker for the meditation states and also may be a generalmarker for the meditation state as the heart coherence is stronglycorrelated with heart rate variability (in terms of beats/min.-(BPM)) (Kim et al., 2013). Hence the present study of physicaleffects on meditation is focused on heart-rate dynamics. A recentarticle (Selvaraj et al., 2013) indicates that non-linear analysison heart rhythm interval data can capture even finer emotionalchange. Moreover, in a few works, heart rate dynamics formeditation had been also been analyzed (Peng and Henry, 2004;Sarkar and Barat, 2008; Jiang et al., 2013).
3.2. Data Analysis and ResultsThough Hurst exponent as mentioned in 2.3 has beenused extensively and it has successfully detected long rangecorrelations for different time-series, its computation is still aproblem. The main problem about the Hurst exponent is theeffect of finite data length for the estimation of Hurst exponent.The Hurst exponent yields to most precise and accurate resultfor random processes such as Brownian motion time-series withan infinite number of data points. But in real life situation wegenerally use finite time-series to estimate the Hurst exponentwhere long-range correlations in the time-series are partiallybroken into finite series and local dynamics corresponding to aparticular temporal window are overestimated. Hence, the Hurstexponent calculated for shorter sample size inevitably deviatesfrom its real value and higher the sample size the more precise isthe result of the analysis. It is a common practice to use MF-DFAtechnique for this type of analysis due to its obvious advantage ofhaving highest precision in the scaling analysis. However, as hasbeen discussed earlier this method suffers from one lacuna. This
FIGURE 2 | Heart Rate (BPM) time series before the Chi meditation.
Frontiers in Physiology | www.frontiersin.org 4 February 2016 | Volume 7 | Article 44

Bhaduri and Ghosh Heart Rate Dynamics during Meditation
FIGURE 3 | Heart Rate (BPM) time series during Chi meditation, for the same subject.
theory demands that the length of the time-series to be analyzedhas to be infinite, whereas in real life this time-series is alwaysfinite because there is no other option. In this regard anotherradically different rigorous method—Visibility network analysis
(Lacasa et al., 2008, 2009) is extensively used over finite time-series data set and has produced reliable result in several domainsof science and social science.
As already mentioned the advantage of visibility graphtechnique is that it gives more accurate estimate of Hurstexponent compared to other method (MFDFA) as the theorydo not require an infinite series making this method a suitablefor analysis finite time series (with less number of data points).The reliability of this novel and new methodology is confirmedwith exhaustive numerical simulations as well as with analyticdevelopments as mentioned in Section 2.4.
Therefore, we have applied both the visibility graph analysisas well as theMF-DFA analysis primarily because :
1. MF-DFA and Visibility Graph are two different methods forassessing the degree of complexity of a non-linear time series.Though their approaches are radically different, both of themare rigorous, robust and reliable among the methods proposedso far.
2. MF-DFA requires long time series which is not usually thecases in most real life phenomena. Visibility Graph on theother hand can give reliable and robust results even with veryshort time series.
3. We opted for the visibility graph technique and not meanHurst exponent or DFA the mono-fractal parameter becauseas discussed it is a better technique for short sample sizesthan any other parameters. There is also a mathematicallyproven relationship between the PSVG parameter with theHurst exponent as mentioned in Section 2.4.
4. It is neither possible nor relevant to make a directcorrespondence between the two methods. While onemeasures the degree of fractality the other measures thedegree of multi-fractality. With both the methods havingtheir own limitations our objective is to use the twomethods and compare the results for the two states for thesubjects separately and showcase a method of quantifying the
physiological effects of meditation. Simultaneous analysis isbeneficial just for double checking. If results obtained fromone method follows the same pattern in a consistent fashionfor the subjects with that of the other method we wouldlike to justify the use of the two methods as a process fordouble-checking rather than cross-checking.
It is true that visibility network analysis has to be extendedfor tackling the multi-fractal behavior of time series whichhas not been possible so far though it needs mention thatAhmadloua et al. (2012) proposed analysis of PSVG values, basedon averaging of fractality of time series in different scales. Ageneralization to handle multi-fractal behavior of a structure byPSVG technique is yet to develop.
3.2.1. Analysis and Results with MF-DFA1. In our experiment (as described in Section 2.3) s varies from
16 as minimum to 256 as maximum value in log-scale.2. The width of multifractal spectrum has been calculated for
all the subjects, before and during Chi meditation of thesubject C8.
3. Figure 4 shows the width of multifractal spectrum obtainedfrom the BPM time series shown in Figure 2.
4. The widths of multifractal spectrum obtained for all thesubjects are tabulated in Table 1 under MF-DFA columns.
5. Figure 9 represents the comparative study of the values ofwidth of multifractal spectrum.
3.2.2. Analysis and Results with Visibility Graph1. First P(k) w.r.t. k is calculated as per the method in Section
2.4. Figure 5 shows P(k) w.r.t. k, calculated from BPM timeseries of subject C8 during Chi-meditation. It is evident that itis confirming to the Power Law.
2. The the Power of Scale-freeness in Visibility Graph (PSVG)is represented by the gradient of log2[P(k)] vs. log2[1/k] asshown in Figures 6, 7 for the same subject during and beforemeditation respectively.
3. These slopes are denoted by λmed and λpre for meditation andpre-meditation states. They are calculated for all subjects andis tabulated in Table 1.
Frontiers in Physiology | www.frontiersin.org 5 February 2016 | Volume 7 | Article 44

Bhaduri and Ghosh Heart Rate Dynamics during Meditation
FIGURE 4 | Multi-fractal Spectrum during Chi meditation for the same subject.
TABLE 1 | Pre and post meditation parameters as obtained by different techniques.
PSVG MF-DFA Shuffled MF-DFA
Subject Meditation λmed Pre-meditation λpre Meditation Pre-meditation Meditation Pre-meditation
C1 5.49 3.22 0.66 0.24 0.13 0.19
C2 3.83 2.95 0.43 0.21 0.08 0.09
C3 3.9 2.94 0.59 0.3 0.21 0.05
C4 3.96 2.61 0.45 0.39 0.05 0.02
C5 3.49 3.01 0.41 0.31 0.26 0.17
C6 3.89 3.12 0.28 0.28 0.14 0.14
C7 3.07 2.33 0.53 0.32 0.16 0.22
C8 3.89 3.45 0.68 0.43 0.09 0.11
Y1 5.19 1.42 − − − −
Y2 3.25 1.9 − − − −
Y3 3.6 2.28 − − − −
Y4 1.94 1.32 − − − −
4. Figure 8 represents the comparative study of the PSVG valuesas given in Table 1.
4. DISCUSSION
Figures 8, 9 shows that the width of mutifractal spectrum andPSVG values (also tabulated in Table 1) are visibly different fromeach other for meditation and pre-meditation states.
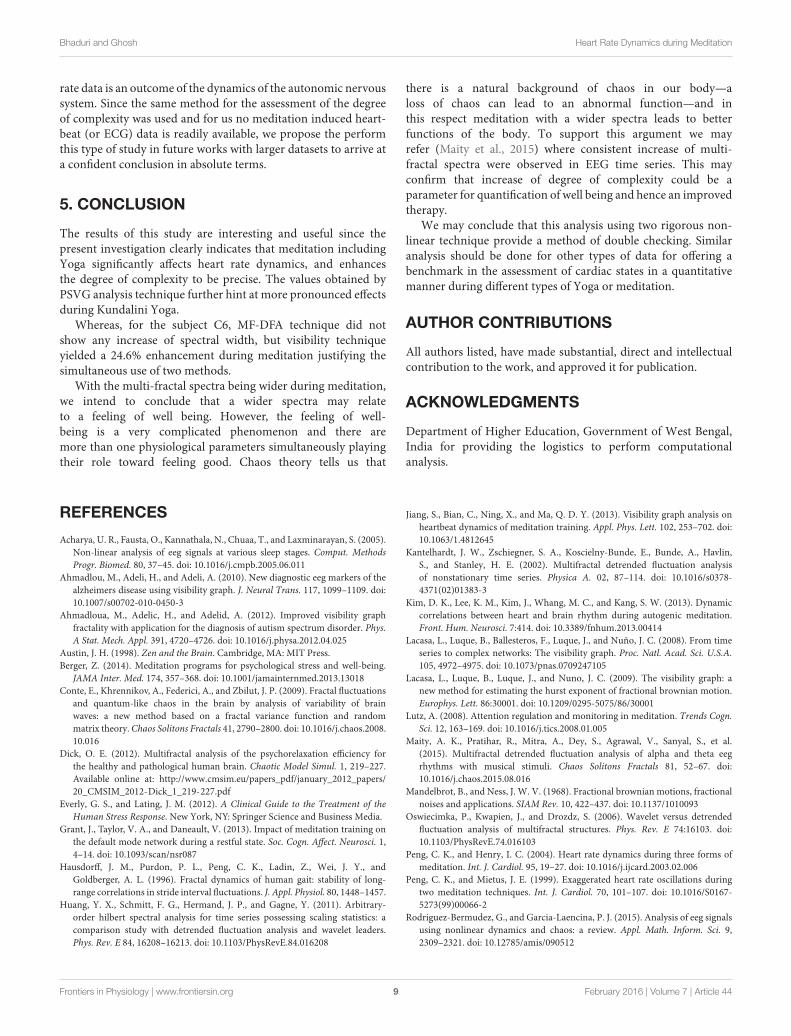
4.1. General1. We do not take serious cognizance of the results of MF-DFA
analysis on the data for the Kundalini Yoga as the samplesize is too low to give reliable results for MF-DFA analysis,where a large sample size is a prerequisite as discussed inSection 3.2. However, analysis on the data for Chi meditationis meaningful as the sample size is on the higher side for thosesubjects.
2. A simple correlation between the two methods for Chi-meditation is done to indicate a probable method of
cross-checking. A positive correlation of 0.64 as a whole, 0.4during meditation and 0.015 for pre-meditation is observed.However, analysis with bigger sample size with higher datapoints remains to be a scope for future work to produce aconsistent cross-checking method.
3. The MF-DFA results are also obtained for the shuffled time-series obtained from the original time-series 1 to provide abaseline for MF-DFA values and in case of shuffled series theresults clearly indicates that multi-fractal spectral widths areconsistently lower in case of shuffled time-series compared tothose of the original.
4. So far as visibility graph analysis is concerned there is noprerequisite for a large sample size. On the other hand, thismethod can give reliable results with as low as 400 data points(Jiang et al., 2013).
5. The PSVG values in most cases are more than 2 whichindicates that the complexity of the time-series underinvestigation is on the higher side. Similar higher values ofPSVG was reported by Lacasa et al. (2009).
Frontiers in Physiology | www.frontiersin.org 6 February 2016 | Volume 7 | Article 44

Bhaduri and Ghosh Heart Rate Dynamics during Meditation
FIGURE 5 | P(k) vs. k for the Heart Rate (BPM) time series during Chi meditation.
FIGURE 6 | log2P(k) vs. log2(1/k) for the Heart Rate (BPM) time series during Chi meditation.
FIGURE 7 | log2P(k) vs. log2(1/k) for the Heart Rate (BPM) time series before Chi meditation.
Frontiers in Physiology | www.frontiersin.org 7 February 2016 | Volume 7 | Article 44
Bhaduri and Ghosh Heart Rate Dynamics during Meditation
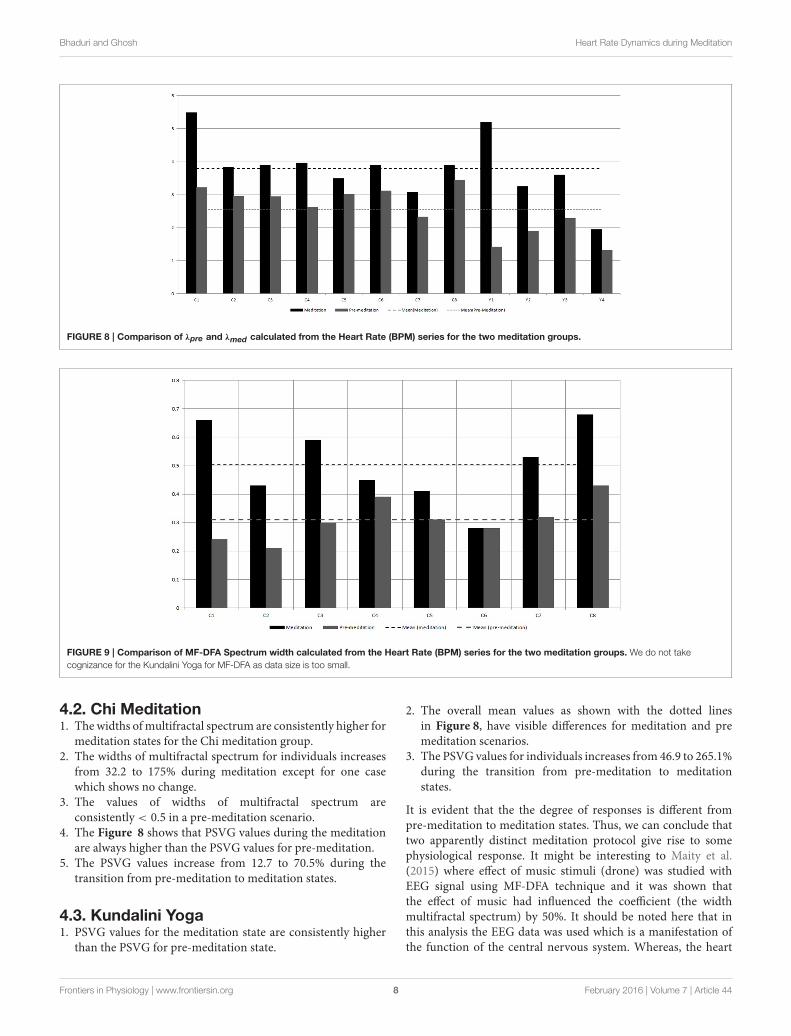
FIGURE 8 | Comparison of λpre and λmed calculated from the Heart Rate (BPM) series for the two meditation groups.
FIGURE 9 | Comparison of MF-DFA Spectrum width calculated from the Heart Rate (BPM) series for the two meditation groups. We do not take
cognizance for the Kundalini Yoga for MF-DFA as data size is too small.
4.2. Chi Meditation1. The widths ofmultifractal spectrum are consistently higher for
meditation states for the Chi meditation group.2. The widths of multifractal spectrum for individuals increases
from 32.2 to 175% during meditation except for one casewhich shows no change.
3. The values of widths of multifractal spectrum areconsistently < 0.5 in a pre-meditation scenario.
4. The Figure 8 shows that PSVG values during the meditationare always higher than the PSVG values for pre-meditation.
5. The PSVG values increase from 12.7 to 70.5% during thetransition from pre-meditation to meditation states.
4.3. Kundalini Yoga1. PSVG values for the meditation state are consistently higher
than the PSVG for pre-meditation state.
2. The overall mean values as shown with the dotted linesin Figure 8, have visible differences for meditation and premeditation scenarios.
3. The PSVG values for individuals increases from 46.9 to 265.1%during the transition from pre-meditation to meditationstates.
It is evident that the the degree of responses is different frompre-meditation to meditation states. Thus, we can conclude thattwo apparently distinct meditation protocol give rise to somephysiological response. It might be interesting to Maity et al.(2015) where effect of music stimuli (drone) was studied withEEG signal using MF-DFA technique and it was shown thatthe effect of music had influenced the coefficient (the widthmultifractal spectrum) by 50%. It should be noted here that inthis analysis the EEG data was used which is a manifestation ofthe function of the central nervous system. Whereas, the heart
Frontiers in Physiology | www.frontiersin.org 8 February 2016 | Volume 7 | Article 44
Bhaduri and Ghosh Heart Rate Dynamics during Meditation
rate data is an outcome of the dynamics of the autonomic nervoussystem. Since the same method for the assessment of the degreeof complexity was used and for us no meditation induced heart-beat (or ECG) data is readily available, we propose the performthis type of study in future works with larger datasets to arrive ata confident conclusion in absolute terms.
5. CONCLUSION
The results of this study are interesting and useful since thepresent investigation clearly indicates that meditation includingYoga significantly affects heart rate dynamics, and enhancesthe degree of complexity to be precise. The values obtained byPSVG analysis technique further hint at more pronounced effectsduring Kundalini Yoga.
Whereas, for the subject C6, MF-DFA technique did notshow any increase of spectral width, but visibility techniqueyielded a 24.6% enhancement during meditation justifying thesimultaneous use of two methods.
With the multi-fractal spectra being wider during meditation,we intend to conclude that a wider spectra may relateto a feeling of well being. However, the feeling of well-being is a very complicated phenomenon and there aremore than one physiological parameters simultaneously playingtheir role toward feeling good. Chaos theory tells us that
there is a natural background of chaos in our body—aloss of chaos can lead to an abnormal function—and inthis respect meditation with a wider spectra leads to betterfunctions of the body. To support this argument we mayrefer (Maity et al., 2015) where consistent increase of multi-fractal spectra were observed in EEG time series. This mayconfirm that increase of degree of complexity could be aparameter for quantification of well being and hence an improvedtherapy.
We may conclude that this analysis using two rigorous non-linear technique provide a method of double checking. Similaranalysis should be done for other types of data for offering abenchmark in the assessment of cardiac states in a quantitativemanner during different types of Yoga or meditation.
AUTHOR CONTRIBUTIONS
All authors listed, have made substantial, direct and intellectualcontribution to the work, and approved it for publication.
ACKNOWLEDGMENTS
Department of Higher Education, Government of West Bengal,India for providing the logistics to perform computationalanalysis.
REFERENCES
Acharya, U. R., Fausta, O., Kannathala, N., Chuaa, T., and Laxminarayan, S. (2005).
Non-linear analysis of eeg signals at various sleep stages. Comput. Methods
Progr. Biomed. 80, 37–45. doi: 10.1016/j.cmpb.2005.06.011
Ahmadlou, M., Adeli, H., and Adeli, A. (2010). New diagnostic eeg markers of the
alzheimers disease using visibility graph. J. Neural Trans. 117, 1099–1109. doi:
10.1007/s00702-010-0450-3
Ahmadloua, M., Adelic, H., and Adelid, A. (2012). Improved visibility graph
fractality with application for the diagnosis of autism spectrum disorder. Phys.
A Stat. Mech. Appl. 391, 4720–4726. doi: 10.1016/j.physa.2012.04.025
Austin, J. H. (1998). Zen and the Brain. Cambridge, MA: MIT Press.
Berger, Z. (2014). Meditation programs for psychological stress and well-being.
JAMA Inter. Med. 174, 357–368. doi: 10.1001/jamainternmed.2013.13018
Conte, E., Khrennikov, A., Federici, A., and Zbilut, J. P. (2009). Fractal fluctuations
and quantum-like chaos in the brain by analysis of variability of brain
waves: a new method based on a fractal variance function and random
matrix theory.Chaos Solitons Fractals 41, 2790–2800. doi: 10.1016/j.chaos.2008.
10.016
Dick, O. E. (2012). Multifractal analysis of the psychorelaxation efficiency for
the healthy and pathological human brain. Chaotic Model Simul. 1, 219–227.
Available online at: http://www.cmsim.eu/papers_pdf/january_2012_papers/
20_CMSIM_2012-Dick_1_219-227.pdf
Everly, G. S., and Lating, J. M. (2012). A Clinical Guide to the Treatment of the
Human Stress Response. New York, NY: Springer Science and Business Media.
Grant, J., Taylor, V. A., and Daneault, V. (2013). Impact of meditation training on
the default mode network during a restful state. Soc. Cogn. Affect. Neurosci. 1,
4–14. doi: 10.1093/scan/nsr087
Hausdorff, J. M., Purdon, P. L., Peng, C. K., Ladin, Z., Wei, J. Y., and
Goldberger, A. L. (1996). Fractal dynamics of human gait: stability of long-
range correlations in stride interval fluctuations. J. Appl. Physiol. 80, 1448–1457.
Huang, Y. X., Schmitt, F. G., Hermand, J. P., and Gagne, Y. (2011). Arbitrary-
order hilbert spectral analysis for time series possessing scaling statistics: a
comparison study with detrended fluctuation analysis and wavelet leaders.
Phys. Rev. E 84, 16208–16213. doi: 10.1103/PhysRevE.84.016208
Jiang, S., Bian, C., Ning, X., and Ma, Q. D. Y. (2013). Visibility graph analysis on
heartbeat dynamics of meditation training. Appl. Phys. Lett. 102, 253–702. doi:
10.1063/1.4812645
Kantelhardt, J. W., Zschiegner, S. A., Koscielny-Bunde, E., Bunde, A., Havlin,
S., and Stanley, H. E. (2002). Multifractal detrended fluctuation analysis
of nonstationary time series. Physica A. 02, 87–114. doi: 10.1016/s0378-
4371(02)01383-3
Kim, D. K., Lee, K. M., Kim, J., Whang, M. C., and Kang, S. W. (2013). Dynamic
correlations between heart and brain rhythm during autogenic meditation.
Front. Hum. Neurosci. 7:414. doi: 10.3389/fnhum.2013.00414
Lacasa, L., Luque, B., Ballesteros, F., Luque, J., and Nuño, J. C. (2008). From time
series to complex networks: The visibility graph. Proc. Natl. Acad. Sci. U.S.A.
105, 4972–4975. doi: 10.1073/pnas.0709247105
Lacasa, L., Luque, B., Luque, J., and Nuno, J. C. (2009). The visibility graph: a
new method for estimating the hurst exponent of fractional brownian motion.
Europhys. Lett. 86:30001. doi: 10.1209/0295-5075/86/30001
Lutz, A. (2008). Attention regulation and monitoring in meditation. Trends Cogn.
Sci. 12, 163–169. doi: 10.1016/j.tics.2008.01.005
Maity, A. K., Pratihar, R., Mitra, A., Dey, S., Agrawal, V., Sanyal, S., et al.
(2015). Multifractal detrended fluctuation analysis of alpha and theta eeg
rhythms with musical stimuli. Chaos Solitons Fractals 81, 52–67. doi:
10.1016/j.chaos.2015.08.016
Mandelbrot, B., and Ness, J. W. V. (1968). Fractional brownian motions, fractional
noises and applications. SIAM Rev. 10, 422–437. doi: 10.1137/1010093
Oswiecimka, P., Kwapien, J., and Drozdz, S. (2006). Wavelet versus detrended
fluctuation analysis of multifractal structures. Phys. Rev. E 74:16103. doi:
10.1103/PhysRevE.74.016103
Peng, C. K., and Henry, I. C. (2004). Heart rate dynamics during three forms of
meditation. Int. J. Cardiol. 95, 19–27. doi: 10.1016/j.ijcard.2003.02.006
Peng, C. K., and Mietus, J. E. (1999). Exaggerated heart rate oscillations during
two meditation techniques. Int. J. Cardiol. 70, 101–107. doi: 10.1016/S0167-
5273(99)00066-2
Rodriguez-Bermudez, G., and Garcia-Laencina, P. J. (2015). Analysis of eeg signals
using nonlinear dynamics and chaos: a review. Appl. Math. Inform. Sci. 9,
2309–2321. doi: 10.12785/amis/090512
Frontiers in Physiology | www.frontiersin.org 9 February 2016 | Volume 7 | Article 44
Bhaduri and Ghosh Heart Rate Dynamics during Meditation
Sarkar, A., and Barat, P. (2008). Effect of meditation on scaling behavior
and complexity of human heart rate variability. Fractals 16, 199. doi:
10.1142/S0218348X08003983
Selvaraj, J., Murugappan, M., Wan, K., and Yaacob, S. (2013). Classification of
emotional states from electrocardiogram signals: a non-linear approach
based on hurst. BioMed. Eng. Online 12:44. doi: 10.1186/1475-925
X-12-44
Serranoa, E., and Figliola, A. (2009). Wavelet leaders: a new method to
estimate the multifractal singularity spectra. Phys. A 388, 2793–2805. doi:
10.1016/j.physa.2009.03.043
Conflict of Interest Statement: The authors declare that the research was
conducted in the absence of any commercial or financial relationships that could
be construed as a potential conflict of interest.
Copyright © 2016 Bhaduri and Ghosh. This is an open-access article distributed
under the terms of the Creative Commons Attribution License (CC BY). The use,
distribution or reproduction in other forums is permitted, provided the original
author(s) or licensor are credited and that the original publication in this journal
is cited, in accordance with accepted academic practice. No use, distribution or
reproduction is permitted which does not comply with these terms.
Frontiers in Physiology | www.frontiersin.org 10 February 2016 | Volume 7 | Article 44