Embed Size (px)
Citation preview
Quantitative aspects of real-time RT-qPCR
current and future
Third Scientific Meeting MolecularDiagnostics.be
Congress Centre Elzenveld, Antwerp
13th December 2011
Michael W. Pfaffl
Professor of Molecular Physiology
Technical University of Munich Weihenstephan, 85354 Freising, Germany
www.Gene-Quantification.info
Molecular diagnostic challenges for the future
• Minimal amount of tissue or biological matrix necessary
• Sensitive assay – on level of single molecules
• Quick diagnosis – in hours
• Wide quantification range
• Early detection of disease or micro-organism
• Stable and valid biomarker(s) or biomarker pattern
• Highly standardized and reproducible
RT-qPCR is the method of choice
Amplification, analysis, and quantification in one tube
Reliable biomarker pattern = Transcriptional biomarkers
MIQE compliant
Quantitative aspects of real-time RT-qPCR
current and future
Outline:
1. MIQE guidelines
2. Single-cell analytics on DNA and RNA level
3. Transcriptional biomarker discovery
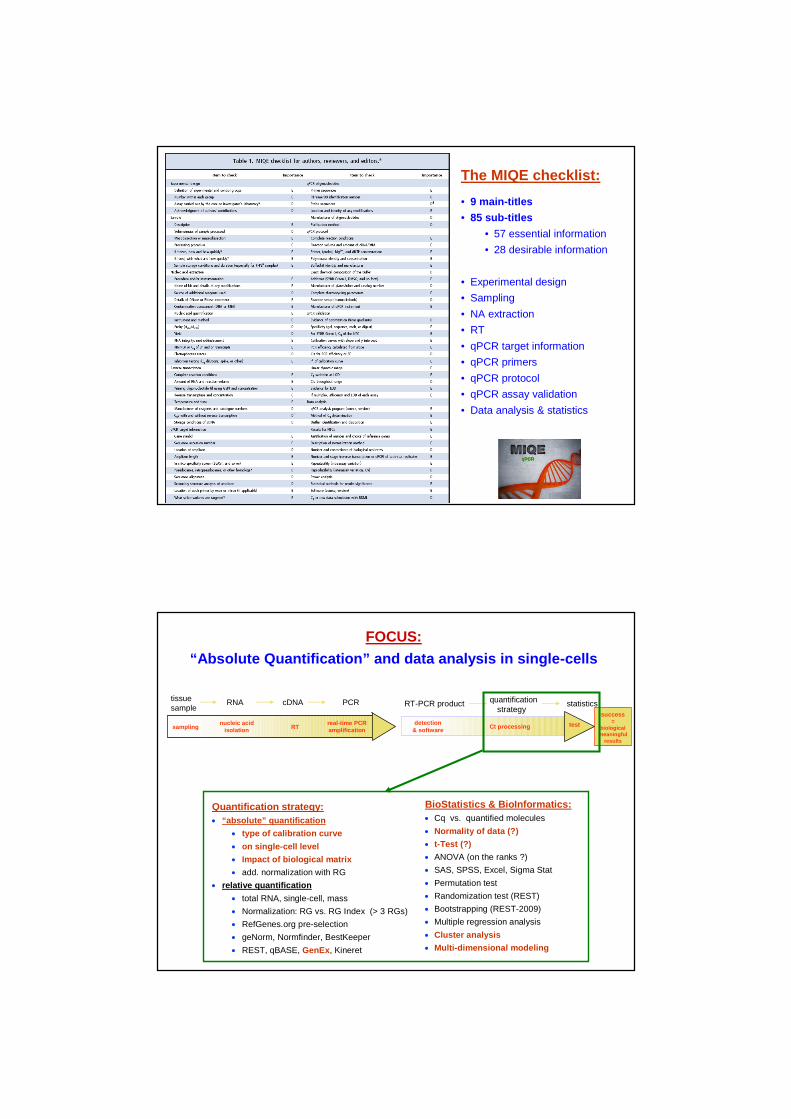
MIQE is a set of guidelines that describe the minimum informationnecessary for evaluating qPCR experiments
The goal is:
• To provide guidelines for authors, reviewers and editors to measure the technical qualityof submitted manuscripts
• To establish a clear framework to conduct quantitative RT-PCR experiments
• To support experimental transparency
• To increase reproducibility between laboratories worldwide
• To promote more consistent, more comparable, and more reliable results
• To standardize international qPCR nomenclature
To increase reliability of results to help to insure the integrity of
scientific work, with major focus on biological relevance
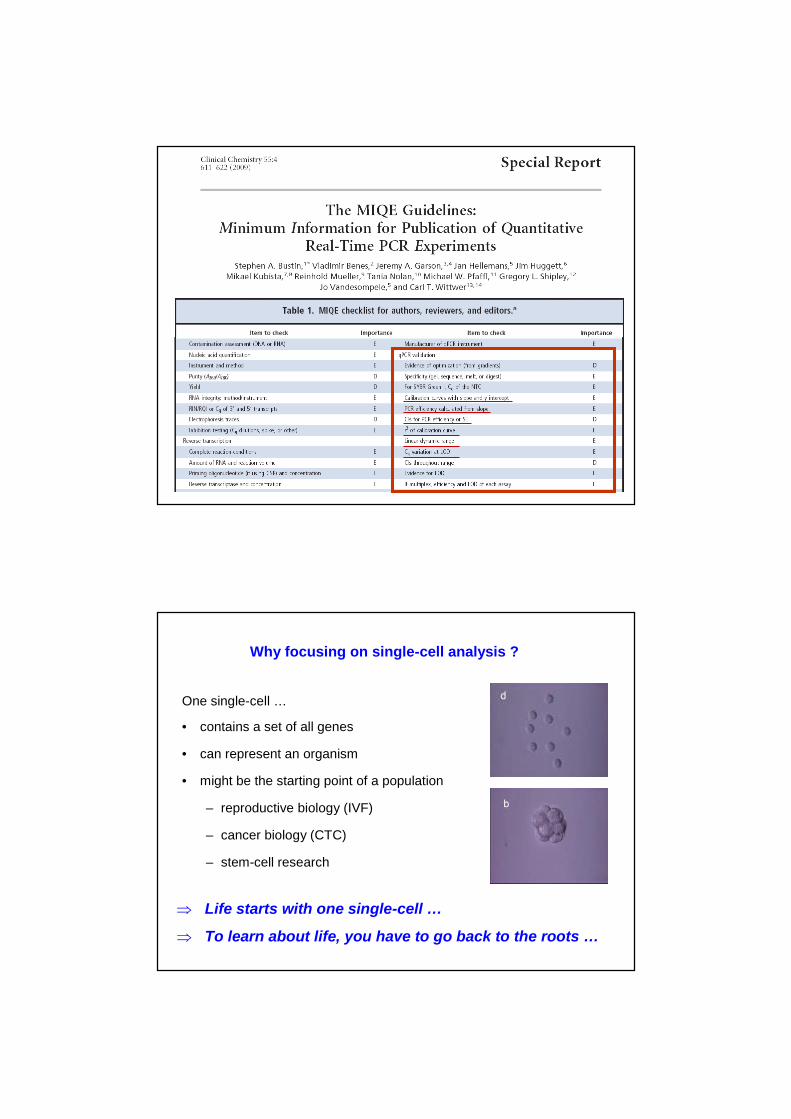
The MIQE checklist:
• 9 main-titles
• 85 sub-titles
• 57 essential information
• 28 desirable information
• Experimental design
• Sampling
• NA extraction
• RT
• qPCR target information
• qPCR primers
• qPCR protocol
• qPCR assay validation
• Data analysis & statistics
tissuesample
RNA cDNA PCR
nucleic acidisolation
sampling RTreal-time PCRamplification
quantificationstrategy
RT-PCR product
Ct processing
Detection method: Quantification strategy:
detection& software
statistics
success=
biologicalmeaningful
results
test
FOCUS:
“Absolute Quantification” and data analysis in single-cells
Quantification strategy:
“absolute” quantification
type of calibration curve
on single-cell level
Impact of biological matrix
add. normalization with RG
relative quantification
total RNA, single-cell, mass
Normalization: RG vs. RG Index (> 3 RGs)
RefGenes.org pre-selection
geNorm, Normfinder, BestKeeper
REST, qBASE, GenEx, Kineret
BioStatistics & BioInformatics:
Cq vs. quantified molecules
Normality of data (?)
t-Test (?)
ANOVA (on the ranks ?)
SAS, SPSS, Excel, Sigma Stat
Permutation test
Randomization test (REST)
Bootstrapping (REST-2009)
Multiple regression analysis
Cluster analysis
Multi-dimensional modeling
One single-cell …
• contains a set of all genes
• can represent an organism
• might be the starting point of a population
– reproductive biology (IVF)
– cancer biology (CTC)
– stem-cell research
Why focusing on single-cell analysis ?
Life starts with one single-cell …
To learn about life, you have to go back to the roots …

Why test cell-by-cell expression heterogeneity?
What if: • Samples contain varying mix of normal anddiseased cells (=> tissue heterogeneity)
• Expression pattern is changing between cell typesand cellular layers (=> tissue heterogeneity)
• Expression pattern is changing cell-by-cell• Expression dynamic is changing over time
Current testing: • Expression markers are based on featuresobserved in tissue samples in clusters of cells,from 100s – 10.000s of cells
Stahlberg & Bengtsson Methods (2010)
Expression analysis of a cell population can be misleading
10 20 30 40 50 60
HpRT
IFN
mRNA expression levels
Rocha B., qPCR Event 2007, Freising
qPCR of cellpopulation
Single cellanalysis
= low expression level= high expression level

=> Validation of DNA and RNA quantification procedure onthe single-cell level is necessary!
=> Adaptation of the MIQE guidelines!
Analytical questions on the single-cell level:
• What is the dynamic quantification range for DNA and RNA?
• DNA and RNA assay sensitivity?
• Variability of quantification?
• What is the influence of the biological matrix?
• Does the cell sampling and handling has an impact on thequantification results?
• What is the transcriptional noise and what the technical noise?
“single-cell hardware“
48 reaction sites (AmpliGrid AG480F slides)FACS sorting (DKFZ Heidelberg)one-cell per reaction site1µl reaction per reaction siteAmpliSpeed slide cycler (ASC200D)
AmpliGrid & AmpliSpeed; Advalytix, Beckman Coulter Biomedical GmbH Reiter et al., NAR, October 2011

AmpliGrid – 48 cell array slide
Our single-cell workflow1) single-cell (WBC) deposition by FACS
and/or DNA or RNA spiking
2) cell-lysis
3) NA stabilization
4) RT
5) pre-ampmultiplexing10 cycles
210 ~ 1000-fold
6) dilution 1/100in 96-wellsingle-assays
7) qPCRsingle-assay40 cycles
"RNA standard"without WBC
input copy [log]
0 1 2 3 4 5 6 7
Cq
10
15
20
25
30
35
40
input copy numbers vs Cq
linear regression (r = 0.84)95% confidence interval
8) data analysis
1) DNA std.2) DNA std. + pre-Amp3) DNA std. + pre-Amp + LYM4) RNA std.5) RNA std. + LYM6) mRNA expression profiling
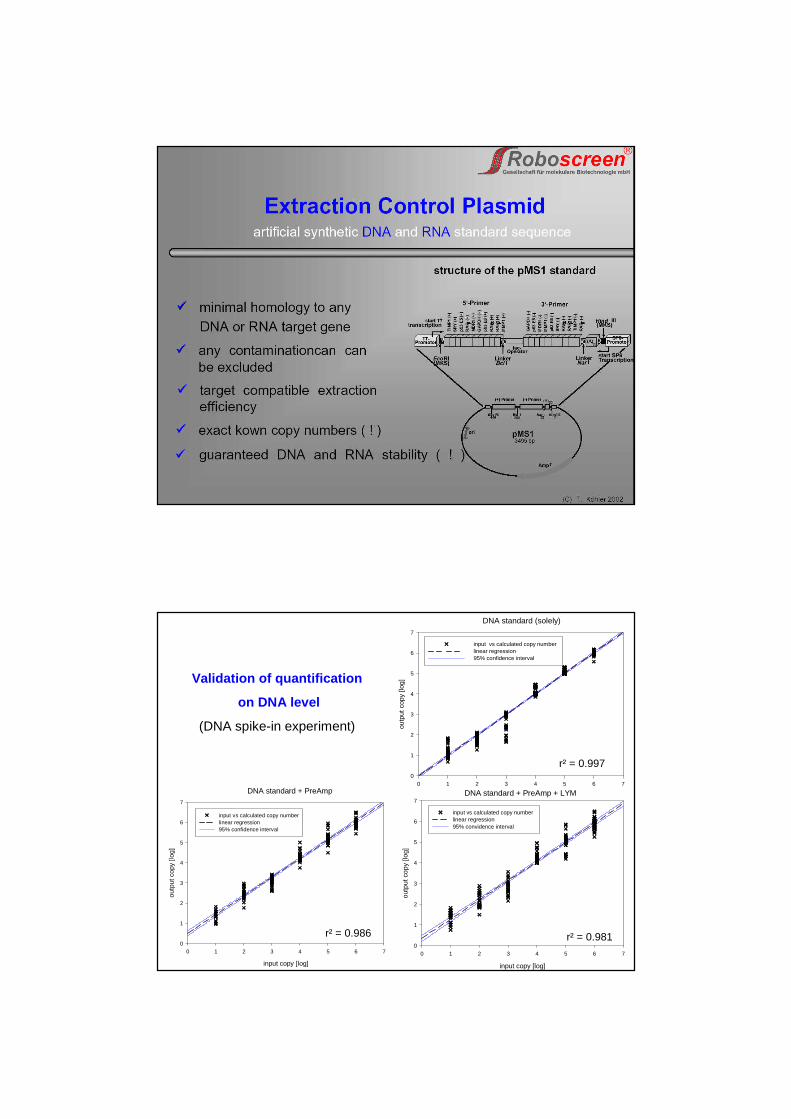
DNA standard + PreAmp
input copy [log]
0 1 2 3 4 5 6 7
outp
ut
copy
[log
]
0
1
2
3
4
5
6
7
input vs calculated copy number
linear regression
95% confidence interval
Validation of quantification
on DNA level
(DNA spike-in experiment)
DNA standard (solely)
input copy [log]
0 1 2 3 4 5 6 7
outp
utcop
y[log
]
0
1
2
3
4
5
6
7
input vs calculated copy numberlinear regression95% confidence interval
r² = 0.997
r² = 0.986
DNA standard + PreAmp + LYM
input copy [log]
0 1 2 3 4 5 6 7
outp
ut
cop
y[lo
g]
0
1
2
3
4
5
6
7
input vs calculated copy numberlinear regression
95% convidence interval
r² = 0.981
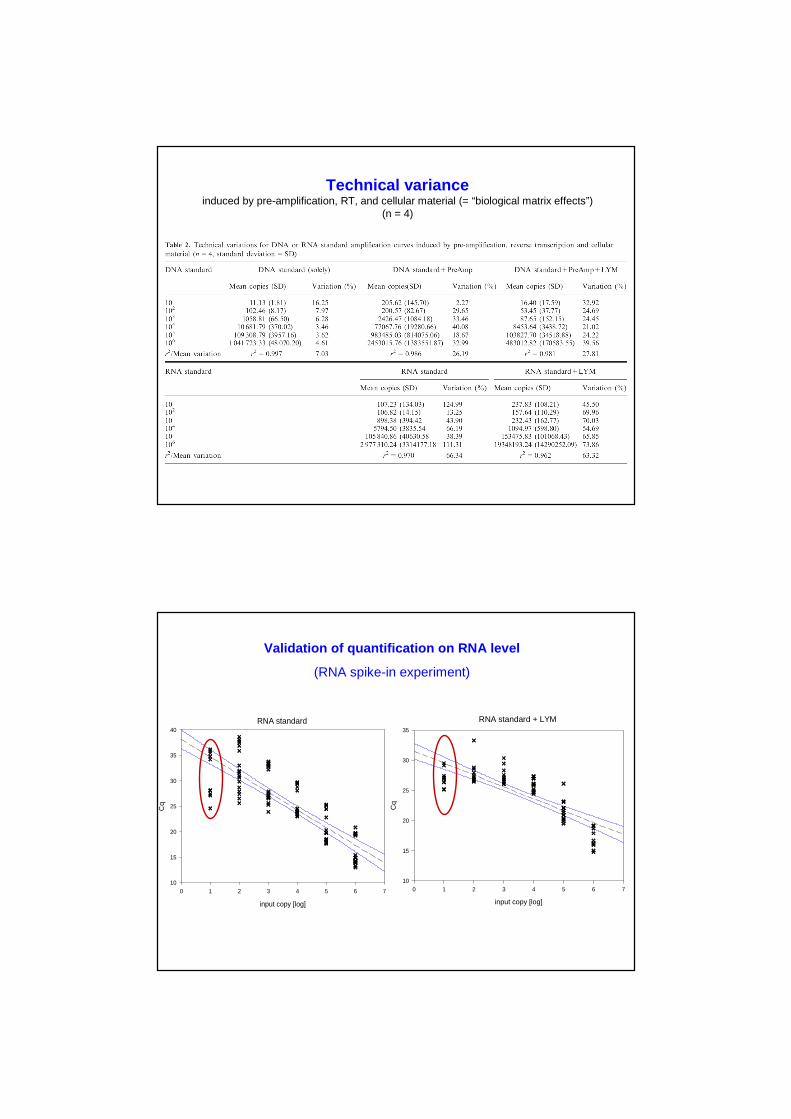
Technical varianceinduced by pre-amplification, RT, and cellular material (= “biological matrix effects”)
(n = 4)
Validation of quantification on RNA level
(RNA spike-in experiment)
RNA standard
input copy [log]
0 1 2 3 4 5 6 7
Cq
10
15
20
25
30
35
40
RNA standard + LYM
input copy [log]
0 1 2 3 4 5 6 7
Cq
10
15
20
25
30
35
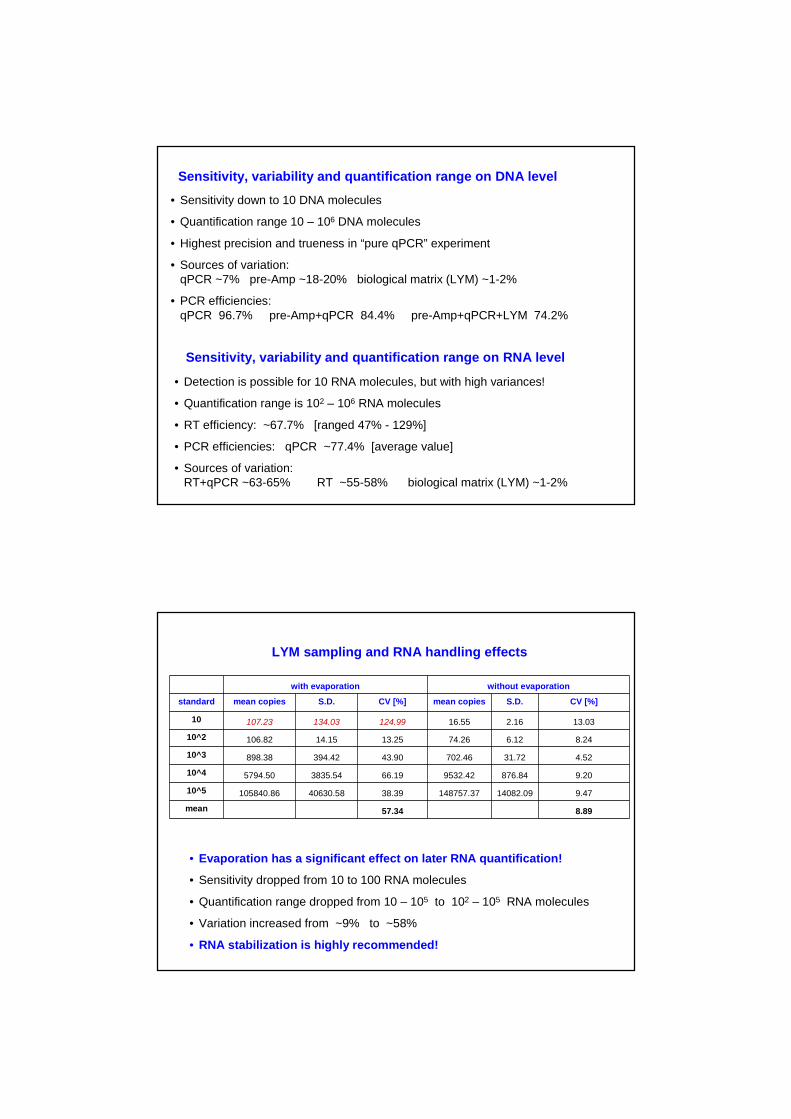
Sensitivity, variability and quantification range on DNA level
• Sensitivity down to 10 DNA molecules
• Quantification range 10 – 106 DNA molecules
• Highest precision and trueness in “pure qPCR” experiment
• Sources of variation:qPCR ~7% pre-Amp ~18-20% biological matrix (LYM) ~1-2%
• PCR efficiencies:qPCR 96.7% pre-Amp+qPCR 84.4% pre-Amp+qPCR+LYM 74.2%
Sensitivity, variability and quantification range on RNA level
• Detection is possible for 10 RNA molecules, but with high variances!
• Quantification range is 102 – 106 RNA molecules
• RT efficiency: ~67.7% [ranged 47% - 129%]
• PCR efficiencies: qPCR ~77.4% [average value]
• Sources of variation:RT+qPCR ~63-65% RT ~55-58% biological matrix (LYM) ~1-2%
with evaporation without evaporation
standard mean copies S.D. CV [%] mean copies S.D. CV [%]
10 107.23 134.03 124.99 16.55 2.16 13.03
10^2 106.82 14.15 13.25 74.26 6.12 8.24
10^3 898.38 394.42 43.90 702.46 31.72 4.52
10^4 5794.50 3835.54 66.19 9532.42 876.84 9.20
10^5 105840.86 40630.58 38.39 148757.37 14082.09 9.47
mean 57.34 8.89
LYM sampling and RNA handling effects
• Evaporation has a significant effect on later RNA quantification!
• Sensitivity dropped from 10 to 100 RNA molecules
• Quantification range dropped from 10 – 105 to 102 – 105 RNA molecules
• Variation increased from ~9% to ~58%
• RNA stabilization is highly recommended!
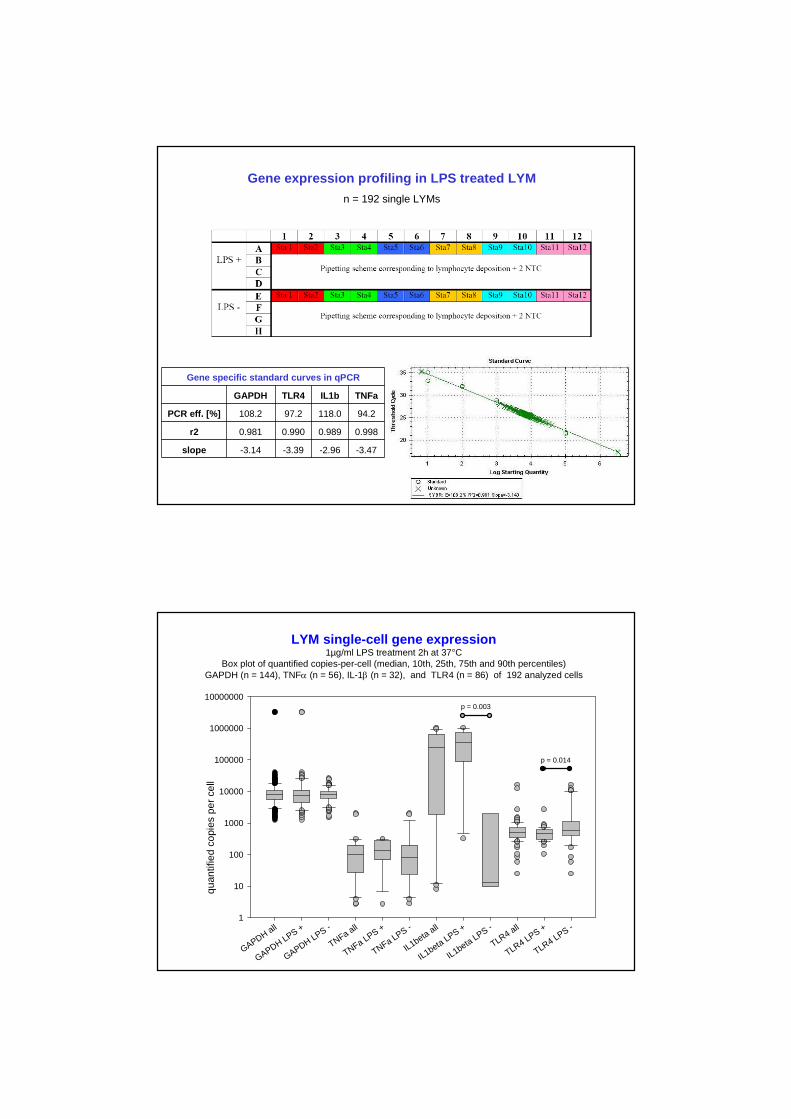
Gene expression profiling in LPS treated LYM
n = 192 single LYMs
Gene specific standard curves in qPCR
GAPDH TLR4 IL1b TNFa
PCR eff. [%] 108.2 97.2 118.0 94.2
r2 0.981 0.990 0.989 0.998
slope -3.14 -3.39 -2.96 -3.47
GAPDHall
GAPDHLPS
+
GAPDHLPS
-
TNFa all
TNFa LPS+
TNFa LPS-
IL1betaall
IL1betaLPS
+
IL1betaLPS
-
TLR4 all
TLR4 LPS+
TLR4 LPS-
qu
an
tifie
dco
pie
sp
er
ce
ll
1
10
100
1000
10000
100000
1000000
10000000p = 0.003
p = 0.014
LYM single-cell gene expression1µg/ml LPS treatment 2h at 37°C
Box plot of quantified copies-per-cell (median, 10th, 25th, 75th and 90th percentiles)GAPDH (n = 144), TNF (n = 56), IL-1 (n = 32), and TLR4 (n = 86) of 192 analyzed cells

Conclusions
• Reliable quantification down to 10 copies per cells is technicallypossible
• Higher variation on RNA level and at low copy number• Major impact of sampling and handling (evaporation)• Nearly NO inhibition or interference through LYM
(=> has to be proven for each tissues or biological matrixes !!!)
natural mRNA variance >> technical variabilitycellular expression noise >> quantification noise
• To guarantee valid results, GLP and the application of the MIQEguideline is recommended
Future questions:• Valid sample integrity control?• Cell dependent variability?• Data analysis in single-cell expression profiling?
Biomarkers on various “– ome” layers
genome transcriptome proteome metabolomeepi-genome splicome
micro-transcriptome

Gynecomastia: development of abnormally largemammary glands
Estrogens => development of primary andsecondary sexual characteristics
Prolactin => breast development, milk production
Doping !
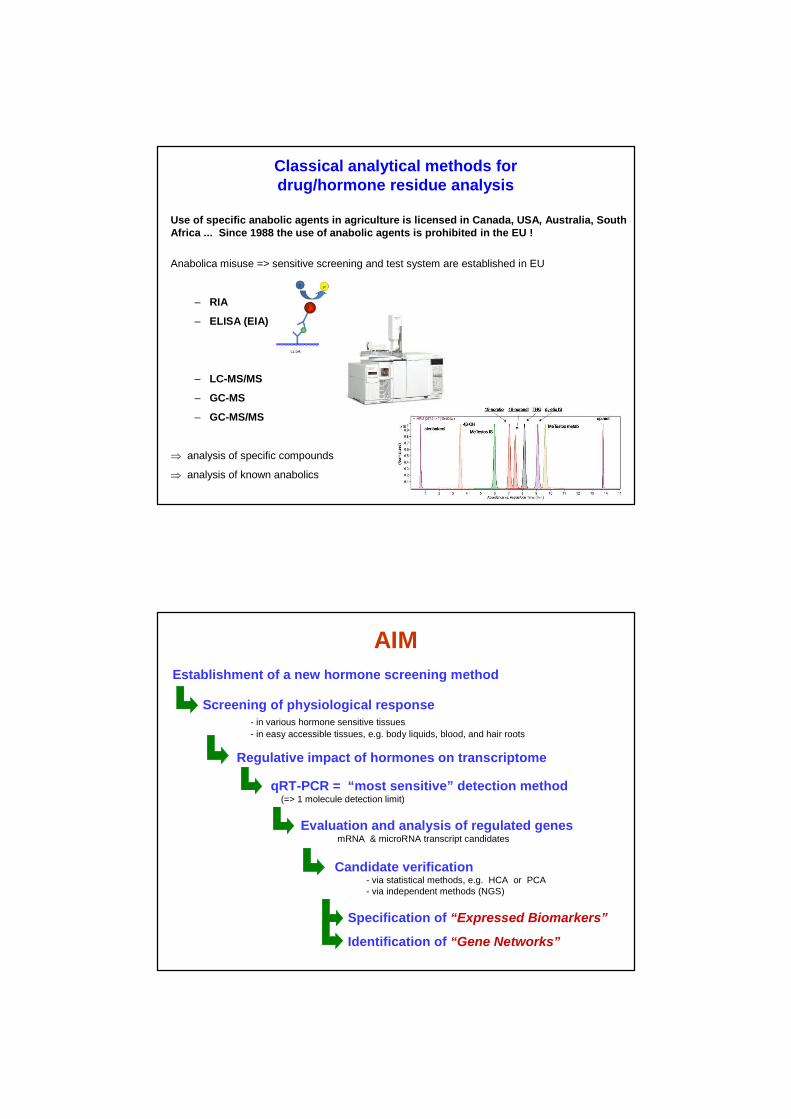
Classical analytical methods fordrug/hormone residue analysis
Use of specific anabolic agents in agriculture is licensed in Canada, USA, Australia, SouthAfrica ... Since 1988 the use of anabolic agents is prohibited in the EU !
Anabolica misuse => sensitive screening and test system are established in EU
– RIA
– ELISA (EIA)
– LC-MS/MS
– GC-MS
– GC-MS/MS
analysis of specific compounds
analysis of known anabolics
AIM
Establishment of a new hormone screening method
Screening of physiological response- in various hormone sensitive tissues
- in easy accessible tissues, e.g. body liquids, blood, and hair roots
Regulative impact of hormones on transcriptome
qRT-PCR = “most sensitive” detection method(=> 1 molecule detection limit)
Evaluation and analysis of regulated genesmRNA & microRNA transcript candidates
Candidate verification- via statistical methods, e.g. HCA or PCA- via independent methods (NGS)
Specification of “Expressed Biomarkers”
Identification of “Gene Networks”
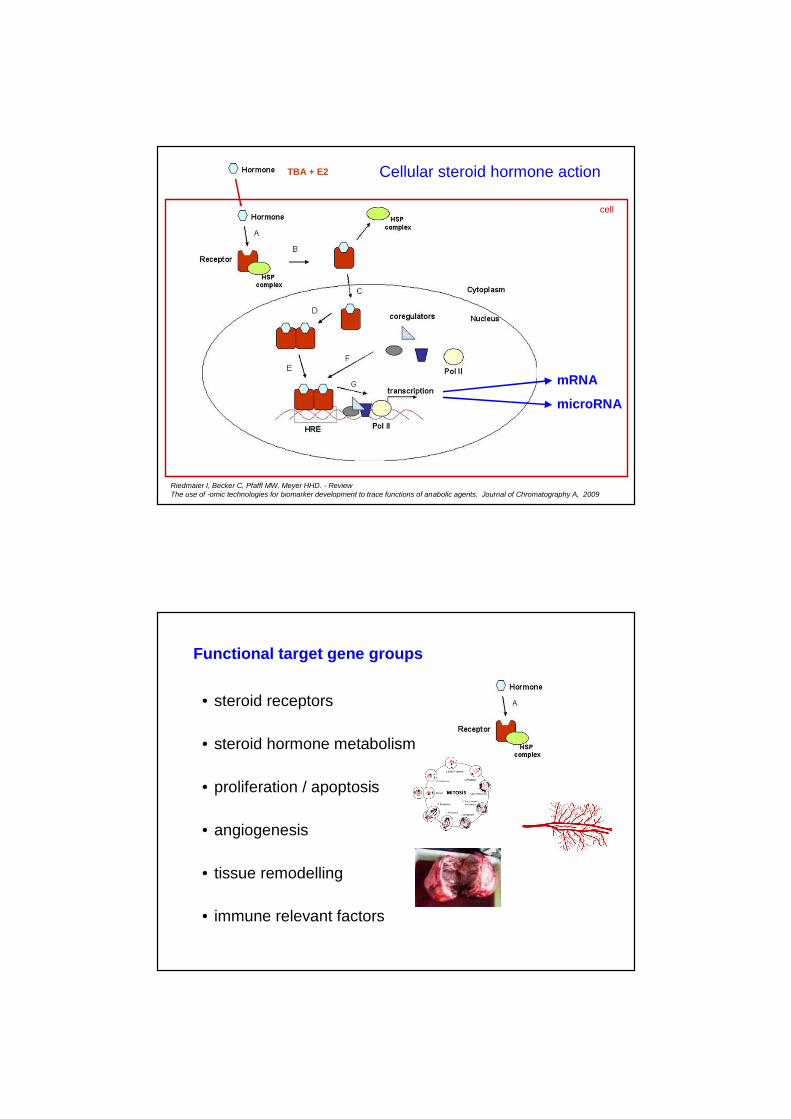
Cellular steroid hormone action
Riedmaier I, Becker C, Pfaffl MW, Meyer HHD. - ReviewThe use of -omic technologies for biomarker development to trace functions of anabolic agents. Journal of Chromatography A, 2009
mRNA
microRNA
cell
TBA + E2
Functional target gene groups
• steroid receptors
• steroid hormone metabolism
• proliferation / apoptosis
• angiogenesis
• tissue remodelling
• immune relevant factors
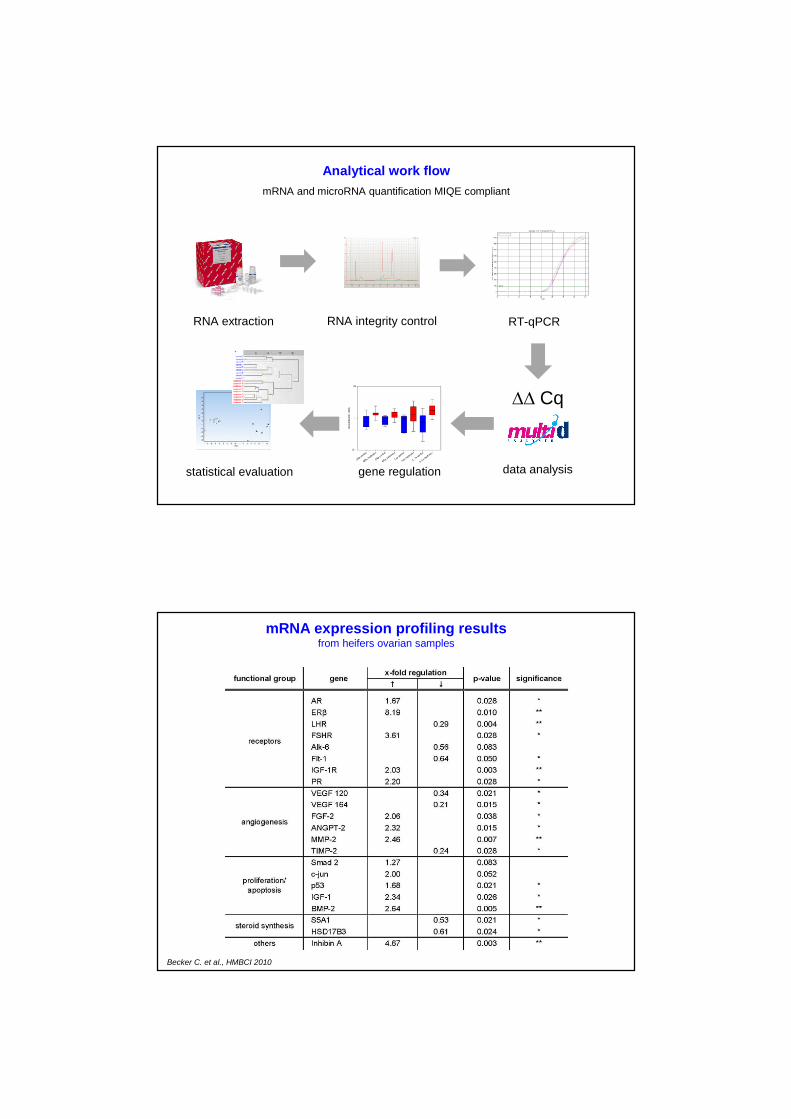
RNA extraction RNA integrity control RT-qPCR
Cq
data analysisstatistical evaluation
Analytical work flow
mRNA and microRNA quantification MIQE compliant
gene regulation
mRNA expression profiling resultsfrom heifers ovarian samples
Becker C. et al., HMBCI 2010

microRNA expression profiling resultsmicroRNA qPCR array – 2x 384 miR set from Exiqon
miRNA regulation in bovine liver under theinfluence of TBA+E2up-regulated genes
miR 378: promotes cell survival, tumor growth,angiogenesis
miR 412: regulates Uterine leiomyomas growth,benign uterine smooth muscle tumor
miR 15a: tumorgenesis, unarrested cell cycle
# $
15a 0.49 0.023 *
20a 0.49 0.024 *
27b 0.97 0.58 n.s.
29c 1.30 0.066 n.s.
34a 0.67 0.017 *
103 1.30 0.040 *
106a 1.40 0.057 n.s.
138 1.74 0.2 n.s.
181c 0.75 0.038 *
320d 0.72 0.065 n.s.
433 1.15 0.89 n.s.
miR-x-fold regulation (2-ΔΔCq)
p-value significance
microRNA expression profilingsingle assays (Qiagen) vs. microRNA qPCR array (Exiqon)
P < 0.05P < 0.1 (trend of regulation)
single assay PCR
0 1 2 3 4 5 6
PC
Rarr
ay
0
1
2
3
4
5
correlated regulationsingle microRNA assay vs. qPCR array
r = 0.662p < 0.001

WBC expression data analysismRNA data
Significantly regulated genes in heiferblood (16 days after treatment)
PCA & HCA

Vaginal epithelial cell expression data analysis
PCA
HCA
Combined WBC & vaginal epithelial cell data analysis
PCA & HCA
=> integrative functional informatics

Group Icontrol animals (n=2)
Group Icontrol animals (n=2)
Group IItreated animals (n=3)
Group IItreated animals (n=3)
sequencingsequencing
data analysisdata analysis
RNA isolationRNA isolation
TU MünchenTU München
EMBL Gene-CoreEMBL Gene-Core
GenomatixGenomatix
Alteration of gene regulation in bovine liverby treatment with anabolic steroids
* mapping* expression analysis
Conformational studyFinding new biomarker candidates
Experimental setup
NGS =>
NGS results - sequence statistics
• number of sequences: > 25 Mio.
• sequence length: 76 bases
• successfully mapped bovine genes: 16,947
• successfully mapped transcripts: 45,832
• significantly regulated genes: 9,000 (control vs. treatment group)
• gene regulation at least 2-fold: 306
• screening for significantly regulated genes
– with high relative expression change, more than 2-fold
– and high expression value
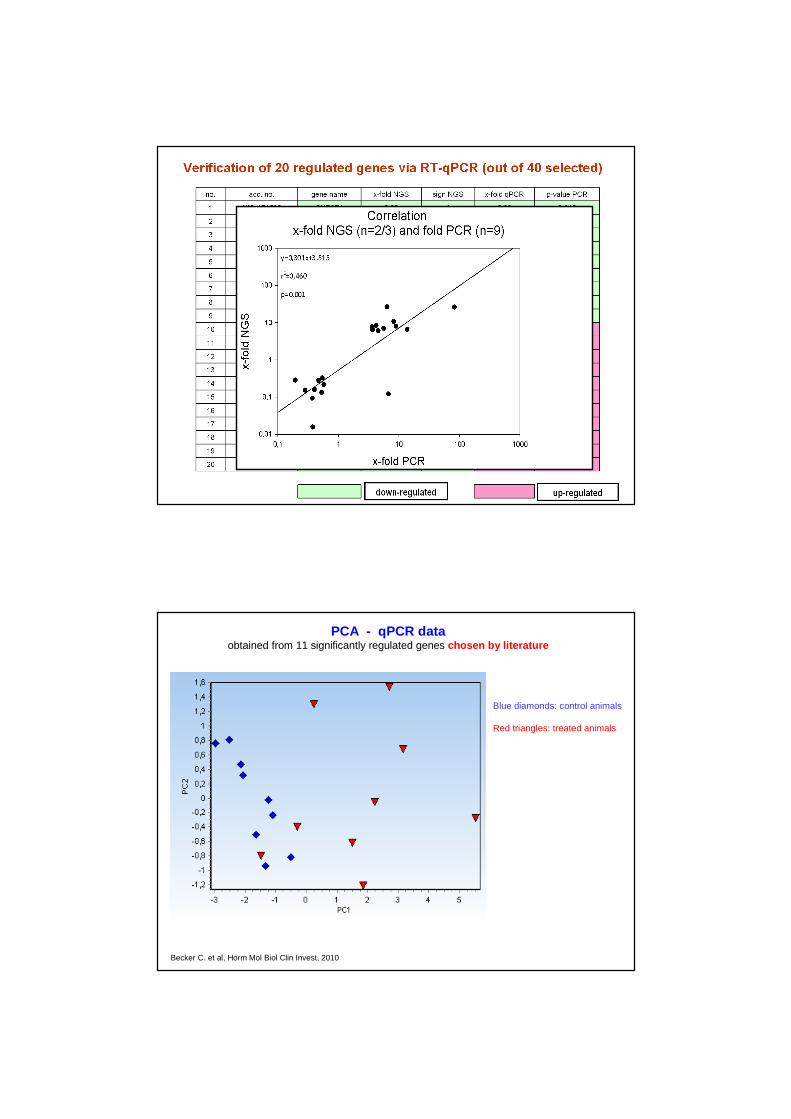
Blue diamonds: control animals
Red triangles: treated animals
PCA - qPCR dataobtained from 11 significantly regulated genes chosen by literature
Becker C. et al, Horm Mol Biol Clin Invest, 2010
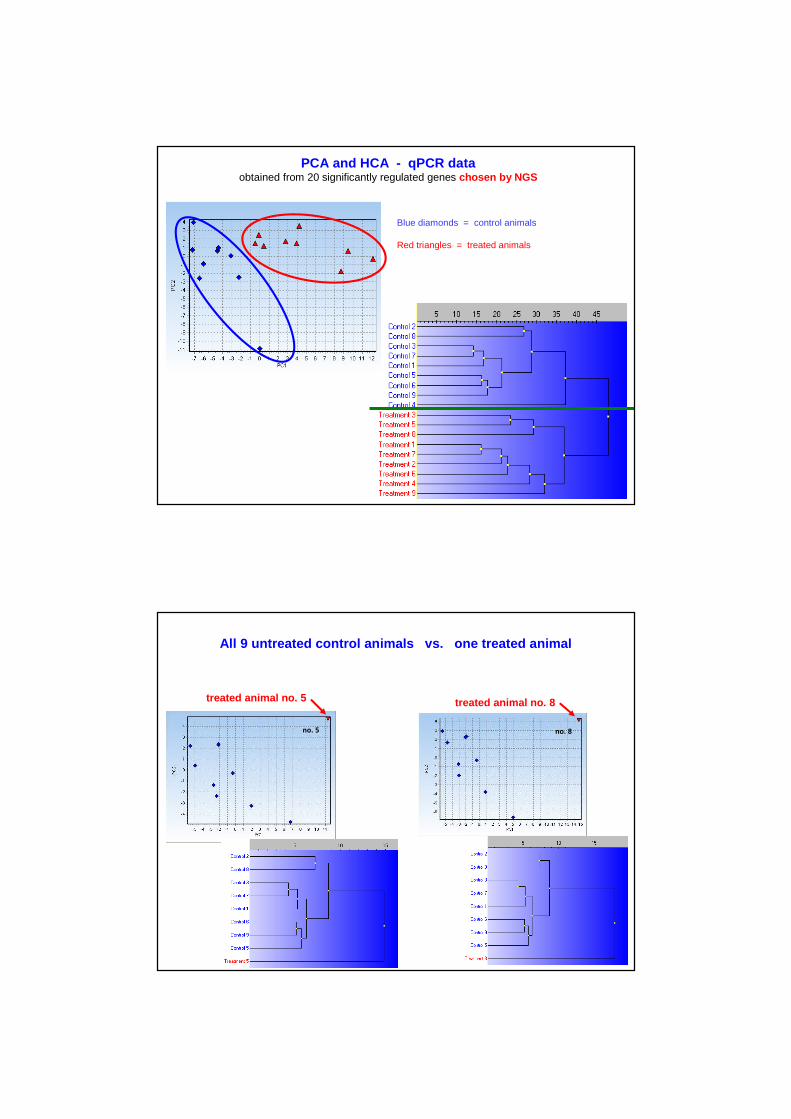
PCA and HCA - qPCR dataobtained from 20 significantly regulated genes chosen by NGS
Blue diamonds = control animals
Red triangles = treated animals
All 9 untreated control animals vs. one treated animal
no. 5
treated animal no. 5 treated animal no. 8
no. 8

Heifers treated with Synovex plus200mg Trenbolon Azetat + 28mg Östradiol Benzoat
sample from an animal trial from 1998
Proof of concept analysis!
Pour-on applicationof steroid hormone cocktail on calves
Red stars: 3-fold treatmentPink diamonds: 1-fold treatmentBlue triangles: controls
BiblioSphere
Cocitation based network of genesregulated at least 2 fold betweencontrol and treatment. (and min NE of0.5 in at least one condition)
4.7
-6.8
0.0
Genes from input list are coloredbased on ratio between control andtreatment. Red – induced , blue –repressed with treatment.
White boxes represent transcriptionfactors that are cocited with at least10 input genes.Green lines indicate potential bindingsites in the promoter region.
Gene network regulated by exogene anabolics

Conclusion
• Tissues that are directly influenced by steroid hormones with abundant receptorconcentrations are more sensitive and show higher gene regulations => hencebetter for the biomarker identification
• transcriptomics analysis discovered promising expression changes
– mRNA served as first biomarker candidates
– additional candidates via microRNA profiling
– verification of existing candidates via NGS RNA-Seq
– new mRNA candidates via NGS RNA-Seq
Integrative biomarker discovery approach on transcriptome level:
– Significantly regulated transcripts (mRNA and microRNA)
– in various tissues (WBC, liver, and vaginal smear)
– by different analysis methods (qRT-PCR, qPCR array, and NGS RNA-Seq)
– by various statistical algorithms (PCA and HCA)
The more integrative biomarker candidates are discoveredthe better a prediction of hormone treatment is possible
Acknowledgements
Free GenEx download =>
Martina Reiter
Benedikt Kirchner
Helena Müller
Claudia Holzhauer
Wolfgang Mann
Irmgard Riedmaier
Vladimir Benes
Heinrich HD Meyer


![Two New Monoclonal Antibodies, Lym-1 and Lym-2, Reactive ... · [CANCER RESEARCH 47, 830-840, February 1, 1987] Two New Monoclonal Antibodies, Lym-1 and Lym-2, Reactive with Human](https://img.pdfslide.us/doc/110x75/5fd4910a5ac1e6740c41e4e9/two-new-monoclonal-antibodies-lym-1-and-lym-2-reactive-cancer-research-47.jpg)