Embed Size (px)
Citation preview

13 PROBABILITY AND EXPECTED VALUE BY MATHEMATICAL EXPECTATION 165-175
14 THEORITICAL DISTRIBUTION(BINOMIAL, POISSON, AND NORMAL DISTRIBUTION) 176-185
15 SAMPLING THEORY 186-194
16 INDEX NUMBERS 195-203
17 APPENDIX 204-209
( )!
! ( ) !. ( ). ( )
( ) ! ( ) ( ) ! ( ) ! ( ) ! ( ) ! ( )!
( ) !( )
i Cn
r n rnum ber of com binations of n things taken r at a tim e n r ii C C
iii n n n iv v vi n n n vii Pn
n rn r
nr
nr
nn r
nr
=−
= > =
= ⋅ ⋅ ⋅ ⋅ ⋅ ⋅ − = = = − =−
>
−
1 2 3 1 0 1 1 1 1
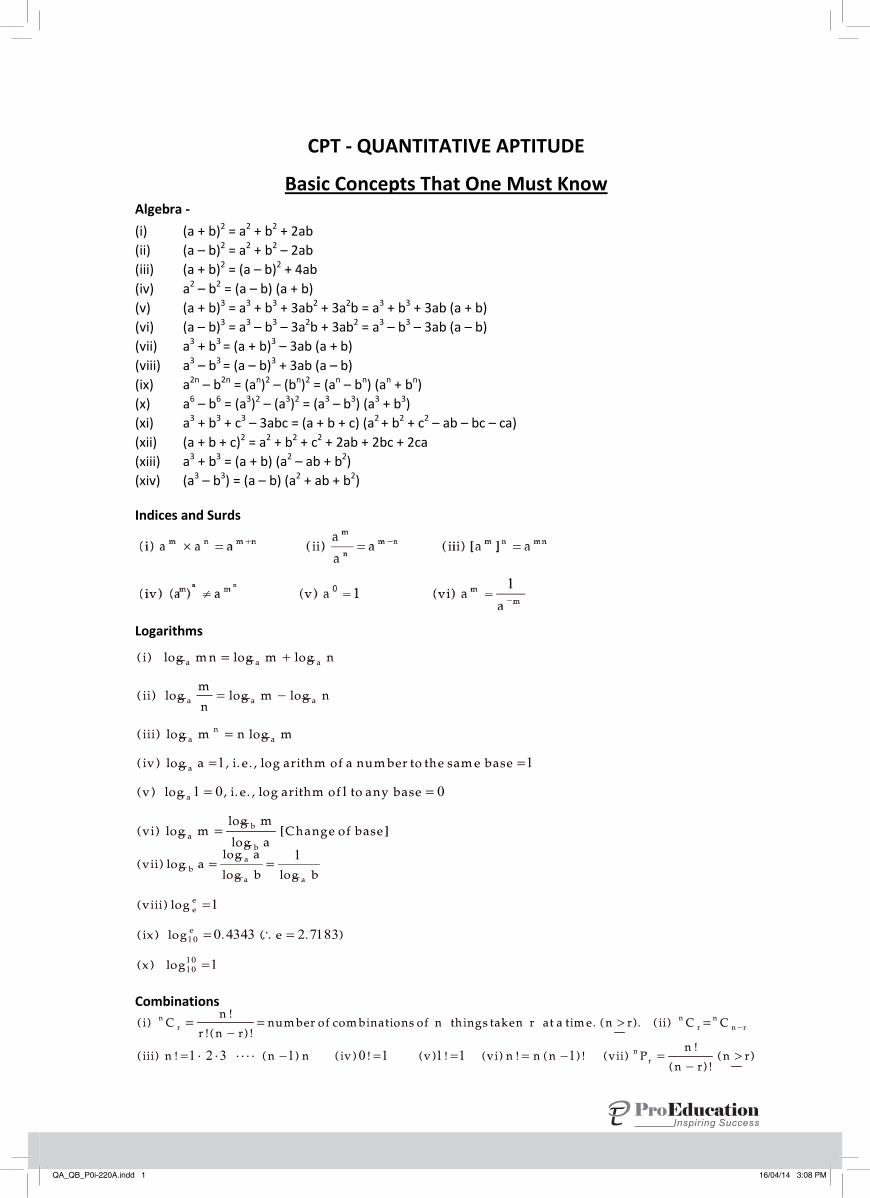
CPT - QUANTITATIVE APTITUDE
Basic Concepts That One Must Know Algebra -
(i) (a + b)2 = a2 + b2 + 2ab (ii) (a – b)2 = a2 + b2 – 2ab (iii) (a + b)2 = (a – b)2 + 4ab (iv) a2 – b2 = (a – b) (a + b) (v) (a + b)3 = a3 + b3 + 3ab2 + 3a2b = a3 + b3 + 3ab (a + b) (vi) (a – b)3 = a3 – b3 – 3a2b + 3ab2 = a3 – b3 – 3ab (a – b) (vii) a3 + b3 = (a + b)3 – 3ab (a + b) (viii) a3 – b3 = (a – b)3 + 3ab (a – b) (ix) a2n – b2n = (an)2 – (bn)2 = (an – bn) (an + bn) (x) a6 – b6 = (a3)2 – (a3)2 = (a3 – b3) (a3 + b3) (xi) a3 + b3 + c3 – 3abc = (a + b + c) (a2 + b2 + c2 – ab – bc – ca) (xii) (a + b + c)2 = a2 + b2 + c2 + 2ab + 2bc + 2ca (xiii) a3 + b3 = (a + b) (a2 – ab + b2) (xiv) (a3 – b3) = (a – b) (a2 + ab + b2)
Indices and Surds
Logarithms
( ) loglog
log log
( ) log
( ) log . ( . )
( ) log
vii aa
b b
viii
ix e
x
ba
a a
ee
e
= =
=
= ∴ =
=
1
1
0 4343 2 7183
1
10
1010
Combinations
( ) log log log
( ) log log log
( ) log log
( ) log , . . , log
( ) log , . . , log
( ) loglog
log[ ]
i m n m n
iimn
m n
iii m n m
iv a i e arithm of a num ber to the sam e base
v i e arithm of to any base
vi mm
aChange of base
a a a
a a a
an
a
a
a
ab
b
= +
= −
=
= =
= =
=
1 1
1 0 1 0
QA_QB_P0i-220A.indd 1 16/04/14 3:08 PM
2� Quantitative Aptitude - Question Bank2 Quantitative Aptitude – Question Bank
( ) '
( ) . log
( ). log . log .
. . int .
( )
( ) Re
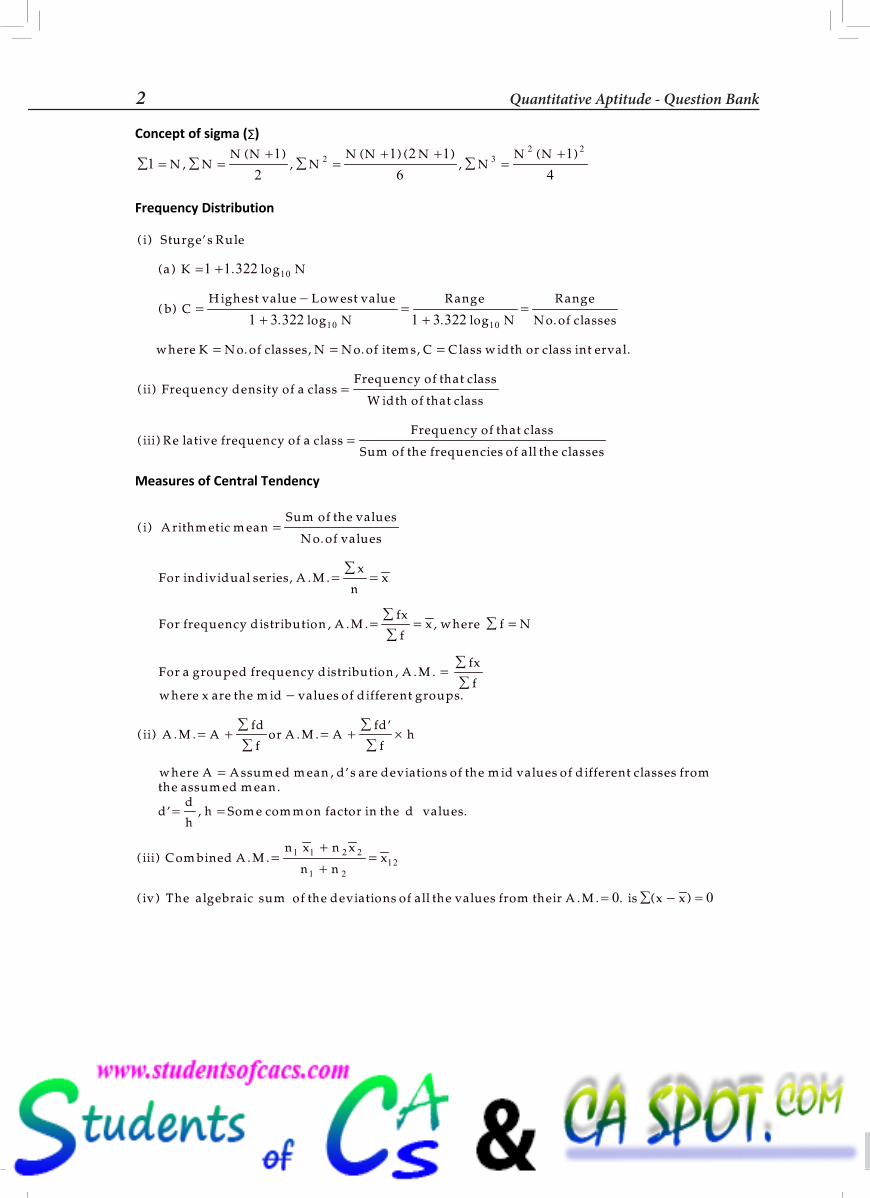
i Sturge s Rule
a K N
b CH ighest value Low est value
N
Range
N
Range
N o of classes
w here K N o of classes, N N o of item s, C Class w idth or class erval
ii Frequency density of a classFrequency of that class
W idth of that class
iii lative frequency of a classFrequency of that class
Sum of the frequencies of all the classes
= +
=−
+=
+=
= = =
=
=
1 1 322
1 3 322 1 3 322
10
10 10
( ).
. .
, . . ,
, . .
.
( ) . . . .'
, '.
i A rithm etic m eanSum of the values
N o of values
For individual series, A Mx
nx
For frequency distribution A Mfxf
x w here f N
For a grouped frequency distribution A Mfxf
w here x are the m id values of different groups
ii A M Afdf
or A M Afdf
h
w here A A ssum ed m ean d s are deviations of the m id values of different classes fromthe assum ed m ean
=
=∑
=
=∑∑
= ∑ =
=∑∑
−
= +∑∑
= +∑∑
×
=
Concept of sigma (∑)
∑ = ∑ =+
∑ =+ +
∑ =+
11
21 2 16
14
2 32 2
N NN N
NN N N
NN N
,( )
,( ) ( )
,( )
Frequency Distribution
Measures of Central Tendency
ddh
h Som e com m on factor in the d values
iii Com bined A Mn x n x
n nx
iv The sum of the deviations of all the values from their A M is x x
' , .
( ) . .
( ) . . . ( )
= =
=++
=
= ∑ − =
1 1 2 2
1 212
0 0algebraic
Quantitative Aptitude – Question Bank 3
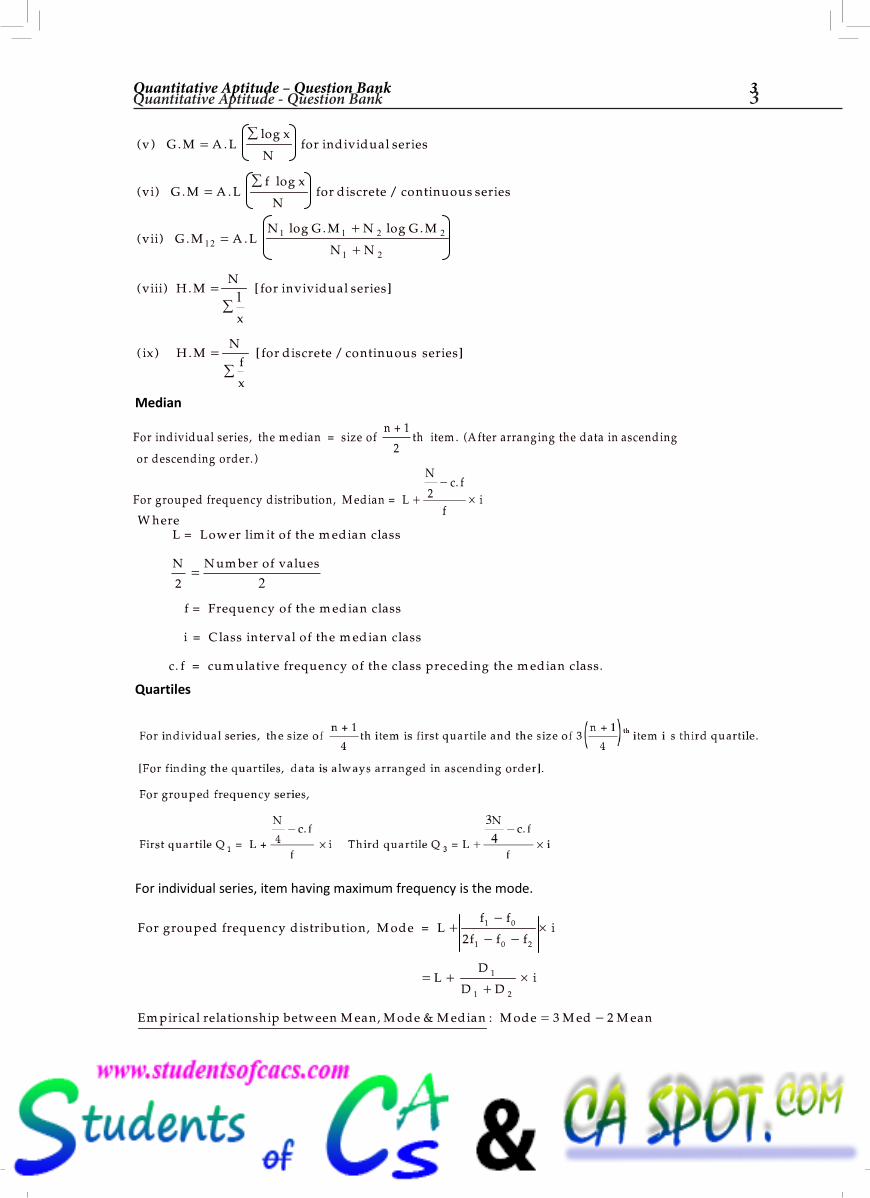
For individual series, the m edian = size ofn + 1
2th item . (A fter arranging the data in ascending
or descending order. )
For grouped frequency distribution, M edian = L
N2+−
×c f
fi
.
( ) . .log
( ) . .log
/
( ) . .log . log .
( ) . [
( ) . [ /
v G M A Lx
Nfor individual series
vi G M A Lf x
Nfor discrete continuous series
vii G M A LN G M N G M
N N
viii H MN
x
for invividual series]
ix H MN
fx
for discrete continuous series]
=∑
=∑
=++
=∑
=∑
121 1 2 2
1 2
1
Median
W here L = Low er lim it of the m edian class
N2
N um ber of values
f = Frequency of the m edian class
i = Class interval of the m edian class
c. f = cum ulative frequency of the class preceding the m edian class.
=2
Quartiles
For individual series, item having maximum frequency is the mode.
For grouped frequency distribution, M ode = Lf f
2f f fi
LD
D Di
Em pirical relationship betw een M ean, M ode & M edian : M ode 3 M ed 2 M ean
1 0
1 0 2
1
1 2
+−
− −×
= ++
×
= −
QA_QB_P0i-220A.indd 2 16/04/14 3:08 PM
Quantitative Aptitude - Question Bank 32 Quantitative Aptitude – Question Bank
( ) '
( ) . log
( ). log . log .
. . int .
( )
( ) Re
i Sturge s Rule
a K N
b CH ighest value Low est value
N
Range
N
Range
N o of classes
w here K N o of classes, N N o of item s, C Class w idth or class erval
ii Frequency density of a classFrequency of that class
W idth of that class
iii lative frequency of a classFrequency of that class
Sum of the frequencies of all the classes
= +
=−
+=
+=
= = =
=
=
1 1 322
1 3 322 1 3 322
10
10 10
( ).
. .
, . . ,
, . .
.
( ) . . . .'
, '.
i A rithm etic m eanSum of the values
N o of values
For individual series, A Mx
nx
For frequency distribution A Mfxf
x w here f N
For a grouped frequency distribution A Mfxf
w here x are the m id values of different groups
ii A M Afdf
or A M Afdf
h
w here A A ssum ed m ean d s are deviations of the m id values of different classes fromthe assum ed m ean
=
=∑
=
=∑∑
= ∑ =
=∑∑
−
= +∑∑
= +∑∑
×
=
Concept of sigma (∑)
∑ = ∑ =+
∑ =+ +
∑ =+
11
21 2 16
14
2 32 2
N NN N
NN N N
NN N
,( )
,( ) ( )
,( )
Frequency Distribution
Measures of Central Tendency
ddh
h Som e com m on factor in the d values
iii Com bined A Mn x n x
n nx
iv The sum of the deviations of all the values from their A M is x x
' , .
( ) . .
( ) . . . ( )
= =
=++
=
= ∑ − =
1 1 2 2
1 212
0 0algebraic
Quantitative Aptitude – Question Bank 3
For individual series, the m edian = size ofn + 1
2th item . (A fter arranging the data in ascending
or descending order. )
For grouped frequency distribution, M edian = L
N2+−
×c f
fi
.
( ) . .log
( ) . .log
/
( ) . .log . log .
( ) . [
( ) . [ /
v G M A Lx
Nfor individual series
vi G M A Lf x
Nfor discrete continuous series
vii G M A LN G M N G M
N N
viii H MN
x
for invividual series]
ix H MN
fx
for discrete continuous series]
=∑
=∑
=++
=∑
=∑
121 1 2 2
1 2
1
Median
W here L = Low er lim it of the m edian class
N2
N um ber of values
f = Frequency of the m edian class
i = Class interval of the m edian class
c. f = cum ulative frequency of the class preceding the m edian class.
=2
Quartiles
For individual series, item having maximum frequency is the mode.
For grouped frequency distribution, M ode = Lf f
2f f fi
LD
D Di
Em pirical relationship betw een M ean, M ode & M edian : M ode 3 M ed 2 M ean
1 0
1 0 2
1
1 2
+−
− −×
= ++
×
= −
QA_QB_P0i-220A.indd 3 16/04/14 3:08 PM
4� Quantitative Aptitude - Question Bank4 Quantitative Aptitude – Question Bank
( ) var. .
( ) . . ( )
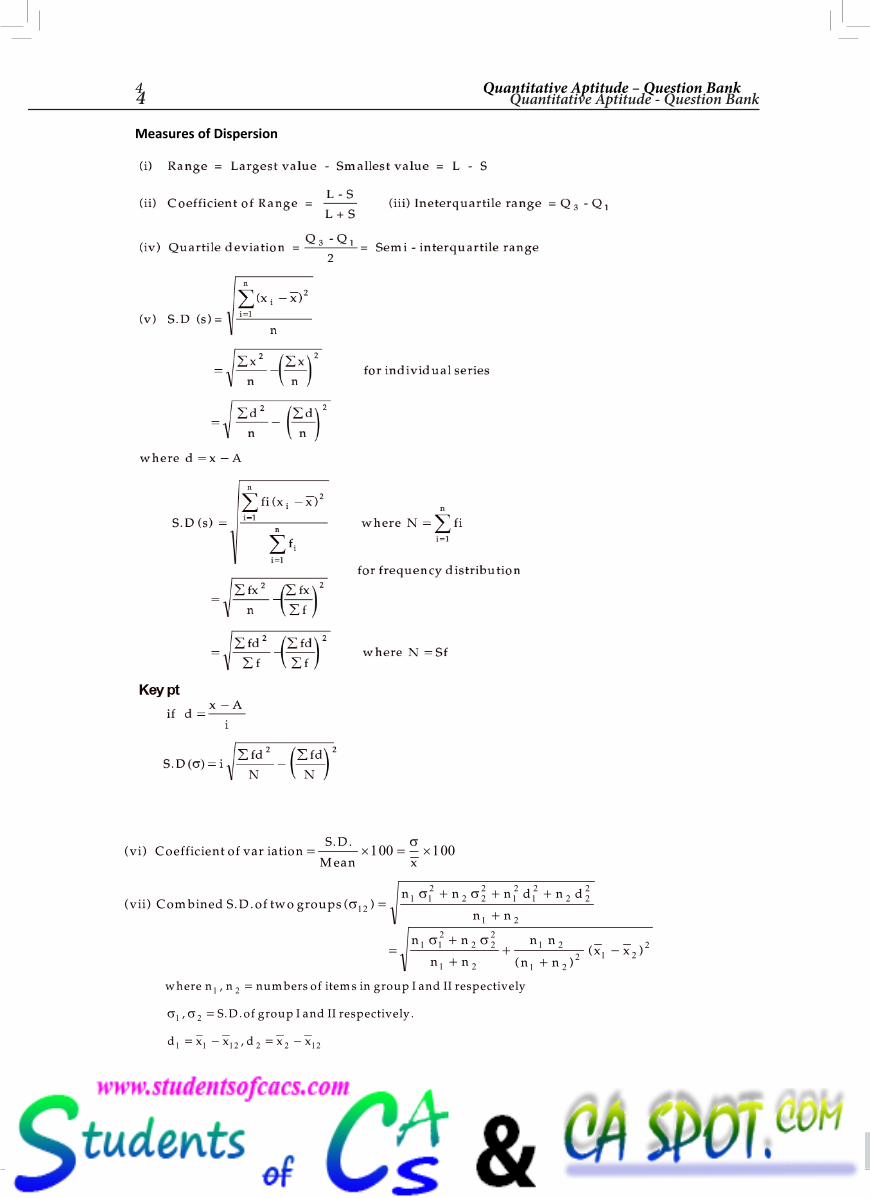
vi Coefficient of iationS D
M ean x
vii Com bined S D of tw o groupsn n n d n d
n n
= × = ×
=+ + +
+
100 100
121 1
22 2
212
12
2 22
1 2
σ
σσ σ
Measures of Dispersion
=
++
++
−n n
n n
n n
n nx x1 1
22 2
2
1 2
1 2
1 22 1 2
2σ σ( )
( )
w here n n num bers of item s in group I and II respectively
S D of group I and II respectively
d x x d x x
1 2
1 2
1 1 12 2 2 12
,
, . . .
,
=
=
= − = −
σ σ
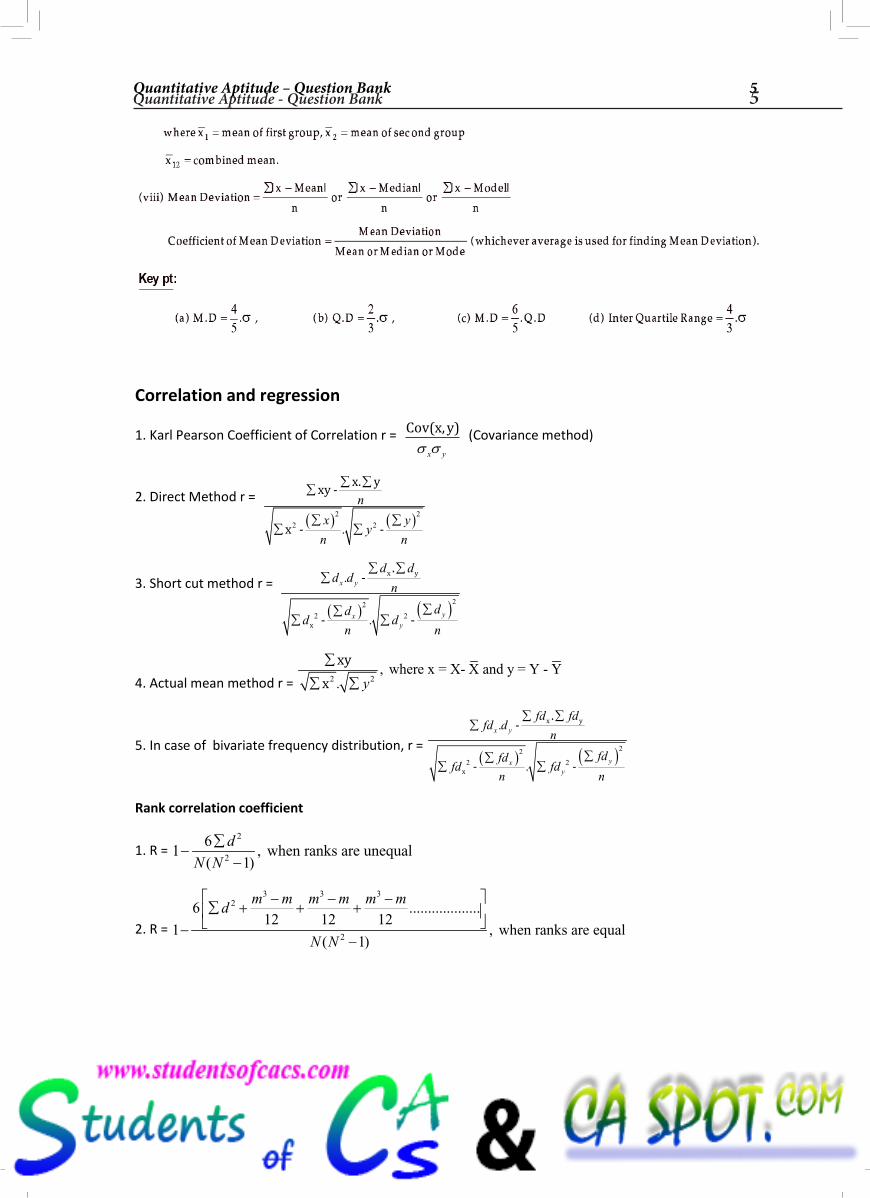
Quantitative Aptitude – Question Bank 5
Correlation and regression
1. Karl Pearson Coefficient of Correlation r = x yσ σ
Cov(x,y) (Covariance method)
2. Direct Method r =
( ) ( )2 2
2 2.
n
x yy
n n
∑ ∑∑
∑ ∑∑ ∑
x. yxy -
x - -
3. Short cut method r =
( ) ( )22
2 2
.
.
x y
yxy
d dd d
n
ddd d
n n
∑ ∑∑
∑∑∑ ∑
x y
x
.-
- -
4. Actual mean method r = 2 2, where x = X- X and y = Y - Y
. y
∑
∑ ∑
xyx
5. In case of bivariate frequency distribution, r = ( ) ( )22
2 2
.
.
x y
yxy
fd fdfd d
n
fdfdfd fd
n n
∑ ∑∑
∑∑∑ ∑
x y
x
.-
- -
Rank correlation coefficient
1. R = 2
2
61 , when ranks are unequal
( 1)
d
N N
∑−
−
2. R =
3 3 32
2
6 ...................12 12 12
1 , when ranks are equal( 1)
m m m m m md
N N
− − −∑ + + + −
−
QA_QB_P0i-220A.indd 4 16/04/14 3:08 PM
Quantitative Aptitude - Question Bank 54 Quantitative Aptitude – Question Bank
( ) var. .
( ) . . ( )
vi Coefficient of iationS D
M ean x
vii Com bined S D of tw o groupsn n n d n d
n n
= × = ×
=+ + +
+
100 100
121 1
22 2
212
12
2 22
1 2
σ
σσ σ
Measures of Dispersion
=
++
++
−n n
n n
n n
n nx x1 1
22 2
2
1 2
1 2
1 22 1 2
2σ σ( )
( )
w here n n num bers of item s in group I and II respectively
S D of group I and II respectively
d x x d x x
1 2
1 2
1 1 12 2 2 12
,
, . . .
,
=
=
= − = −
σ σ
Quantitative Aptitude – Question Bank 5
Correlation and regression
1. Karl Pearson Coefficient of Correlation r = x yσ σ
Cov(x,y) (Covariance method)
2. Direct Method r =
( ) ( )2 2
2 2.
n
x yy
n n
∑ ∑∑
∑ ∑∑ ∑
x. yxy -
x - -
3. Short cut method r =
( ) ( )22
2 2
.
.
x y
yxy
d dd d
n
ddd d
n n
∑ ∑∑
∑∑∑ ∑
x y
x
.-
- -
4. Actual mean method r = 2 2, where x = X- X and y = Y - Y
. y
∑
∑ ∑
xyx
5. In case of bivariate frequency distribution, r = ( ) ( )22
2 2
.
.
x y
yxy
fd fdfd d
n
fdfdfd fd
n n
∑ ∑∑
∑∑∑ ∑
x y
x
.-
- -
Rank correlation coefficient
1. R = 2
2
61 , when ranks are unequal
( 1)
d
N N
∑−
−
2. R =
3 3 32
2
6 ...................12 12 12
1 , when ranks are equal( 1)
m m m m m md
N N
− − −∑ + + + −
−
QA_QB_P0i-220A.indd 5 16/04/14 3:08 PM
6� Quantitative Aptitude - Question Bank6 Quantitative Aptitude – Question Bank
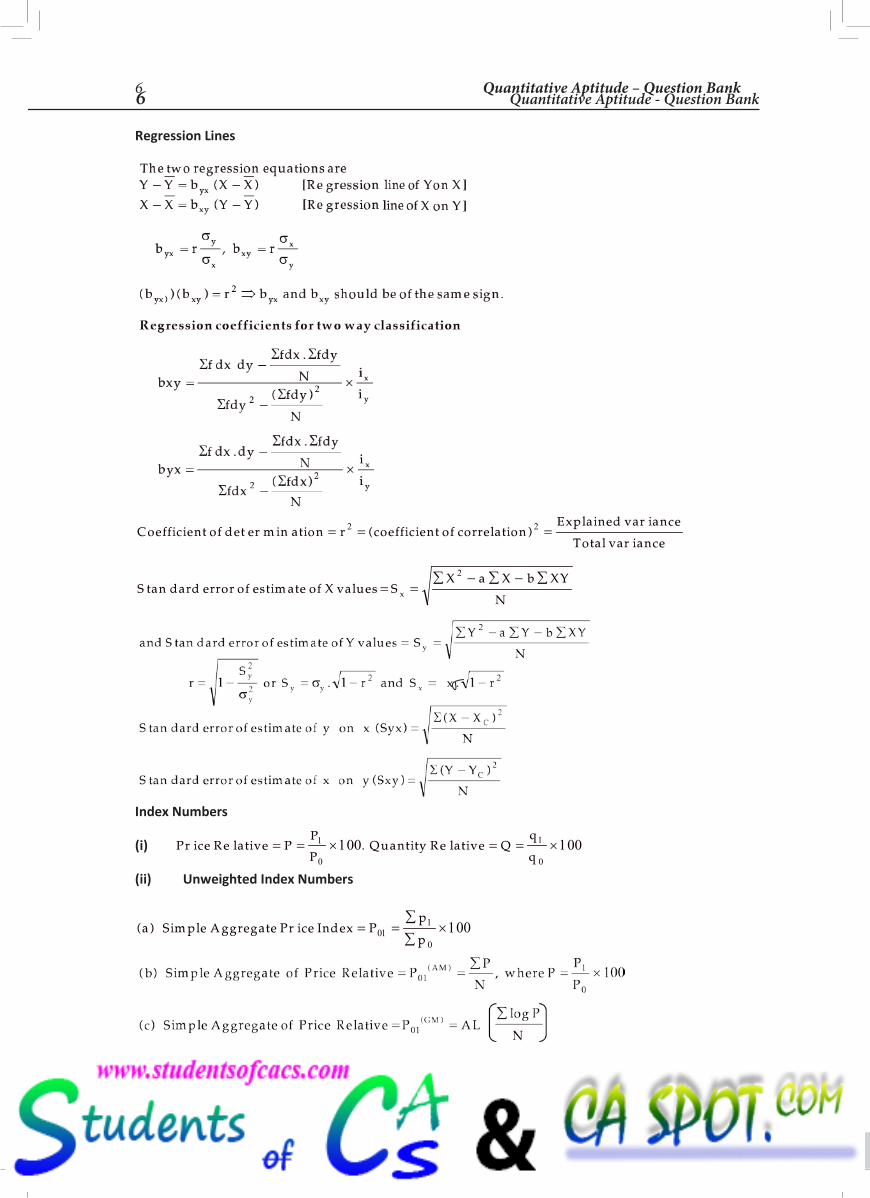
Regression Lines
Coefficient of er ation r coefficient of correlationExplained iance
Total iance
S dard error of estim ate of X values SX a X b XY
Nx
det m in ( )var
var
tan
= = =
= =∑ − ∑ − ∑
2 2
2
Index Numbers
(i)
(ii) Unweighted Index Numbers
( ) Pra Sim ple A ggregate ice Index Pp
p= =
∑∑
×011
0
100
Pr Re . Reice lative PP
PQuantity lative Q
q
q= = × = = ×1
0
1
0
100 100
Quantitative Aptitude – Question Bank 7
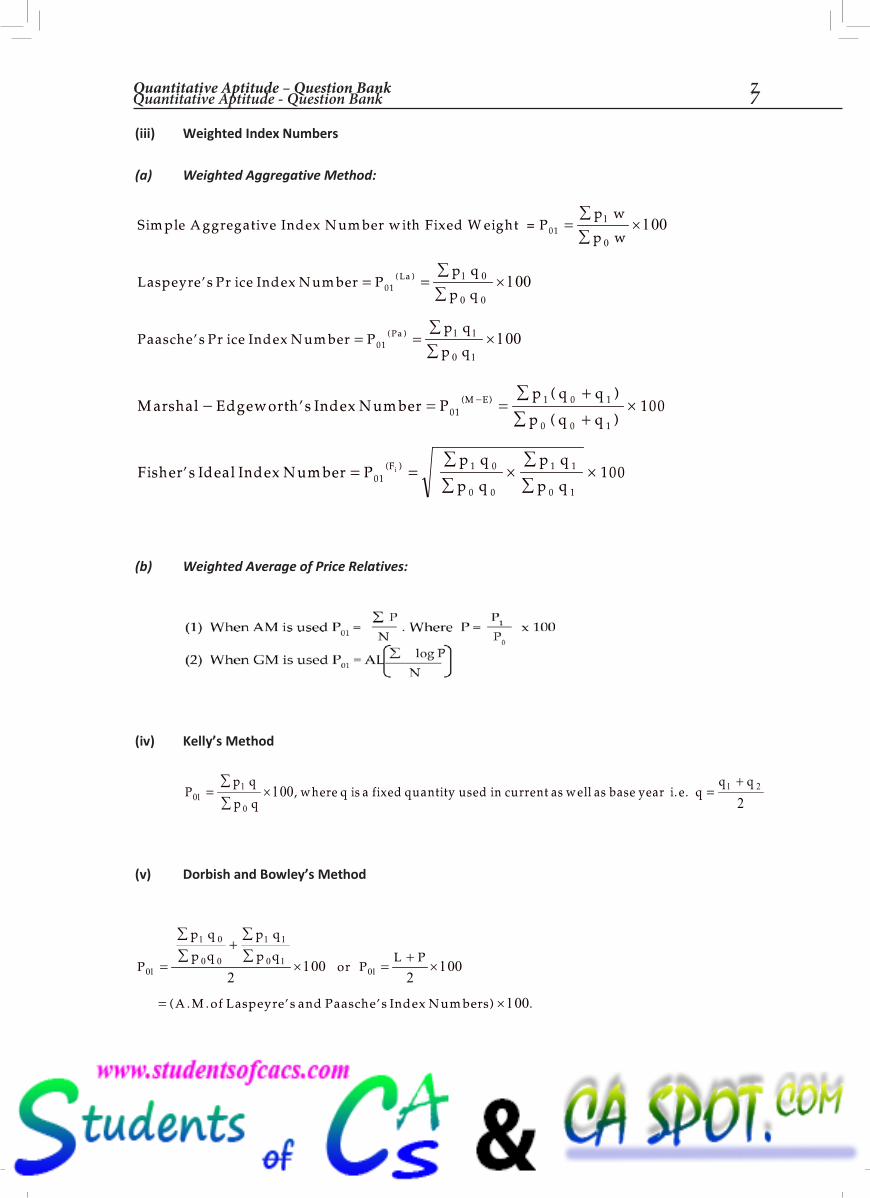
(iii) Weighted Index Numbers
(a) Weighted Aggregative Method:
Sim ple A ggregative Index N um ber w ith Fixed W eight = P
P
P
01
01
01
=∑∑
×
= =∑∑
×
= =∑∑
×
p w
p w
Laspeyre s ice Index N um berp q
p q
Paasche s ice Index N um berp q
p q
La
Pa
1
0
1 0
0 0
1 1
0 1
100
100
100
' Pr
' Pr
( )
( )
M arshal Edgew orth's Index N um ber Pp ( q q )
p ( q q )100
Fisher's Ideal Index N um ber Pp q
p q
p q
p q100
01(M E) 1 0 1
0 0 1
01(F ) 1 0
0 0
1 1
0 1
i
− = =∑ +∑ +
×
= =∑∑
×∑∑
×
−
(b) Weighted Average of Price Relatives:
(iv) Kelly’s Method
Pp q
p qw here q is a fixed quantity used in current as w ell as base year i e q
q q01
1
0
1 21002
=∑∑
× =+
, . .
(v) Dorbish and Bowley’s Method
P
p q
p q
p q
p qor P
L P
A M of Laspeyre s and Paasche s Index N um bers)
01
1 0
0 0
1 1
0 1012
1002
100
100
=
∑∑
+∑∑
× =+
×
= ×( . . ' ' .
QA_QB_P0i-220A.indd 6 16/04/14 3:08 PM
Quantitative Aptitude - Question Bank 76 Quantitative Aptitude – Question Bank
Regression Lines
Coefficient of er ation r coefficient of correlationExplained iance
Total iance
S dard error of estim ate of X values SX a X b XY
Nx
det m in ( )var
var
tan
= = =
= =∑ − ∑ − ∑
2 2
2
Index Numbers
(i)
(ii) Unweighted Index Numbers
( ) Pra Sim ple A ggregate ice Index Pp
p= =
∑∑
×011
0
100
Pr Re . Reice lative PP
PQuantity lative Q
q
q= = × = = ×1
0
1
0
100 100
Quantitative Aptitude – Question Bank 7
(iii) Weighted Index Numbers
(a) Weighted Aggregative Method:
Sim ple A ggregative Index N um ber w ith Fixed W eight = P
P
P
01
01
01
=∑∑
×
= =∑∑
×
= =∑∑
×
p w
p w
Laspeyre s ice Index N um berp q
p q
Paasche s ice Index N um berp q
p q
La
Pa
1
0
1 0
0 0
1 1
0 1
100
100
100
' Pr
' Pr
( )
( )
M arshal Edgew orth's Index N um ber Pp ( q q )
p ( q q )100
Fisher's Ideal Index N um ber Pp q
p q
p q
p q100
01(M E) 1 0 1
0 0 1
01(F ) 1 0
0 0
1 1
0 1
i
− = =∑ +∑ +
×
= =∑∑
×∑∑
×
−
(b) Weighted Average of Price Relatives:
(iv) Kelly’s Method
Pp q
p qw here q is a fixed quantity used in current as w ell as base year i e q
q q01
1
0
1 21002
=∑∑
× =+
, . .
(v) Dorbish and Bowley’s Method
P
p q
p q
p q
p qor P
L P
A M of Laspeyre s and Paasche s Index N um bers)
01
1 0
0 0
1 1
0 1012
1002
100
100
=
∑∑
+∑∑
× =+
×
= ×( . . ' ' .
QA_QB_P0i-220A.indd 7 16/04/14 3:08 PM
8� Quantitative Aptitude - Question Bank8 Quantitative Aptitude – Question Bank
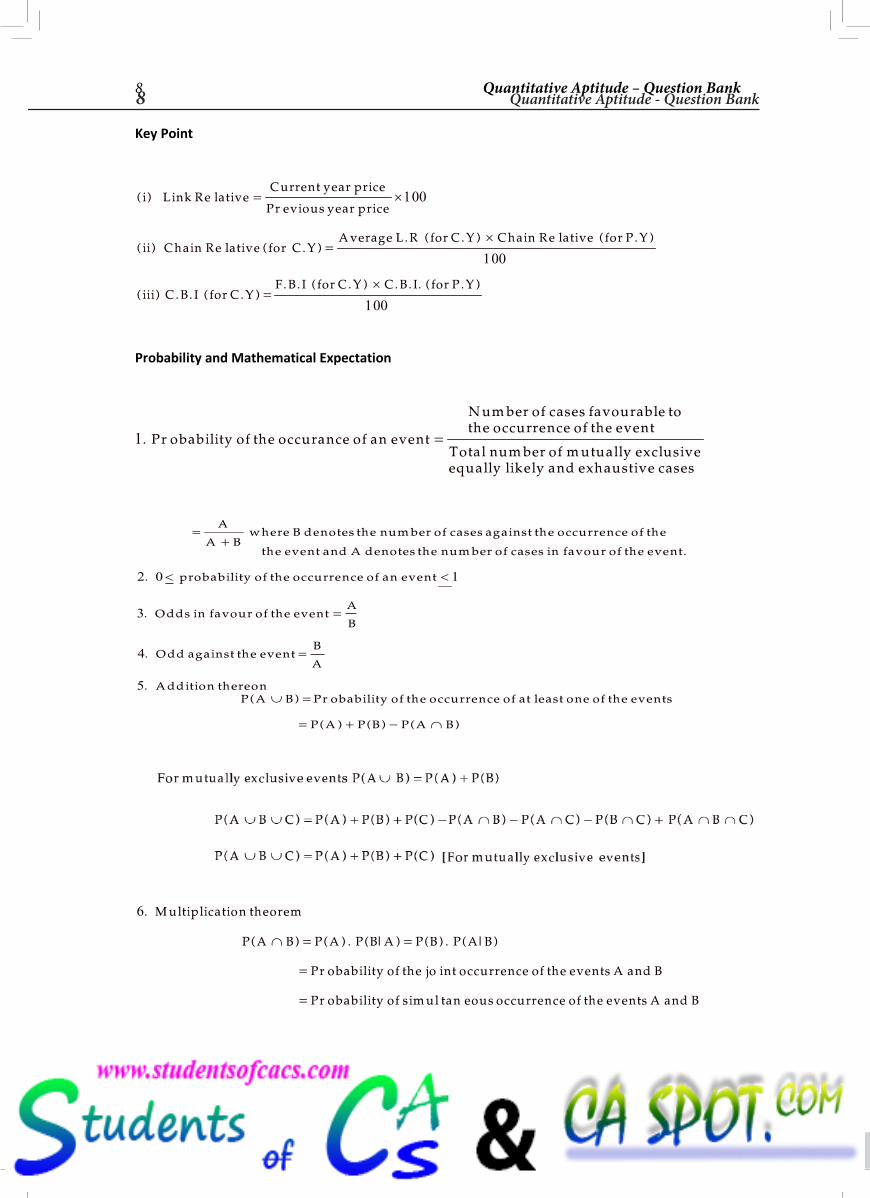
Key Point
( ) RePr
( ) Re ( . ). ( . ) Re ( . )
( ) . . ( . ). . ( . ) . . . ( . )
i Link lativeCurrent year price
evious year price
ii Chain lative for C YA verage L R for C Y Chain lative for P Y
iii C B I for C YF B I for C Y C B I for P Y
= ×
=×
=×
100
100
100
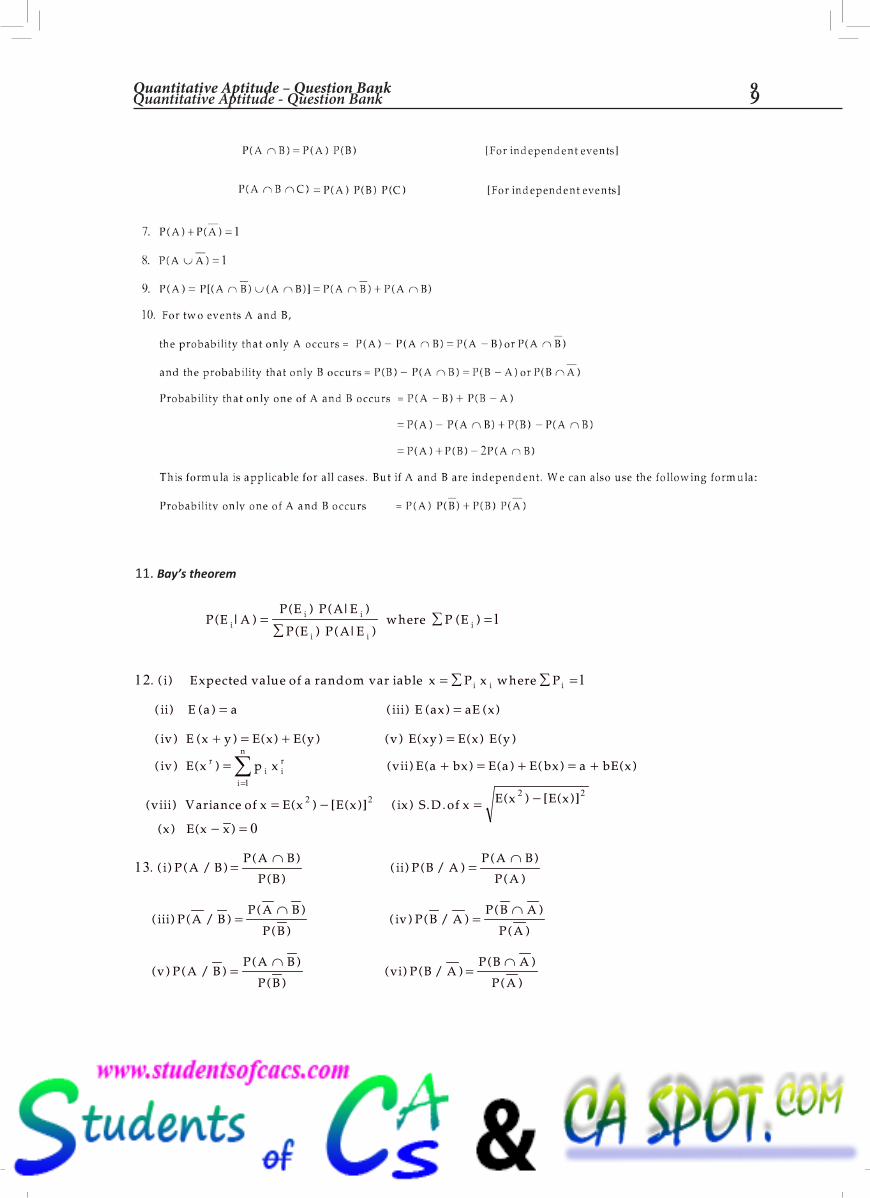
Probability and Mathematical Expectation
1. Pr obability of the occurance of an event
N um ber of cases favourable tothe occurrence of the event
Total num ber of m utually exclusiveequally likely and exhaustive cases
=
=+
< <
=
=
∪ =
= + − ∩
AA B
w here B denotes the num ber of cases against the occurrence of the
the event and A denotes the num ber of cases in favour of the event
probability of the occurrence of an event
Odds in favour of the eventAB
Odd against the eventBA
A ddition thereonP A B obability of the occurrence of at least one of the events
P A P B P A B
.
.
.
.
.( ) Pr
( ) ( ) ( )
2 0 1
3
4
5
6.
( ) ( ) . ( | ) ( ) . ( | )
Pr int
Pr tan
M ultiplication theorem
P A B P A P B A P B P A B
obability of the jo occurrence of the events A and B
obability of sim ul eous occurrence of the events A and B
∩ = =
=
=
Quantitative Aptitude – Question Bank 9
11. Bay’s theorem
P E AP E P A E
P E P A Ew here P Ei
i i
i ii( | )
( ) ( | )
( ) ( | )( )=
∑∑ =1
12 1
1
2 22 2
. ( ) var
( ) ( ) ( ) ( ) ( )
( ) ( ) ( ) ( ) ( ) ( ) ( ) ( )
( ) ( ) ( ) ( ) ( ) ( ) ( )
( ) ( ) [ ( )] ( ) . . ( ) [ ( )]
( ) ( )
i Expected value of a random iable x P x w here P
ii E a a iii E ax aE x
iv E x y E x E y v E xy E x E y
iv E x p x vii E a bx E a E bx a bE x
viii Variance of x E x E x ix S D of x E x E x
x E x x
i i i
ri i
r
i
n
= ∑ ∑ =
= =
+ = + =
= + = + = +
= − = −
−
=∑
=
=∩
=∩
=∩
=∩
=∩
=∩
0
13. ( ) ( / )( )
( )( ) ( / )
( )( )
( ) ( / )( )
( )( ) ( / )
( )
( )
( ) ( / )( )
( )( ) ( / )
( )
( )
i P A BP A B
P Bii P B A
P A BP A
iii P A BP A B
P Biv P B A
P B A
P A
v P A BP A B
P Bvi P B A
P B A
P A
QA_QB_P0i-220A.indd 8 16/04/14 3:08 PM
Quantitative Aptitude - Question Bank 98 Quantitative Aptitude – Question Bank
Key Point
( ) RePr
( ) Re ( . ). ( . ) Re ( . )
( ) . . ( . ). . ( . ) . . . ( . )
i Link lativeCurrent year price
evious year price
ii Chain lative for C YA verage L R for C Y Chain lative for P Y
iii C B I for C YF B I for C Y C B I for P Y
= ×
=×
=×
100
100
100
Probability and Mathematical Expectation
1. Pr obability of the occurance of an event
N um ber of cases favourable tothe occurrence of the event
Total num ber of m utually exclusiveequally likely and exhaustive cases
=
=+
< <
=
=
∪ =
= + − ∩
AA B
w here B denotes the num ber of cases against the occurrence of the
the event and A denotes the num ber of cases in favour of the event
probability of the occurrence of an event
Odds in favour of the eventAB
Odd against the eventBA
A ddition thereonP A B obability of the occurrence of at least one of the events
P A P B P A B
.
.
.
.
.( ) Pr
( ) ( ) ( )
2 0 1
3
4
5
6.
( ) ( ) . ( | ) ( ) . ( | )
Pr int
Pr tan
M ultiplication theorem
P A B P A P B A P B P A B
obability of the jo occurrence of the events A and B
obability of sim ul eous occurrence of the events A and B
∩ = =
=
=
Quantitative Aptitude – Question Bank 9
11. Bay’s theorem
P E AP E P A E
P E P A Ew here P Ei
i i
i ii( | )
( ) ( | )
( ) ( | )( )=
∑∑ =1
12 1
1
2 22 2
. ( ) var
( ) ( ) ( ) ( ) ( )
( ) ( ) ( ) ( ) ( ) ( ) ( ) ( )
( ) ( ) ( ) ( ) ( ) ( ) ( )
( ) ( ) [ ( )] ( ) . . ( ) [ ( )]
( ) ( )
i Expected value of a random iable x P x w here P
ii E a a iii E ax aE x
iv E x y E x E y v E xy E x E y
iv E x p x vii E a bx E a E bx a bE x
viii Variance of x E x E x ix S D of x E x E x
x E x x
i i i
ri i
r
i
n
= ∑ ∑ =
= =
+ = + =
= + = + = +
= − = −
−
=∑
=
=∩
=∩
=∩
=∩
=∩
=∩
0
13. ( ) ( / )( )
( )( ) ( / )
( )( )
( ) ( / )( )
( )( ) ( / )
( )
( )
( ) ( / )( )
( )( ) ( / )
( )
( )
i P A BP A B
P Bii P B A
P A BP A
iii P A BP A B
P Biv P B A
P B A
P A
v P A BP A B
P Bvi P B A
P B A
P A
QA_QB_P0i-220A.indd 9 16/04/14 3:08 PM
10� Quantitative Aptitude - Question Bank10 Quantitative Aptitude – Question Bank
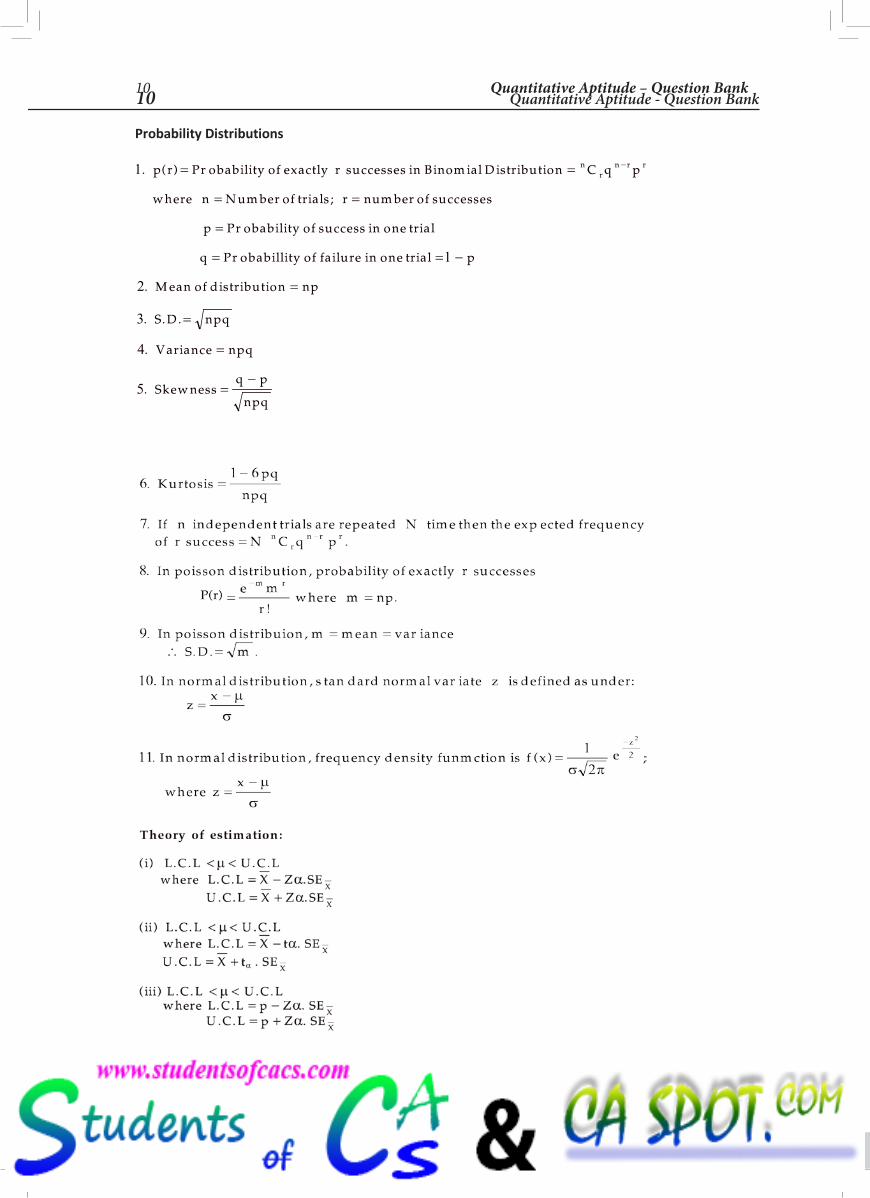
Probability Distributions
1
1
2
3
4
5
. ( ) Pr
;
Pr
Pr
.
. . .
.
.
p r obability of exactly r successes in Binom ial D istribution C q p
w here n N um ber of trials r num ber of successes
p obability of success in one trial
q obabillity of failure in one trial p
M ean of distribution np
S D npq
Variance npq
Skew nessq p
npq
nr
n r r= =
= =
=
= = −
=
=
=
=−
−
Quantitative Aptitude – Question Bank 11
( ) [ ]
( ) . [ ]
( ) . ,
( ) . ,
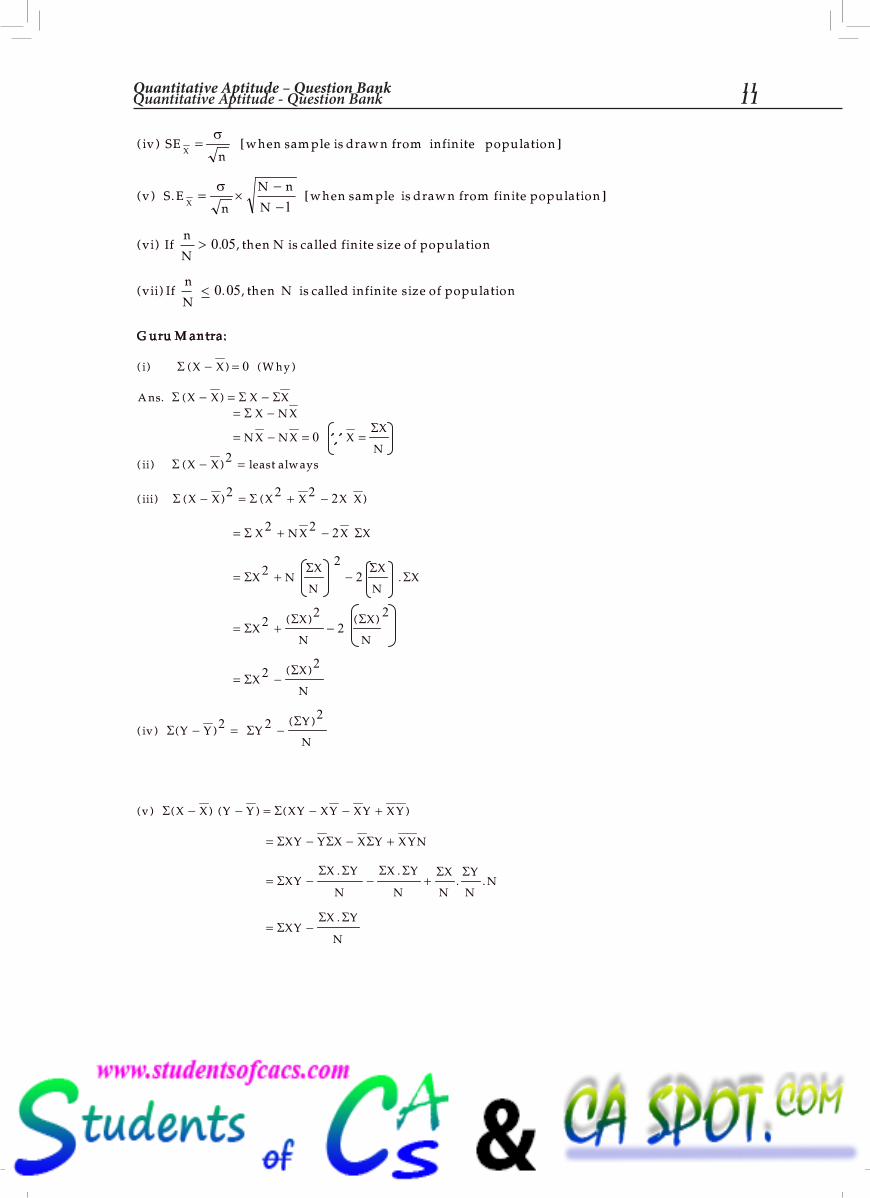
iv SEn
w hen sam ple is draw n from population
v S En
N nN
w hen sam ple is draw n from finite population
vi IfnN
then N is called finite size of population
vii IfnN
then N is called ize of population
X
X
=
= ×−−
>
<
σ
σ
infinite
infinite s
1
0 05
0 05
G uru M an tra:
( ) ( ) ( )
. ( )
( ) ( )
( ) ( ) ( )
.
( ) ( )
( )
( ) ( )( )
i X X W hy
A ns X X X XX N X
N X N X XX
Nii X X least alw ays
iii X X X X X X
X N X X X
X NX
N
X
NX
XX
N
X
N
XX
N
iv Y Y YY
N
Σ
Σ Σ ΣΣ
Σ
Σ
Σ Σ
Σ Σ
ΣΣ Σ
Σ
ΣΣ Σ
ΣΣ
Σ ΣΣ
− =
− = −= −
= − = =
− =
− = + −
= + −
= + −
= + −
= −
− = −
0
0
2
2 2 2 2
2 2 2
22
2
22
22
22
2 22
( ) ( ) ( ) ( )
. .. .
.
v X X Y Y XY X Y X Y X Y
XY Y X X Y X Y N
XYX Y
N
X Y
N
X
N
Y
NN
XYX Y
N
Σ Σ
Σ Σ Σ
ΣΣ Σ Σ Σ Σ Σ
ΣΣ Σ
− − = − − +
= − − +
= − − +
= −
QA_QB_P0i-220A.indd 10 16/04/14 3:08 PM
Quantitative Aptitude - Question Bank 1110 Quantitative Aptitude – Question Bank
Probability Distributions
1
1
2
3
4
5
. ( ) Pr
;
Pr
Pr
.
. . .
.
.
p r obability of exactly r successes in Binom ial D istribution C q p
w here n N um ber of trials r num ber of successes
p obability of success in one trial
q obabillity of failure in one trial p
M ean of distribution np
S D npq
Variance npq
Skew nessq p
npq
nr
n r r= =
= =
=
= = −
=
=
=
=−
−
Quantitative Aptitude – Question Bank 11
( ) [ ]
( ) . [ ]
( ) . ,
( ) . ,
iv SEn
w hen sam ple is draw n from population
v S En
N nN
w hen sam ple is draw n from finite population
vi IfnN
then N is called finite size of population
vii IfnN
then N is called ize of population
X
X
=
= ×−−
>
<
σ
σ
infinite
infinite s
1
0 05
0 05
G uru M an tra:
( ) ( ) ( )
. ( )
( ) ( )
( ) ( ) ( )
.
( ) ( )
( )
( ) ( )( )
i X X W hy
A ns X X X XX N X
N X N X XX
Nii X X least alw ays
iii X X X X X X
X N X X X
X NX
N
X
NX
XX
N
X
N
XX
N
iv Y Y YY
N
Σ
Σ Σ ΣΣ
Σ
Σ
Σ Σ
Σ Σ
ΣΣ Σ
Σ
ΣΣ Σ
ΣΣ
Σ ΣΣ
− =
− = −= −
= − = =
− =
− = + −
= + −
= + −
= + −
= −
− = −
0
0
2
2 2 2 2
2 2 2
22
2
22
22
22
2 22
( ) ( ) ( ) ( )
. .. .
.
v X X Y Y XY X Y X Y X Y
XY Y X X Y X Y N
XYX Y
N
X Y
N
X
N
Y
NN
XYX Y
N
Σ Σ
Σ Σ Σ
ΣΣ Σ Σ Σ Σ Σ
ΣΣ Σ
− − = − − +
= − − +
= − − +
= −
QA_QB_P0i-220A.indd 11 16/04/14 3:08 PM