Embed Size (px)
Citation preview

Quantitative Analysis of Survey Data and Other Assessments for Non-Experts:
How to do SoTL without a statistician on retainer
June 2, 2011
Gintaras Duda
Creighton University
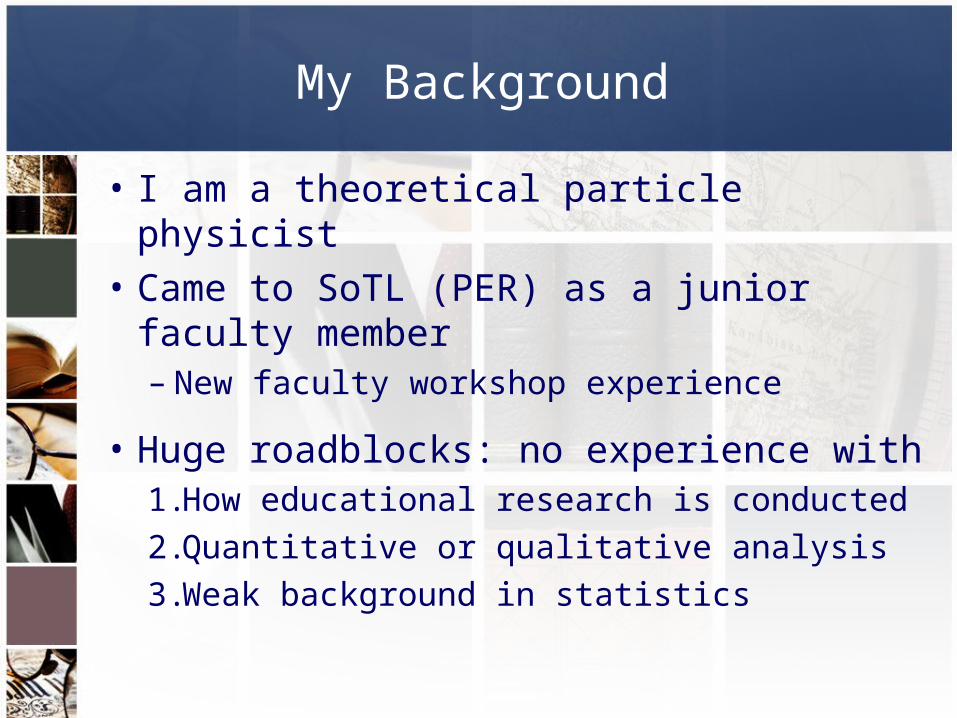
My Background
• I am a theoretical particle physicist
• Came to SoTL (PER) as a junior faculty member– New faculty workshop experience
• Huge roadblocks: no experience with1.How educational research is conducted
2.Quantitative or qualitative analysis
3.Weak background in statistics

Areas of SoTL interest
• Attitude of introductory physics students– Particularly how it affects learning
• Online discussion behavior• Realism in physics• Problem-Based Learning in upper division
courses• Student note taking• How students use the internet to learn
physics

Workshop Purpose
• As SoTL matures, publication requires more and more rigorous measures and evidence– Sophisticated statistical tests
– Careful survey design and analysis
– Mixed method research
– Evidence, evidence, evidence!
• But, many of us are untrained in these things

Who are you?
• Please share with the group:
1.Name, institution, and discipline
2.Why you picked this workshop
3.What you hope to gain

Workshop Purpose continued …
• Leave you with some simple tools to analyze:1. Likert scale surveys
2. Effects of instruction
3. Survey reliability and validity
• No stats class or methods courses required

Part I. What to do with Likert Scales
• Likert scale instruments seem ubiquitous in SoTL work
• Particularly useful in measuring students’ attitudes, feelings, opinions, dispositions, etc.– Can use pre-post scheme to see changes and
growth/deterioration– Of interest in Jesuit Pedagogy (another
workshop)

Example from physics
• Attitudinal surveys– Measure students’ changes in attitude towards
physics due to instruction– Instruments: VASS, MPEX, C-LASS, Attitude
II, and others
• These instruments all show a similar trend– Students have more negative attitudes towards
physics after instruction
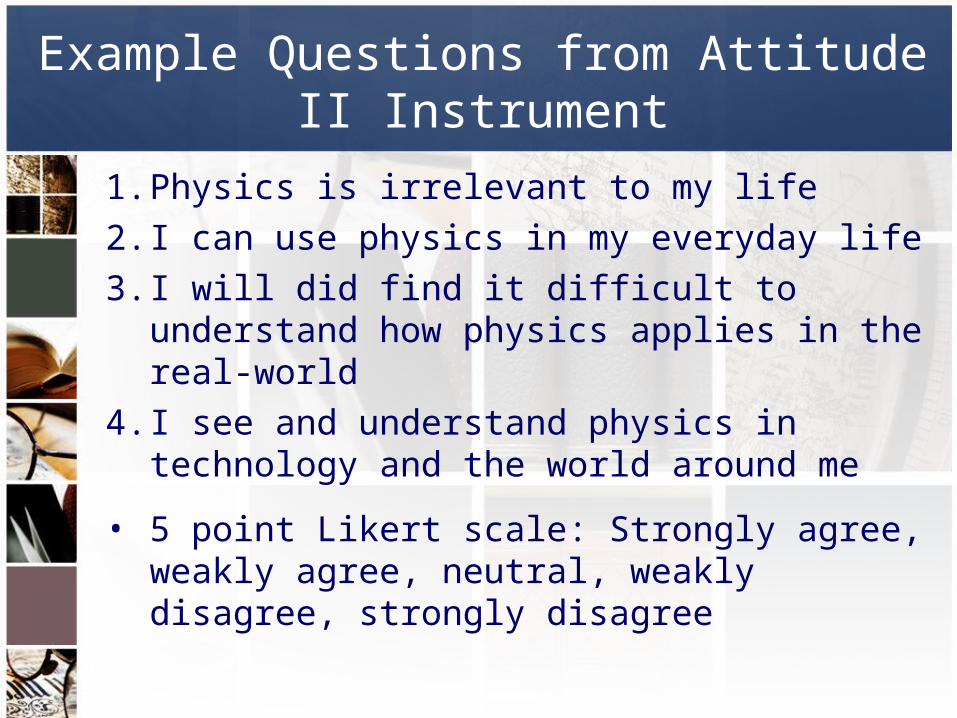
Example Questions from Attitude II Instrument
1. Physics is irrelevant to my life
2. I can use physics in my everyday life
3. I will did find it difficult to understand how physics applies in the real-world
4. I see and understand physics in technology and the world around me
• 5 point Likert scale: Strongly agree, weakly agree, neutral, weakly disagree, strongly disagree
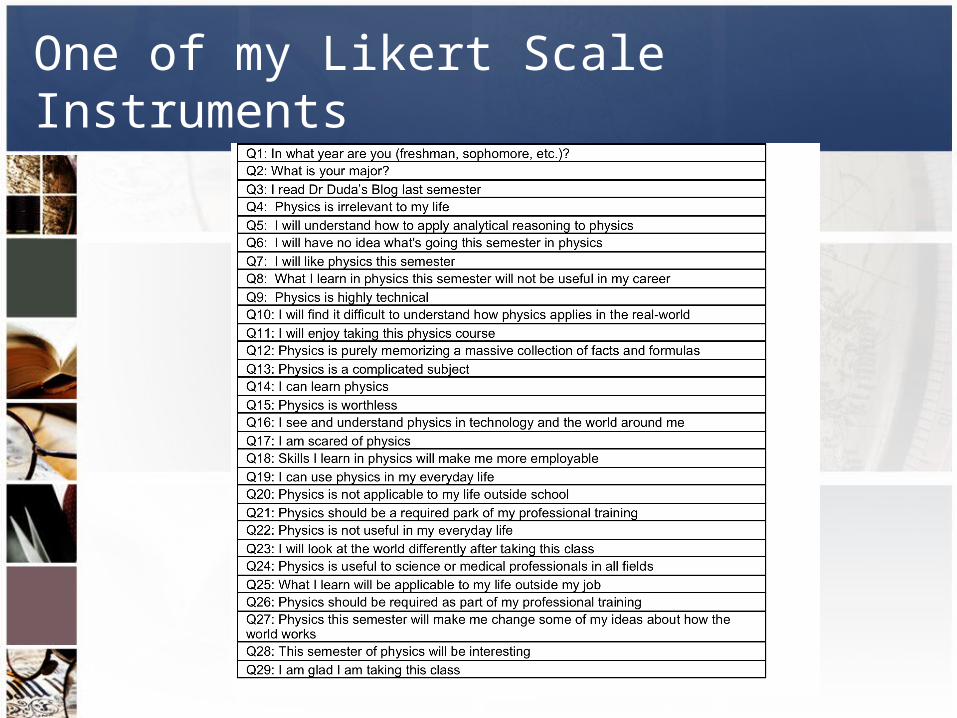
One of my Likert Scale Instruments

What do I do with Likert Scale Data?
• Two camps on analyzing Likert scale data
1.Interval Approach
2.Ordinal Approach
• Methods for data analysis differ between the two methods

Interval Data
• Basic philosophy: differences between responses are all equal– i.e. Difference to a student between strongly
disagree and weakly disagree is the same as the difference between a neutral response and weakly agree
• Basic technique: Sum the data and do some statistics
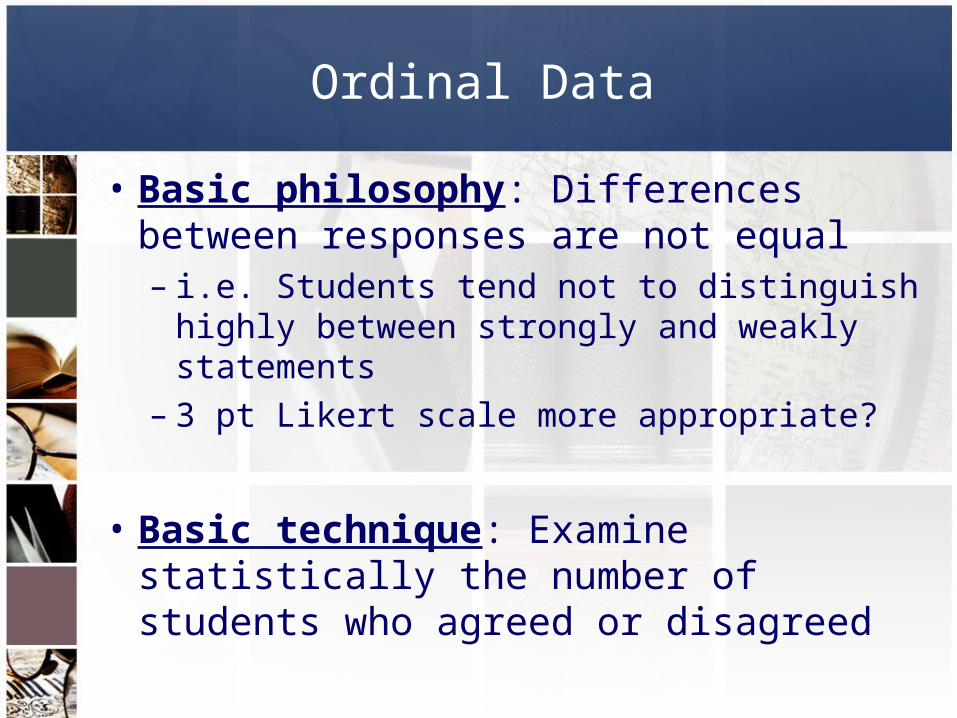
Ordinal Data
• Basic philosophy: Differences between responses are not equal– i.e. Students tend not to distinguish highly
between strongly and weakly statements– 3 pt Likert scale more appropriate?
• Basic technique: Examine statistically the number of students who agreed or disagreed

Controversy over neutral response
• Good debate in the literature about the neutral/neither agree nor disagree response
• Some claim it’s crucial
• Some claim you should get rid of it
• Not going to discuss it here

Analyzing Ordinal Data
• One method is to reduce the problem to a “binomial analysis”– Lump all disagrees together, all agrees together,
and don’t worry about neutral responses
• Visual method: Agree-disagree (Redish) plots
Redish, J. Saul, and R. Steinberg, “Student expectations in introductory physics,” Am. J. Phys. 66, 212–224 1998.

Agree-Disagree Plots
• Introduced by Redish et al. in their MPEX paper - called “Redish” plots
Change from pre to post must be > 2σ to be considered significant
(at 5% probability level)
New Agree PercentageNew Disagree Percentage
Standard Deviation Redish, J. Saul, and R. Steinberg, Am. J. Phys. 66, 212–224 1998.

40%
60%
80%
100%
0% 20% 40% 60%
Agree (Unfavorable)
Dis
ag
ree
(F
av
ora
ble
)
Blog non-participants pre
Blog non-participants post
Blog participants pre
Blog participants post
Figure 3: A-D plot for Semester II (spring 2006) for question 7: "I will (or did) find it difficult to understand how physics applies in the real world."
Example of an Agree-Disagree Plot
Duda, G., Garrett, K., Am. J. Phys. 76, 1054 (2008).

40%
60%
80%
100%
0% 20% 40% 60%
Unfavorable Responses
Fa
vo
rab
le R
es
po
ns
es
Blog non-participants pre
Blog non-participants post
Blog participants pre
Blog participants post
Figure 5a: A-D plot for Semester II (spring 2006) for an average of the "reality link" questions.
Duda, G., Garrett, K., Am. J. Phys. 76, 1054 (2008).
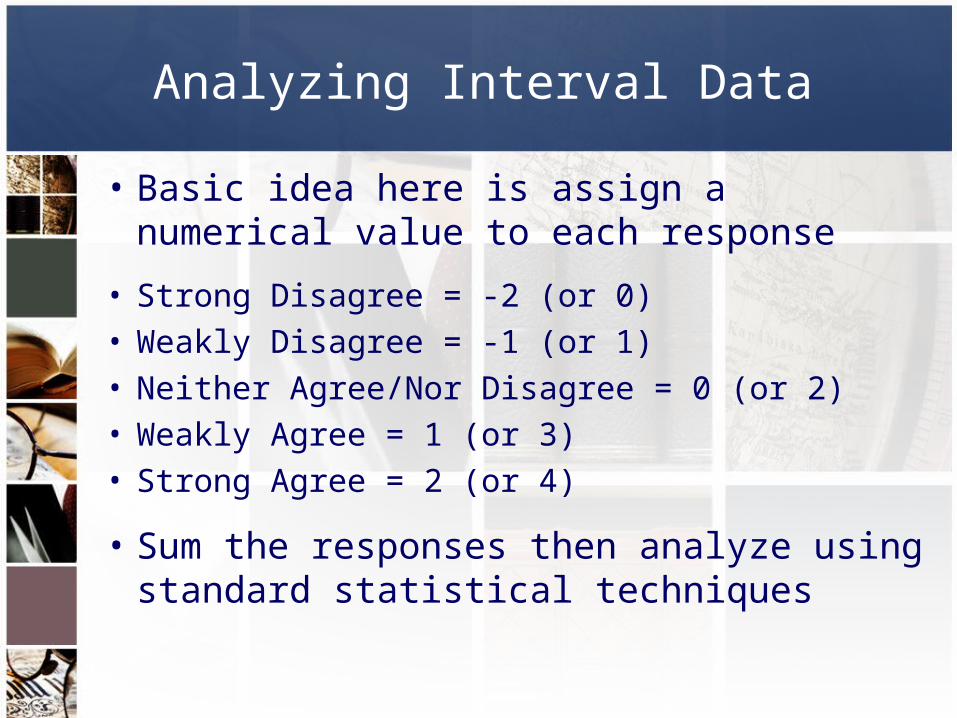
Analyzing Interval Data
• Basic idea here is assign a numerical value to each response
• Strong Disagree = -2 (or 0)• Weakly Disagree = -1 (or 1)• Neither Agree/Nor Disagree = 0 (or 2)• Weakly Agree = 1 (or 3)• Strong Agree = 2 (or 4)
• Sum the responses then analyze using standard statistical techniques

Simple (student) t-test
• The t-test is a simple (but robust) statistical test
• Tests a hypothesis: Is there a difference between two sets of data?– Are differences statistically significant?– 95% confidence level, i.e. only a 5%
probability the difference is due to statistical fluctuations

Example: The “Gender Gap” in Intro Physics
Students Normalized Gain Statistically Significant?
Control Group
Males (n=82) 0.67
Females (n=63) 0.50
Experimental Group
Males (n=50) 0.63
Females (n=96) 0.56
Is there a difference between male and female students?
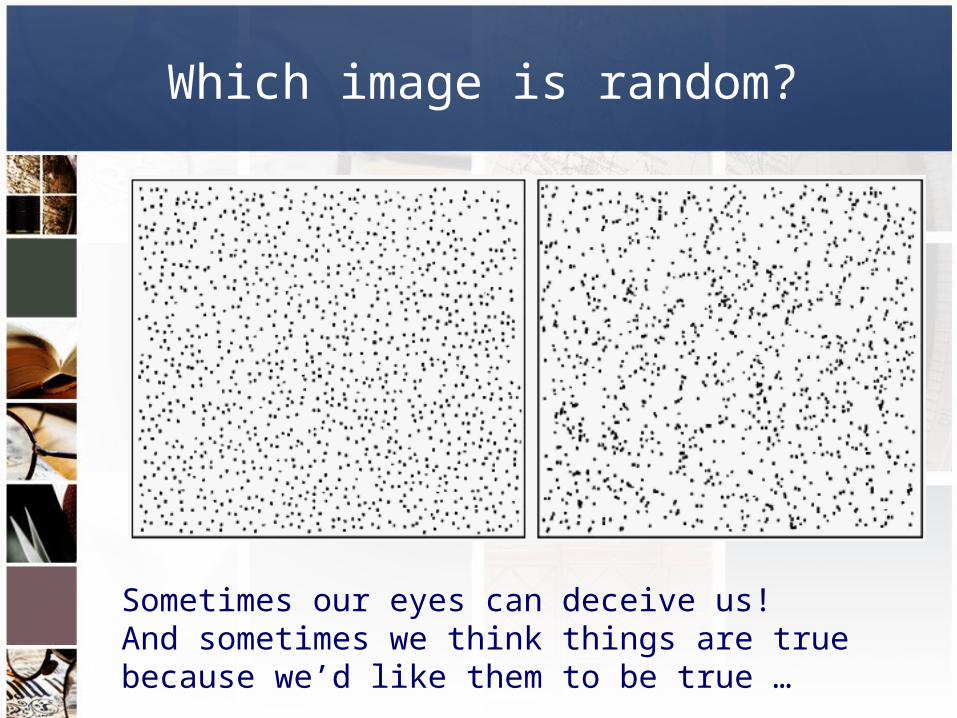
Which image is random?
Sometimes our eyes can deceive us!And sometimes we think things are true because we’d like them to be true …

The “Gender Gap”: FMCE Gains
Students Normalized Gain P-value
Control Group
Males (n=82) 0.67 < 0.05
Females (n=63) 0.50 (significant)
Experimental Group
Males (n=50) 0.63 0.165
Females (n=96) 0.56 (not significant)
In the experimental group, there is no statistically significant difference between the two genders.
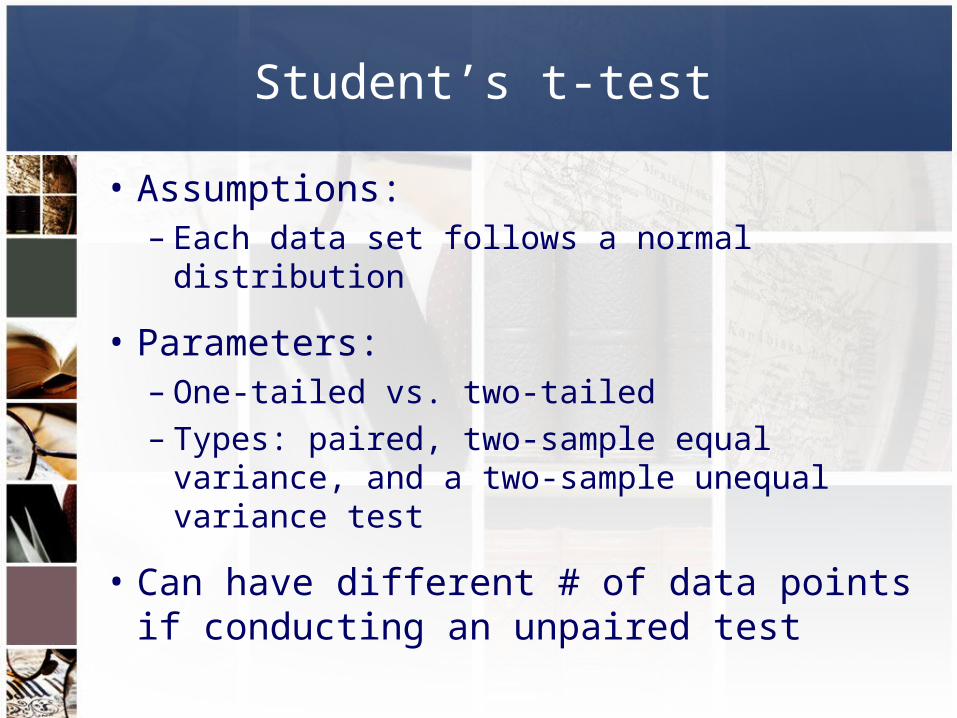
Student’s t-test
• Assumptions:– Each data set follows a normal distribution
• Parameters:– One-tailed vs. two-tailed– Types: paired, two-sample equal variance,
and a two-sample unequal variance test
• Can have different # of data points if conducting an unpaired test

Demo

Two Sample t-test
Group A Group B1.02 0.560.65 0.151.01 0.321.27 0.940.59 0.350.75 0.530.62 0.360.65 0.310.66 0.35
t-test output Group A Group BMean 0.801 0.428Variance 0.057 0.051Observations 9.000 9.000
Pooled Variance 0.054
Hypothesized Mean Difference 0.000df 16.000t Stat 3.404
P(T<=t) one-tail 0.002
t Critical one-tail 2.583
P(T<=t) two-tail 0.004
t Critical two-tail 2.921
Here p < 0.05, so the null hypothesis is falsified – statistical difference between Group A and Group B

Measuring Effects of Instruction
• Suppose you apply some educational innovation– Control group and experimental group– Or pre-test and post-test
• How do you know if it’s effective?
• Say you give some sort of standard assessment– How big do the changes need to be to be
statistically significant?

Method #1: Use a t-test
• You can always use a t-test
• Compare scores of control vs. experimental group
or
• Compare pre vs. post tests– More difficult due to other variables
Method #2: Effect Size
• Effect Size (ES) is a method to quantify how effective an educational intervention has been relative to a control group
• Extremely useful when there is no familiar scale to judge outcomes

A thought experiment
• Suppose we do a study to see if children learn better in the morning or afternoon
• Morning trial: 15.2 average on assessment• Afternoon trial: 17.9 average on assessment
• Is this a big difference? It depends on overlap!
Robert Coe: “What is an Effect Size: A guide for users”

Two distributions
If the distributions of scores looked like this, you would think the result is quite significant
Robert Coe: “What is an Effect Size: A guide for users”
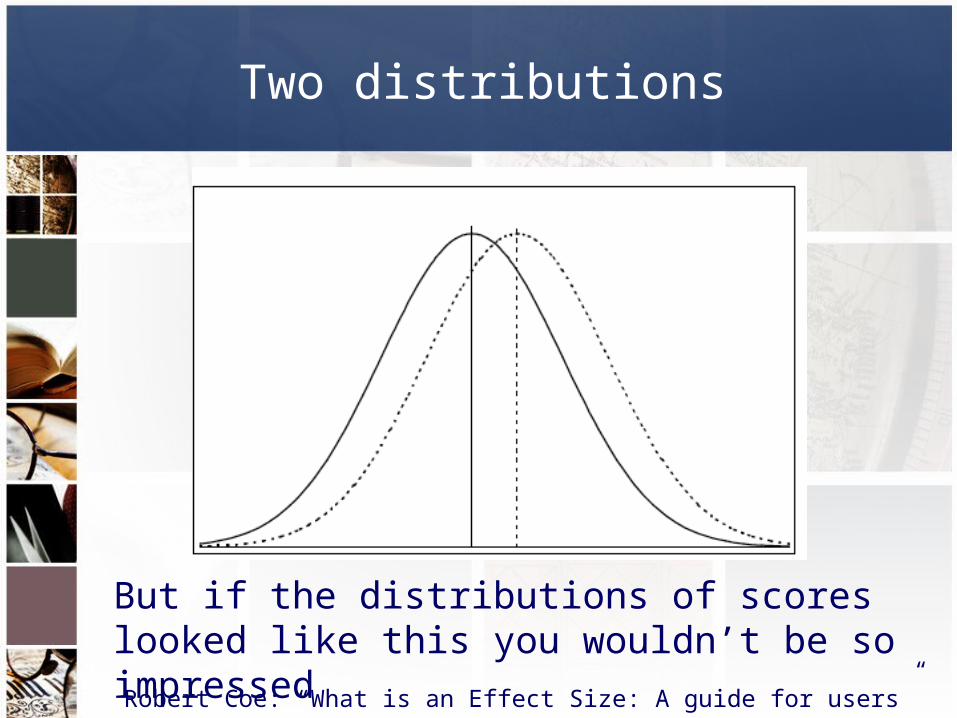
Two distributions
But if the distributions of scores looked like this you wouldn’t be so impressed
Robert Coe: “What is an Effect Size: A guide for users”

Effect Size Continued
• The Effect Size– Compares the difference between groups in
light of the variance of scores within each group
ES= (mean of experimental group) – (mean of control group)
Standard Deviation
Actually quite simple to calculate
Robert Coe has great information online about ES

How to Interpret Effect Size
Effect Size % of control group below
mean of experimental
group
Probability you could guess
which group an individual belongs to
based on their score
0.0 50% 0.50
0.2 58% 0.54
0.4 66% 0.58
0.6 73% 0.62
0.8 79% 0.66
1.0 84% 0.69
2.0 98% 0.84
Robert Coe: “What is an Effect Size: A guide for users”

How to Interpret Effect Size
Effect Size How Large? Equivalent to the height
differences between
0.2 Small 15 and 16 yr old girls
0.5 Medium 14 and 18 yr old girls
0.8 Large 13 and 18 yr old girls
IQ differences between typical freshmen and Ph.D.s corresponds to an effect size of 0.8
Robert Coe: “What is an Effect Size: A guide for users”

Effect Size Example
Duda, G., Garrett, K., Am. J. Phys. 76, 1054 (2008).

Making a better survey
• In my experience surveys and assessment instruments are difficult to write
• How do you know your instrument is1. Reliable
2. Valid
• Are there alternatives to writing your own instruments?
Reliability: Cronbach Alpha
• Cronbach Alpha: measure of how closely items in a group are related
• Cronbach Alpha is often used for instruments which are not marked right or wrong– Think Likert Scale
• Measures if students responses are the same for similar types of questions

How to Cronbach Alpha
• You could calculate it by hand
• or you buy SPSS and figure out how to use it
• or you could download an excel spreadsheet which is programmed to do this: http://www.gifted.uconn.edu/siegle/research/Instrument Reliability and validity/reliabilitycalculator2.xls

Cronbach Alpha Values
• Typically a Cronbach Alpha (α) > 0.8 is considered good– At this level survey is “reliable”
• However, there are exceptions:– Different types of surveys/instruments may
have different natural levels of reliability– Experimental instruments may be still useful
even if α~0.6

Warning! Common Mistakes with Cronbach Alpha
• Paper: “Calculating, Interpreting, and Reporting Cronbach’s Alpha Reliability Coefficient for Likert-Type Scales” by Joseph A. Gliem and Rosemary R. Gliem
• Lesson– Use Cronbach Alpha for Likert scale surveys– Draw conclusions based on clusters of items– Single item reliability is generally very low

Instrument Validity
• Validity is never universal– “Valid” for a certain population and for a
specific purpose
• Three general categories of validity:1.Content validity
2.Predictive validity
3.Concurrent validity

Ideas for Establishing Validity
1. Establish content or face validity– Correlate with other independent measures
such as exam scores, course grades, other assessment instruments
2. Predictive validity– Longitudinal studies and student tracking are
needed here
3. Concurrent validity– Compare with other assessment instruments or
calibrate with the proper groups

Survey/Assessment Creation Tips
• Build in measures to show reliability– e.g. multiple questions within a survey on the
same topic (both positive and negative)– Questions that establish that students are
taking the survey seriously
• For content driven assessments, research student difficulties
• Beta-version: open ended questions
• Correlations can help show validity

An Example of evidence for Validity
Duda, G., Garrett, K., Am. J. Phys. 76, 1054 (2008).

Buros Institute of Mental Measurement
• “By providing professional assistance, expertise, and information to users of commercially published tests, the Institute promotes meaningful and appropriate test selection, utilization, and practice.”
http://www.unl.edu/buros/bimm

Conclusion
• Some simple statistical tests can provide rigorous evidence of– Student learning– Instructional effectiveness– Improvements in attitude
• All of these methods are extremely effective when coupled with qualitative methods
• Stats involved can be done with little or no training
My SoTL advice
• Plan a throw-away semester in any SoTL study– “trial” period to tinker with your study design– Flexibility to alter your study design when you
find it doesn’t work
• Involving students in SoTL work can be very effective
• Try to publish in discipline specific journals• When in doubt, ask your students!

Good References
• Analysis of Likert Scales (and attitudinal data in general) – CLASS survey– http://www.colorado.edu/sei/class/
• Effect Size:– “What is an Effect Size: A guide for users” by
Robert Coe (easily found by google)– Coe also has an excel spreadsheet online to
calculate effect size

Good references
• Reliability and Validity:– http://www.gifted.uconn.edu/siegle/research/I
nstrument%20Reliability%20and%20Validity/Reliability.htm
– http://www.gifted.uconn.edu/siegle/research/Instrument%20Reliability%20and%20Validity/validity.htm
• T-test– Step by step video on excel:
http://www.youtube.com/watch?v=JlfLnx8sh-o
Good References
• The FLAG: Field-Tested Learning Assessment Guide– www.flaguide.org– Contains “broadly applicable, self-contained
modula classroom assessment techniques (CATs) and discipline-specific tools for STEM instructors”

Good References
John Creswell’s books (and courses) have been highly recommended to me