Embed Size (px)
Citation preview
PAPER • OPEN ACCESS
Quantitative analysis of quantum dot dynamicsand emission spectra in cavity quantumelectrodynamicsTo cite this article: K H Madsen and P Lodahl 2013 New J. Phys. 15 025013
View the article online for updates and enhancements.
Recent citationsTheory of Fano effect in cavity quantumelectrodynamicsMakoto Yamaguchi et al
-
Generation and dynamics of entangledfermion–photon–phonon states innanocavitiesMikhail Tokman et al
-
Broadband enhancement of light-matterinteraction in photonic crystal cavitiesintegrating site-controlled quantum dotsMarco Felici et al
-
This content was downloaded from IP address 187.95.136.10 on 19/10/2021 at 01:12
Quantitative analysis of quantum dot dynamics andemission spectra in cavity quantum electrodynamics
K H Madsen1,2 and P Lodahl21 DTU Fotonik, Department of Photonics Engineering, Technical University ofDenmark, Ørsteds Plads 343, DK-2800 Kongens Lyngby, Denmark2 Niels Bohr Institute, University of Copenhagen, Blegdamsvej 17,DK-2100 Copenhagen, DenmarkE-mail: [email protected] and [email protected]
New Journal of Physics 15 (2013) 025013 (12pp)Received 25 October 2012Published 7 February 2013Online at http://www.njp.org/doi:10.1088/1367-2630/15/2/025013
Abstract. We present detuning-dependent spectral and decay-rate measure-ments to study the difference between the spectral and dynamical propertiesof single quantum dots embedded in micropillar and photonic crystal cavities.For the micropillar cavity, the dynamics is well described by the dissipativeJaynes–Cummings model, whereas systematic deviations are observed for theemission spectra. The discrepancy for the spectra is attributed to the couplingof other exciton lines to the cavity and interference of different propagationpaths toward the detector of the fields emitted by the quantum dot. In contrast,quantitative information about the system can readily be extracted from the dy-namical measurements. In the case of photonic crystal cavities, we observe ananti-crossing in the spectra when detuning a single quantum dot through res-onance, which is the spectral signature of a strong coupling. However, time-resolved measurements reveal that the actual coupling strength is significantlysmaller than anticipated from the spectral measurements and that the quantumdot is rather weakly coupled to the cavity. We suggest that the observed Rabisplitting is due to cavity feeding by other quantum dots and/or multi-excitoncomplexes giving rise to collective emission effects.
Content from this work may be used under the terms of the Creative Commons Attribution 3.0 licence.Any further distribution of this work must maintain attribution to the author(s) and the title of the work, journal
citation and DOI.
New Journal of Physics 15 (2013) 0250131367-2630/13/025013+12$33.00 © IOP Publishing Ltd and Deutsche Physikalische Gesellschaft

2
Contents
1. Introduction 22. Theory 33. Micropillar cavities 54. Photonic crystal cavities 85. Conclusion 11Acknowledgments 11References 11
1. Introduction
Cavity quantum electrodynamics (CQED) provides a way of enhancing and controlling thelight–matter interaction between a single emitter and a cavity field and has potential applicationsin the field of quantum-information processing. This field was pioneered for atomic systemswhere a number of founding experimental demonstrations were achieved [1], whereas scalingthese experiments to larger networks required for quantum-information processing remains amajor challenge. Semiconductor quantum dots (QDs) embedded in nanophotonic structuresoffer an alternative and promising platform that is currently in its infancy, but could potentiallylead to scalable quantum-information processing on an optical chip [2] by exploiting thevast potential of semiconductor technology. Significant progress has been made in the field,where both Purcell enhancement [3, 4] and strong coupling [5, 6] between a single QD anda nanocavity have been reported, and most recently, non-Markovian dynamics [7] as well asfew-photon nonlinearities [8] have been demonstrated.
At first glance, QDs have many properties in common with atoms; for example, theirquantized energy levels give rise to single-photon emission. Examining in more detail revealsa number of effects unique to QDs; for example, the point-dipole approximation may breakdown due to the mesoscopic size of QDs [9] and intrinsic exchange-mediated spin-flip processescan couple various finestructure exciton levels [10]. The proper understanding of the latter hasenabled the use of QDs as probes of the local optical density of states (LDOS) [11] as well ascomplete control over the spin state of the exciton with a single picosecond laser pulse [12].In addition, the presence of the solid-state environment leads to new phenomena, such as thecreation of a quasi continuum of exciton states due to the interaction of electrons in the QD withelectrons in the wetting layer [13] or the observation of a phonon-assisted Purcell effect in acavity, where the QD decay is stimulated by the exchange of phonons with a reservoir [14, 15].
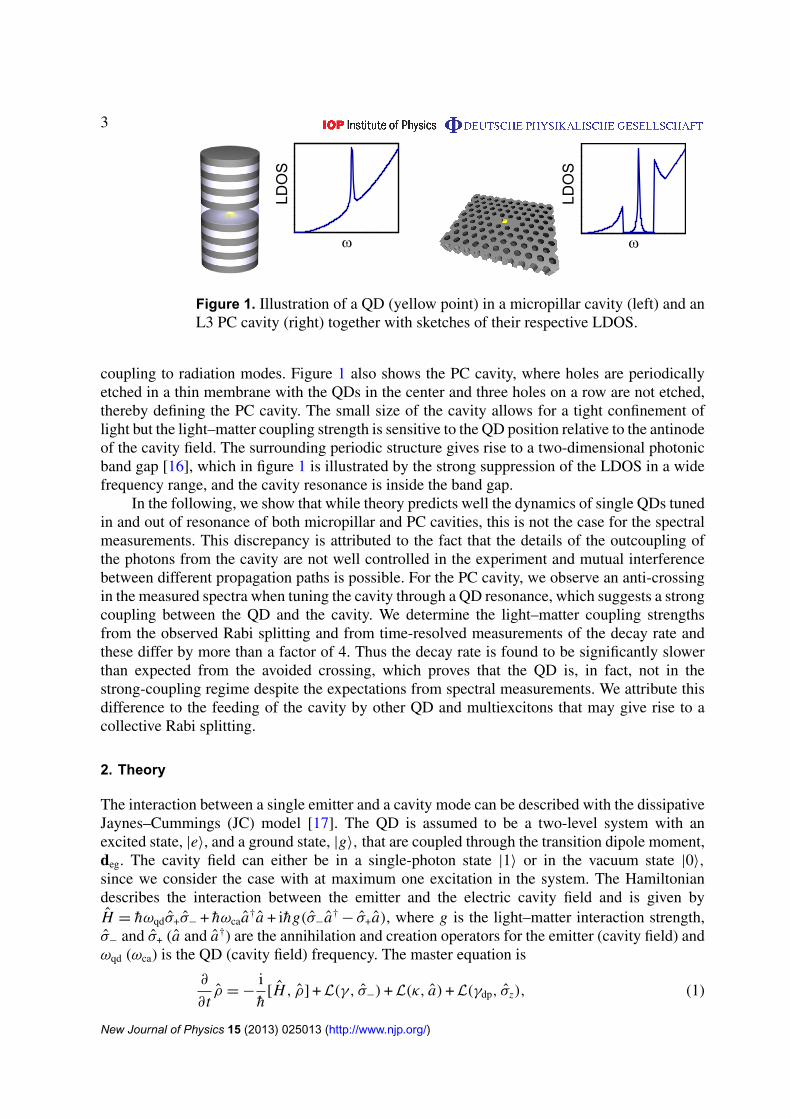
In this paper, we present a comprehensive study of the dynamical and spectral propertiesof CQED systems including a quantitative comparison to theory. We perform experiments onsingle QDs embedded either in a micropillar cavity or in a photonic crystal (PC) cavity. Infigure 1 both physical systems are illustrated alongside sketches of the frequency variation oftheir respective LDOS. The central region of the micropillar cavity, where the QD is positioned,is surrounded by Bragg mirrors on each side giving rise to a symmetrically confined electricfield perpendicular to the substrate surface. While the QD is randomly positioned radially, itis by design always situated at an antinode of the cavity field ensuring an effective couplingto the cavity. A sketch of the LDOS is shown in figure 1, where the sharp resonance at thecavity frequency reflects the build-up cavity field sitting on top of a background accounting for
New Journal of Physics 15 (2013) 025013 (http://www.njp.org/)
3
Figure 1. Illustration of a QD (yellow point) in a micropillar cavity (left) and anL3 PC cavity (right) together with sketches of their respective LDOS.
coupling to radiation modes. Figure 1 also shows the PC cavity, where holes are periodicallyetched in a thin membrane with the QDs in the center and three holes on a row are not etched,thereby defining the PC cavity. The small size of the cavity allows for a tight confinement oflight but the light–matter coupling strength is sensitive to the QD position relative to the antinodeof the cavity field. The surrounding periodic structure gives rise to a two-dimensional photonicband gap [16], which in figure 1 is illustrated by the strong suppression of the LDOS in a widefrequency range, and the cavity resonance is inside the band gap.
In the following, we show that while theory predicts well the dynamics of single QDs tunedin and out of resonance of both micropillar and PC cavities, this is not the case for the spectralmeasurements. This discrepancy is attributed to the fact that the details of the outcoupling ofthe photons from the cavity are not well controlled in the experiment and mutual interferencebetween different propagation paths is possible. For the PC cavity, we observe an anti-crossingin the measured spectra when tuning the cavity through a QD resonance, which suggests a strongcoupling between the QD and the cavity. We determine the light–matter coupling strengthsfrom the observed Rabi splitting and from time-resolved measurements of the decay rate andthese differ by more than a factor of 4. Thus the decay rate is found to be significantly slowerthan expected from the avoided crossing, which proves that the QD is, in fact, not in thestrong-coupling regime despite the expectations from spectral measurements. We attribute thisdifference to the feeding of the cavity by other QD and multiexcitons that may give rise to acollective Rabi splitting.
2. Theory
The interaction between a single emitter and a cavity mode can be described with the dissipativeJaynes–Cummings (JC) model [17]. The QD is assumed to be a two-level system with anexcited state, |e〉, and a ground state, |g〉, that are coupled through the transition dipole moment,deg. The cavity field can either be in a single-photon state |1〉 or in the vacuum state |0〉,
since we consider the case with at maximum one excitation in the system. The Hamiltoniandescribes the interaction between the emitter and the electric cavity field and is given byH = hωqdσ+σ− + hωcaa†a + ihg(σ−a†
− σ+a), where g is the light–matter interaction strength,σ− and σ+ (a and a†) are the annihilation and creation operators for the emitter (cavity field) andωqd (ωca) is the QD (cavity field) frequency. The master equation is
∂
∂tρ = −
i
h[H , ρ] +L(γ, σ−) +L(κ, a) +L(γdp, σz), (1)
New Journal of Physics 15 (2013) 025013 (http://www.njp.org/)

4
where ρ is the density matrix for the system. The first term in equation (1) expresses thecoherent light–matter interaction, whereas the latter terms account for dissipation. Dissipativeprocesses are included using the Lindblad terms, L(α, σ ) =
α
2 (2σ ρσ †−{σ †σ , ρ}), where the
dissipation acting on the operator σ has an associated rate of α [18]. The decay of the emitterinto leaky optical modes is described by the annihilation of an electronic excitation (σ−) witha rate γ , while leakage out of the cavity mode is described by the annihilation of a photon inthe cavity field (a) with the rate κ due to the finite Q-factor, Q = ωca/κ . Finally, decoherencefrom the solid-state environment (primarily due to phonons) is included as pure dephasing ofthe transition by the operator σz = [σ+, σ−] with the dephasing rate γdp.
From equation (1), we obtain the equations governing the dynamics of the system
ρqd = − g(ρpo + ρ∗
po) − γρqd,
ρca = g(ρpo + ρ∗
po) − κρca, (2)
ρpo = g(ρqd − ρca) − (γtot + i1) ρpo,
where γtot = (κ + γ + 2γdp)/2, 1 = ωqd − ωca, ρqd (ρca) is the population of the emitter (cavitymode) and ρpo is proportional to the polarization. In the weak-coupling regime, the QD decaysirreversibly and the polarization can be adiabatically eliminated by setting ρpo = 0, wherethe decay rate of the QD becomes 0 = γ + 2g2 γtot
γ 2tot+12 . When the light–matter coupling rate
is sufficiently large compared to the dissipation, the cavity system enters the strong-couplingregime where a photon is stored so long in the cavity that it can be reabsorbed by the emitter.As a result the population of the emitter undergoes Rabi oscillations. The spectral signature ofstrong coupling is the anti-crossing of the QD and cavity peak when tuning them into mutualresonance.
Although the QD is often treated as a two-level emitter, the actual electronic structureis more complicated. The QD excitons predominately recombine radiatively due to the highquantum efficiency, but non-radiative processes do occur as well [19]. Furthermore, additionalexciton states that cannot recombine radiatively (dark-exciton states) are also populated inthe QD and can couple to the radiative states (bright-exciton states) through a slow spin-flipprocess [10]. As a consequence, the time-resolved emission from a single QD under non-resonant excitation is bi-exponential, where the fast decay rate corresponds to the decay of thebright state, which is the relevant rate in the present experiments. Finally, an electron confined inthe QD can also scatter on electrons in the wetting layer, thereby giving rise to a quasi continuumof multi-excitonic states [13]. These states are found to be responsible for the pronouncedQD–cavity coupling observed in spectral measurements even for very large detunings [20, 21].
The total emission spectrum is obtained by the Wiener–Khinchin theorem [22] accordingto
Sdet(ω) =2
πRe
[∫∞
0dτei(ω−ωqd)τ
∫∞
0dt ′
〈E (−)
det (t ′ + τ)E (+)
det (t′)〉
], (3)
where E (+)
det (E (−)
det ) is the positive (negative) frequency part of the electric field that reachesthe detector. This field is related to the emitter and cavity field operator through E (+)
det (t) =
ηca√
κ a(t) + ηqd√
γ σ−(t), where we neglect any time retardation between the emitter and cavityoperators, which is usually a good approximation in nanophotonics cavities. The coefficientsgca and gqd are complex coefficients that describe the collection efficiencies of the cavityand QD electric field, respectively, and their relative phase. The quantum regression theorem
New Journal of Physics 15 (2013) 025013 (http://www.njp.org/)
5
APD
/2
PM Fiber
Microscopeobjective
Ti:Sapphlaser
PBS
Spectrometer + CCD
Sca
Sqd
Cryostat
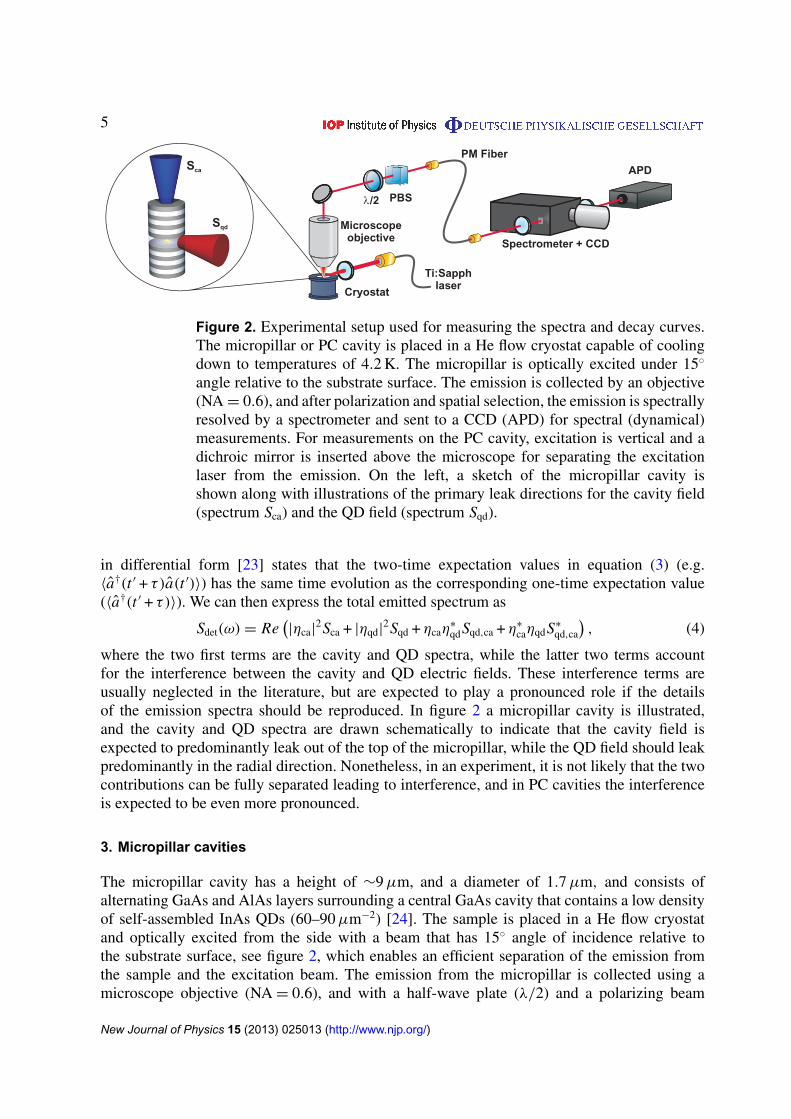
Figure 2. Experimental setup used for measuring the spectra and decay curves.The micropillar or PC cavity is placed in a He flow cryostat capable of coolingdown to temperatures of 4.2 K. The micropillar is optically excited under 15◦
angle relative to the substrate surface. The emission is collected by an objective(NA = 0.6), and after polarization and spatial selection, the emission is spectrallyresolved by a spectrometer and sent to a CCD (APD) for spectral (dynamical)measurements. For measurements on the PC cavity, excitation is vertical and adichroic mirror is inserted above the microscope for separating the excitationlaser from the emission. On the left, a sketch of the micropillar cavity isshown along with illustrations of the primary leak directions for the cavity field(spectrum Sca) and the QD field (spectrum Sqd).
in differential form [23] states that the two-time expectation values in equation (3) (e.g.〈a†(t ′ + τ)a(t ′)〉) has the same time evolution as the corresponding one-time expectation value(〈a†(t ′ + τ)〉). We can then express the total emitted spectrum as
Sdet(ω) = Re(|ηca|
2Sca + |ηqd|2Sqd + ηcaη
∗
qdSqd,ca + η∗
caηqdS∗
qd,ca
), (4)
where the two first terms are the cavity and QD spectra, while the latter two terms accountfor the interference between the cavity and QD electric fields. These interference terms areusually neglected in the literature, but are expected to play a pronounced role if the detailsof the emission spectra should be reproduced. In figure 2 a micropillar cavity is illustrated,and the cavity and QD spectra are drawn schematically to indicate that the cavity field isexpected to predominantly leak out of the top of the micropillar, while the QD field should leakpredominantly in the radial direction. Nonetheless, in an experiment, it is not likely that the twocontributions can be fully separated leading to interference, and in PC cavities the interferenceis expected to be even more pronounced.
3. Micropillar cavities
The micropillar cavity has a height of ∼9 µm, and a diameter of 1.7 µm, and consists ofalternating GaAs and AlAs layers surrounding a central GaAs cavity that contains a low densityof self-assembled InAs QDs (60–90 µm−2) [24]. The sample is placed in a He flow cryostatand optically excited from the side with a beam that has 15◦ angle of incidence relative tothe substrate surface, see figure 2, which enables an efficient separation of the emission fromthe sample and the excitation beam. The emission from the micropillar is collected using amicroscope objective (NA = 0.6), and with a half-wave plate (λ/2) and a polarizing beam
New Journal of Physics 15 (2013) 025013 (http://www.njp.org/)
6
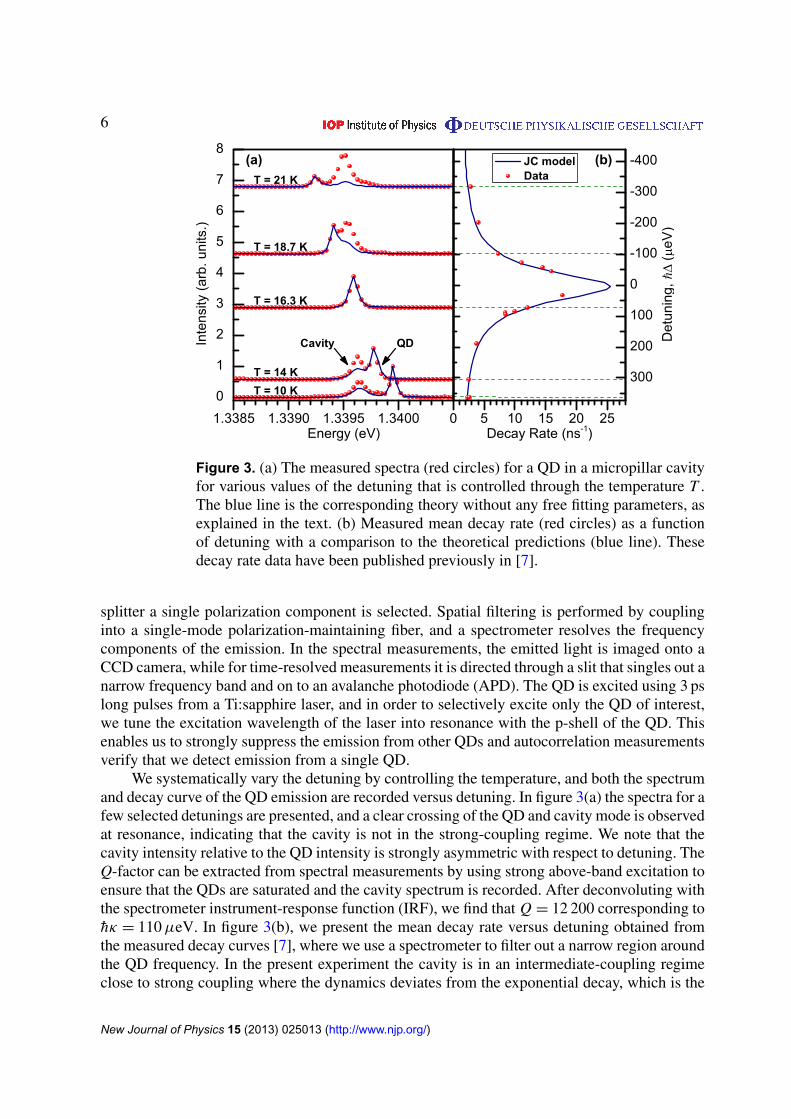
Figure 3. (a) The measured spectra (red circles) for a QD in a micropillar cavityfor various values of the detuning that is controlled through the temperature T .The blue line is the corresponding theory without any free fitting parameters, asexplained in the text. (b) Measured mean decay rate (red circles) as a functionof detuning with a comparison to the theoretical predictions (blue line). Thesedecay rate data have been published previously in [7].
splitter a single polarization component is selected. Spatial filtering is performed by couplinginto a single-mode polarization-maintaining fiber, and a spectrometer resolves the frequencycomponents of the emission. In the spectral measurements, the emitted light is imaged onto aCCD camera, while for time-resolved measurements it is directed through a slit that singles out anarrow frequency band and on to an avalanche photodiode (APD). The QD is excited using 3 pslong pulses from a Ti:sapphire laser, and in order to selectively excite only the QD of interest,we tune the excitation wavelength of the laser into resonance with the p-shell of the QD. Thisenables us to strongly suppress the emission from other QDs and autocorrelation measurementsverify that we detect emission from a single QD.
We systematically vary the detuning by controlling the temperature, and both the spectrumand decay curve of the QD emission are recorded versus detuning. In figure 3(a) the spectra for afew selected detunings are presented, and a clear crossing of the QD and cavity mode is observedat resonance, indicating that the cavity is not in the strong-coupling regime. We note that thecavity intensity relative to the QD intensity is strongly asymmetric with respect to detuning. TheQ-factor can be extracted from spectral measurements by using strong above-band excitation toensure that the QDs are saturated and the cavity spectrum is recorded. After deconvoluting withthe spectrometer instrument-response function (IRF), we find that Q = 12 200 corresponding tohκ = 110 µeV. In figure 3(b), we present the mean decay rate versus detuning obtained fromthe measured decay curves [7], where we use a spectrometer to filter out a narrow region aroundthe QD frequency. In the present experiment the cavity is in an intermediate-coupling regimeclose to strong coupling where the dynamics deviates from the exponential decay, which is the
New Journal of Physics 15 (2013) 025013 (http://www.njp.org/)
7
signature of non-Markovian coupling to a radiative reservoir. As a consequence, we extract themean decay rate directly from the decay curves, which is the inverse of the mean decay time.A very pronounced Purcell enhancement within a frequency range that is limited by the Qof the cavity is displayed in figure 3(b). The data can be compared quantitatively withtheory without any adjustable parameters after independently determining all the governingparameters: from decay-rate measurements at a large detuning the QD decay rate to leaky modesis determined, hγ = 1.3 µeV, and a Hong–Ou–Mandel interferometer [25] enables determininga pure dephasing rate of hγdp = 6.3 µeV at T = 16.3 K. The fastest observed average decay rateis 0 = 17.7 ns−1 at h1 = 17 µeV, which in combination with the values for γ , κ and γdp allowsus to extract the coupling strength hg = 22.6 µeV. Using these parameters the calculated meandecay rate is observed to be in excellent agreement with the experimental data, see figure 3(b),clearly illustrating that a complete quantitative understanding of the dynamics is found withoutthe need for any adjustable parameters.
We now make a similar comparison between experiment and theory for the spectralmeasurements. As explained earlier, the full spectrum in equation (4) has several contributions,but the individual prefactors are undetermined and we will assume that ηqd = 0 since thecavity spectrum is expected to be dominating in the micropillar geometry. At resonance(1 = 0), we also make a Hanbury Brown–Twiss measurement and record an autocorrelationof g(2)(0) = 34.5%, which indicates additional feeding of the cavity from other QDs andmultiexcitons [13]. We express the detected signal in terms of the QD and backgroundsignal, I = Iqd + Ibg. A background due to other recombination processes will have a thermal
distribution [22] and is likely to be uncorrelated with the QD signal. Inserting into g(2)(0) =〈I 2
〉
〈I 〉2
thus yields 〈Ibg〉 =g(2)(0)
2−g(2)(0)〈Iqd〉 and the background thus constitutes g(2)(0)
2 of the total signal.We include this contribution in the calculated spectra by adding an inhomogeneous backgroundof 17.3% to the cavity. In figure 3(a) the calculated spectra are shown where the experimentalparameters from the time-resolved measurements are employed and each spectrum has beenconvoluted with the measured IRF and normalized to the QD peak. We observe that thecalculated spectra consistently underestimate the cavity intensity. This disagreement pinpointsthat the asymmetry in the measured relative QD–cavity intensity cannot be reproduced by thetheory. Indeed, a number of effects are not included in the theory that do influence spectralmeasurements as opposed to the dynamical measurements. Thus, the inability to includethe additional interference terms between the QD and cavity emissions in equation (4) willinfluence the comparison in particular, because the coefficients ηca and ηqd are likely to bedetuning dependent. We note that even if we include these coefficients as free parameters, theagreement between calculated and measured spectra is still very poor. Furthermore, feedingfrom other excitons is known to increase the intensity of the cavity even when they aredetuned far away. Finally, the time-resolved measurements, including Hanbury Brown–Twissand Hong–Ou–Mandel measurements, probe the dynamics and coherence at short timescales (ofthe order of ns), whereas the spectra are integrated over a much longer timescale (of the orderof s). This implies that spectral measurements are sensitive to slow dephasing mechanisms,e.g. spectral diffusion, which could give rise to additional broadening compared to dynamicalmeasurements. These complications lead to the conclusion that quantitative information aboutthe QD-based cavity QED system is favorably extracted from time-resolved measurementsrather than in the spectral domain, where systematic deviations between experiment and theoryare generally observed.
New Journal of Physics 15 (2013) 025013 (http://www.njp.org/)

8
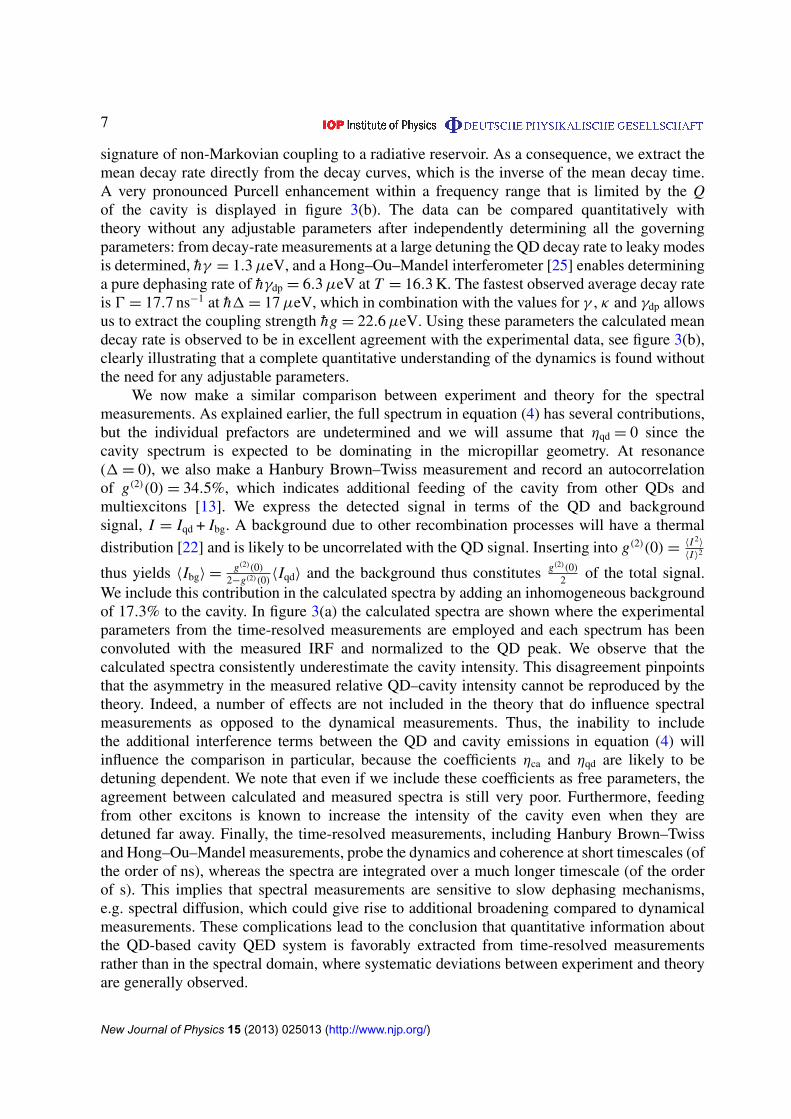
Figure 4. (a) The measured emission spectra (red circles) of a QD tuned throughresonance of a PC cavity by deposition of N2 on the sample while the temperatureis kept constant at T = 10 K. The black line is the fit with two Lorentzians afterconvolution with the spectrometer IRF. (b)–(d) The resonance energy, Q-factorand relative area of the two peaks, respectively, as a function of detuning. Redlines are the fit of the cavity spectra from the JC model used to extract thecoupling strength. The relative area of, e.g., the QD is defined as Aqd/(Aqd + Aca),where Aqd (Aca) is the QD (cavity) area.
4. Photonic crystal cavities
For comparison, we have performed a similar study for a single QD tuned through a PC cavity.We investigate a GaAs PC membrane with lattice constant a = 240 nm, hole radius r = 65 nmand a width of 154 nm, where a layer of self-assembled InAs QDs has been grown in the middleof the membrane with a density of ∼80 µm−2. We introduce an L3 cavity by leaving out threeholes, and in order to increase the Q-factor, the first three holes at each end of the cavity areshifted by 0.175a, 0.025a and 0.175a, respectively [26]. The sample is characterized in thesame experimental setup (see figure 2), except that the cavity is excited from the top and adichroic mirror after the microscope objective separates the excitation laser from the emission.The pulsed excitation laser is tuned into resonance with a higher order mode (M6) of the cavityat 850 nm, while we observe the fundamental high-Q mode (M1) at 952 nm. This excitationscheme allows us to selectively excite QDs that are spatially coupled to the cavity. The QDemission frequency redshifts with increasing the temperature, whereas the cavity frequencyredshifts when small amounts of nitrogen are deposited on the sample. Utilizing these twotechniques in combination gives a way to control the detuning between the QD and the cavitymode over a large frequency range. We record Q = 6690 (equal to hκ = 195 µeV) by pumpingthe QDs into saturation similarly to the measurements described for the micropillar cavity.
Figure 4(a) shows emission spectra for different values of detuning where the cavityis tuned through the QD while the temperature is fixed at T = 10 K. The measured spectra
New Journal of Physics 15 (2013) 025013 (http://www.njp.org/)

9
are deconvoluted by performing an inverse Fourier transform, dividing by the deconvolutedIRF and bandpass filtering in order to reduce noise, before finally Fourier transforming itback into frequency space. The validity of this procedure is carefully checked by convolutingthe deconvoluted spectra with the IRF and comparing it with the measured spectra. Theexperimental data can be fitted well by the sum of two Lorentzians, see figure 4(a). We stressthat in order to obtain a successful fit, the center, the width and the heights of the Lorentziansare free parameters. The limitations to the quantitative knowledge that can be extracted fromthe spectra, as was discussed for the micropillar cavities above, apply also to the case of PCcavities. Here we will focus on investigating the Rabi splitting that has been widely studiedin the literature [5, 6, 20] and is believed to be a robust measure of the coupling of the cavitysystem.
Figures 4(b)–(d) show the quantities extracted from modeling the spectra, i.e. the energyof the two resonances, the associated Q-factors and the relative area of each of the peaks.From the peak energies (figure 4(b)), we observe anti-crossing of the cavity and QD peak whentuned into mutual resonance, which is the spectral signature of strong coupling. Furthermore,we observe in figure 4(c) that the QD linewidth broadens (the Q-factor decreases) and equalsthe cavity linewidth, which is again a feature found in the strong-coupling regime where twoindistinguishable alternatives exist: whether the photon is emitted to the cavity or absorbed bythe QD. For large negative detunings, the Q of the QD resonance is constant at ∼15 000, whileit rises to about ∼25 000 for positive detuning, which is likely an effect of the deconvolutionprocess since the QD linewidth is so narrow that it becomes comparable with the resolutionof the spectrometer (Q = 43 500). The cavity Q-factor does not change significantly over thedetuning range. Close to resonance, however, a small increase is observed, but we note that fora strongly coupled cavity the Q-factor is expected to almost double. Finally, the relative areasof the Lorentzians are plotted in figure 4(d), and we observe that the cavity peak dominates thespectrum apart from close to resonance, where the areas become similar.
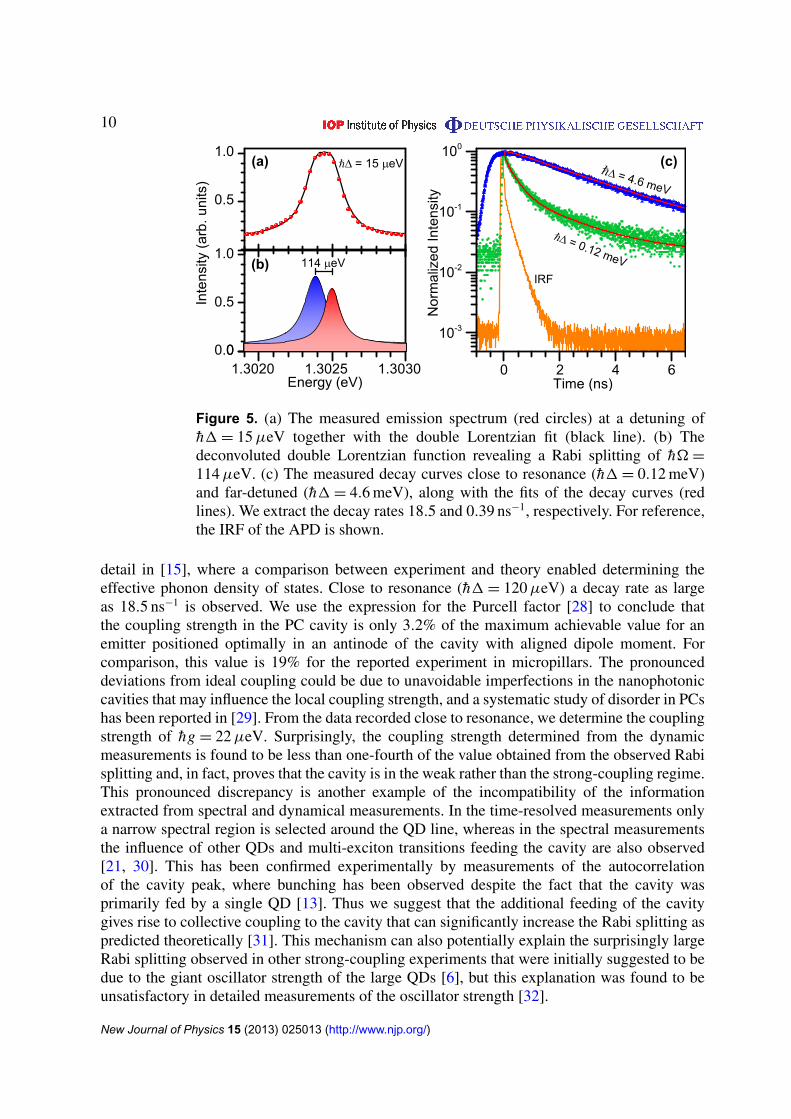
Figure 5(a) displays the emission spectrum recorded almost at resonance (h1 = 15 µeV)together with the double Lorentzian fit, and in figure 5(b) the fit is decomposed into twoLorentzians. The two Lorentzians have almost the same width and area, as can be seen alsofrom the data in figures 4(c) and (d), which is expected for a system in the strong-couplingregime. The splitting between the two peaks is h� = 114 µeV. Assuming that the splittingoriginates from a single QD strongly coupled to the cavity, we fit the cavity spectrum from theJC model [27] to the data using the experimentally measured values of κ and γ and a dephasingrate of hγdp = 4 µeV [7]. The result is shown in figure 4(b), and we extract a coupling strengthof hg = 92.4 µeV.
As was described in section 3, a quantitative measure of the coupling strength can beobtained from time-resolved measurements, thereby testing the validity of the observed Rabisplitting. Figure 5(c) shows examples of decay curves of the QD recorded close to and far fromresonance, respectively. A strong Purcell enhancement of close to 50 is observed for the fastdecay rate of the recorded decay curve. We note that for detunings h|1| < 0.5 meV, additionalexciton lines feed the cavity and the decay curves are multiexponential, and we extract the fastrate that will be dominated by the resonant exciton. Figure 5(c) also displays the IRF of the APDthat is taken into account by convoluting the model with the IRF before fitting to the measureddecay curves. For the largest detuning, we observe a decay rate of 0.39 ns−1 and here thecoupling to the cavity is negligible so that the background decay rate associated with couplingto leaky modes is hγ = 0.2 µeV. The detuning-dependent decay rates have been studied in
New Journal of Physics 15 (2013) 025013 (http://www.njp.org/)
10
Figure 5. (a) The measured emission spectrum (red circles) at a detuning ofh1 = 15 µeV together with the double Lorentzian fit (black line). (b) Thedeconvoluted double Lorentzian function revealing a Rabi splitting of h� =
114 µeV. (c) The measured decay curves close to resonance (h1 = 0.12 meV)and far-detuned (h1 = 4.6 meV), along with the fits of the decay curves (redlines). We extract the decay rates 18.5 and 0.39 ns−1, respectively. For reference,the IRF of the APD is shown.
detail in [15], where a comparison between experiment and theory enabled determining theeffective phonon density of states. Close to resonance (h1 = 120 µeV) a decay rate as largeas 18.5 ns−1 is observed. We use the expression for the Purcell factor [28] to conclude thatthe coupling strength in the PC cavity is only 3.2% of the maximum achievable value for anemitter positioned optimally in an antinode of the cavity with aligned dipole moment. Forcomparison, this value is 19% for the reported experiment in micropillars. The pronounceddeviations from ideal coupling could be due to unavoidable imperfections in the nanophotoniccavities that may influence the local coupling strength, and a systematic study of disorder in PCshas been reported in [29]. From the data recorded close to resonance, we determine the couplingstrength of hg = 22 µeV. Surprisingly, the coupling strength determined from the dynamicmeasurements is found to be less than one-fourth of the value obtained from the observed Rabisplitting and, in fact, proves that the cavity is in the weak rather than the strong-coupling regime.This pronounced discrepancy is another example of the incompatibility of the informationextracted from spectral and dynamical measurements. In the time-resolved measurements onlya narrow spectral region is selected around the QD line, whereas in the spectral measurementsthe influence of other QDs and multi-exciton transitions feeding the cavity are also observed[21, 30]. This has been confirmed experimentally by measurements of the autocorrelationof the cavity peak, where bunching has been observed despite the fact that the cavity wasprimarily fed by a single QD [13]. Thus we suggest that the additional feeding of the cavitygives rise to collective coupling to the cavity that can significantly increase the Rabi splitting aspredicted theoretically [31]. This mechanism can also potentially explain the surprisingly largeRabi splitting observed in other strong-coupling experiments that were initially suggested to bedue to the giant oscillator strength of the large QDs [6], but this explanation was found to beunsatisfactory in detailed measurements of the oscillator strength [32].
New Journal of Physics 15 (2013) 025013 (http://www.njp.org/)
11
5. Conclusion
We have made a quantitative comparison between spectral and dynamical measurements ofsolid-state cavity QED systems. The dynamics of a single QD in a micropillar cavity is welldescribed by the JC model, whereas using the same theory and parameters to compute thespectra reveals large disagreement. The emission spectrum contains both a cavity and a QD partas well as interference terms between them, and the lack of detailed microscopic insight intothe parameters determining their mixing limits the quantitative modeling of the experimentaldata. We have also presented time-resolved measurements of a QD in a PC cavity and observedpronounced Purcell enhancement enabling extraction of the light–matter coupling strength.From this analysis, the cavity is found to be in the weak-coupling regime, but nonethelessspectral measurements reveal a clear anti-crossing with a pronounced Rabi splitting. Theobserved Rabi splitting is likely a consequence of cavity feeding from other QDs and multi-exciton complexes that induce a collective Rabi splitting. Such a collective coupling of moreQDs to the same cavity mode has been proposed as a way of creating a long-lived solid-statequantum memory [31].
Acknowledgments
We thank S Ates and A Kreiner-Møller for assistance with the experiments and A Loffler,S Reitzenstein and A Forchel for the collaboration on micropillar cavities that led to thedata in figure 3 that were published in [7]. We gratefully acknowledge financial support fromthe Villum Foundation, the Danish Council for Independent Research (Natural Sciences andTechnology and Production Sciences) and the European Research Council (ERC consolidatorgrant ‘ALLQUANTUM’).
References
[1] Raimond J M, Brune M and Haroche S 2001 Colloquium: manipulating quantum entanglement with atomsand photons in a cavity Rev. Mod. Phys. 73 565–82
[2] O’Brien J L, Furusawa A and Vuckovic J 2009 Photonic quantum technologies Nature Photon. 3 687–95[3] Gerard J-M, Sermage B, Gayral B, Legrand B, Costard E and Thierry-Mieg V 1998 Enhanced spontaneous
emission by quantum boxes in a monolithic optical microcavity Phys. Rev. Lett. 81 1110–3[4] Gevaux D G, Bennett A J, Stevenson R M, Shields A J, Atkinson P, Griffiths J, Anderson D, Jones G A C
and Ritchie D A 2006 Enhancement and suppression of spontaneous emission by temperature tuning InAsquantum dots to photonic crystal cavities Appl. Phys. Lett. 88 131101
[5] Yoshie T, Scherer A, Hendrickson J, Khitrova G, Gibbs H M, Rupper G, Ell C, Shchekin O B and Deppe D G2004 Vacuum Rabi splitting with a single quantum dot in a photonic crystal nanocavity Nature 432 200–3
[6] Reithmaier J P, Sek G, Loffler A, Hofmann C, Kuhn S, Reitzenstein S, Keldysh L V, Kulakovskii V D,Reinecke T L and Forchel A 2004 Strong coupling in a single quantum dot–semiconductor microcavitysystem Nature 432 197–200
[7] Madsen K H, Ates S, Lund-Hansen T, Loffler A, Reitzenstein S, Forchel A and Lodahl P 2011 Observationof non-Markovian dynamics of a single quantum dot in a micropillar cavity Phys. Rev. Lett. 106 233601
[8] Reinhard A, Volz T, Winger M, Badolato A, Hennessy K J, Hu E L and Imamoglu A 2012 Strongly correlatedphotons on a chip Nature Photon. 6 93–6
[9] Andersen M L, Stobbe S, Sørensen A S and Lodahl P 2011 Strongly modified plasmon–matter interactionwith mesoscopic quantum emitters Nature Phys. 7 215–8
New Journal of Physics 15 (2013) 025013 (http://www.njp.org/)
12
[10] Johansen J, Julsgaard B, Stobbe S, Hvam J M and Lodahl P 2010 Probing long-lived dark excitons in self-assembled quantum dots Phys. Rev. B 81 081304
[11] Wang Q, Stobbe S and Lodahl P 2011 Mapping the local density of optical states of a photonic crystal withsingle quantum dots Phys. Rev. Lett. 107 167404
[12] Kodriano Y, Schwartz I, Poem E, Benny Y, Presman R, Truong T A, Petroff P M and Gershoni D 2012Complete control of a matter qubit using a single picosecond laser pulse Phys. Rev. B 85 241304
[13] Winger M et al 2009 Explanation of photon correlations in the far-off-resonance optical emission from aquantum-dot–cavity system Phys. Rev. Lett. 103 207403
[14] Hohenester U, Laucht A, Kaniber M, Hauke N, Neumann A, Mohtashami A, Seliger M, Bichler M and FinleyJ J 2009 Phonon-assisted transitions from quantum dot excitons to cavity photons Phys. Rev. B 80 201311
[15] Madsen K H, Kaer P, Kreiner-Møller A, Stobbe S, Nysteen A, Mørk J and Lodahl P 2012 Measuring theeffective phonon density of states of a quantum dot arXiv:1205.5623
[16] Lodahl P, Driel A F, Nikolaev I S, Irman A, Overgaag K, Vanmaekelbergh D and Vos W L 2004 Controllingthe dynamics of spontaneous emission from quantum dots by photonic crystals Nature 430 654–7
[17] Carmichael H J, Brecha R J, Raizen M G, Kimble H J and Rice P R 1989 Subnatural linewidth averaging forcoupled atomic and cavity-mode oscillators Phys. Rev. A 40 5516–9
[18] Lindblad G 1976 On the generators of quantum dynamical semigroups Commun. Math. Phys. 48 119–30[19] Johansen J, Stobbe S, Nikolaev I S, Lund-Hansen T, Kristensen P T, Hvam J M, Vos W L and Lodahl P 2008
Size dependence of the wavefunction of self-assembled InAs quantum dots from time-resolved opticalmeasurements Phys. Rev. B 77 073303
[20] Hennessy K, Badolato A, Winger M, Gerace D, Atature M, Gulde S, Falt S, Hu E L and Imamoglu A 2007Quantum nature of a strongly coupled single quantum dot–cavity system Nature 445 896–9
[21] Ates S, Ulrich S M, Ulhaq A, Reitzenstein S, Loffler A, Hofling S, Forchel A and Michler P 2009Non-resonant dot–cavity coupling and its potential for resonant single-quantum-dot spectroscopy NaturePhoton. 3 724–8
[22] Loudon R 2000 The Quantum Theory of Light 3rd edn (New York: Oxford Science Publications)[23] Perea J I, Porras D and Tejedor C 2004 Dynamics of the excitations of a quantum dot in a microcavity Phys.
Rev. B 70 115304[24] Loffler A, Reithmaier J P, Sek G, Hofmann C, Reitzenstein S, Kamp M and Forchel A 2005 Semiconductor
quantum dot microcavity pillars with high-quality factors and enlarged dot dimensions Appl. Phys. Lett.86 111105
[25] Santori C, Fattal D, Vuckovic J, Solomon G S and Yamamoto Y 2002 Indistinguishable photons from asingle-photon device Nature 419 594–7
[26] Akahane Y, Asano T, Song B-S and Noda S 2005 Fine-tuned high-Q photonic-crystal nanocavity Opt. Express13 1202–14
[27] Laussy F P, Laucht A, del Valle E, Finley J J and Villas-Boas J M 2011 Luminescence spectra of quantumdots in microcavities: III. Multiple quantum dots Phys. Rev. B 84 195313
[28] Gerard J-M 2003 Solid-state cavity-quantum electrodynamics with self-assembled quantum dots Top. Appl.Phys. 90 269–315
[29] Garcıa P D, Stobbe S, Sollner I and Lodahl P 2012 Nonuniversal intensity correlations in 2D Andersonlocalizing random medium arXiv:1206.3428
[30] Kaniber M, Laucht A, Neumann A, Villas-Boas J M, Bichler M, Amman M-C and Finley J J 2008Investigation of the nonresonant dot–cavity coupling in two-dimensional photonic crystal nanocavitiesPhys. Rev. B 77 161303
[31] Diniz I, Portolan S, Ferreira R, Gerard J M, Bertet P and Auffeves A 2011 Strongly coupling a cavity toinhomogeneous ensembles of emitters: potential for long-lived solid-state quantum memories Phys. Rev. A84 063810
[32] Stobbe S, Schlereth T W, Hofling S, Forchel A, Hvam J M and Lodahl P 2010 Large quantum dots with smalloscillator strength Phys. Rev. B 82 233302
New Journal of Physics 15 (2013) 025013 (http://www.njp.org/)