Embed Size (px)
Citation preview
Chemistry & Biology, Volume 22
Supplemental Information
Quantitative Analysis of Proteome and
Lipidome Dynamics Reveals Functional
Regulation of Global Lipid Metabolism
Albert Casanovas, Richard R. Sprenger, Kirill Tarasov, David E.Ruckerbauer, Hans Kristian Hannibal-Bach, Jürgen Zanghellini, Ole N.Jensen, and Christer S. Ejsing
SUPPLEMENTAL FIGURES
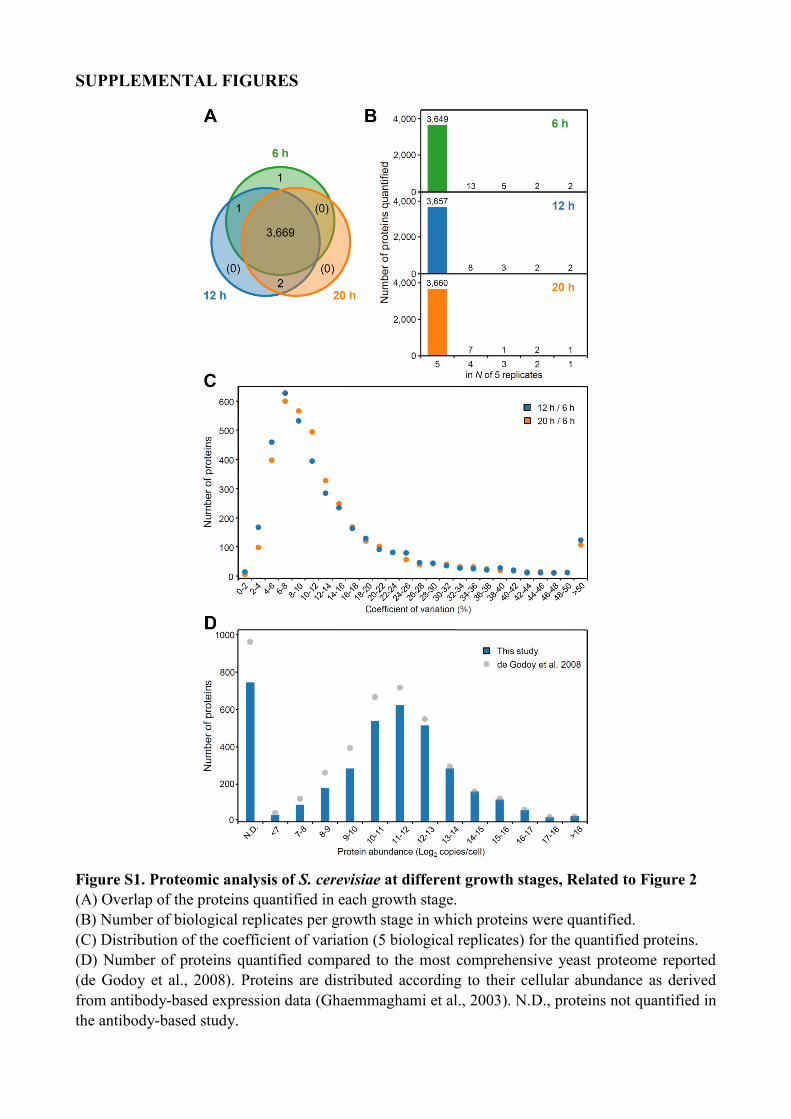
Figure S1. Proteomic analysis of S. cerevisiae at different growth stages, Related to Figure 2
(A) Overlap of the proteins quantified in each growth stage.
(B) Number of biological replicates per growth stage in which proteins were quantified.
(C) Distribution of the coefficient of variation (5 biological replicates) for the quantified proteins.
(D) Number of proteins quantified compared to the most comprehensive yeast proteome reported
(de Godoy et al., 2008). Proteins are distributed according to their cellular abundance as derived
from antibody-based expression data (Ghaemmaghami et al., 2003). N.D., proteins not quantified in
the antibody-based study.
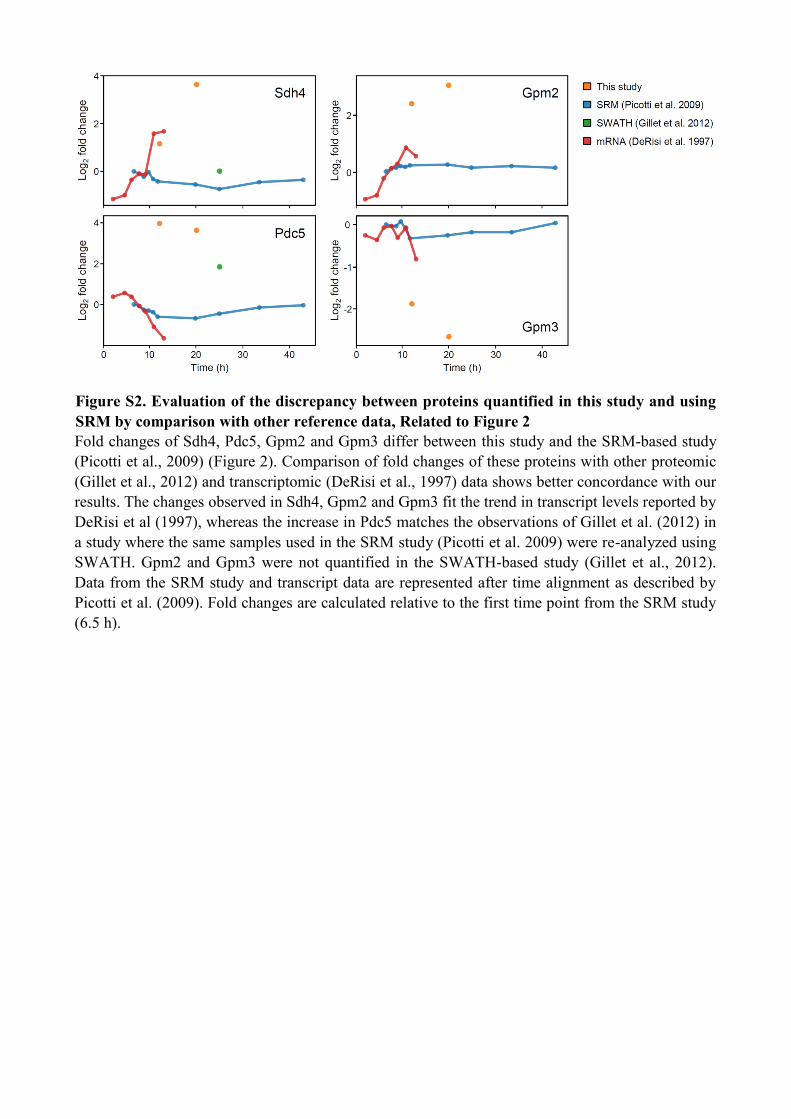
Figure S2. Evaluation of the discrepancy between proteins quantified in this study and using
SRM by comparison with other reference data, Related to Figure 2
Fold changes of Sdh4, Pdc5, Gpm2 and Gpm3 differ between this study and the SRM-based study
(Picotti et al., 2009) (Figure 2). Comparison of fold changes of these proteins with other proteomic
(Gillet et al., 2012) and transcriptomic (DeRisi et al., 1997) data shows better concordance with our
results. The changes observed in Sdh4, Gpm2 and Gpm3 fit the trend in transcript levels reported by
DeRisi et al (1997), whereas the increase in Pdc5 matches the observations of Gillet et al. (2012) in
a study where the same samples used in the SRM study (Picotti et al. 2009) were re-analyzed using
SWATH. Gpm2 and Gpm3 were not quantified in the SWATH-based study (Gillet et al., 2012).
Data from the SRM study and transcript data are represented after time alignment as described by
Picotti et al. (2009). Fold changes are calculated relative to the first time point from the SRM study
(6.5 h).
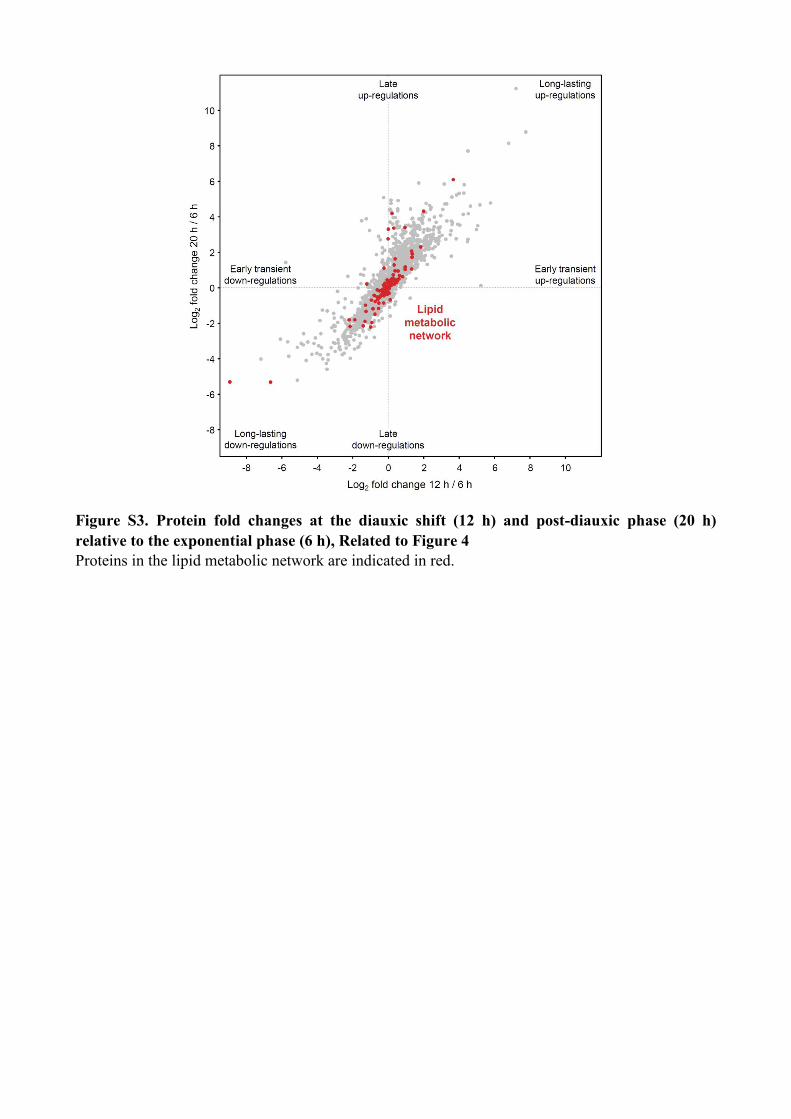
Figure S3. Protein fold changes at the diauxic shift (12 h) and post-diauxic phase (20 h)
relative to the exponential phase (6 h), Related to Figure 4
Proteins in the lipid metabolic network are indicated in red.
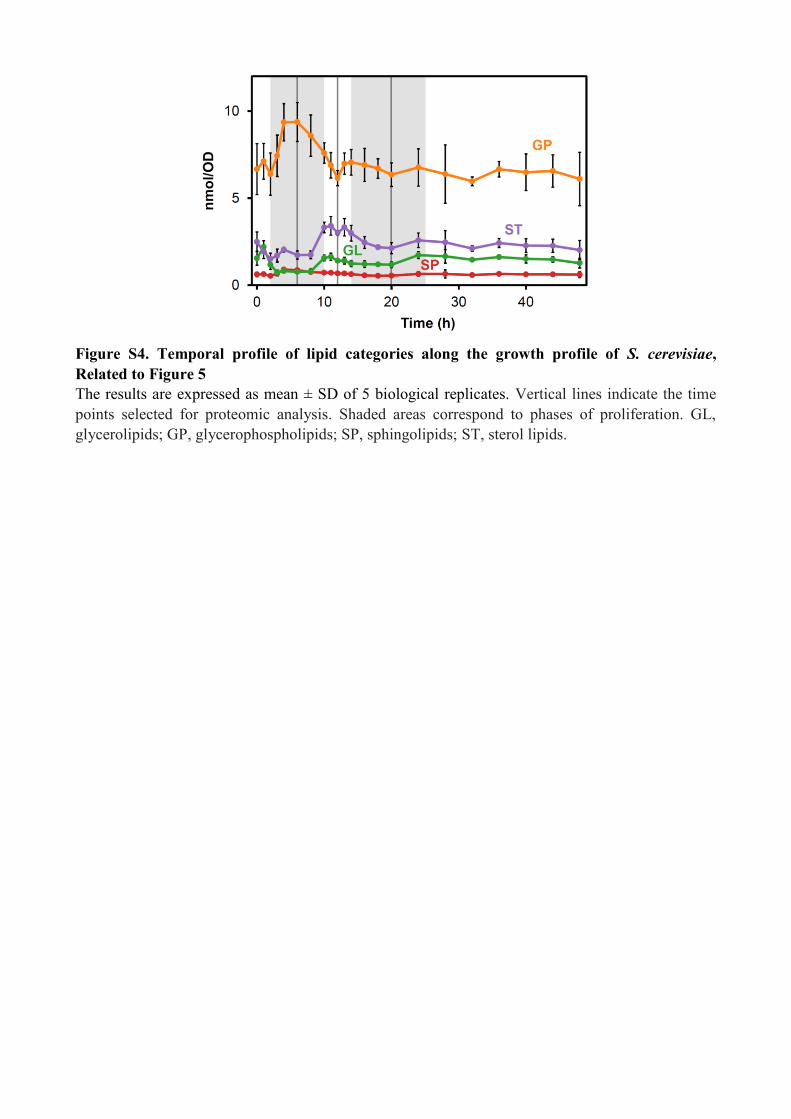
Figure S4. Temporal profile of lipid categories along the growth profile of S. cerevisiae,
Related to Figure 5
The results are expressed as mean ± SD of 5 biological replicates. Vertical lines indicate the time
points selected for proteomic analysis. Shaded areas correspond to phases of proliferation. GL,
glycerolipids; GP, glycerophospholipids; SP, sphingolipids; ST, sterol lipids.
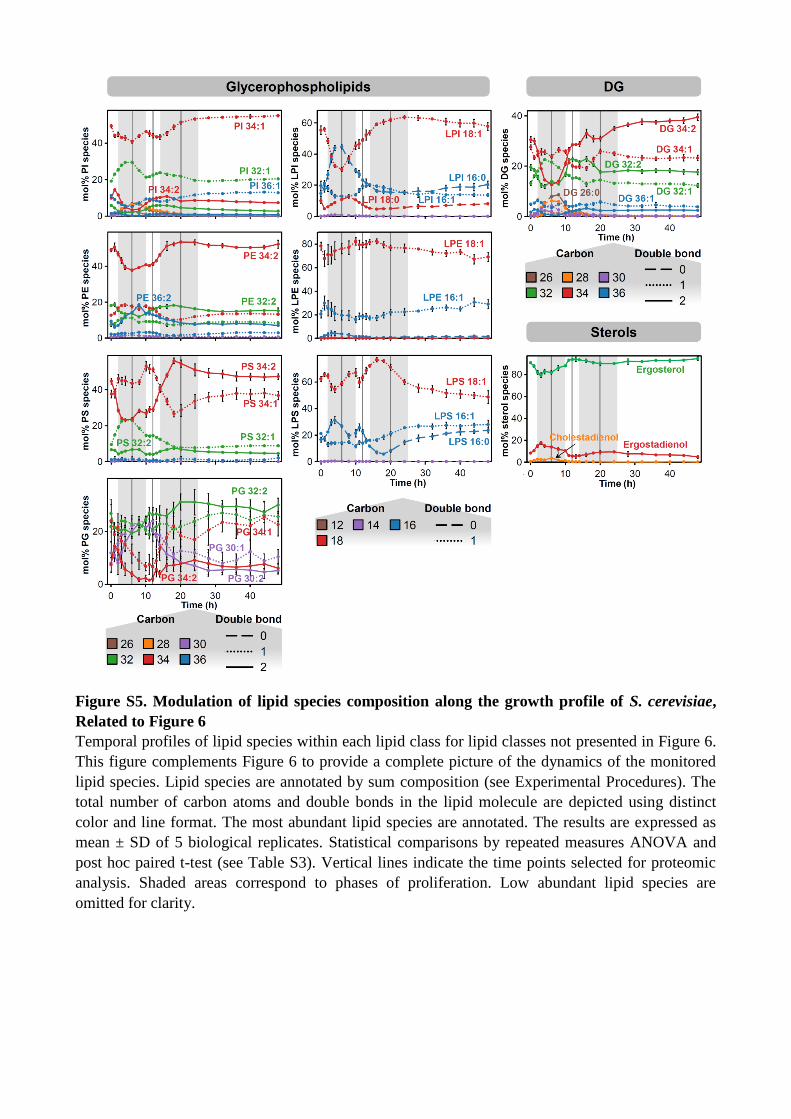
Figure S5. Modulation of lipid species composition along the growth profile of S. cerevisiae,
Related to Figure 6
Temporal profiles of lipid species within each lipid class for lipid classes not presented in Figure 6.
This figure complements Figure 6 to provide a complete picture of the dynamics of the monitored
lipid species. Lipid species are annotated by sum composition (see Experimental Procedures). The
total number of carbon atoms and double bonds in the lipid molecule are depicted using distinct
color and line format. The most abundant lipid species are annotated. The results are expressed as
mean ± SD of 5 biological replicates. Statistical comparisons by repeated measures ANOVA and
post hoc paired t-test (see Table S3). Vertical lines indicate the time points selected for proteomic
analysis. Shaded areas correspond to phases of proliferation. Low abundant lipid species are
omitted for clarity.
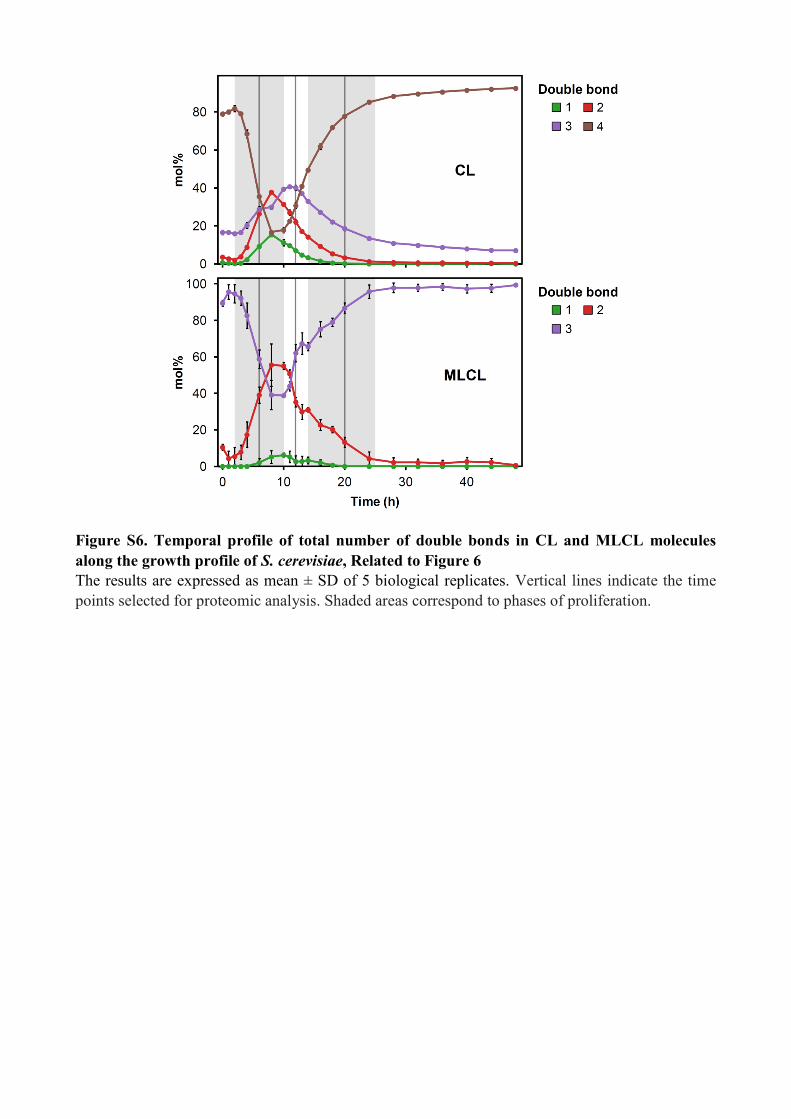
Figure S6. Temporal profile of total number of double bonds in CL and MLCL molecules
along the growth profile of S. cerevisiae, Related to Figure 6
The results are expressed as mean ± SD of 5 biological replicates. Vertical lines indicate the time
points selected for proteomic analysis. Shaded areas correspond to phases of proliferation.
SUPPLEMENTAL TABLES
Table S1. Fold changes in protein abundance, Related to Figures 2, 3 and 4.
Table S2. Lipid class composition and fluctuations in storage vs membrane lipids, Related to
Figure 5.
Table S3. Lipid species composition and fluctuations in SFA vs MUFA motieties in the lipidome,
Related to Figures 6 and 7.
Table S4. Flux balance analysis parameters and results, Related to Figures 1 and 6.
Table S5. Lipid clusters, Related to Figure 7.
Table S6. Over-represented transcription factors associated with up- or down-regulated proteins,
Related to Figure 7.
(Supplemental Tables are supplied in Excel files)
SUPPLEMENTAL FILES
File S1. Navigable proteomic data sorted by protein annotation, Related to Figure 3.
This file can be opened and navigated using the freeware Tableau Reader
(www.tableausoftware.com/products/reader).
File S2. Navigable lipidomic data, Related to Figures 5 and 6.
This file can be opened and navigated using the freeware Tableau Reader
(www.tableausoftware.com/products/reader).
File S3. Complete metabolic model in SBML format, Related to Figure 1 and Table S4.
SUPPLEMENTAL DISCUSSION
Metabolic fate of TG lipids mobilized during the entry into the post-diauxic phase
Flux balance analysis demonstrated that growth upon exit from the diauxic shift and entry into the
post-diauxic phase cannot be supported by only uptake and oxidation of ethanol. A minimum TG
mobilization of 2.6 µmol·g-1
·h-1
was predicted to be required (Table S4). Under this condition,
100% of the mobilized TG lipids were used for energy production via β-oxidation. In comparison,
for fixed growth behavior (and fixed ethanol uptake), maximizing the TG mobilization showed that
TG lipids could also be used for additional metabolic purposes (e.g. production of the other
metabolites). Under this condition at least 44% of the mobilized TG lipids are used for energy
production. TG mobilization values and flux values of all other reactions are presented in Table S4.
We note that, since the experiment was carried out in YPD medium and the modeling assumes a
synthetic complete medium, the flux balance analysis may overestimate the proportion of mobilized
TG lipids used for energy production as other components in the YPD medium may also contribute.
SUPPLEMENTAL EXPERIMENTAL PROCEDURES
Glucose and ethanol determination
The concentration of glucose in the medium was determined using a commercially available kit
(LabAssay Glucose; Wako Chemicals). The ethanol assay was based on Cornell et al. (1983).
Briefly, samples were deproteinized in 1.6% (w/v) HClO4 (final concentration), and 50 µl of diluted
(1/30, v/v) sample were mixed with 1.4 ml of reaction buffer (315 mM Tris/210 mM lysine, pH 9.7,
1.82 mM NAD+). The formation of NADH, which is proportional to the amount of ethanol present,
was followed by measuring the absorbance (340 nm) before and 10 min after the addition of 100 µg
of yeast alcohol dehydrogenase (Sigma).
Yeast lysis and protein digestion
Yeast pellets (~25 ODu) were resuspended in 600 µl of 20 mM triethylammonium bicarbonate
buffer (TEAB) containing a tablet of EDTA-free complete-mini protease inhibitors (Roche
Diagnostics) per 10 ml of TEAB. Acid-washed glass beads (~350 µl) were added to the yeast
suspension and cells were lysed at 4ºC using a cell disruptor by repeated bead beating for 3 cycles
of 5 min disruption followed by 1 min of rest. The bottom of the tube was pierced, the tube was
placed on a new tube and centrifuged (500 g, 1 min, 4ºC) to collect the lysate. SDS and DTT were
then added to the yeast lysate to a final concentration of 4% (w/v) and 100 mM, respectively, and
the sample was incubated for 10 min at 80ºC. Finally, the samples were sonicated in 6 cycles
consisting of 5 s sonication followed by a 5 s break and centrifuged (14000 g, 5 min). The
supernatant was stored in a low protein binding tube at -80ºC until subsequent protein digestion.
The protein concentration in the protein extracts was determined by amino acid analysis (AAA)
using a Biochrom 31 amino acid analyzer (Biochrom) as described (Pannee et al., 2013). One
hundred µg of protein were incubated for 10 min at 80ºC upon addition of fresh DTT (50 mM, final
concentration) and subsequently digested using the SF-ISD:SDC protocol (Leon et al., 2013).
Briefly, denatured proteins were mixed with 600 µl of 8 M urea in 20 mM TEAB and loaded in two
steps on spin filters (Vivacon 500, 30 KD; Sartorius Stedim): half of the volume was added to the
filter unit and centrifuged (12000 g, 20 min), then 200 µl of 8 M urea in 20 mM TEAB were added
to the filter and centrifuged under the same conditions. The remaining sample volume was loaded
as described above, followed by 2 washes with 200 µl of 8 M urea in 20 mM TEAB. The proteins
were then alkylated by adding 100 µl of 50 mM iodoacetamide (IAA) in 20 mM TEAB containing
0.5% w/v sodium deoxycholate (SDC) to the filter unit and incubating the sample for 20 min in the
dark. IAA was then discarded by centrifugation under the same conditions. The filter unit was
washed twice with 100 µl of 0.5% w/v SDC in 20 mM TEAB. Fifty µl of trypsin (Promega) in
0.5% w/v SDC, 20 mM TEAB (1:100 w/w enzyme to protein) were added and the filter unit was
incubated at 37ºC overnight. The filter unit was transferred to a fresh collection tube and
centrifuged (14000 g, 15 min). Fifty µl of 0.5% w/v SDC in 20 mM TEAB were added to the filter
unit and centrifuged under the same conditions to improve peptide recovery. One hundred µl of
ethyl acetate and 5 µl of 20% v/v TFA were subsequently added to the peptide solution. After
centrifugation (14000 g, 10 min) the lower phase, containing the peptides, was transferred to a new
low protein binding tube and stored at -80ºC until analyzed. The peptide concentration in the
peptide extracts was determined by AAA.
2D-LC-MS/MS analysis of peptides
Five µg of yeast tryptic digest were analyzed by online 2D reverse-phase (RP)/RP-LC-MS/MS
using a nanoAcquity UPLC system (Waters) coupled to a LTQ Orbitrap XL mass spectrometer
(Thermo Scientific) via a nanoelectrospray source (Proxeon, now Thermo Scientific). Peptides were
separated as described (Kryuchkov et al., 2013). In short, peptide digests were initially trapped on
the first dimension XBridge BEH C18 reversed phase column (300 μm× 50 mm, 5 μm particle size;
Waters) at 2 μl/min with 3% acetonitrile in 20 mM ammonium formate pH 10. Five fractions were
generated by discrete 2-min steps at 2 μl/min of 11.1%, 14.5%, 17.4%, 20.8%, and 50.0%
acetonitrile, respectively. Each eluting fraction was online acidified and diluted 10-fold with 0.1%
formic acid in water at 20 μl/min and trapped on a Symmetry C18 trapping column (180 μm × 20
mm, 5 μm particle size; Waters). Each fraction was separated with a BEH C18 reversed phase
analytical column (75 μm × 250 mm, 1.7 μm particle size; Waters) at 350 nl/min using a 165 min
gradient of 5−35% acetonitrile with 0.1% formic acid. The column was operated at 40ºC. The
source was operated at 2.2 kV and with the capillary at 200ºC. The LTQ Orbitrap XL was operated
in data-dependent mode at a target mass resolution of 60,000 (at m/z 400). The scan range of each
survey scan was m/z 300-1650 and up to the 10 most intense peaks with charge ≥2 and an intensity
above the 5000 threshold, were selected and fragmented by collision induced dissociation with
normalized collision energy of 35. The maximum injection times for the survey scan and the
MS/MS scan were 1 s and 150 ms, respectively, and the respective ion target values were set to 1E6
and 1E4. To minimize the redundant selection of precursor ions, the fragmented ions were
dynamically excluded for 120 sec.
Peptide identification and label-free protein quantification
The fragmentation spectra were searched using the search engine Mascot against a customized
database containing the yeast ORF database (Saccharomyces Genome Database; release February 3,
2011; 6717 entries) and additional entries including common contaminants. The search was
facilitated through the Proteome Discoverer software (v1.4, Thermo Scientific) using the following
parameters: trypsin, maximum 2 missed cleavages, 8 ppm precursor mass tolerance, 0.6 Da
fragment mass tolerance, cysteine carbamidomethylation as a fixed modification and acetylation of
protein N-terminal, and oxidation of methionine as dynamic modifications. Peptide identifications
were filtered at 1% false discovery rate on peptide level using Percolator (Kall et al., 2007; Spivak
et al., 2009). Relative protein quantification between experimental conditions was achieved by a
label-free quantification approach using the Progenesis LC-MS software (v4.1, Nonlinear
Dynamics Limited). Briefly, the LC-MS/MS maps of each fraction across the 15 samples were
aligned. The peptide identifications obtained as indicated above were imported and matched to the
corresponding feature across the different runs. The sum of all unique peptide intensities for each
protein was used to calculate the relative changes in protein abundance between the analyzed time
points.
Curation of OLE1 mRNA data
OLE1 transcript abundance was curated from DeRisi et al. (1997) and overlaid with our data after
time realignment using the cell density (OD/ml) and glucose consumption curves.
Yeast lysis and lipid extraction
The yeast lysis and the lipid extraction were carried out at 4ºC as previously described (Ejsing et al.,
2009). In short, yeasts (~5 ODu) were resuspended in 1 ml 155 mM ammonium acetate and lysed
with 400 µl of acid-washed glass beads using a cell disruptor. Lipids were extracted from 0.4 ODu
of yeast lysate, sample volume was adjusted to 200 µl with 155 mM ammonium acetate and mixed
with 17.2 µl of internal standard (IS) mixture. The IS mixture provided a spike of 52 pmol PA 17:0-
14:1, 16 pmol PS 17:0-20:4, 91 pmol PE O-20:0/O-20:0, 116 pmol PC 18:3-18:3, 52 pmol PI 17:0-
14:1, 22 pmol PG 17:0-14:1, 35 pmol CL 14:0-14:0-14:0-14:0, 40 pmol LPA O-16:0, 19 pmol LPS
17:1, 40 pmol LPE O-16:0, 15 pmol LPC O-17:0, 45 pmol LPI 17:1, 16 pmol DG 19:0-19:0, 179
pmol TG 17:1-17:1-17:1, 41 pmol Cer 18:1;2/17:0;0, 122 pmol IPC 18:0;2/26:0;0, 97 pmol MIPC
18:0;2/26:0;0, 33 pmol M(IP)2C 18:0;2/26:0;0, 160 pmol cholesterol ester 19:0, and 420 pmol
cholesterol–D7. For two-step lipid extraction, 990 µl chloroform/methanol (15:1 v/v) were added
and the samples were stirred (1400 rpm, 2 h, 4ºC) using a ThermoMixer (Eppendorf). The lower
organic phase was collected after centrifugation (1000 g, 2 min, 4ºC). The remaining aqueous phase
was reextracted with 990 µl chloroform/methanol (2:1 v/v) for 1 h and the lower organic phase was
collected. The lipid extracts were dried and kept at -20ºC until analyzed.
MS analysis of lipids
The lipid extracts were dissolved in 100 µl chloroform/methanol (1:2, v/v) and analyzed using a
LTQ Orbitrap XL mass spectrometer (Thermo Scientific) equipped with a robotic nanoflow ion
source TriVersa NanoMate (Advion Biosciences) as described (Ejsing et al., 2009). For PE, PC,
LPE, LPC, DG, TG, Cer, and ergosterol esters quantification, the 15:1-phase extract was infused in
7.5 mM ammonium acetate in chloroform/methanol/propanol (1:2:4 v/v/v), with the NanoMate
operated at 0.96 kV and 1.25 psi, and analyzed for 5 min in positive ion mode by multiplexed FT
MS analysis alternating low (m/z 220-530) and high (m/z 500-1200) scan ranges. PA, PI, PS, PG,
LPA, LPI, LPS, CL, MLCL, IPC, MIPC, M(IP)2C were quantified in the 2:1-phase extract infused
in 0.005% w/v methylamine in chloroform/methanol (1:5 v/v), with the NanoMate operated at 0.96
kV and 0.6 psi, and analyzed for 5 min in negative ion mode by multiplexed FT MS analysis
alternating low (m/z 200-605), medium (m/z 505-1400) and high (m/z 1000-1600) scan ranges.
Multiplexed FT MS analysis was used to improve ion statistics (Southam et al., 2007), and the m/z
ranges were set to cover all the monitored lipid species of the same lipid class in a single scan
range. Sterols were analyzed in negative ion mode after sulfation of the 15:1-phase extract as
described (Carvalho et al., 2012). Briefly, 40 µl of lipid extract were dried, resolubilized in 20 µl of
31.4 mM sulfur trioxide pyridine complex in pyridine and incubated for 30 min at room
temperature. Then, 2.1 µl of 314 mM barium acetate were added, samples were sonicated and
incubated 10 min at room temperature followed by 1 h at 4ºC. Eighty µl of methanol were then
added, and the solution centrifuged (15000 g, 20 min, 4ºC). The supernatant, was infused in 0.005%
w/v methylamine in pyridine/methanol (1:9, v/v), with the NanoMate operated at 1.5 kV and 2 psi,
and analyzed by FT MS in negative ion mode for 3 min (m/z 455-485). In all analyses, the LTQ
Orbitrap XL was operated in profile mode at a target mass resolution of 100,000 (at m/z 400), 250
ms maximum injection time, and the ion target value was set to 1E6. All samples were analyzed
using 2 technical replicates.
Analysis of lipidomic data
Lipid species were identified using the ALEX software (Husen et al., 2013) and quantified using the
Orange data mining package (Curk et al., 2005). In short, the FT MS data from the Thermo .RAW
files were first converted into averaged spectral peak lists in text file format. Then, a set of target
lists containing all the lipid species to be monitored in each scan range was compiled based on a
priori knowledge and matched with the experimental data (within a mass tolerance of < 3.7 ppm) to
subsequently extract the ion intensities of the identified lipid species. For lipid species
quantification, (i) ion intensities were translated into lipid amounts using internal class-specific lipid
standards as a reference, (ii) background abundances estimated from blank samples were subtracted,
and (iii) lipid species not quantified in both technical replicates were discarded. The 2 technical
replicates were averaged and lipid species were only considered to be present at a particular time
point when detected in at least 2 biological replicates. Special considerations were taken in the
analysis of CL, MLCL, and sterols: (i) CL quantification was based on the 1st isotope of the doubly
charged ion, due to partial overlap between the monoisotopic peaks of certain CL and PE species;
(ii) MLCL levels were estimated using the CL 14:0-14:0-14:0-14:0 standard as a reference; (iii)
cholesterol-D7 was used as an internal standard for sterol quantification and a 0.6 correction factor
was applied to the calculated levels of endogenous sterols (Carvalho et al., 2012) to account the
different signal response between different sterols (Sandhoff et al., 1999).
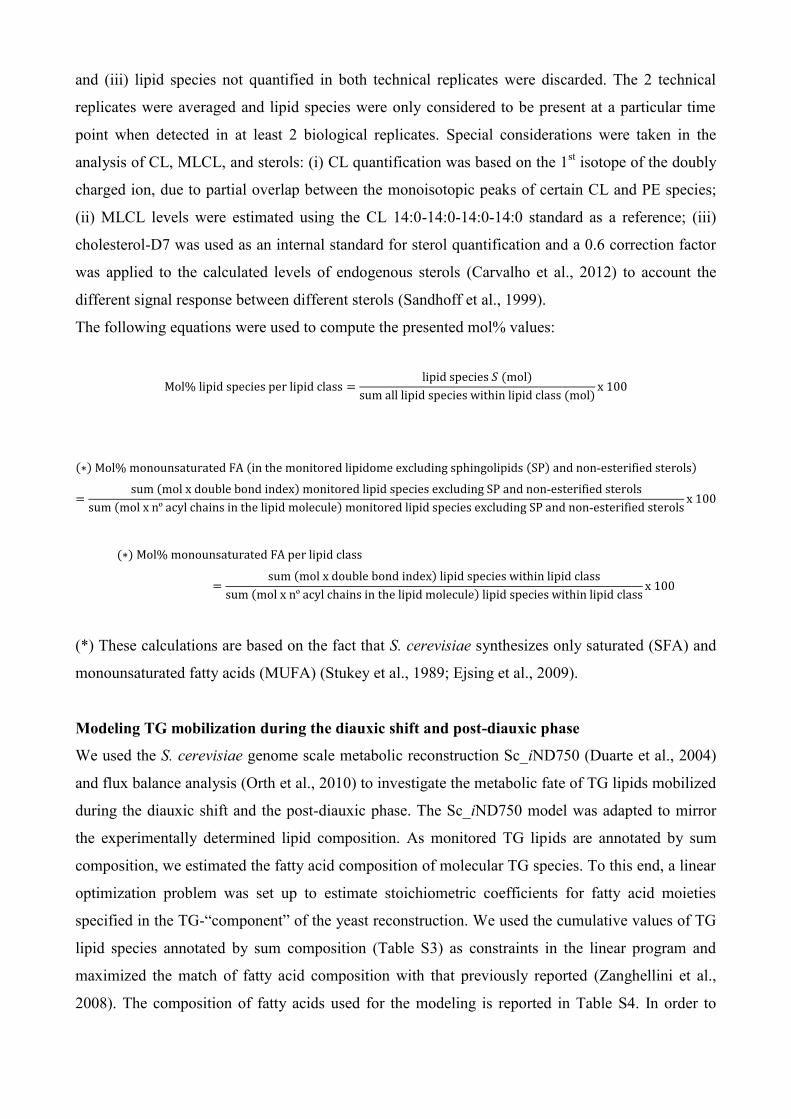
The following equations were used to compute the presented mol% values:
(*) These calculations are based on the fact that S. cerevisiae synthesizes only saturated (SFA) and
monounsaturated fatty acids (MUFA) (Stukey et al., 1989; Ejsing et al., 2009).
Modeling TG mobilization during the diauxic shift and post-diauxic phase
We used the S. cerevisiae genome scale metabolic reconstruction Sc_iND750 (Duarte et al., 2004)
and flux balance analysis (Orth et al., 2010) to investigate the metabolic fate of TG lipids mobilized
during the diauxic shift and the post-diauxic phase. The Sc_iND750 model was adapted to mirror
the experimentally determined lipid composition. As monitored TG lipids are annotated by sum
composition, we estimated the fatty acid composition of molecular TG species. To this end, a linear
optimization problem was set up to estimate stoichiometric coefficients for fatty acid moieties
specified in the TG-“component” of the yeast reconstruction. We used the cumulative values of TG
lipid species annotated by sum composition (Table S3) as constraints in the linear program and
maximized the match of fatty acid composition with that previously reported (Zanghellini et al.,
2008). The composition of fatty acids used for the modeling is reported in Table S4. In order to
model the changes in lipid composition at different times we modified several reactions
(R_TRIGS_SC, R_AGAT_SC, R_GAT1_SC, R_GAT2_SC, R_TGL, R_DGL, R_MGL,
R_PLB_lpc, R_PLB_lpe, R_PLB_lps, R_PLB_pc, R_PLB_pe, and R_PLB_ps). In these reactions
the specific fatty acids / acyl-CoAs were replaced by pseudo-particles representing the average fatty
acid composition. The pseudo-particles were defined by two additional reactions (R_FACOA and
R_FA). The complete SBML version of our model (File S3) lists, amongst others, a compartment
with the identifier “Extra_organism”, which comprises all metabolites considered to be external.
Metabolites in the remaining compartments were considered internal. Next, flux balance analysis
was used to determine the fate of fatty acids mobilized from TG during the diauxic shift and post-
diauxic phase. As done in previous studies (Zanghellini et al., 2008), lipid droplets were considered
to be an external compartment and the flux from the lipid pools taken up by the cell was predicted.
Both minimal and maximal TG mobilization were used as objectives. Growth was modeled on
minimal medium containing oxygen, ammonia, sulfate, phosphate, water, potassium, sodium,
protons and ethanol with fixed growth and fixed ethanol uptake. Oxygen uptake was limited to ≤8
mmol·g-1
·h-1
and maintenance requirements were set to R_ATPM = 1 mmol·g-1·
h-1
. Ethanol and TG
lipids were considered to be the sole carbon sources. The biomass and ethanol concentration data
(Figure 1A) were approximated as function of time, t, with exponential functions of the form
using A0 and μ as free fitting parameters. Growth and ethanol uptake were then
approximated by the derivative of f(t). Fluxes were converted to mmol/h and normalized to the
biomass at the respective time. An optical density (OD600) of 1 was assumed to correspond to 1 g
dry-mass per liter. A summary of the fit parameters and errors is given in Table S4. We used Grace
(http://plasma-gate.weizmann.ac.il/Grace) for all fitting purposes and an in-house flux balance
analysis implementation based on the GNU Linear programming kit
(http://www.gnu.org/software/glpk). A copy of the implementation is available on request.
SUPPLEMENTAL REFERENCES
Cornell, N.W., and Veech, R.L. (1983). Enzymatic measurement of ethanol or NAD in acid extracts
of biological samples. Anal. Biochem. 132, 418-423.
Curk, T., Demsar, J., Xu, Q., Leban, G., Petrovic, U., Bratko, I., Shaulsky, G., and Zupan, B.
(2005). Microarray data mining with visual programming. Bioinformatics 21, 396-398.
Duarte, N.C., Herrgard, M.J., and Palsson, B.O. (2004). Reconstruction and validation of
Saccharomyces cerevisiae iND750, a fully compartmentalized genome-scale metabolic model.
Genome Res. 14, 1298-1309.
Ghaemmaghami, S., Huh, W.K., Bower, K., Howson, R.W., Belle, A., Dephoure, N., O'Shea, E.K.,
and Weissman, J.S. (2003). Global analysis of protein expression in yeast. Nature 425, 737-741.
Gillet, L.C., Navarro, P., Tate, S., Rost, H., Selevsek, N., Reiter, L., Bonner, R., and Aebersold, R.
(2012). Targeted data extraction of the MS/MS spectra generated by data-independent acquisition: a
new concept for consistent and accurate proteome analysis. Mol. Cell. Proteomics 11, O111
016717.
Kall, L., Canterbury, J.D., Weston, J., Noble, W.S., and MacCoss, M.J. (2007). Semi-supervised
learning for peptide identification from shotgun proteomics datasets. Nat. Methods 4, 923-925.
Kryuchkov, F., Verano-Braga, T., Hansen, T.A., Sprenger, R.R., and Kjeldsen, F. (2013).
Deconvolution of mixture spectra and increased throughput of peptide identification by utilization
of intensified complementary ions formed in tandem mass spectrometry. J. Proteome Res. 12, 3362-
3371.
Orth, J.D., Thiele, I., and Palsson, B.O. (2010). What is flux balance analysis? Nat. Biotechnol. 28,
245-248.
Pannee, J., Portelius, E., Oppermann, M., Atkins, A., Hornshaw, M., Zegers, I., Hojrup, P.,
Minthon, L., Hansson, O., Zetterberg, H., et al. (2013). A selected reaction monitoring (SRM)-
based method for absolute quantification of Abeta38, Abeta40, and Abeta42 in cerebrospinal fluid
of Alzheimer's disease patients and healthy controls. J. Alzheimers Dis. 33, 1021-1032.
Sandhoff, R., Brugger, B., Jeckel, D., Lehmann, W.D., and Wieland, F.T. (1999). Determination of
cholesterol at the low picomole level by nano-electrospray ionization tandem mass spectrometry. J.
Lipid Res. 40, 126-132.
Southam, A.D., Payne, T.G., Cooper, H.J., Arvanitis, T.N., and Viant, M.R. (2007). Dynamic range
and mass accuracy of wide-scan direct infusion nanoelectrospray fourier transform ion cyclotron
resonance mass spectrometry-based metabolomics increased by the spectral stitching method. Anal.
Chem. 79, 4595-4602.
Spivak, M., Weston, J., Bottou, L., Kall, L., and Noble, W.S. (2009). Improvements to the
percolator algorithm for Peptide identification from shotgun proteomics data sets. J. Proteome Res.
8, 3737-3745.
Stukey, J.E., McDonough, V.M., and Martin, C.E. (1989). Isolation and characterization of OLE1, a
gene affecting fatty acid desaturation from Saccharomyces cerevisiae. J. Biol. Chem. 264, 16537-
16544.
Zanghellini, J., Natter, K., Jungreuthmayer, C., Thalhammer, A., Kurat, C.F., Gogg-Fassolter, G.,
Kohlwein, S.D., and von Grunberg, H.H. (2008). Quantitative modeling of triacylglycerol
homeostasis in yeast--metabolic requirement for lipolysis to promote membrane lipid synthesis and
cellular growth. FEBS J. 275, 5552-5563.