Embed Size (px)
Citation preview
PBL Netherlands Environmental Assessment Agency, December 2010
Quantitative analysis of patterns of vulnerability to global environmental change
Patterns of vulnerability bridge the gap between local case
studies and global vulnerability assessments
The impacts of global change, including environmental changes,
pose increasing risks for people around the globe. In this context,
we developed and applied a methodology to quantitatively assess
the extent to which specific groups of people are vulnerable to
losing their livelihoods. Local vulnerability analyses are often
based on case studies, while global vulnerability assessments are
essentially based on aggregated data and rather crude assumptions
about underlying mechanisms. Recognising the need and the
potential for looking at similarities between related situations
around the globe, the methodology generalises the outcomes of
case studies towards patterns of vulnerability, using insights from
global assessments.
Using indicators from global Integrated Assessment Models,
the methodology quantifies the core mechanisms that cause
vulnerability. Different manifestations of the patterns and their
geographic location are assessed through cluster analysis. The
methodology has been applied to the following four patterns of
vulnerability: smallholder farming in dryland areas, overexploitation
of natural resources, competition over land for food and biofuels,
and rapid urbanisation in coastal areas. Insights gained from this
study can give guidance to adaptation and mitigation policies in
specific situations, and can serve as a reference for identifying the
consequences of international policies for vulnerable groups.Background Studies

Quantitative analysis of patterns of vulnerability to global environmental change
M.T.J. Kok, M.K.B. Lüdeke, T. Sterzel, P.L. Lucas, C. Walter, P. Janssen and I. de Soysa
NTNU Globalization Reserch Programme
Quantitative analysis of patterns of vulnerability to global environmental change © Netherlands Environmental Assessment Agency (PBL), Den Haag/Bilthoven, December 2010PBL publication number 550025005
Corresponding Author: [email protected]
Parts of this publication may be reproduced, providing the source is stated, in the form:Netherlands Environmental Assessment Agency, December 2010, Quantitative analysis of patterns of vulnerability to global environmental change.
This publication can be downloaded from our website: www.pbl.nl/en.
The Netherlands Environmental Assessment Agency (PBL) is the national institute forstrategic policy analysis in the field of environment, nature and spatial planning. We contribute to improving the quality of political and administrative decision-making by conducting outlook studies, analyses and evaluations in which an integrated approach is considered paramount.Policy relevance is the prime concern in all our studies. We conduct solicited and unsolicited research that is both independent and always scientifically sound.
Office The Hague Office BilthovenPO Box 30314 PO Box 3032500 GH The Hague 3720 AH BilthovenThe Netherlands The NetherlandsTelephone: +31 (0) 70 328 8700 Telephone: +31 (0) 30 274 274 5Fax: +31 (0) 70 328 8799 Fax: +31 (0) 30 274 44 79E-mail: [email protected]: www.pbl.nl/en
Preface 5
This report is the result of a collaboration between the Potsdam Institute for Climate Impact Research, The Norwegian Institute for Science and Technology and the Netherlands Environmental Assessment Agency. It finds its origins in work some of the authors of this report had completed for the chapter on vulnerability analysis in the fourth Global Environment Outlook (GEO–4) of the United Nations Environment Programme (UNEP).
This assessment resulted in a number of challenging questions for further research, which were taken up in a joint research project that aimed to resolve some of the methodological issues that we were not addressed in GEO–4, to develop a robust methodology and to carry out a further in-depth analysis of a number of vulnerable situations. While this is a methodological report, we expect that it will provide a good basis for further applied research to explore responses to reduce vulnerabilities to environmental change in the context of sustainable development.
We would like to thank the following people for their stimulating discussions and useful feedback: Henk Hilderink, Ton Manders (PBL); Wolfgang Cramer, Wolfgang Lucht (PIK); Tony Patt (IIASA); Frank Thomalla and Richard Klein (SEI).
Preface

Quantitative analysis of patterns of vulnerability to global environmental change 6
Summary 7
Global change poses increasing risks for people around the worldThe impacts of socioeconomic global changes and environmental changes pose increasing risks for people around the world. Increasing population growth, increasing wealth and income disparities, global environmental change, as well as decreasing availability of resources, all put a strain on people’s livelihood, especially the poor. We assess the extent to which specific groups of people are vulnerable to losing their livelihoods as a consequence of global change. Insights gained from this study could potentially influence future policy making with respect to guidance to adaptation and mitigation policies in specific situations, and it could serve as a reference for identifying the consequences of international policies for vulnerable groups.
Archetypical patterns of vulnerability bridge the gap between local case studies and global vulnerability assessmentsVulnerability analyses are often local case studies, whereas global vulnerability assessments depend on aggregated data and rather crude assumptions about the underlying mechanism being assessed. In recognition of the need and the potential to analyse the similarities between related situations around the world, a method was developed to identify and analyse so-called ‘archetypical patterns of vulnerability’. This method focuses on generalising the outcomes of local vulnerability studies and building upon global assessment insights and tools.
The method looks for common vulnerability creating mechanisms amongst a multitude of situations, delineates and describes ‘archetypical’ combinations of vulnerability creating mechanisms that work at different locations in a similar way. These so-called ‘archetypical patterns of vulnerability’ are defined as ‘specific, representative patterns of the interactions between environmental change and human well-being’. The methodology not only looks at environmental changes but it also includes the wide socioeconomic context in which these changes take place, addressing the integrated human-environment system from a global perspective.The method was first developed and applied as part of the fourth Global Environmental Outlook of UNEP, where it proved itself useful for the qualitative analyses of a number of archetypical patterns. The twofold objective of this report is 1) to further elaborate and formalise the approach for analy-sing patterns of vulnerability and 2) to quantitatively analyse a number of patterns of vulnerability.
An approach for analysing patterns of vulnerabilityTo further elaborate and formalise the analysis as done in GEO–4, we developed a five-step methodology that includes qualitative and quantitative analysis:1. Identification and qualitative description of the pattern
of vulnerability, by addressing the main exposures, key vulnerable groups and their sensitivities.
2. Formalisation of the pattern of vulnerability, by developing an influence diagram that captures the most relevant dynamics.
3. Quantification of the pattern of vulnerability by applying an indicator-based statistical analysis (cluster analysis) linked to integrated assessment models, which results in vulnerability profiles and their spatial distribution to show where and in which form the pattern manifests itself.
4. Interpretation and validation of quantitative results by relating the quantitative analysis with qualitative information as is with local case studies.
5. Address opportunities to cope and adapt to emerging or increasing vulnerability by extending the model-based analysis into the future and by addressing adaptation policies linked to specific characteristics of the vulnerability profiles.
The methodology has been applied to four patterns of vulnerability, including smallholder farming in dryland areas, overexploitation of natural resources, competition for land for food and biofuels, and rapid urbanisation in the coast fringe.
Vulnerability of smallholder farming in dryland areasThe pattern of vulnerability addressing smallholder farming in dryland areas is mainly characterised by the increased pressures placed on scarcely available natural resources for growing populations due to natural growth or migration, consequently putting smallholder farmers into a poverty trap. The analysis identifies eight distinct clusters, predominantly formed due to differences in income, agropotential and soil erosion. Simultaneously, differences in infant mortality rates and water availability also plays role in distinguishing between different clusters.
Except for wealthy areas, the most promising situation is within clusters best endowed with natural resources; however, unequal access to these resources prevents the population from achieving high levels of human well-being. The situation becomes more complex in clusters where high levels of soil degradation threaten future yields. In
Summary
Quantitative analysis of patterns of vulnerability to global environmental change 8
resource-poor clusters, the opportunities provided by the natural resource base are by nature very weak – making an agricultural-based poverty reduction strategy more difficult. The same holds for the cluster with a relatively good natural resource base, which is critically overstretched by intensive agricultural overuse by a very high population density.
Related to their vulnerability situation, opportunities include strengthening of institutions to increase equality, diversification of livelihoods to more off-farm income potential, improvement of natural resource management and agricultural practices, and broadened access to markets.
Vulnerability of forest-dependent people for forest overexploitationThe pattern of vulnerabiliy addressing forest overexploitation is mainly characterised by the loss of ecosystem services in forests, as a result of either locally or internationally driven overuse, which increases the vulnerability of people dependent on these services. The analysis concludes ten distinct clusters, predominantly formed due to differences in market access, urbanisation, income levels, and land degradation. Simultaneously, differences in the level of agricultural intensity, population density, and the net primary productivity also play a role.
The revealed clusters can be characterised in line with three stylised forest typologies that are already recognised in the literature, that is, mosaiclands, frontier areas and forest core. Within the mosaiclands, the situation is most pressing in areas with very high population densities, low to intermediate levels of human well-being, and severe levels of overexploitation of soil and forest resources. In already highly degraded areas, uncontrolled capital-driven overexploitation might further increase environmental stress without improving the well-being of local population. For the frontier areas, governance levels are the lowest of the three typologies. Subsistence-based forest-use in areas with land quality that is intermediate to low poses a severe challenge for sustainable resource management, and having low levels of governance increases the risk of capital-driven overexploitation. For the forest core, the situation is the worst in tropical forests that already suffer from large-scale wood extraction and boreal forests that already include agricultural areas with increased land degradation. Comparing the cluster interpretation with meta-studies, case studies, and deforestation data further concludes that location-specific policies play an important role in how the described vulnerabilities eventually play out. It also stresses the role of forest governance as a very important factor in avoiding or reversing overexploitation and related vulnerabilities.
Related to their vulnerability situation, opportunities in mosaiclands include off-farm income opportunities and improved resource management. In frontier areas, opportunities include the strengthening of land tenure and forest protection. If land-use intensification takes place in a sustainable way, these areas can offer opportunities for poverty alleviation. Finally, opportunities in the forest core include the creation of markets in environmental services, while large-scale infrastructure expansion and disruptive competition for property rights should be avoided.
Vulnerability of rural livelihoods due to competition for land for food and biofuelsThe pattern of vulnerability is mainly characterised by the increased pressure put on vast areas worldwide that are potentially suitable for cultivating food and biofuels, and the pressure put on ecosystems and the populations dependent on them, as a result of a booming global biofuel market. The analysis concludes there are nine distinct clusters, predominantly formed due to differences in income levels and water availability. Simultaneously, differences in the abundance of marginal land, infant mortality rate, population density, net food export, and the level of biodiversity also play a role.
Possible negative trade-offs of a rapidly increasing global demand for first-generation biofuels are most pronounced in areas with high local resource dependency in densely populated, poor regions with tight competition over widespread cultivated areas, and in areas with moderate biofuel growth potential combined with extensive biodiverse vegetation adjacent to arable land. The more food insecure land and the less non-arable land is available to expand cultivation on, the more import dependency and food insecurity are likely to increase. Marginal land areas with pockets of land-use competition reconcile risks and opportunities. Opportunities occur in areas with a high enough growth potential for profit without the risk of impacting the local biodiversity. Biofuel crops attuned to local conditions, for example, yatropha, could serve as an additional source of income on degraded land unsuitable for food production for the farmers themselves or for local use.
As uncontrolled biofuel crop production may provide opportunities to other people than just smallholder farmers and urban poor, better outcomes can be realised by creating sustainable access to natural resources required for biofuel crop production and building institutions that consider the local contexts and condone equitable distribution of the benefits. Once in place, and accepted, such institutions could: a) reap the opportunity of cultivating non-food biofuel crops on marginal lands unsuitable for cultivating food crops; and b) promote domestic use of biofuels.
Vulnerability of poor city dwellers due to rapid coastal urbanisationThe pattern of vulnerability addressing rapid coastal urbanisation is mainly characterised by an unprecedented increase of urban populations due to migration and endemic growth, which increases the pressures on coastal ecosystems, urban planning and management, consequently putting marginalised urban household into a poverty trap. The cluster analysis yielded six clearly distinguishable vulnerability profiles where the following major aspects appeared to be important: the combination of sensitivity and exposure to natural hazards, the sensitivity to future sea-level rise, the rate of population growth, the rate of destruction of natural protection structures by urban spatial expansion, the average income and the distribution of wealth and marginalisation.
To exemplify policy-relevant conclusions, we observed that one of the vulnerability profiles, which includes cities like Belém, Cape Town, and Dakar, shows high sensitivities,
Summary 9
whereas present exposures are relatively low. This tells us that present damages due to exposure/sensitivity do not act as an ‘early warning’ for the much larger damages to be expected under climate change. Furthermore, this typically coincides with a relatively high income (adaptation is possible) and with a large fraction of marginalised people, the latter alluding to poor social coherence with adverse effects on necessary collective actions.
Overlaying armed conflict occurrence with the spatial distribution of the vulnerability of smallholder farming in dryland areasThe methodology developed looks into vulnerability creating mechanisms that create specific patterns of vulnerability. Some issues are, however, not included because incidence is too low to become part of the mechanisms, or because they are difficult to capture as part of an indicator-based analysis due to lack of data. To assess if the quantitative outcomes of the methodology can also be used to address other outcome measures, the analysis of the vulnerability of smallholder farmers in drylands is used to assess the connection between the vulnerability profiles, their spatial distribution, and the occurrence of violent conflicts.
The analysis presents a non-linear, data-driven methodology derived from research on global and environmental change and applies it to a peace research-related problem. Instead of using single or multiple indicators in monovariate or multivariate regression analyses for explaining conflict incidence, the vulnerability profiles that describe the different occurrences of dryland vulnerability are used (see above). These profiles include multiple biophysical, resource-related, and socioeconomic indicators that quantify how vulnerability of smallholder farming in dryland areas is generated. With this non-linear, cluster-based approach, we address explanatory power for both location and causes of conflicts. The results provided measurable added value to multivariate regression analyses in reproducing armed conflict incidence on drylands globally. As to where conflicts are located and where they are not, our approach of looking at clusters within drylands reveals an internal heterogeneity on drylands with the aid of the dryland clusters, and the identified clusters reveal both qualitative and quantitative explanatory power for explaining conflict incidence. These results hold promise for the suitability of this approach to also address other issues, including migration, the collapse of ecosystems, or impacts of extreme weather events.
Pros and cons of the methodologyApplying the approach on the four patterns of vulnerability gives robust results. Clustering occurs in all patterns of vulnerability, with relatively clear optimum cluster numbers. The resulting vulnerability profiles are distinct and robust constellations of indicators, which are intuitive and relatively easy to explain. The profiles identify the main mechanisms and the most prominent parameters that make specific situations vulnerable. Furthermore, the clusters are pin-pointed to specific locations, showing where specific appearances of the patterns of vulnerability take place.
There are also several limitations to the approach of which the user needs to be aware of. The requirement to use data
from Integrated Assessment Models (IAMs) to allow for scenario analysis restricts data availability for the possibilities of the model used. Furthermore, the assumed logic in the influence diagram of the patterns of vulnerability and within the IAMs used is not necessarily consistent. With respect to the data, the spatial requirement is difficult to fulfil for socioeconomic data, especially for future projections. Also, the availability of socioeconomic data is limited; this sometimes forced us to drop an indicator or use rather crude proxies. Besides, information on quality and uncertainty in the data is not always amply available and an assessment of its effects on the outcome of the study remains a topic for future concern.
Next stepsIn this report we developed a robust approach for the analysis of patterns of vulnerability, and we gained more understanding of vulnerability on an intermediate level by applying the methodology on specific human-environment systems. Although it is not part of the report, the approach and the subsequent analysis are intended to provide a basis for policy analysis to reduce vulnerability. Furthermore, the patterns of vulnerability have thus far only been analyzed independently. However, there might be links and connections among the different patterns when the human-environment systems they address overlap, or when elements of their dynamics are linked. It might also be useful to identify hotspots where different types of vulnerability culminate. Finally, it might be interesting to assess the usability of the outcomes to specific patterns of vulnerability in order to explain other human well-being outcomes, or to highlight the role of specific issues that are not addressed by the pattern itself. Methodological work is required to address all these questions further.

Quantitative analysis of patterns of vulnerability to global environmental change 10
Summary 11
Contents
�� Preface 5
�� Summary 7
�� 1 Introduction 13
�� 2 A methodology for analysing patterns of vulnerability 152.1 Analysing human vulnerability 152.2 Defining patterns of vulnerability 162.3 An approach for analyzing patterns of vulnerability 172.4 Analysing patterns of vulnerability with integrated assessment models 192.5 Cluster analysis and interpretation 19
�� 3 Vulnerability of smallholder farmers in drylands 253.1 Vulnerability creating mechanisms 253.2 Indicators for the vulnerability creating mechanisms 263.3 Cluster identification 283.4 Vulnerability profiles and spatial distribution 293.5 Validation of cluster results 313.6 Conclusions 34
�� 4 Vulnerability of forest-based livelihoods to forest overexploitation 354.1 Vulnerability creating mechanisms 354.2 Indicators for the vulnerability creating mechanisms 374.3 Cluster identification 404.4 Vulnerability profiles and spatial distribution 414.5 Validation of cluster results 444.6 Conclusions 46
�� 5 Vulnerability of rural livelihoods due to competition for land for food and biofuels 495.1 Vulnerability creating mechanisms 495.2 Indicators for vulnerability creating mechanisms 515.3 Cluster identification 535.4 Vulnerability profiles and spatial distribution 545.5 Validation of cluster results 585.6 Conclusions 60
�� 6 Vulnerability of urban livelihoods under rapid coastal urbanisation 616.1 Vulnerability creating mechanisms 616.2 Indicators for vulnerability creating mechanisms 626.3 Cluster identification 656.4 Vulnerability profiles and spatial distribution 666.5 Validation of cluster results 706.6 Conclusions 74
Quantitative analysis of patterns of vulnerability to global environmental change 12
�� 7 Using patterns of vulnerability to explain other outcomes 757.1 Global environmental change and the incidence of armed conflict 757.2 Relating the pattern of vulnerability in drylands with incidence of armed conflict 767.3 Conflict reproduction with linear and non-linear methods 787.4 Conclusions 80
�� 8 Discussion and conclusions 83
�� References 86
�� Colophon 91
Introduction 13
Vulnerability analyses typically examine exposures, sensitivity of specific groups of people, their coping and adaptation strategies to deal with these risks, and they ultimately address the consequences for human well-being. A vulnerability analysis not only looks at environmental exposures, it also includes the wider socioeconomic context in which these changes take place. These analyses aim to answer the question of ‘who is vulnerable for what, where, when, and to what extent’. To effectively answer this question, vulnerability analyses include multiple exposures at multiple scales that are dynamic in time.
Local vulnerability analyses are often case studies that address the usually complex context-specific situations that shape specific vulnerabilities. Out of necessity, global vulnerability assessments are based on aggregated data and rather crude assumptions about the underlying mechanisms being assessed. The gap between both is a major challenge for integrated assessments of vulnerability. On the one hand, to be able to learn from case studies, the question about generalisation and relevance in similar situations elsewhere needs to be answered. On the other hand, even when dealing with a fine spatial resolution, global vulnerability assessments must be confronted with the question whether or not local specifics can be adequately represented and understood in a global context and how this can be done.
This report is predominantly concerned with elaborating upon and applying a methodology for both quantitative and qualitative analyses of people’s vulnerability to losing their livelihoods as a consequence of global change – including environmental change. It addresses vulnerability on an intermediate level of complexity by identifying and analysing so-called ‘patterns of vulnerability’ from a global perspective.
Related situations around the world show similarities in conditions and mechanisms that create specific vulnerabilities. This is made clear in early work done by the Potsdam Institute for Climate Impact Research (PIK) on non-sustainable dynamics and mechanisms of global environmental change ‘syndromes’ (Schellnhuber et al., 1997). These similarities also emerge from meta-evaluations of case studies on land-use change, desertification, and deforestation that show that certain key mechanisms explain most of these processes (Geist and Lambin, 2001; Geist and Lambin, 2004). By using these studies as a starting point, we recognise the need and the potential to look at the similarities between related situations around the globe. To
meet this need, a methodology was developed that aimed at generalising the outcomes of local vulnerability studies. It was developed as part of the fourth Global Environmental Outlook: Environment for Development (GEO–4) (UNEP, 2007).1 This methodology looks for common vulnerability creating mechanisms amongst a multitude of situations. It delineates and describes typical combinations of vulnerability creating mechanisms that work at different places in a similar way. In that sense, they are archetypical – hence their name, ‘archetypical patterns of vulnerability’.
Archetypical patterns of vulnerability were defined as ‘specific, representative patterns of the interactions between environmental change and human well-being’ (Jäger and Kok, 2007; Kok and Jäger, 2009). In the rest of this report, with the exception of when we refer specifically to previous work, we use the more abbreviated term ‘patterns of vulnerability’, implying the same ‘archetypical’ significance associated with previous works.
The methodological work in this report focuses on a better understanding of what shapes these patterns of vulnerability and the possibilities for doing an indicator-based, quantitative analysis of the current situation. Alternative future situations can also be analysed by choosing to use indicators that can be derived from integrated assessment models, for example, to show the implications of global policies such as trade liberalisation or the lack of climate change policies. Although the quantitative analysis of patterns of vulnerability in this report provides a reference for scenario analysis, future analysis is not part of this report.
While this is predominantly a methodological report, it also aims at gaining insight into specific vulnerabilities. To accomplish this, the methodology is applied to assess the vulnerability of people in specific human-environment systems. Four patterns of vulnerability, already identified as part of the consultative process of GEO–4, are analysed further, addressing quite diverse vulnerabilities. Together these include some of the major global environmental changes that will possibly have an impact on the poor, including: climate change, biodiversity loss, land degradation, and overexploitation of common pool resources. Simultaneously, these are also placed in a wider societal context of issues such as globalisation, access to markets,
1 Three of the authors of this report were lead authors for the vulnerabil-ity analysis in GEO–4 and contributed to the development of this approach.
Introduction 1
Quantitative analysis of patterns of vulnerability to global environmental change 14
and equity. The following patterns of vulnerability are further analysed:
� Smallholder farming in dryland areas in which increased pressures are placed on available natural resources in drylands due to increasing natural population growth or migration, consequently putting smallholder farmers into a poverty trap.
� Overexploitation of natural resources in which increased pressures placed on forests, either by locally or internationally driven overuse that lead to a loss of ecosystem services, and thereby increase vulnerability of people dependent on them.
� Competition for land for food and biofuels in which possible trade-offs between crop cultivation for biofuels and food security possibly increases the vulnerability of rural livelihoods.
� Rapid urbanisation in the coast fringe in which increasing pressures placed on urban planning and on coastal ecosystems due to increasing urban populations, and global environmental change increase the vulnerability of marginalised urban population.
Insight into the basic processes behind the patterns of vulnerability can help decision making to set priorities to reduce vulnerability and enhance development efforts. This can happen in different ways: (a) by informing decision makers about risks and options for adaptation, either on the local level or on higher levels of decision making within a specific constellation of problems; (b) by indentifying opportunities that address social injustices as people who are already worse off are also most seriously hit by global environmental changes; (c) by identifying options for mitigating core vulnerability creating processes that, in the case of global change, occur at the higher level, for example, climate change and unfavourable trade regimes (Patt et al., 2009). This approach also allows policymakers to recognise their particular situations within a broader context. It provides regional perspectives and important connections between regions in a global context, and it also addresses worldwide inter-dependencies by showing how vulnerability is affected by actions taken elsewhere. On a strategic level, it provides insights into possible responses to reduce vulnerability. An important caveat that we want to note upfront: because this is an analysis on an intermediate level of complexity, it will also require further work to make the analysis context-specific.
This report is organised as follows. Chapter 2 presents the methodology for the quantitative and qualitative analyses of patterns of vulnerability. In Chapters 3 through 6, the four previously mentioned patterns of vulnerability are analysed. In Chapter 7, the approach is used for an overlay with conflict data in drylands to find out if specific drylands are more prone to conflict then others. In Chapter 8, the report ends with conclusions and lessons learned regarding the application of the methodology developed in this report.
A methodology for analysing patterns of vulnerability 15
No formal methodology for the analysis of patterns of vulnerability is yet available. This chapter addresses that challenge by elaborating on a proposed methodology that includes both quantitative and qualitative aspects. To provide context, this chapter starts by briefly reviewing the literature on vulnerability, and introduces some of the basic notions regarding vulnerability analysis in Section 2.1. The concept of ‘patterns of vulnerability’ is defined in Section 2.2, which is followed by laying out a five-step procedure for a quantitative and qualitative analysis of patterns of vulnerability in Section 2.3. The remainder of the chapter elaborates how to quantitatively analyse patterns of vulnerability, including the use of integrated assessment models to provide the data for an indicator-based analysis in Section 2.4, and an elaboration on the statistical method for analysing these data in Section 2.5.
2.1 Analysing human vulnerability
It is widely accepted that many of the social and economic problems in the world cannot be separated from environmental problems and vice versa. Human and environment systems therefore need to be studied in an integrated manner. Vulnerability analysis provides one way to do that by analyzing the potential impacts of environmental changes on people within a broader socioeconomic context. Vulnerability analysis is concerned with questions concerning: who is vulnerable, where is the vulnerability located, when does vulnerability arise, and what is the extent of the vulnerability. This then is a representation of the interplay among hazards, environmental and socioeconomic exposures, as well as the sensitivity to and capacity of individuals or communities to cope and adapt to these hazards and changes. Vulnerability analysis tries to assess the potential impacts of multiple and interacting socioeconomic and environmental changes for specific groups or individuals with respect to their well-being (Turner et al., 2003; Thywissen, 2006; UNEP, 2007; Patt et al., 2009).
Vulnerability is not a feature of how a system functions presently that can be observed or measured directly. Rather, it must be deduced. Vulnerability shows how a specific system is likely to function under changing conditions, and in particular, it highlights the ways in which it will function less
well. To show that a system is vulnerable, one has to combine projections of what events the future will bring with a theory of how these events might negatively impact the system (Patt et al., 2009; page 4-5). It is therefore also relevant to make the distinction, albeit sometimes fuzzy, between a vulnerability analysis and an impact analysis. In a vulnerability analysis one might, for example, identify specific dryland areas in which smallholders are more prone to droughts, not only because of climatic conditions but also because of characteristics of the people living there as well as other conditions like distance to markets, soil quality and the like. An impact analysis will forecast the number of people that may be affected by things such as hunger, death and migration, if drought conditions in these drylands were to change.
In recent decades, vulnerability analysis has evolved from diverse disciplines that analyse risks and hazards, food security and climate change. It has also seen a development towards an integrated analysis of human-environment systems – bringing vulnerability analysis from natural and social sciences perspectives together in common frameworks. Although there are differences in the use of terminology, most analytic vulnerability frameworks distinguish between three components: exposure, sensitivity, and coping and adaptation. When the system – defined as community or individuals – is exposed to stresses, exposure refers to the external stresses, which can be caused by extreme hazardous events such as flooding. These hazardous events can also change in magnitude and intensity as a consequence of climate change. External stresses can also be caused by socioeconomic events and processes such as an economic collapse – similar to the current financial crisis, or price changes of commodities, like what occurred in 2008 with food prices.
Sensitivity determines the extent to which the human-environment system is susceptible to exposure to that external stress. Examples of that would be entitlement to common lands or proximity of an environmental threat such as a floodplain. Coping and adaptive capacity determines the potential or ability to adapt and recover from the impact of external stresses. It also depends on factors such as the level of education, the availability of insurance, and access to other types of resources.
A methodology for analysing patterns of vulnerability
2
Quantitative analysis of patterns of vulnerability to global environmental change 16
Finally, it is important to emphasize that factors determining vulnerability operate across different temporal and spatial scales. They can be global and take place over a longer time period, which is the case with climate change. They can also take place during a relatively short time scale, as with a hurricane and occur at local or individual levels such as with a lack of entitlement.
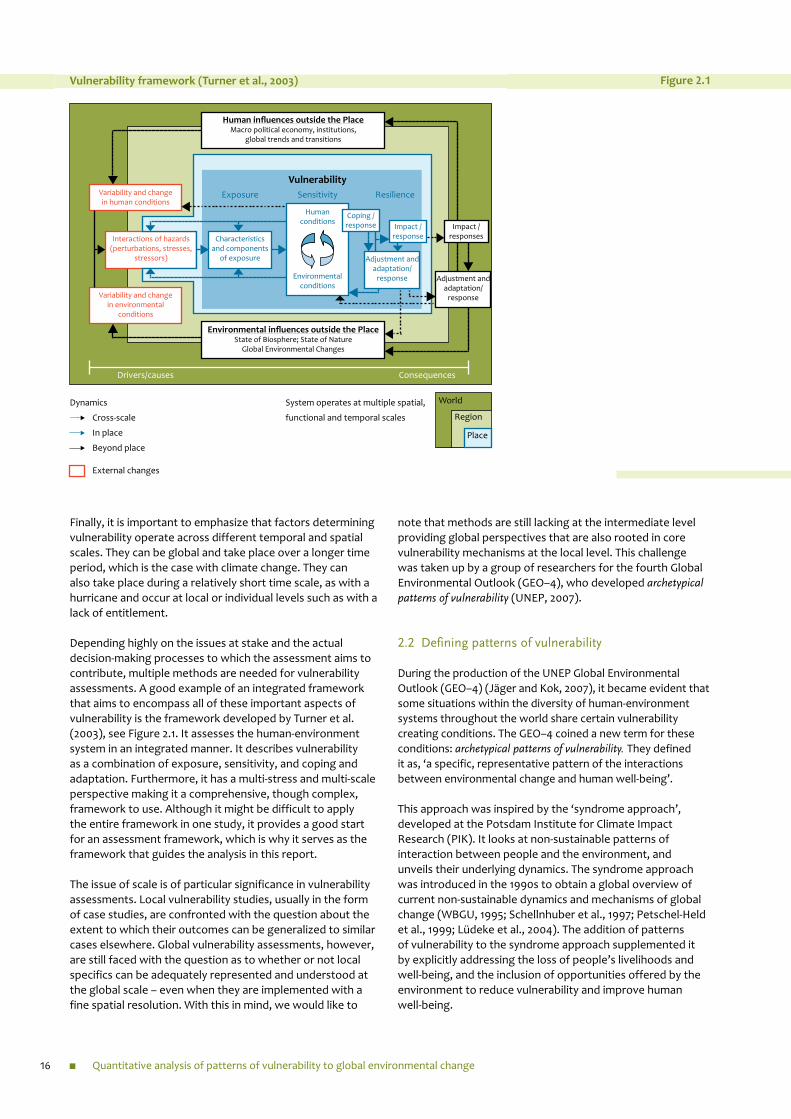
Depending highly on the issues at stake and the actual decision-making processes to which the assessment aims to contribute, multiple methods are needed for vulnerability assessments. A good example of an integrated framework that aims to encompass all of these important aspects of vulnerability is the framework developed by Turner et al. (2003), see Figure 2.1. It assesses the human-environment system in an integrated manner. It describes vulnerability as a combination of exposure, sensitivity, and coping and adaptation. Furthermore, it has a multi-stress and multi-scale perspective making it a comprehensive, though complex, framework to use. Although it might be difficult to apply the entire framework in one study, it provides a good start for an assessment framework, which is why it serves as the framework that guides the analysis in this report.
The issue of scale is of particular significance in vulnerability assessments. Local vulnerability studies, usually in the form of case studies, are confronted with the question about the extent to which their outcomes can be generalized to similar cases elsewhere. Global vulnerability assessments, however, are still faced with the question as to whether or not local specifics can be adequately represented and understood at the global scale – even when they are implemented with a fine spatial resolution. With this in mind, we would like to
note that methods are still lacking at the intermediate level providing global perspectives that are also rooted in core vulnerability mechanisms at the local level. This challenge was taken up by a group of researchers for the fourth Global Environmental Outlook (GEO–4), who developed archetypical patterns of vulnerability (UNEP, 2007).
2.2 Defining patterns of vulnerability
During the production of the UNEP Global Environmental Outlook (GEO–4) (Jäger and Kok, 2007), it became evident that some situations within the diversity of human-environment systems throughout the world share certain vulnerability creating conditions. The GEO–4 coined a new term for these conditions: archetypical patterns of vulnerability. They defined it as, ‘a specific, representative pattern of the interactions between environmental change and human well-being’.
This approach was inspired by the ‘syndrome approach’, developed at the Potsdam Institute for Climate Impact Research (PIK). It looks at non-sustainable patterns of interaction between people and the environment, and unveils their underlying dynamics. The syndrome approach was introduced in the 1990s to obtain a global overview of current non-sustainable dynamics and mechanisms of global change (WBGU, 1995; Schellnhuber et al., 1997; Petschel-Held et al., 1999; Lüdeke et al., 2004). The addition of patterns of vulnerability to the syndrome approach supplemented it by explicitly addressing the loss of people’s livelihoods and well-being, and the inclusion of opportunities offered by the environment to reduce vulnerability and improve human well-being.
Figure 2.1Vulnerability framework (Turner et al., 2003)
System operates at multiple spatial,
functional and temporal scales
Drivers/causes Consequences
World
Region
Place
Human influences outside the PlaceMacro political economy, institutions,
global trends and transitions
Environmental influences outside the PlaceState of Biosphere; State of Nature
Global Environmental Changes
Variability and changein human conditions
Exposure Sensitivity Resilience
Interactions of hazards(perturbations, stresses,
stressors)
Characteristicsand components
of exposure
Humanconditions
Environmentalconditions
Coping /response Impact /
responseImpact /
responses
Adjustment andadaptation/
response Adjustment andadaptation/
responseVariability and changein environmental
conditions
Dynamics
Cross-scale
In place
Beyond place
Vulnerability
External changes
A methodology for analysing patterns of vulnerability 17
A pattern of vulnerability does not provide the description of only one situation but rather it focuses on the most important common properties of a multitude of cases that are in that sense ‘archetypical’ and constitute a pattern of vulnerability. In this way, archetypical patterns of vulnerability simplify real situations in order to show the basic mechanisms whereby vulnerability is produced within a context of multiple stressors. The term ‘archetypical patterns of vulnerability’ will hereafter be referred to as ‘patterns of vulnerability’. Analyzing patterns of vulnerability helps bridge the scale problems between local and global vulnerability analysis.
2.3 An approach for analyzing patterns of vulnerability
We used the framework of Turner at al. (2003) to determine the questions that need to be answered in analysing a pattern of vulnerability. We identify specific exposures in similar situations to specific population groups, their sensitivity and possible coping and adaptation mechanisms in a specific situation at various levels of decision making (cf. Turner et al., 2003):1. What are the main exposures, key vulnerable groups
and their sensitivities that together define the pattern of vulnerability?
2. What are the basic vulnerability creating mechanisms that constitute this pattern of vulnerability?
3. In what form and where does this pattern manifest itself?4. How can future changes within the human-environment
system affect the human well-being situation for the vulnerable groups?
5. What are the opportunities – individual responses or policy responses – to cope with and adapt to future changes?
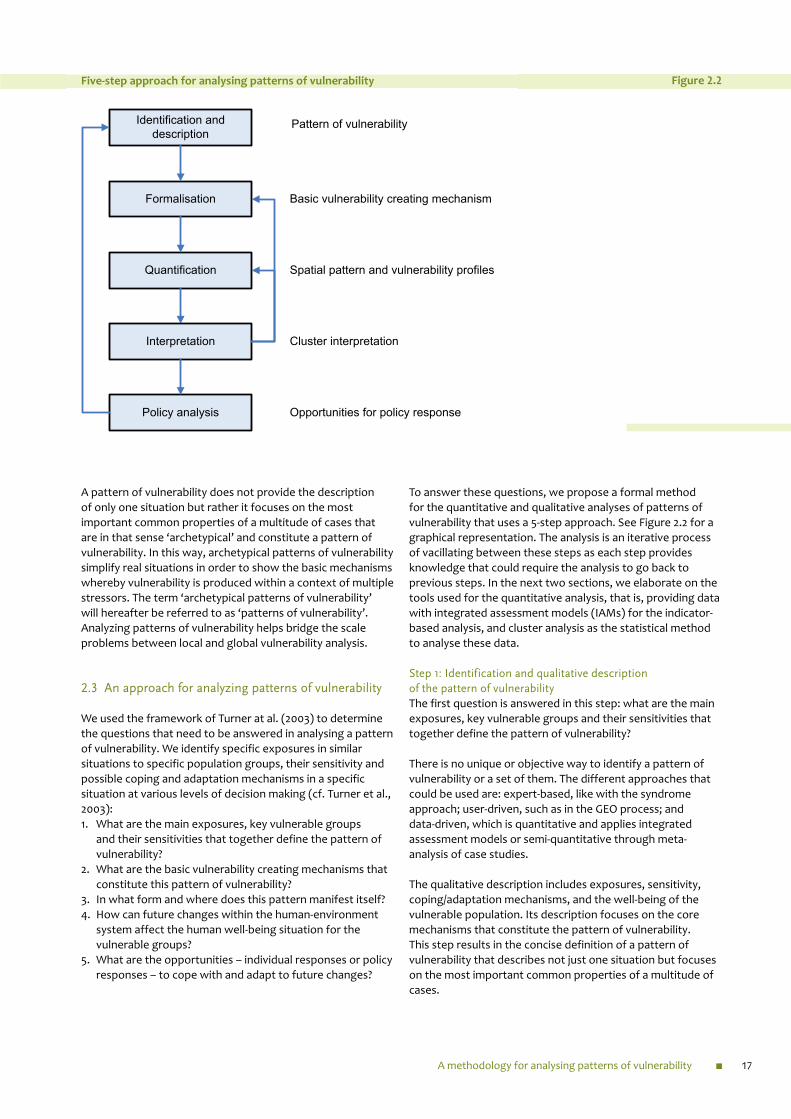
To answer these questions, we propose a formal method for the quantitative and qualitative analyses of patterns of vulnerability that uses a 5-step approach. See Figure 2.2 for a graphical representation. The analysis is an iterative process of vacillating between these steps as each step provides knowledge that could require the analysis to go back to previous steps. In the next two sections, we elaborate on the tools used for the quantitative analysis, that is, providing data with integrated assessment models (IAMs) for the indicator-based analysis, and cluster analysis as the statistical method to analyse these data.
Step 1: Identification and qualitative description of the pattern of vulnerabilityThe first question is answered in this step: what are the main exposures, key vulnerable groups and their sensitivities that together define the pattern of vulnerability?
There is no unique or objective way to identify a pattern of vulnerability or a set of them. The different approaches that could be used are: expert-based, like with the syndrome approach; user-driven, such as in the GEO process; and data-driven, which is quantitative and applies integrated assessment models or semi-quantitative through meta-analysis of case studies.
The qualitative description includes exposures, sensitivity, coping/adaptation mechanisms, and the well-being of the vulnerable population. Its description focuses on the core mechanisms that constitute the pattern of vulnerability. This step results in the concise definition of a pattern of vulnerability that describes not just one situation but focuses on the most important common properties of a multitude of cases.
Figure 2.2Five-step approach for analysing patterns of vulnerability
Identification and description
Formalisation
Quantification
Policy analysis
Interpretation
Pattern of vulnerability
Basic vulnerability creating mechanism
Spatial pattern and vulnerability profiles
Opportunities for policy response
Cluster interpretation
Quantitative analysis of patterns of vulnerability to global environmental change 18
Step 2: Formalisation of the pattern of vulnerabilityIn this step, building on the qualitative description of the pattern of vulnerability, the second question is answered: what are the basic vulnerability creating mechanisms that constitute this pattern of vulnerability?
This step focuses on formalising the pattern of vulnerability. Complex realities captured in the description of a pattern of vulnerability in the previous step need to be reduced to the basic mechanisms that allow one to speak from a recurrent pattern of vulnerability across many places.
To do this, we start by developing an influence diagram that encompasses all relevant dynamics and reduce it further in a next step to a simple influence diagram that only includes the most relevant vulnerability creating elements and their interactions.
This step results in a graphic representation of the basic vulnerability creating mechanisms that is labelled an ‘influence diagram’ (see for example Figure 3.2).
Step 3: Quantitative analysis to show how a pattern of vulnerability manifests itselfThis step focuses on answering the third question: in what form and where does this pattern manifest itself?
To be able to quantitatively answer this question, indicators are selected as proxies for the most important elements and dynamics of the vulnerability creating mechanisms (see Figure 3.2). In principle, the indicators can be taken from all kinds of sources. Because this project intends to analyse possible future scenarios, indicators about the future situation preferably need to be acquired in an integrated way. To meet this need, the indicators are taken from the PBL Integrated Assessment Models (IAMs, see Section 2.4), the GISMO model (Hilderink and Lucas, 2008) and the IMAGE framework (MNP, 2006). When working with global datasets on a gridded scale, typically a mask is used to select specific data points, for example, those data points that meet the already predetermined definition of ‘drylands’. The internal consistency of the acquired indicator set allows us to also use the outcomes of these models regarding future situations for analysing the consequences of international policies that target vulnerable groups.
To further answer the third question of how this pattern of vulnerability manifests itself, the selected indicators are subjected to a cluster analysis. When the availability to prior information on the inherent structure of data, for example indicator data, is absent or minimal, cluster analysis is a general methodology to explore such datasets. It groups data into classes – groups or clusters – that share similar characteristics. Cluster analysis involves a number of steps that are explained further in Section 2.5. Cluster analysis distinguishes specific constellations, or clusters, of indicator values that help us to further unpack the pattern of vulnerability and show the different forms in which a pattern of vulnerability manifests itself.
This step results in two outcomes that characterise the pattern of vulnerability: (1) a specific constellation of
indicators that we label ‘vulnerability profile’; and (2) a map that shows where a specific vulnerability profile is present, as with ‘spatial distribution’ (see Figure 2.8 and Figure 2.9).
Step 4: Interpretation and ground-truthingBuilding on the vulnerability profiles and spatial distribution obtained in the previous step, the fourth question will be answered: how can future changes within the human-environment system affect the human well-being situation for the vulnerable groups?
First, the outcomes of the quantitative analysis need to be interpreted. The vulnerability profiles describe the most important positive and negative determinants that shape the specific manifestations of the pattern of vulnerability. The spatial distribution describes where the different manifestations can be found. Interpretation therefore addresses what drives the vulnerability in a specific manifestation, the differences with other manifestations, and the locations with similar manifestations. Interpretation can also address the possible future risks within a specific manifestation and its link to other manifestations. However, this is more of a qualitative nature.
To validate the interpretation described above, the analysis needs to be complemented with ‘on the ground’ information. This can be done by comparing these outcomes with a meta-analysis of case studies or with numerous detailed case studies. We refer to this part of the analysis as ‘ground-truthing’, that is, relating the quantitative analysis to information that is collected on the ground. This step will add meaning and detail to the quantitative analysis and helps to link the global analysis to the local reality.
This step results in a qualitative description of the quantitative outcomes of the previous step, complemented with insights from case studies and it results in a validation of its outcomes.
Step 5: Analysis of response optionsPatterns of vulnerability are identified on the basis of present observations. This raises questions about the extent to which these patterns will persist in future scenarios, and how this persistence will impact future policies and vice versa. With this step, the fifth question will be addressed: what are the opportunities – individual responses or policy responses – to cope and adapt to future changes? Policy responses to cope with and adapt to changes can be in and beyond the environmental policy domain and on the local, sub-national, national, and supra-national scale.
Specific policy interventions can be identified and analysed in this step to see if they help to reduce the vulnerability. This can be done (1) based on specific vulnerability profiles that provide guidance to adaptation policies in similar situations because these point at specific characteristics of the system that need to be taken into account. Again, note that this would require further work on the ground to connect this analysis to local situations, and (2) by addressing the consequences of international policies for vulnerable groups.
Guidelines for adaptation policies do not typically result from model-analyses. The consequences of international policies
A methodology for analysing patterns of vulnerability 19
for vulnerable groups, however, can be analysed using global integrated assessment models. This would require extending the cluster analysis into the future by using data from integrated assessment models. This step is beyond the scope of this report.
This fifth step results in opportunities for adaptation policies and consequences of national policies and international policies for vulnerable groups.
2.4 Analysing patterns of vulnerability with integrated assessment models
The patterns of vulnerability are quantified by indicators that are proxy variables for the elements and processes of the core vulnerability creating mechanisms. The core mechanisms (as represented in the influence diagram, see e.g. Figure 3.2 in the next chapter) describe the most important interactions and processes that constitute the pattern of vulnerability, including environmental, economic and social developments – along with their implications for human well-being.
In principle, indicators for the analysis of the current situation could be taken from various sources. However, in order to assess future developments for a specific pattern of vulnerability, the indicators need to be projected in a consistent way; their relevant interactions need to be taken into account. Integrated Assessment Models (IAMs) are valuable tools here, as they integrate the insights from multiple disciplines into interlinked cause-effect relationships. IAMs are computer simulation models in which knowledge from many different disciplines is combined in a system-dynamic computational framework to analyze the problem at hand in an integrated fashion (Van der Sluijs, 2002). Among other things, IAMs can be used for scenario analysis and ex-ante evaluation of the environmental, economic and social consequences of alternative policy strategies. Within IAMs, both the natural system and the socioeconomic system are simulated.
In our analysis, we use indicators from the IMAGE framework (Integrated Model to Assess the Global Environment) and the GISMO model (Global Integrated Sustainability MOdel); both of which were developed by the Netherlands Environmental Assessment Agency (PBL). The IMAGE model is a dynamic integrated assessment modelling framework with a comprehensive coverage of global change issues from an environmental perspective (MNP, 2006). The model was originally developed to assess the impacts of anthropogenic climate change; however, it has recently been expanded to a more comprehensive coverage of global change issues from an environmental perspective such as climate impacts, land degradation, water stress, biodiversity, and water and air pollution. As part of the IMAGE framework, the model includes the energy system simulation model TIMER and the biodiversity impact model GLOBIO (Alkemade et al., 2009). The GISMO model operationalizes the concept of sustainable development by interlinking global environmental change and human development (Hilderink and Lucas, 2008). It addresses quality of life as a result of changes in the three sustainability
domains – people, planet and profit – and it links to the IMAGE framework.
Clearly, in order to describe the future developments, the selected models limit the number of possible indicators. Not all indicators are included in the models. Therefore, an ‘ideal’ set of indicators that reflect the basic mechanisms in a pattern of vulnerability can be compared with available or feasible indicators from the IAMs – where applicable, alternatives or proxies are selected. When specific indicators do not change over time, they could also be used from other sources. Furthermore, core indicators from the social and institutional domains are very difficult to derive from formal models. Moreover, on the global level, there is a general lack of data for these kinds of indicators. This poses challenges for the development of IAMs. However, this also confirms the need to combine quantitative and qualitative methods for a complete analysis of patterns of vulnerability.
In general, IAMs do not account for short-term changes; they address long-term trends. Therefore, they are more suitable for analysing changing vulnerability due to slow-changing dynamics than they are for analysing the impacts of extreme events or other short term shocks. Also, thresholds are generally not included in IAMs. This will limit the vulnerabilities that can be addressed with our methodology.
Location-specific information is needed to take into account the crucial parameters that determine actual vulnerability that can vary across very short distances. Therefore, the spatial resolution for all indicators is set at a grid scale of 0.5 by 0.5 degrees. Even though from a local perspective this is still very crude, from a global data perspective this is already quite a challenge. The desired spatial detail is not always represented in the global IAMs. Both, the IMAGE framework and the GISMO model include socioeconomic developments on a largely aggregated scale, typically distinguishing 24 to 27 world regions. Some data on desired spatial resolution is available for the current situation, whereas specific ‘downscaling’ procedures have been developed to address future developments of these indicators (see for example Van Vuuren et al., 2005). When data at the country level are only available on a crude scale, and no proxy or method is available to downscale this data, all grid cells within this country are given the same value. Examples of this are per capita income and governance effectiveness.
2.5 Cluster analysis and interpretation
To assess how and where the patterns of vulnerability manifest themselves, the methodology of cluster analysis is used on the acquired gridded or local scale data (see Section 2.4). For a more detailed elaboration of the cluster analysis methodology used, refer to Walther et al. (2011).
When the availability of prior information on a dataset’s inherent structure is absent or minimal, then a cluster analysis is an appropriate method to explore the data, which in our study consists of a collection of indicator data. A cluster analysis categorizes data into classes – groups or clusters – that share similar characteristics. A broad collection of
Quantitative analysis of patterns of vulnerability to global environmental change 20
clustering methods has been proposed for statistics, data mining, machine learning, and bio informatics. During the past decade, many textbooks and overview papers have illustrated the wide variety of methods and the revived interest in this field due to the growing availability of computer power for analysing extensive datasets (cf. Kaufman and Rousseeuw, 1990; Everitt et al., 2001; Xu and Wunsch II, 2008).
The indicator-dataset subjected to the clustering process that we perform will be considered as a collection of points in a multidimensional space where the number of dimensions equals the number of indicators. Spatial and/or temporal aspects are not explicitly considered ab initio in the employed clustering process, as is the case in more dedicated forms of spatial/temporal clustering, but rather, they are expected to show up automatically in the obtained results. Clustering an indicator-dataset referring to the year 2000 will result in a spatial depiction of the clustered grids on the globe for the year 2000, while a similar cluster analysis for a dataset for the year 2010 renders another clustering on the globe for that year.
Setting up and performing a cluster analysis of the indicator-dataset will typically involve the following steps:
1. Data pre-treatmentIn general, data pre-treatment concerns, next to checks on data-quality (involving aspects as accuracy, completeness, representativity, consistency, timeliness, traceability etc.), dealing with missing values and outliers and applying data transformations to bring the data values to a more even scale. These forms of data-processing can influence the outcomes of the clustering to a large extent, and should therefore be chosen with due consideration (e.g. Milligan and Cooper., 1988; Gnanadesikan et al., 2007). Typically, the choice of the indicators has already involved a form of pre-processing of the underlying base-data. Additionally, an optional upper bounding or lower bounding of data values can be applied to deal with outlying indicator values, replacing all data values that exceed these bounds by the values of these bounds: (a form of ‘Winsorization’ of the data, Tukey, 1962). A further pre-processing of the indicator data is performed to unify the measurement scale for all indicators, typically by applying a min-max normalization that rescales the data to values between zero (0) and one (1), with 0 referring to the minimum of the dataset and 1 to its maximum.
2. Selection of clustering methodThere are many methods available to perform a cluster analysis. Here, we applied the well-established partitioning method for clustering using the k-means algorithm. Partitioning methods perform the clustering by dividing the data set into a pre-specified number of clusters on the basis of an iterative minimization of some criterion that expresses the distances between the data points and prototypical elements or cluster centroids. Typically, the popular k-means algorithm proposed by MacQueen (1967) is used to perform this partitioning. See Figure 2.3 where the following steps (a) through (d) are illustrated. It starts with k initial cluster centroids (a). The data points are then assigned to the nearest centroid (b) by applying Euclidean distance to express the nearness of data points. Subsequently, the new centre
is determined as the average of all points within the cluster and again all points are re-assigned to their nearest centroid (c). This procedure is repeated until points no longer change position (d). The outcomes are sensitive for the initialisation of the search process. In our analyses we have used an initialisation strategy on the basis of ‘hierarchical clustering’, applying Ward’s method on a small random subset of the large dataset, as proposed by Milligan (1980).
3. Performing clustering Clustering involves parameterization of the selected clustering algorithm, such as choosing appropriate starting points for the partitioning method and optionally applying a weighting for the variables to be clustered. It also involves determining the number of clusters and computing the resulting clustering for these settings. Determining the number of clusters is an especially important issue. We established a procedure based on a notion of cluster-stability (Ben-Hur et al., 2002; Dudoit and Fridlyand, 2002; Lange et al., 2003) which suggests that the resulting clustering should ideally be stable/robust when repeating the clustering under different starting conditions and under perturbation or resampling of the data. In fact, we repeatedly compared two clusterings performed with random start-settings – resamplings, and counted the number of data points that were assigned to the same cluster in these two clusterings, that is, the ‘stable points’. In this way, we determined an estimate of the fraction of datapoints that were clustered similarly when the clustering was repeated with a random restart. We expressed this in a so-called consistency graph, which displays the average fraction of datapoints that are clustered similarly under resampling, as a function of the number of clusters k that runs as such: k = 2, k = 3, ..., kmax. The value of k, for which this graph is optimal refers to the most stable/robust result and indicates a suitable choice for the number of clusters. Figure 2.4 shows that in addition to the global optimum at k = 3, there is an interesting local optimum at k = 8, suggesting that eight clusters is a suitable number of clusters.
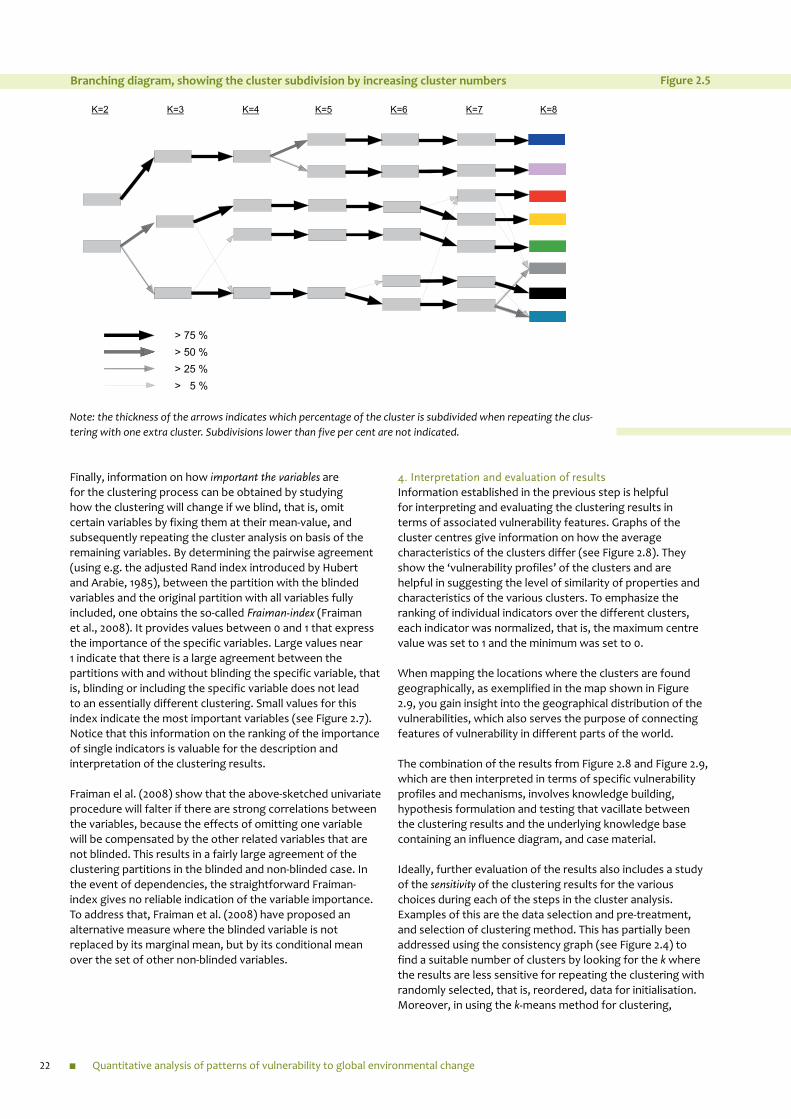
In cases where the consistency graph does not give a very convincing local optimum, one can try various numbers of k to obtain insight into which number of k to choose as an adequate number of clusters. In this case, the branching diagram in Figure 2.5 renders useful information. It displays how the clustering structure changes when using another number of clusters, indicating which of the clusters split when increasing the k and which ones merge when decreasing the k. This is how to obtain useful information on the relatedness of the clusters for various numbers of k, and the appropriateness of choosing a specific level of detail – differentiation in the clustering can be judged more objectively.
Having obtained a specific clustering for a suitable k, such as by using the k-means clustering method with appropriate initialisation, the issue is now: ‘how to describe and characterise the obtained cluster partition’. The most straightforward step is to indicate the number of datapoints per cluster and to describe the cluster centres, that is, the average values of the variables, that is, indicators for all the points in the respective clusters. The latter information displays the ‘vulnerability

A methodology for analysing patterns of vulnerability 21
profiles’ that will be discussed in the next section, Interpretation and evaluation of results.
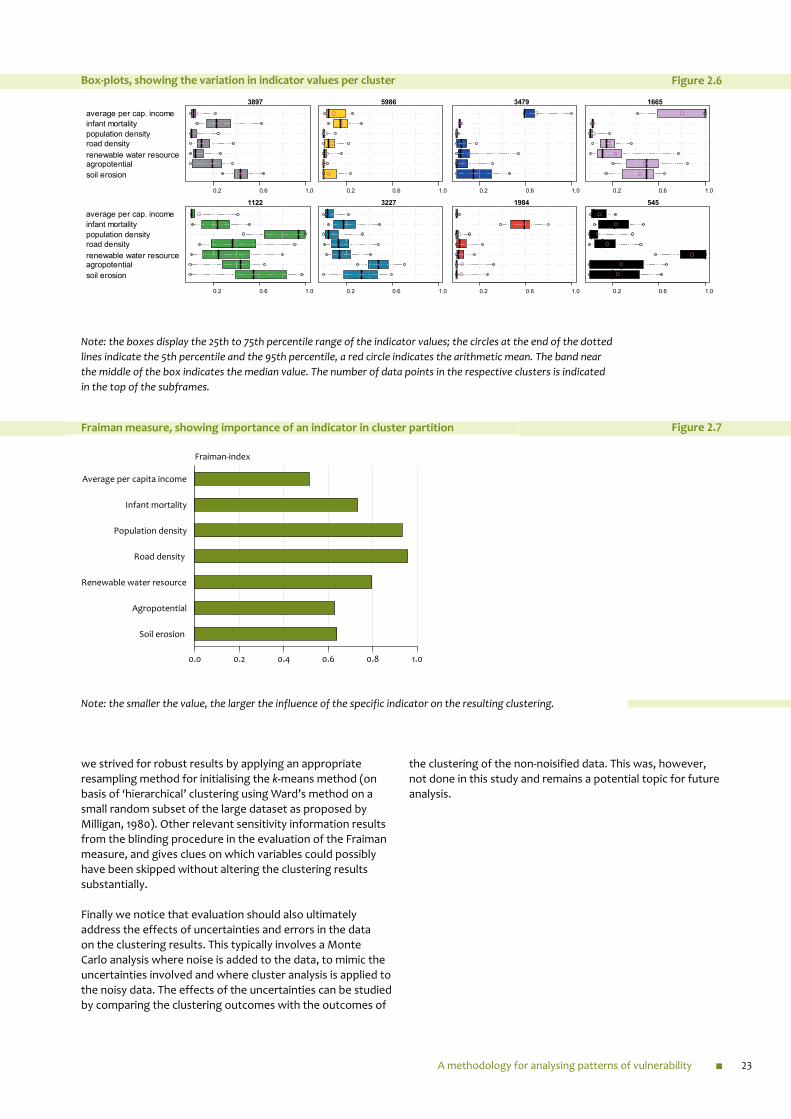
As a supplement to this, it is also useful to give information on the internal variation of the variables within the various clusters. This information can be helpful in characterising and interpreting these clusters in terms of specific features of the variables considered. Box-plots of the variables for the respective clusters serve this purpose (see Figure 2.6). In a box-plot, the cluster centre is indicated by a circle, and the spread around this centre is indicated by the box-boundaries that denote the lower and upper quartiles (the 25th and 75th percentiles) of the data; thus, the box-length indicates the interquartile distance (IQR). The band near the middle of the
box denotes the median. Typically, box-plots are extended by whiskers denoting the minimum or maximum data values within 1.5xIQR of the lower and upper quartile. But, since we are specifically interested in high and low end percentiles, and in highlighting potential asymmetry of the distribution, we chose to work with alternative whiskers, and indicate them by the ends of the dotted lines that show the 5th and 95th percentiles. So, 90 per cent of the objects within a cluster are located between these two points. Notice that the box-plots for the clusters only display one-dimensional information, as projected on the individual axes associated to the various variables. Information on the specific spatial structure of the cluster of points in the multidimensional data space, spanned by all variables considered, does not show up in the box-plot.
Figure 2.3K-means iterative cluster partitioning
(c) (d)
(a) (b)
Note: The vertical axis indicates the average fraction of datapoints that will cluster similarly when repeating the clustering with another (random) starting point.
Figure 2.4
0 2 4 6 8 10 12 14 16# clusters
0,70
0,75
0,80
0,85
0,90
0,95
1,00
1,05Average consistency
Consistency graph for determining the optimum number of clusters
Quantitative analysis of patterns of vulnerability to global environmental change 22
Finally, information on how important the variables are for the clustering process can be obtained by studying how the clustering will change if we blind, that is, omit certain variables by fixing them at their mean-value, and subsequently repeating the cluster analysis on basis of the remaining variables. By determining the pairwise agreement (using e.g. the adjusted Rand index introduced by Hubert and Arabie, 1985), between the partition with the blinded variables and the original partition with all variables fully included, one obtains the so-called Fraiman-index (Fraiman et al., 2008). It provides values between 0 and 1 that express the importance of the specific variables. Large values near 1 indicate that there is a large agreement between the partitions with and without blinding the specific variable, that is, blinding or including the specific variable does not lead to an essentially different clustering. Small values for this index indicate the most important variables (see Figure 2.7). Notice that this information on the ranking of the importance of single indicators is valuable for the description and interpretation of the clustering results.
Fraiman el al. (2008) show that the above-sketched univariate procedure will falter if there are strong correlations between the variables, because the effects of omitting one variable will be compensated by the other related variables that are not blinded. This results in a fairly large agreement of the clustering partitions in the blinded and non-blinded case. In the event of dependencies, the straightforward Fraiman-index gives no reliable indication of the variable importance. To address that, Fraiman et al. (2008) have proposed an alternative measure where the blinded variable is not replaced by its marginal mean, but by its conditional mean over the set of other non-blinded variables.
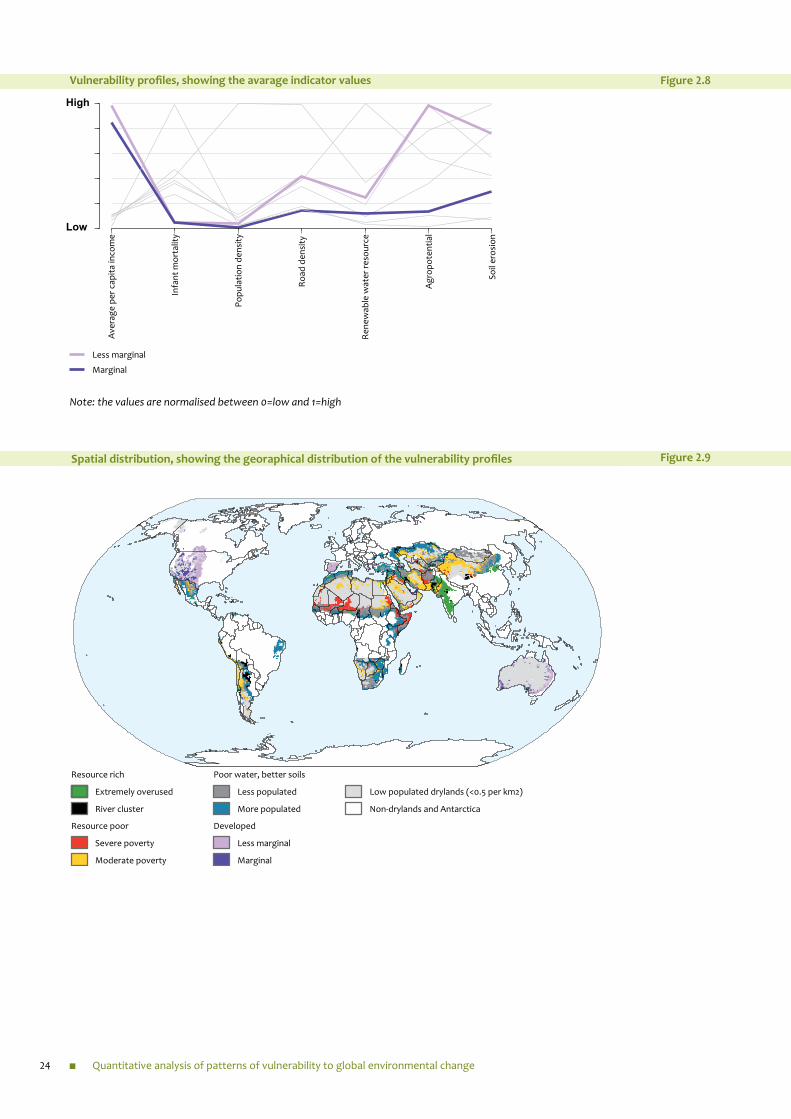
4. Interpretation and evaluation of resultsInformation established in the previous step is helpful for interpreting and evaluating the clustering results in terms of associated vulnerability features. Graphs of the cluster centres give information on how the average characteristics of the clusters differ (see Figure 2.8). They show the ‘vulnerability profiles’ of the clusters and are helpful in suggesting the level of similarity of properties and characteristics of the various clusters. To emphasize the ranking of individual indicators over the different clusters, each indicator was normalized, that is, the maximum centre value was set to 1 and the minimum was set to 0.
When mapping the locations where the clusters are found geographically, as exemplified in the map shown in Figure 2.9, you gain insight into the geographical distribution of the vulnerabilities, which also serves the purpose of connecting features of vulnerability in different parts of the world.
The combination of the results from Figure 2.8 and Figure 2.9, which are then interpreted in terms of specific vulnerability profiles and mechanisms, involves knowledge building, hypothesis formulation and testing that vacillate between the clustering results and the underlying knowledge base containing an influence diagram, and case material.
Ideally, further evaluation of the results also includes a study of the sensitivity of the clustering results for the various choices during each of the steps in the cluster analysis. Examples of this are the data selection and pre-treatment, and selection of clustering method. This has partially been addressed using the consistency graph (see Figure 2.4) to find a suitable number of clusters by looking for the k where the results are less sensitive for repeating the clustering with randomly selected, that is, reordered, data for initialisation. Moreover, in using the k-means method for clustering,
Note: the thickness of the arrows indicates which percentage of the cluster is subdivided when repeating the clus-tering with one extra cluster. Subdivisions lower than five per cent are not indicated.
Figure 2.5Branching diagram, showing the cluster subdivision by increasing cluster numbers
A methodology for analysing patterns of vulnerability 23
we strived for robust results by applying an appropriate resampling method for initialising the k-means method (on basis of ‘hierarchical’ clustering using Ward’s method on a small random subset of the large dataset as proposed by Milligan, 1980). Other relevant sensitivity information results from the blinding procedure in the evaluation of the Fraiman measure, and gives clues on which variables could possibly have been skipped without altering the clustering results substantially.
Finally we notice that evaluation should also ultimately address the effects of uncertainties and errors in the data on the clustering results. This typically involves a Monte Carlo analysis where noise is added to the data, to mimic the uncertainties involved and where cluster analysis is applied to the noisy data. The effects of the uncertainties can be studied by comparing the clustering outcomes with the outcomes of
the clustering of the non-noisified data. This was, however, not done in this study and remains a potential topic for future analysis.
Note: the boxes display the 25th to 75th percentile range of the indicator values; the circles at the end of the dotted lines indicate the 5th percentile and the 95th percentile, a red circle indicates the arithmetic mean. The band near the middle of the box indicates the median value. The number of data points in the respective clusters is indicated in the top of the subframes.
Figure 2.6Box-plots, showing the variation in indicator values per cluster
3897
0.2 0.6 1.0
5986
0.2 0.6 1.0
3479
0.2 0.6 1.0
1665
0.2 0.6 1.0
1122
0.2 0.6 1.0
3227
0.2 0.6 1.0
1984
0.2 0.6 1.0
545
0.2 0.6 1.0
soil erosionagropotentialrenewable water resourceroad densitypopulation densityinfant mortalityaverage per cap. income
soil erosionagropotentialrenewable water resourceroad densitypopulation densityinfant mortalityaverage per cap. income
Note: the smaller the value, the larger the influence of the specific indicator on the resulting clustering.
Figure 2.7
Average per capita income
Infant mortality
Population density
Road density
Renewable water resource
Agropotential
Soil erosion
Fraiman-index
0.0 0.2 0.4 0.6 0.8 1.0
Fraiman measure, showing importance of an indicator in cluster partition
Quantitative analysis of patterns of vulnerability to global environmental change 24
Note: the values are normalised between 0=low and 1=high
Figure 2.8
Ave
rage
per
cap
ita in
com
e
Infa
nt m
orta
lity
Popu
latio
n de
nsity
Roa
d de
nsity
Ren
ewab
le w
ater
reso
urce
Agr
opot
entia
l
Soil
eros
ion
Less marginal
Marginal
Vulnerability profiles, showing the avarage indicator values
High
Low
Figure 2.9Spatial distribution, showing the georaphical distribution of the vulnerability profiles
Resource rich
Extremely overused
River cluster
Resource poor
Severe poverty
Moderate poverty
Poor water, better soils
Less populated
More populated
Developed
Less marginal
Marginal
Low populated drylands (<0.5 per km2)
Non-drylands and Antarctica
Vulnerability of smallholder farmers in drylands 25
In this chapter, we investigate the vulnerability of smallholder farmers in drylands. These farmers are mainly characterised as vulnerable because of the increased pressures placed on the available natural resources due to natural population growth or migration that eventually puts smallholder farmers into a poverty trap. Chapter 7 addresses this pattern of vulnerability in drylands in relation to violent conflicts.
3.1 Vulnerability creating mechanisms
Drylands are cultivated lands, scrublands, grasslands, savannas, semi-deserts, and true deserts that have low rainfall and high rates of evaporation. They occupy 41 per cent of Earth’s land mass and are home to more than two billion people. Half of all people living in poverty live in drylands and depend heavily on environmental services for their basic needs.
A majority of the countries in dryland areas have an average ratio of about 70 per cent of their labour force working in the agricultural sector and have a low Human Development Index (HDI) (UNDP, 2002). Agriculture in these dryland ecosystems is often dependent on sensitive low-quality soils, making people particularly vulnerable to land-use degradation and subsequent declining agricultural production. Global estimates suggest that about 70 per cent of all agricultural land in drylands is now degraded to some extent (WCED, 1987; Conacher and Sala, 1998; UNCCD, 2005)
One of the main transitions in dryland areas has been a substantial increase in land-use change over the past few hundred years, driven particularly by settlements and economic development (Richards, 1990). In addition, globally driven processes such as climate change and trade patterns have direct impacts on the well-being of dryland populations.
As a consequence of projected changes and changes already underway, dryland ecosystems and their human populations are now under increased threat. Simultaneously, the coping mechanisms of dryland households are breaking down. It is more difficult for them to buffer themselves against risk because achieving alternative livelihoods are hindered by issues such as social discrimination, political conditions, and detrimental trade impacts. It is estimated that about one
billion people in drylands are rural poor (Dobie, 2001). Infant mortality in drylands in developing countries averages about 54 children per 1000 live births, ten times that of industrialised countries. Importantly, the birth rate in such drylands is twice as high as that of other non-dryland regions in developing countries, constituting to a high population growth (MA, 2005).
Vulnerable dryland populations, especially smallholder farmers, are affected by biophysical and socioeconomic exposures. These exposures are above all characterised by the limited access to natural and economic resources such as the availability of water and the soil quality. In addition to this, their level of development and their restricted access to markets limit their ability to obtain knowledge and important agricultural inputs to enhance their agricultural productivity. The limited growing season impacts on the possibilities for on-farm and off-farm income earning. During the off-season when the availability of staple crops declines, food prices in the market rise, which pushes the coping capacity of poor and food insecure families to the limit. This process is exacerbated by lack of or ill-functioning infrastructure. Moreover, local opportunities are limited due to current governance, for example, poor market integration; and due to trade patterns affected by heavily subsidized competitors, leaving much dryland wealth concealed or poorly used.
The above-mentioned process constitutes missed opportunities for improving well-being. On the other hand, urban areas serving as interlinkages between dryland areas and non-dryland areas can play an important role for issues such as off-farm labour, worker remittances and trade (UNDP, 1997; Dobie, 2001; WRI, 2002; MA, 2005; Safriel et al., 2005). The most important elements and relations of the process described above are graphically represented in Figure 3.1
The vulnerability generating processes described so far are corroborated by the findings of Reynolds et al. (Reynolds et al., 2007), who identify the following five key variables important for the ‘Dryland Development Paradigm’ (DDP). For an interesting exploration of this framework concerning the impacts of droughts in Australia see Stafford Smith et al. (2007).
� Variable 1: High variability in rainfall: by definition drylands are in areas where precipitation is scarce and typically
Vulnerability of smallholder farmers in drylands
3
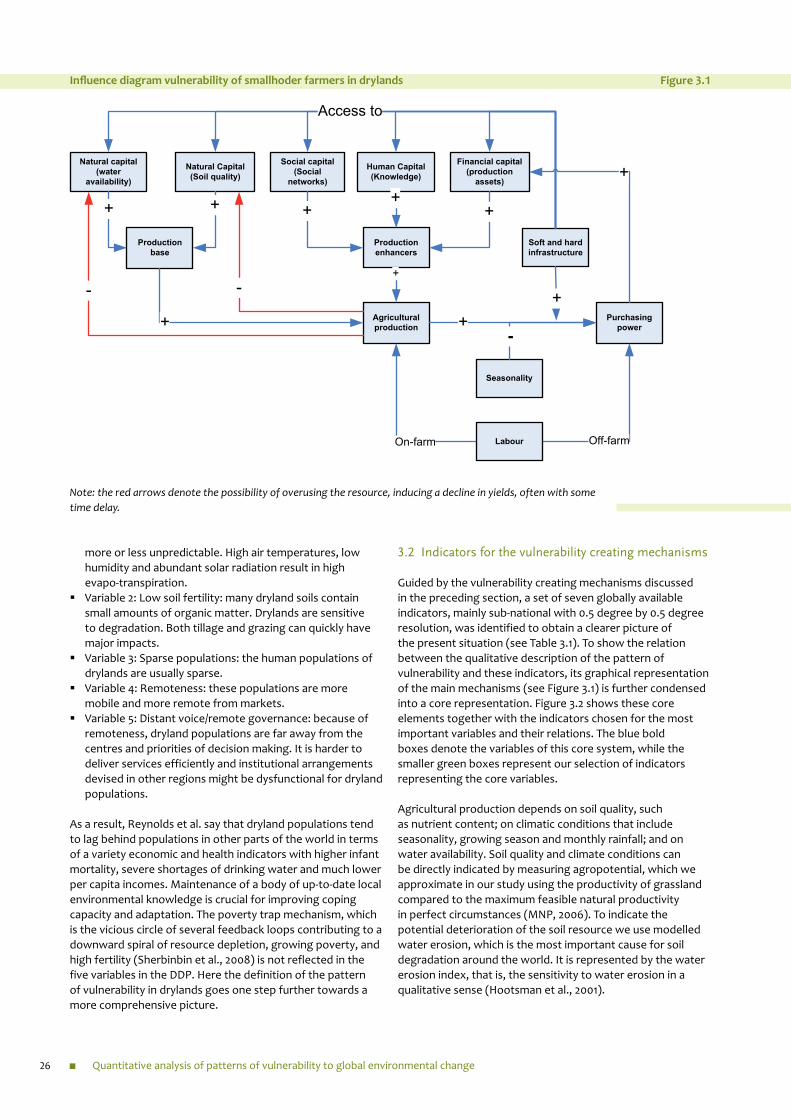
Quantitative analysis of patterns of vulnerability to global environmental change 26
more or less unpredictable. High air temperatures, low humidity and abundant solar radiation result in high evapo-transpiration.
� Variable 2: Low soil fertility: many dryland soils contain small amounts of organic matter. Drylands are sensitive to degradation. Both tillage and grazing can quickly have major impacts.
� Variable 3: Sparse populations: the human populations of drylands are usually sparse.
� Variable 4: Remoteness: these populations are more mobile and more remote from markets.
� Variable 5: Distant voice/remote governance: because of remoteness, dryland populations are far away from the centres and priorities of decision making. It is harder to deliver services efficiently and institutional arrangements devised in other regions might be dysfunctional for dryland populations.
As a result, Reynolds et al. say that dryland populations tend to lag behind populations in other parts of the world in terms of a variety economic and health indicators with higher infant mortality, severe shortages of drinking water and much lower per capita incomes. Maintenance of a body of up-to-date local environmental knowledge is crucial for improving coping capacity and adaptation. The poverty trap mechanism, which is the vicious circle of several feedback loops contributing to a downward spiral of resource depletion, growing poverty, and high fertility (Sherbinbin et al., 2008) is not reflected in the five variables in the DDP. Here the definition of the pattern of vulnerability in drylands goes one step further towards a more comprehensive picture.
3.2 Indicators for the vulnerability creating mechanisms
Guided by the vulnerability creating mechanisms discussed in the preceding section, a set of seven globally available indicators, mainly sub-national with 0.5 degree by 0.5 degree resolution, was identified to obtain a clearer picture of the present situation (see Table 3.1). To show the relation between the qualitative description of the pattern of vulnerability and these indicators, its graphical representation of the main mechanisms (see Figure 3.1) is further condensed into a core representation. Figure 3.2 shows these core elements together with the indicators chosen for the most important variables and their relations. The blue bold boxes denote the variables of this core system, while the smaller green boxes represent our selection of indicators representing the core variables.
Agricultural production depends on soil quality, such as nutrient content; on climatic conditions that include seasonality, growing season and monthly rainfall; and on water availability. Soil quality and climate conditions can be directly indicated by measuring agropotential, which we approximate in our study using the productivity of grassland compared to the maximum feasible natural productivity in perfect circumstances (MNP, 2006). To indicate the potential deterioration of the soil resource we use modelled water erosion, which is the most important cause for soil degradation around the world. It is represented by the water erosion index, that is, the sensitivity to water erosion in a qualitative sense (Hootsman et al., 2001).
Note: the red arrows denote the possibility of overusing the resource, inducing a decline in yields, often with some time delay.
Influence diagram vulnerability of smallhoder farmers in drylands
Purchasing power
Agricultural production +
+Natural capital
(water availability)
+
On-farm Off-farm
Soft and hard infrastructure
Natural Capital (Soil quality)
+
Productionenhancers
Productionbase
+
Financial capital (production
assets)
Human Capital (Knowledge)
Social capital (Social
networks)
++
+
+
Access to
+
Labour
Seasonality
-
--
Figure 3.1
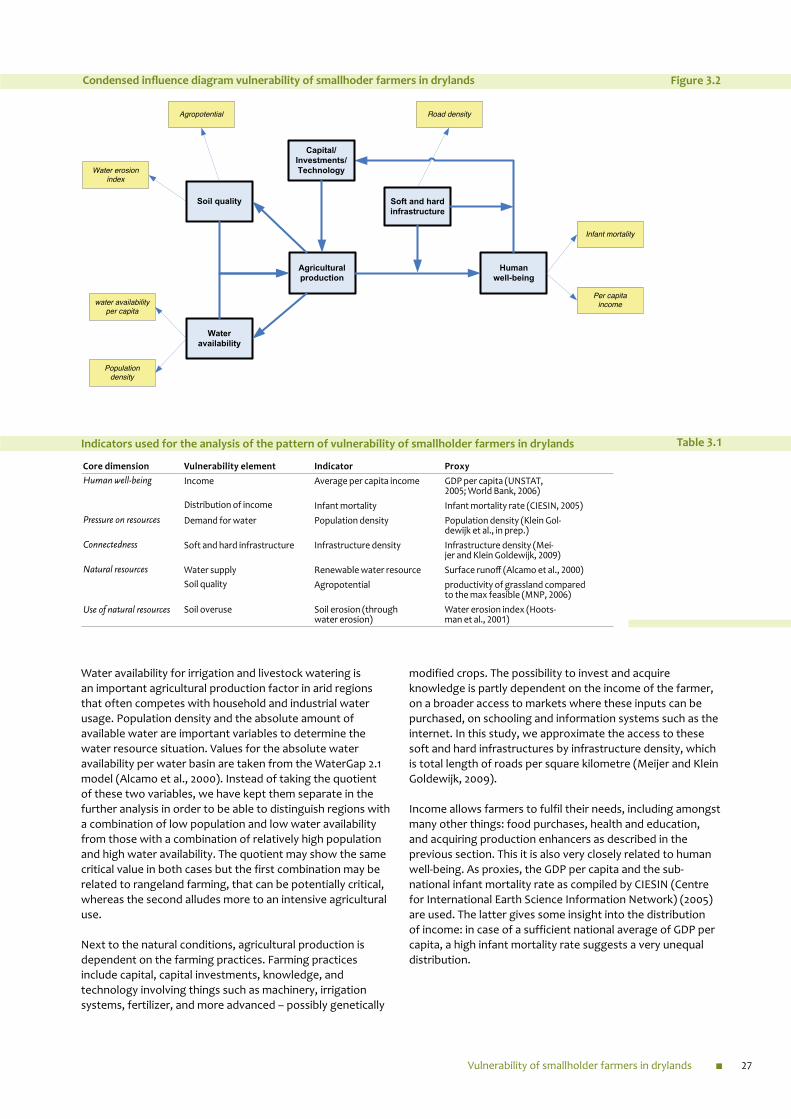
Vulnerability of smallholder farmers in drylands 27
Water availability for irrigation and livestock watering is an important agricultural production factor in arid regions that often competes with household and industrial water usage. Population density and the absolute amount of available water are important variables to determine the water resource situation. Values for the absolute water availability per water basin are taken from the WaterGap 2.1 model (Alcamo et al., 2000). Instead of taking the quotient of these two variables, we have kept them separate in the further analysis in order to be able to distinguish regions with a combination of low population and low water availability from those with a combination of relatively high population and high water availability. The quotient may show the same critical value in both cases but the first combination may be related to rangeland farming, that can be potentially critical, whereas the second alludes more to an intensive agricultural use.
Next to the natural conditions, agricultural production is dependent on the farming practices. Farming practices include capital, capital investments, knowledge, and technology involving things such as machinery, irrigation systems, fertilizer, and more advanced – possibly genetically
modified crops. The possibility to invest and acquire knowledge is partly dependent on the income of the farmer, on a broader access to markets where these inputs can be purchased, on schooling and information systems such as the internet. In this study, we approximate the access to these soft and hard infrastructures by infrastructure density, which is total length of roads per square kilometre (Meijer and Klein Goldewijk, 2009).
Income allows farmers to fulfil their needs, including amongst many other things: food purchases, health and education, and acquiring production enhancers as described in the previous section. This it is also very closely related to human well-being. As proxies, the GDP per capita and the sub-national infant mortality rate as compiled by CIESIN (Centre for International Earth Science Information Network) (2005) are used. The latter gives some insight into the distribution of income: in case of a sufficient national average of GDP per capita, a high infant mortality rate suggests a very unequal distribution.
Condensed influence diagram vulnerability of smallhoder farmers in drylands
Human well-being
Agricultural production
Agropotential
Infant mortality
Road density
Capital/Investments/Technology
Soil quality Soft and hard infrastructure
Wateravailability
water availability per capita
Water erosion index
Per capita income
Population density
Figure 3.2
Indicators used for the analysis of the pattern of vulnerability of smallholder farmers in drylands
Core dimension Vulnerability element Indicator ProxyHuman well-being Income Average per capita income GDP per capita (UNSTAT,
2005; World Bank, 2006)Distribution of income Infant mortality Infant mortality rate (CIESIN, 2005)
Pressure on resources Demand for water Population density Population density (Klein Gol-dewijk et al., in prep.)
Connectedness Soft and hard infrastructure Infrastructure density Infrastructure density (Mei-jer and Klein Goldewijk, 2009)
Natural resources Water supply Renewable water resource Surface runoff (Alcamo et al., 2000)Soil quality Agropotential productivity of grassland compared
to the max feasible (MNP, 2006)Use of natural resources Soil overuse Soil erosion (through
water erosion)Water erosion index (Hoots-man et al., 2001)
Table 3.1
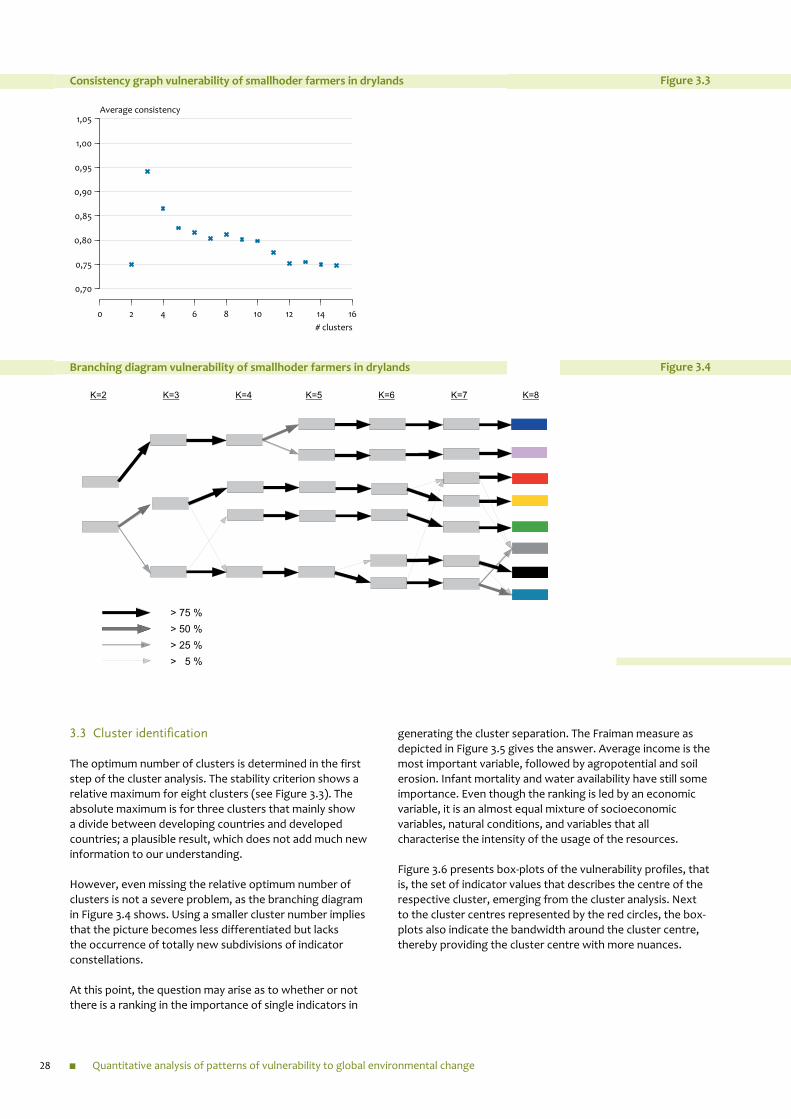
Quantitative analysis of patterns of vulnerability to global environmental change 28
3.3 Cluster identification
The optimum number of clusters is determined in the first step of the cluster analysis. The stability criterion shows a relative maximum for eight clusters (see Figure 3.3). The absolute maximum is for three clusters that mainly show a divide between developing countries and developed countries; a plausible result, which does not add much new information to our understanding.
However, even missing the relative optimum number of clusters is not a severe problem, as the branching diagram in Figure 3.4 shows. Using a smaller cluster number implies that the picture becomes less differentiated but lacks the occurrence of totally new subdivisions of indicator constellations.
At this point, the question may arise as to whether or not there is a ranking in the importance of single indicators in
generating the cluster separation. The Fraiman measure as depicted in Figure 3.5 gives the answer. Average income is the most important variable, followed by agropotential and soil erosion. Infant mortality and water availability have still some importance. Even though the ranking is led by an economic variable, it is an almost equal mixture of socioeconomic variables, natural conditions, and variables that all characterise the intensity of the usage of the resources.
Figure 3.6 presents box-plots of the vulnerability profiles, that is, the set of indicator values that describes the centre of the respective cluster, emerging from the cluster analysis. Next to the cluster centres represented by the red circles, the box-plots also indicate the bandwidth around the cluster centre, thereby providing the cluster centre with more nuances.
Figure 3.3
0 2 4 6 8 10 12 14 16# clusters
0,70
0,75
0,80
0,85
0,90
0,95
1,00
1,05Average consistency
Consistency graph vulnerability of smallhoder farmers in drylands
Figure 3.4Branching diagram vulnerability of smallhoder farmers in drylands
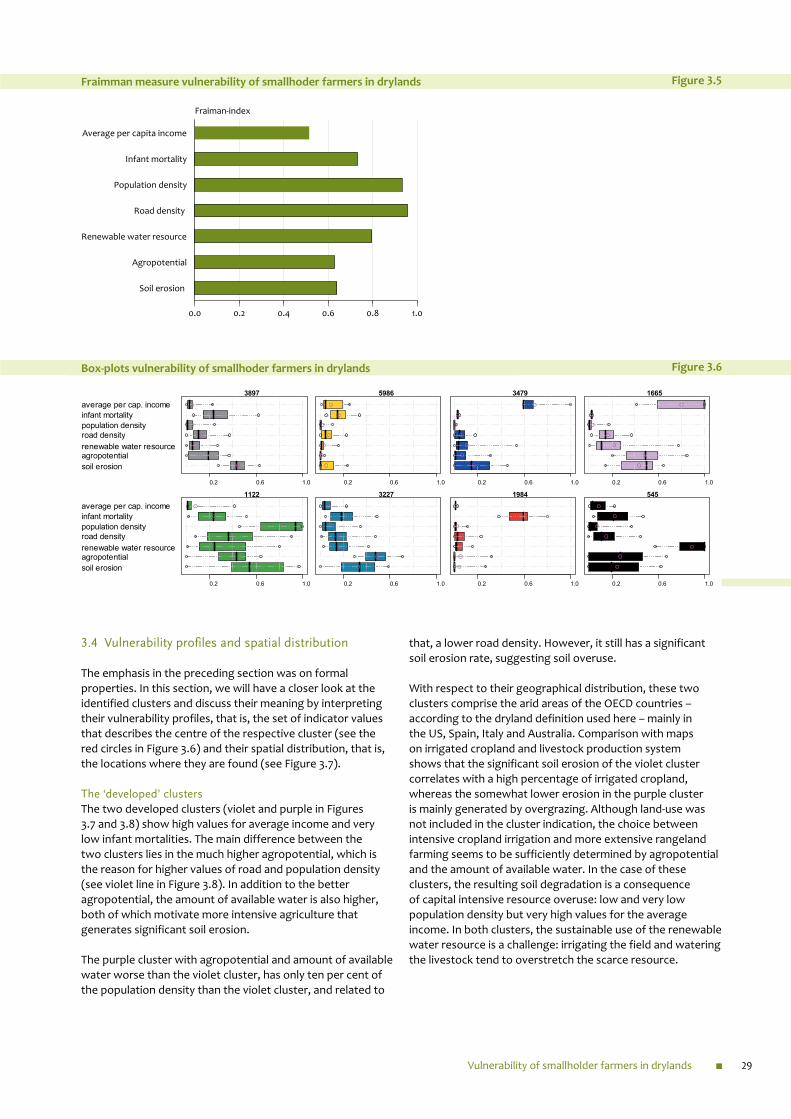
Vulnerability of smallholder farmers in drylands 29
3.4 Vulnerability profiles and spatial distribution
The emphasis in the preceding section was on formal properties. In this section, we will have a closer look at the identified clusters and discuss their meaning by interpreting their vulnerability profiles, that is, the set of indicator values that describes the centre of the respective cluster (see the red circles in Figure 3.6) and their spatial distribution, that is, the locations where they are found (see Figure 3.7).
The ‘developed’ clustersThe two developed clusters (violet and purple in Figures 3.7 and 3.8) show high values for average income and very low infant mortalities. The main difference between the two clusters lies in the much higher agropotential, which is the reason for higher values of road and population density (see violet line in Figure 3.8). In addition to the better agropotential, the amount of available water is also higher, both of which motivate more intensive agriculture that generates significant soil erosion.
The purple cluster with agropotential and amount of available water worse than the violet cluster, has only ten per cent of the population density than the violet cluster, and related to
that, a lower road density. However, it still has a significant soil erosion rate, suggesting soil overuse.
With respect to their geographical distribution, these two clusters comprise the arid areas of the OECD countries – according to the dryland definition used here – mainly in the US, Spain, Italy and Australia. Comparison with maps on irrigated cropland and livestock production system shows that the significant soil erosion of the violet cluster correlates with a high percentage of irrigated cropland, whereas the somewhat lower erosion in the purple cluster is mainly generated by overgrazing. Although land-use was not included in the cluster indication, the choice between intensive cropland irrigation and more extensive rangeland farming seems to be sufficiently determined by agropotential and the amount of available water. In the case of these clusters, the resulting soil degradation is a consequence of capital intensive resource overuse: low and very low population density but very high values for the average income. In both clusters, the sustainable use of the renewable water resource is a challenge: irrigating the field and watering the livestock tend to overstretch the scarce resource.
Figure 3.5
Average per capita income
Infant mortality
Population density
Road density
Renewable water resource
Agropotential
Soil erosion
Fraiman-index
0.0 0.2 0.4 0.6 0.8 1.0
Fraimman measure vulnerability of smallhoder farmers in drylands
Figure 3.6Box-plots vulnerability of smallhoder farmers in drylands
3897
0.2 0.6 1.0
5986
0.2 0.6 1.0
3479
0.2 0.6 1.0
1665
0.2 0.6 1.0
1122
0.2 0.6 1.0
3227
0.2 0.6 1.0
1984
0.2 0.6 1.0
545
0.2 0.6 1.0
soil erosionagropotentialrenewable water resourceroad densitypopulation densityinfant mortalityaverage per cap. income
soil erosionagropotentialrenewable water resourceroad densitypopulation densityinfant mortalityaverage per cap. income
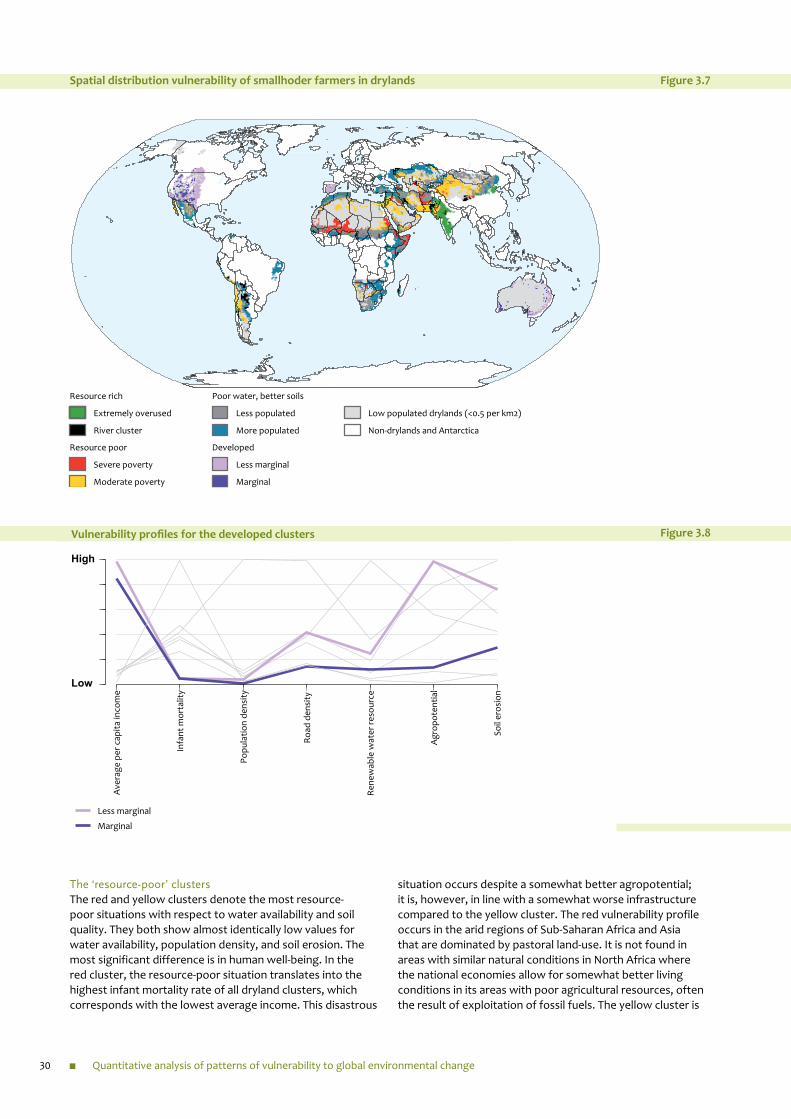
Quantitative analysis of patterns of vulnerability to global environmental change 30
The ‘resource-poor’ clustersThe red and yellow clusters denote the most resource-poor situations with respect to water availability and soil quality. They both show almost identically low values for water availability, population density, and soil erosion. The most significant difference is in human well-being. In the red cluster, the resource-poor situation translates into the highest infant mortality rate of all dryland clusters, which corresponds with the lowest average income. This disastrous
situation occurs despite a somewhat better agropotential; it is, however, in line with a somewhat worse infrastructure compared to the yellow cluster. The red vulnerability profile occurs in the arid regions of Sub-Saharan Africa and Asia that are dominated by pastoral land-use. It is not found in areas with similar natural conditions in North Africa where the national economies allow for somewhat better living conditions in its areas with poor agricultural resources, often the result of exploitation of fossil fuels. The yellow cluster is
Figure 3.7Spatial distribution vulnerability of smallhoder farmers in drylands
Resource rich
Extremely overused
River cluster
Resource poor
Severe poverty
Moderate poverty
Poor water, better soils
Less populated
More populated
Developed
Less marginal
Marginal
Low populated drylands (<0.5 per km2)
Non-drylands and Antarctica
Figure 3.8
Ave
rage
per
cap
ita in
com
e
Infa
nt m
orta
lity
Popu
latio
n de
nsity
Roa
d de
nsity
Ren
ewab
le w
ater
reso
urce
Agr
opot
entia
l
Soil
eros
ion
Less marginal
Marginal
Vulnerability profiles for the developed clusters
High
Low
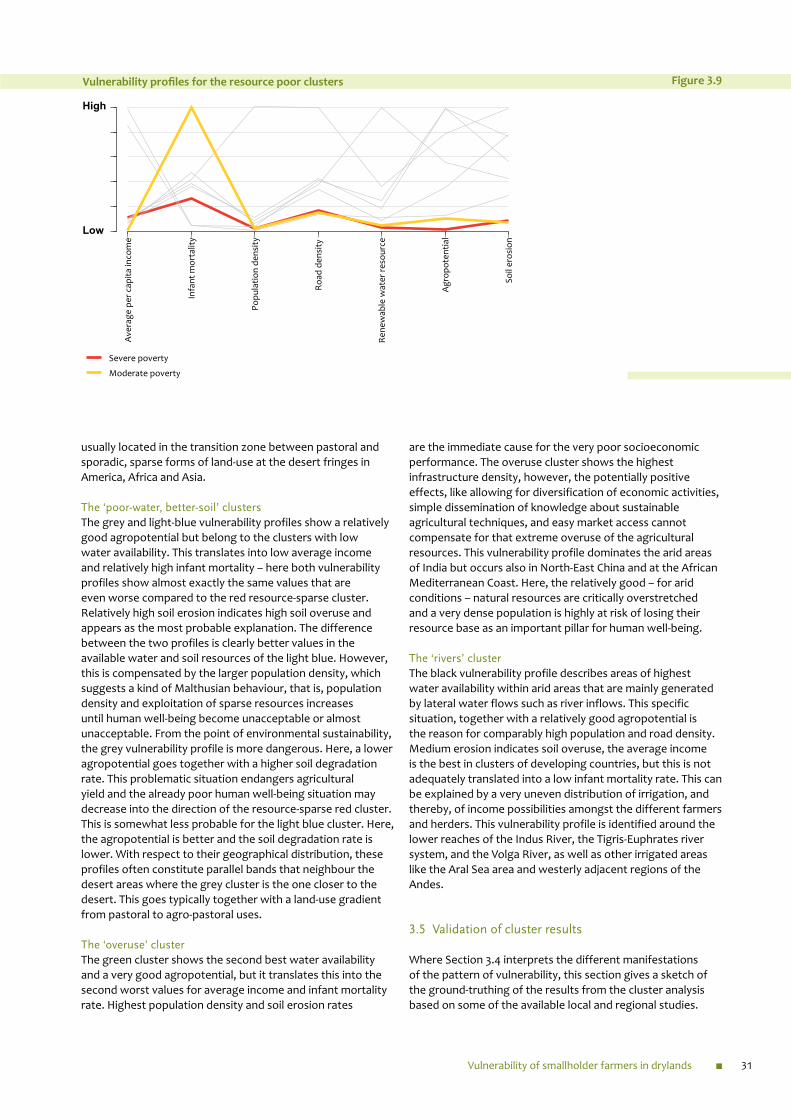
Vulnerability of smallholder farmers in drylands 31
usually located in the transition zone between pastoral and sporadic, sparse forms of land-use at the desert fringes in America, Africa and Asia.
The ‘poor-water, better-soil’ clustersThe grey and light-blue vulnerability profiles show a relatively good agropotential but belong to the clusters with low water availability. This translates into low average income and relatively high infant mortality – here both vulnerability profiles show almost exactly the same values that are even worse compared to the red resource-sparse cluster. Relatively high soil erosion indicates high soil overuse and appears as the most probable explanation. The difference between the two profiles is clearly better values in the available water and soil resources of the light blue. However, this is compensated by the larger population density, which suggests a kind of Malthusian behaviour, that is, population density and exploitation of sparse resources increases until human well-being become unacceptable or almost unacceptable. From the point of environmental sustainability, the grey vulnerability profile is more dangerous. Here, a lower agropotential goes together with a higher soil degradation rate. This problematic situation endangers agricultural yield and the already poor human well-being situation may decrease into the direction of the resource-sparse red cluster. This is somewhat less probable for the light blue cluster. Here, the agropotential is better and the soil degradation rate is lower. With respect to their geographical distribution, these profiles often constitute parallel bands that neighbour the desert areas where the grey cluster is the one closer to the desert. This goes typically together with a land-use gradient from pastoral to agro-pastoral uses.
The ‘overuse’ clusterThe green cluster shows the second best water availability and a very good agropotential, but it translates this into the second worst values for average income and infant mortality rate. Highest population density and soil erosion rates
are the immediate cause for the very poor socioeconomic performance. The overuse cluster shows the highest infrastructure density, however, the potentially positive effects, like allowing for diversification of economic activities, simple dissemination of knowledge about sustainable agricultural techniques, and easy market access cannot compensate for that extreme overuse of the agricultural resources. This vulnerability profile dominates the arid areas of India but occurs also in North-East China and at the African Mediterranean Coast. Here, the relatively good – for arid conditions – natural resources are critically overstretched and a very dense population is highly at risk of losing their resource base as an important pillar for human well-being.
The ‘rivers’ clusterThe black vulnerability profile describes areas of highest water availability within arid areas that are mainly generated by lateral water flows such as river inflows. This specific situation, together with a relatively good agropotential is the reason for comparably high population and road density. Medium erosion indicates soil overuse, the average income is the best in clusters of developing countries, but this is not adequately translated into a low infant mortality rate. This can be explained by a very uneven distribution of irrigation, and thereby, of income possibilities amongst the different farmers and herders. This vulnerability profile is identified around the lower reaches of the Indus River, the Tigris-Euphrates river system, and the Volga River, as well as other irrigated areas like the Aral Sea area and westerly adjacent regions of the Andes.
3.5 Validation of cluster results
Where Section 3.4 interprets the different manifestations of the pattern of vulnerability, this section gives a sketch of the ground-truthing of the results from the cluster analysis based on some of the available local and regional studies.
Figure 3.9
Ave
rage
per
cap
ita in
com
e
Infa
nt m
orta
lity
Popu
latio
n de
nsity
Roa
d de
nsity
Ren
ewab
le w
ater
reso
urce
Agr
opot
entia
l
Soil
eros
ion
Severe poverty
Moderate poverty
Vulnerability profiles for the resource poor clusters
High
Low
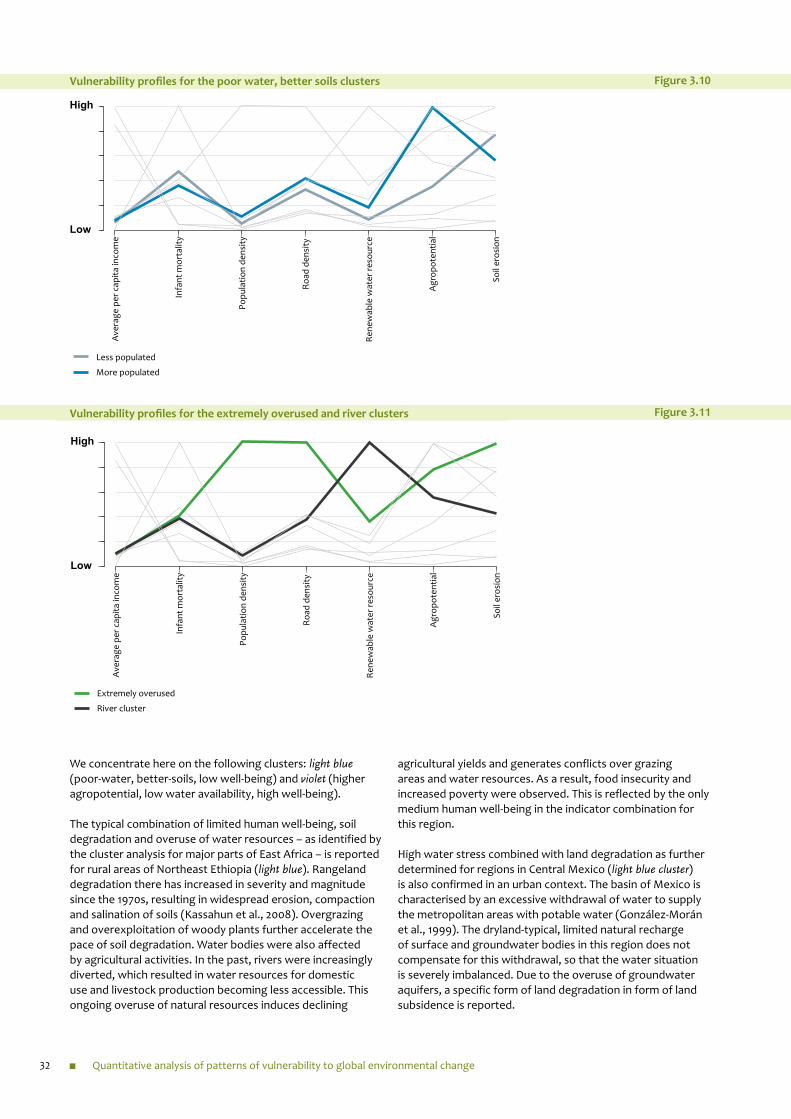
Quantitative analysis of patterns of vulnerability to global environmental change 32
We concentrate here on the following clusters: light blue (poor-water, better-soils, low well-being) and violet (higher agropotential, low water availability, high well-being).
The typical combination of limited human well-being, soil degradation and overuse of water resources – as identified by the cluster analysis for major parts of East Africa – is reported for rural areas of Northeast Ethiopia (light blue). Rangeland degradation there has increased in severity and magnitude since the 1970s, resulting in widespread erosion, compaction and salination of soils (Kassahun et al., 2008). Overgrazing and overexploitation of woody plants further accelerate the pace of soil degradation. Water bodies were also affected by agricultural activities. In the past, rivers were increasingly diverted, which resulted in water resources for domestic use and livestock production becoming less accessible. This ongoing overuse of natural resources induces declining
agricultural yields and generates conflicts over grazing areas and water resources. As a result, food insecurity and increased poverty were observed. This is reflected by the only medium human well-being in the indicator combination for this region.
High water stress combined with land degradation as further determined for regions in Central Mexico (light blue cluster) is also confirmed in an urban context. The basin of Mexico is characterised by an excessive withdrawal of water to supply the metropolitan areas with potable water (González-Morán et al., 1999). The dryland-typical, limited natural recharge of surface and groundwater bodies in this region does not compensate for this withdrawal, so that the water situation is severely imbalanced. Due to the overuse of groundwater aquifers, a specific form of land degradation in form of land subsidence is reported.
Figure 3.10
Ave
rage
per
cap
ita in
com
e
Infa
nt m
orta
lity
Popu
latio
n de
nsity
Roa
d de
nsity
Ren
ewab
le w
ater
reso
urce
Agr
opot
entia
l
Soil
eros
ion
Less populated
More populated
Vulnerability profiles for the poor water, better soils clusters
High
Low
Figure 3.11
Ave
rage
per
cap
ita in
com
e
Infa
nt m
orta
lity
Popu
latio
n de
nsity
Roa
d de
nsity
Ren
ewab
le w
ater
reso
urce
Agr
opot
entia
l
Soil
eros
ion
Extremely overused
River cluster
Vulnerability profiles for the extremely overused and river clusters
High
Low
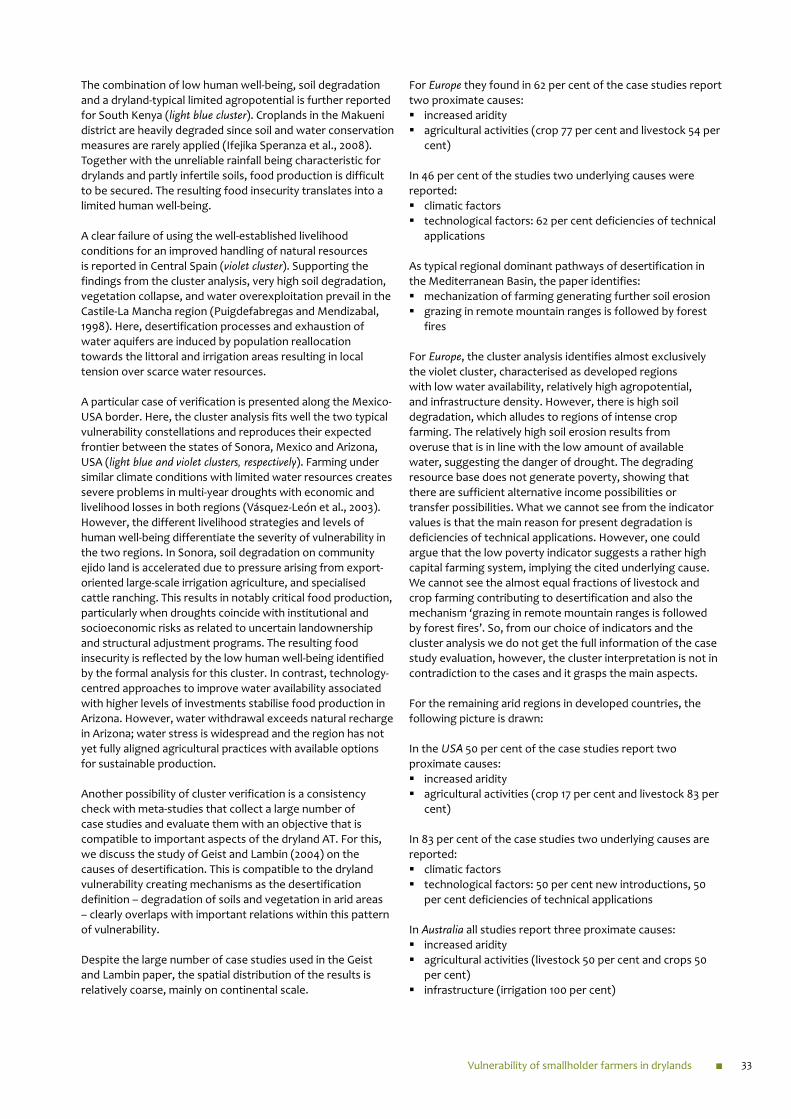
Vulnerability of smallholder farmers in drylands 33
The combination of low human well-being, soil degradation and a dryland-typical limited agropotential is further reported for South Kenya (light blue cluster). Croplands in the Makueni district are heavily degraded since soil and water conservation measures are rarely applied (Ifejika Speranza et al., 2008). Together with the unreliable rainfall being characteristic for drylands and partly infertile soils, food production is difficult to be secured. The resulting food insecurity translates into a limited human well-being.
A clear failure of using the well-established livelihood conditions for an improved handling of natural resources is reported in Central Spain (violet cluster). Supporting the findings from the cluster analysis, very high soil degradation, vegetation collapse, and water overexploitation prevail in the Castile-La Mancha region (Puigdefabregas and Mendizabal, 1998). Here, desertification processes and exhaustion of water aquifers are induced by population reallocation towards the littoral and irrigation areas resulting in local tension over scarce water resources.
A particular case of verification is presented along the Mexico-USA border. Here, the cluster analysis fits well the two typical vulnerability constellations and reproduces their expected frontier between the states of Sonora, Mexico and Arizona, USA (light blue and violet clusters, respectively). Farming under similar climate conditions with limited water resources creates severe problems in multi-year droughts with economic and livelihood losses in both regions (Vásquez-León et al., 2003). However, the different livelihood strategies and levels of human well-being differentiate the severity of vulnerability in the two regions. In Sonora, soil degradation on community ejido land is accelerated due to pressure arising from export-oriented large-scale irrigation agriculture, and specialised cattle ranching. This results in notably critical food production, particularly when droughts coincide with institutional and socioeconomic risks as related to uncertain landownership and structural adjustment programs. The resulting food insecurity is reflected by the low human well-being identified by the formal analysis for this cluster. In contrast, technology-centred approaches to improve water availability associated with higher levels of investments stabilise food production in Arizona. However, water withdrawal exceeds natural recharge in Arizona; water stress is widespread and the region has not yet fully aligned agricultural practices with available options for sustainable production.
Another possibility of cluster verification is a consistency check with meta-studies that collect a large number of case studies and evaluate them with an objective that is compatible to important aspects of the dryland AT. For this, we discuss the study of Geist and Lambin (2004) on the causes of desertification. This is compatible to the dryland vulnerability creating mechanisms as the desertification definition – degradation of soils and vegetation in arid areas – clearly overlaps with important relations within this pattern of vulnerability.
Despite the large number of case studies used in the Geist and Lambin paper, the spatial distribution of the results is relatively coarse, mainly on continental scale.
For Europe they found in 62 per cent of the case studies report two proximate causes:
� increased aridity � agricultural activities (crop 77 per cent and livestock 54 per
cent)
In 46 per cent of the studies two underlying causes were reported:
� climatic factors � technological factors: 62 per cent deficiencies of technical
applications
As typical regional dominant pathways of desertification in the Mediterranean Basin, the paper identifies:
� mechanization of farming generating further soil erosion � grazing in remote mountain ranges is followed by forest
fires
For Europe, the cluster analysis identifies almost exclusively the violet cluster, characterised as developed regions with low water availability, relatively high agropotential, and infrastructure density. However, there is high soil degradation, which alludes to regions of intense crop farming. The relatively high soil erosion results from overuse that is in line with the low amount of available water, suggesting the danger of drought. The degrading resource base does not generate poverty, showing that there are sufficient alternative income possibilities or transfer possibilities. What we cannot see from the indicator values is that the main reason for present degradation is deficiencies of technical applications. However, one could argue that the low poverty indicator suggests a rather high capital farming system, implying the cited underlying cause. We cannot see the almost equal fractions of livestock and crop farming contributing to desertification and also the mechanism ‘grazing in remote mountain ranges is followed by forest fires’. So, from our choice of indicators and the cluster analysis we do not get the full information of the case study evaluation, however, the cluster interpretation is not in contradiction to the cases and it grasps the main aspects.
For the remaining arid regions in developed countries, the following picture is drawn:
In the USA 50 per cent of the case studies report two proximate causes:
� increased aridity � agricultural activities (crop 17 per cent and livestock 83 per
cent)
In 83 per cent of the case studies two underlying causes are reported:
� climatic factors � technological factors: 50 per cent new introductions, 50
per cent deficiencies of technical applications
In Australia all studies report three proximate causes: � increased aridity � agricultural activities (livestock 50 per cent and crops 50
per cent) � infrastructure (irrigation 100 per cent)
Quantitative analysis of patterns of vulnerability to global environmental change 34
The underlying causes are rather unspecific.
Comparing the violet cluster with a global map of cropland distribution (FAO, 2006b) yields that it covers mainly the partly irrigated (Siebert et al., 2001) cropland regions of these countries. The interpretation is the same as in Europe and is in line with the case studies evaluation.
In addition to the violet cluster, the purple cluster also occurs in both the USA and Australia, which is physically more marginal with lower water availability and lower agropotential, but it is as wealthy as the violet cluster. Here the comparison with global maps of livestock distribution shows that this cluster denotes the regions where livestock farming is dominant, which is in accordance with the low agropotential and fits with the low road density. In both regions, the case studies identify livestock as a strong reason for degradation. The low water availability is in accordance with the increased aridity, which is stated in almost all case studies as important cause for degradation.
Following the line of comparing the cluster distribution with global maps of cropland distribution (FAO, 2006b), irrigated areas (Siebert et al., 2001) and livestock distribution result in a high correlation also in the developing countries, which would allow for the comparison of the proximate causes identified by Geist and Lambin. However, here the continental scale of their evaluation inhibits a strict verification due to the clearly sub-continental spatial distribution of the clusters. But, at least the portfolio of causes given by Geist and Lambin coincides with the integrated degradation mechanisms of the clusters occurring within the respective continents.
In summary, one can conclude that the cluster distributions fit the Geist and Lambin results amazingly well for regions with low cluster variety where a detailed comparison is possible and do not contradict their results in the other regions with high cluster variety.
3.6 Conclusions
Starting from the work done during the GEO–4 process in determining relevant and typical patterns of vulnerability, we analysed the drylands more extensively in this chapter. After discussing the dryland-relevant mechanisms, we determined a set of seven indicators with global coverage that describe the most relevant relations within this pattern of vulnerability and allow for later projections based on the IMAGE/GISMO modelling framework. A state-of-the-art cluster analysis revealed a set of eight clearly separable clusters. This shows that it is justified by the structure of the indicator space to speak about ‘typical’ vulnerability profiles – this is an important result. Such an approach would not be appropriate if there were a more continuous density of points in the indicator space.The interpretation of the cluster centres as vulnerability pro-files describing the vulnerability of human well-being against endogenous and exogenous stresses resulted in three cluster pairs: the developed clusters, the resource-poor clusters, the ‘poor-soils better-water’ clusters; and two single clusters: the rivers cluster and the overuse cluster.
The spatial distribution of the vulnerability profiles was compared with available single local case studies and studies that evaluated a large number of case studies. This comparison did not reveal contradictions of our results with the literature and showed coincidences in many cases. Without being a rigorous validation of our vulnerability profiles this comparison increases the confidence in our results, an important precondition for using our approach for scale-adequate policy analysis. Although it is not the task of this project phase, the description of each cluster in light of the vulnerability creating mechanisms already suggests cluster-specific policy options:The most promising situation within the dryland areas in the developing countries is within the ‘rivers’ cluster: the resource situation is good here, the population density and soil degradation rate are intermediate, and the GDP per capita is acceptable. The obvious problem of poverty due to unequal access to resources can be tackled by land reform, combined with measures to increase small farm competiveness. Here emphasis can be laid on institutional progress to provide increasing human well-being.
The situation becomes more complex in the case of the ‘poor-water, better-soils’ clusters. Here the soil degradation rate is higher and endangers future yields, in particular for the grey vulnerability profile. This can be avoided by the implementation of more sustainable resource management. For an extensive list of concrete measures see Dixon et al. (2001). The more critical resource situation in the grey cluster, reflected almost solely by pastoral use, leaves fewer possibilities to improve the situation by innovative agricultural techniques than in the better endowed light-blue cluster. This makes it less probable to improve human well-being for the existing population density in the grey cluster on the basis of agricultural production. As a consequence, either non-agricultural off-farm labour has to be provided or an exodus from these areas has to be accepted together with its implications for the destination areas of the migration. In the light-blue cluster with better agropotential and lower soil degradation rate, the chance of improving quality of life by more sustainable resource management is more realistic in case population density growth will be limited. In-migration from less endowed regions, such as the grey areas, would clearly endanger this opportunity.
In the two resource-scarce clusters, the opportunities provided by the natural resource base are by nature very weak. Comparison of the red and yellow clusters reveals that, for the present population density, even a somewhat better agropotential does not generate more wealth and that other national economic conditions are much more important. So, moving away from agriculture seems here to be the only economically and environmentally sustainable solution. The same is the case for the overuse vulnerability profile. The critical state of intensive agricultural overuse that generates only a very small income from relatively good natural resources due to the high population density can hardly be stabilised by new agricultural practices only. At the same time, pressure on productivity here has to be reduced. The natural conditions would then turn into an opportunity for sustainable livelihoods.
Vulnerability of forest-based livelihoods to forest overexploitation 35
In this chapter, we investigate the vulnerability of forest-based livelihoods to forest overexploitation. The loss of ecosystem services in forests - either as a result of poverty or market-driven overuse - increases the vulnerability of people dependent on the forest goods and services. Forest overexploitation results either from land-use change and deforestation driven by demand for agricultural products and wood from the global market, or from forest and land degradation due to unsustainable subsistence use. Forest overexploitation leads to a loss of its ecosystem services, including productivity and the regulating services for soils and water. This loss of ecosystem services increases the vulnerability of the people who are directly dependent on them.
4.1 Vulnerability creating mechanisms
The world forests are important ecosystems that underpin life, economies and societies (UNEP, 2007). Currently, they occupy approximately 30 per cent of the total land area. Nearly 90 per cent of terrestrial biodiversity is found in these forests, with a disproportionately high share in tropical forests (MA, 2005). Forests provide provisioning services such as food, water, wood and medicines; regulating services for soils, water, biodiversity and climate; cultural services for indigenous people and recreation and tourism; and supporting services such as soil formation, photosynthesis, and nutrient cycling (MA, 2005). However, harvesting of forest products such as roundwood and fuelwood, non-timber forest products (NTFP), and the creation of agricultural land, can put severe pressure on the world forests. Furthermore, many resource management decisions are highly influenced by market forces, while the non-marketed benefits are often lost or degraded (MA, 2005). As a consequence, a reduction of the diversity of forest ecosystem services dominated by a few or even just one product or service can be observed (Kessler, 2003).
In this study, forest overexploitation includes deforestation, forest degradation, and land-use change related land degradation. Deforestation involves a decrease in the area covered by forest. Forest degradation does not necessarily
only involve a reduction of the forest area: it also involves a decrease in the quality of its condition. This is related to one or a number of different forest ecosystem components (such as vegetation layer, fauna and soil) to the interactions between these components, and more generally, to its functioning (Lanly, 2003). Degradation often implies a change in the health and vitality of a forest ecosystem, but can also relate to other factors such as changes in the composition of tree species, a loss of biodiversity, a permanent or long-term reduction in the crown cover, and changes in timber volumes or carbon and water retention levels (UNEP et al., 2008). Degradation is often caused by overexploitation of forest areas by humans, including haphazard and badly executed logging operations. Land degradation is especially a problem for poor farmers in tropical areas, where intensive use for agriculture without supplementing the soil with additional nutrients in the form of fertilizers leads to serious land degradation (Juo and Franzluebbers, 2003). In general, forest overexploitation has negative well-being implications for the people who are directly dependent on forest services (MA, 2005), ultimately resulting in decreasing production and increasing poverty (Tekelenburg et al., 2009). Deforestation and forest degradation decrease forest productivity and negatively affect the regulation services for soils and water. Consequently, this land degradation causes a cascading negative effect on agricultural activities, farmers’ income and ultimately their nutritional status.
More than 1.6 billion people depend to varying degrees on forests for their livelihoods. About 350 million people live within or adjacent to dense forests and depend on these forests to a high degree for subsistence and income, while an additional 60 million indigenous people are almost wholly dependent on forests (WorldBank, 2004). People who are largely dependent on forests make – for subsistence needs – ample use of relatively intact forests with respect to agricultural land, NTFPs, timber, and on-site ecological services, where the degree of dependence differs largely for different user groups (Angelsen and Wunder, 2003). Fuelwood and most NTFPs are openly available, have a low capital and skill requirement, and have a low return to labour, which benefits people who lack capital and market access
Vulnerability of forest-based livelihoods to forest overexploitation
4
Quantitative analysis of patterns of vulnerability to global environmental change 36
to develop other sources of income. It should be noted that many people often have other sources of income, and that NTFPs constitute a safety net and fill in seasonal or annual gaps of income. Many NTFPs have a poor resource base, a poor market potential, and a long market chain. As a result, the transaction costs to establish and maintain a profitable and community-based management system are too high in relation to the expected benefits (Angelsen and Wunder, 2003). They thereby do not contribute to structural poverty alleviation (Kusters, 2009).
There is no single global explanation for forest overexploitation. Causes of overexploitation are related to multiple domains, scales, and actors. In general, forest overexploitation is driven by changing economic opportunities that are linked to yet other social, political, and infrastructural changes (Lambin et al., 2001). To explain the process behind deforestation, Geist and Lambin (2001) distinguish between proximate causes, which include infrastructure extension, agricultural expansion, and wood extraction; underlying causes, such as demographic factors, economic factors, technological factors, policy-related factors, institutional factors, and cultural factors; and pre-disposing biophysical factors, including low relief and flat topography in combination with good soil quality and high water availability. In their analysis, they found that large-scale deforestation is predicated by large, sparsely occupied forest regions, indigenous occupants with little or no political influence or political representation and immigration triggered by infrastructure development and government policies. Furthermore, they state that in general, smallholder farms are more important for deforestation than commercial agriculture, while agricultural expansion – mostly smallholder –often follows timber logging and road construction. Immigration into forested areas plays a more important role than natural population increase, and poverty is a cross-cutting underlying theme rather than a single variable.
Tekelenburg et al. (2009) assess drivers and direct causes of forest overexploitation and loss of well-being, grouping them into economic, production, social, political, and ecological/environmental related factors. Economic causes encompass economic growth, market integration, and competition. Production factors comprise access to natural resources, ecosystem productivity, management skills and technology, and economic return. The social factors include distribution of wealth or power, poverty, demographic changes, and sociocultural dilemmas. Political factors include specific policies on markets, land, production, the environment, and social security. Governance and conflict also play an important role. Finally, ecological/environmental related factors include ecosystem stability, brittleness, exploitation, and regime shifts.
Forests differ in pressure, poverty, and environmental consequences. In a stylised way, three forest types can be distinguished (Chomitz et al., 2007):
� Forest-agriculture mosaiclands (mosaiclands): Settled agricultural areas with depleted fragmented forest and a large share of threatened species
� Frontier and disputed areas (frontier areas): Relatively undisturbed forest, with communities potentially suffering from conflict over land and forest resources
� Areas beyond the agricultural frontier (forest core): Areas outside the reach of most agricultural markets, though not beyond human influence
Resource-use systems in forests differ over market access, suitability for farming, and tenure security. Tekelenburg et al. (2009) distinguish three stylised resource-use systems, two of which are market-oriented and subsistence-oriented resource-use systems, that are either capital-driven or poverty driven. Markets offer opportunities for generating income and reducing poverty. Whether this leads to actual poverty reduction depends on cross-cutting determinants related to governance and policies. The third resource-use system is where governance and policies dominantly affect the capital-driven and poverty-driven mechanisms and can be regarded as policy-driven.
Capital-driven forest overexploitation is generally characterised by a large global demand for wood or agricultural products, a lack of enforcement of natural protection laws, and corruption (Eisenack et al., 2006). Exploitation requires an accessible ecosystem that provides large subtractable amounts of wood or productive agricultural area. Fuelled by strong developments of infrastructure, land-use change and deforestation increase strongly, inducing further deforestation and forest degradation.
Poverty-driven overexploitation is caused by the demand for wood, NTFPs, and fertile land for agriculture by indigenous people and smallholder farmers. The pressure on the local ecosystems increases for a number of reasons: population growth and immigration related to poverty; marginalisation, national policies that involve targeting resettlement and infrastructure development, and a lack of alternative sources of income for people. This all results in deforestation, forest degradation, and land degradation. Dependent on the inherent quality of the land for agricultural practices, severe land and severe forest degradation cyclically spirals into further deforestation, forest degradation, and land degradation. This can eventually render the land unsuitable for crop production and further marginalisation of the local population. Severe nutrient deficiencies as a result of soil fertility loss contribute to malnutrition, susceptibility to disease, and economic insecurity.
Capital-driven and poverty-driven overexploitation are linked through global, national and local dynamics (Kok and Hilderink, 2007). At the global level there is an increasing demand for agricultural products. At the national level there are formal and informal institutions that constitute the profitability of agricultural production and the rights of indigenous people. At the local level the actual overexploitation takes place endangering the livelihoods of local communities, dependent on their reliance on the forest ecosystem and their coping capacity. The level of marginalisation is a key determinant in transforming environmental impacts in human well-being impacts. Governance and policy have an explicit role in both mechanisms, as specific policies have their effects on profit opportunity, population dynamics, and marginalisation, while governance also addresses the effectiveness of specific policies, including protection measures.
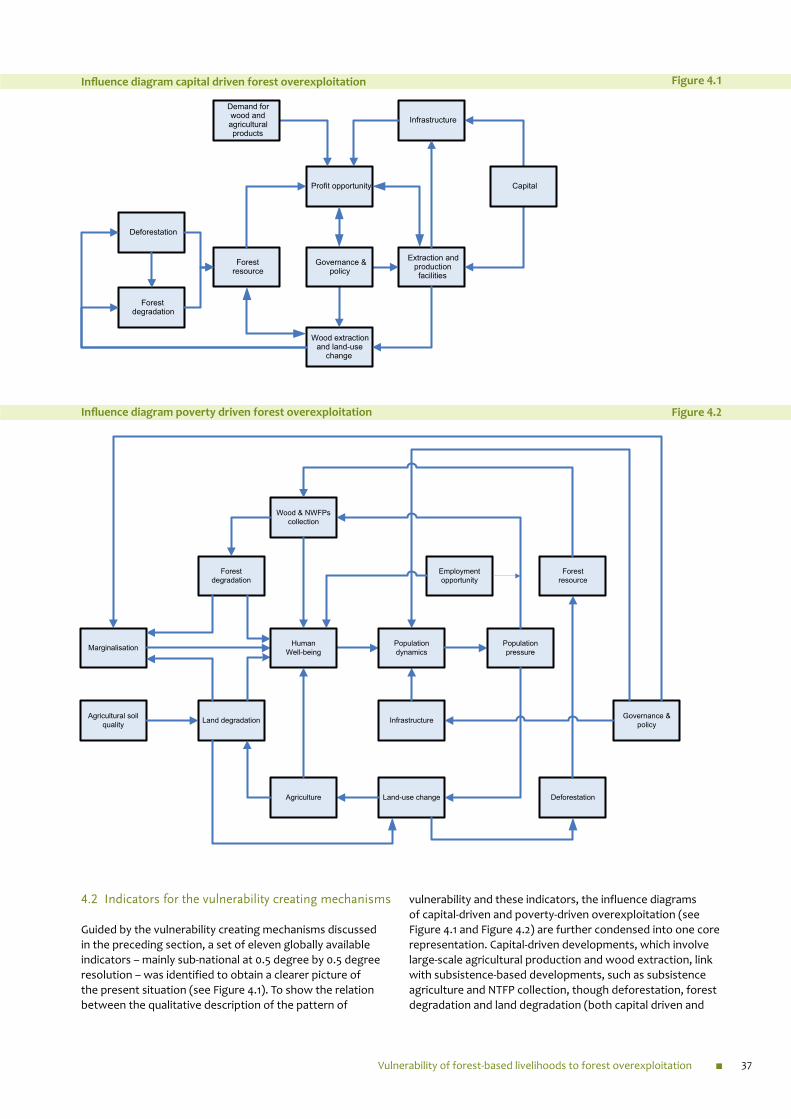
Vulnerability of forest-based livelihoods to forest overexploitation 37
4.2 Indicators for the vulnerability creating mechanisms
Guided by the vulnerability creating mechanisms discussed in the preceding section, a set of eleven globally available indicators – mainly sub-national at 0.5 degree by 0.5 degree resolution – was identified to obtain a clearer picture of the present situation (see Figure 4.1). To show the relation between the qualitative description of the pattern of
vulnerability and these indicators, the influence diagrams of capital-driven and poverty-driven overexploitation (see Figure 4.1 and Figure 4.2) are further condensed into one core representation. Capital-driven developments, which involve large-scale agricultural production and wood extraction, link with subsistence-based developments, such as subsistence agriculture and NTFP collection, though deforestation, forest degradation and land degradation (both capital driven and
Figure 4.1Influence diagram capital driven forest overexploitation
Profit opportunity
Extraction and production facilities
Infrastructure
Wood extraction and land-use
change
Forestresource
Forest degradation
Capital
Governance & policy
Demand forwood and agricultural products
Deforestation
Influence diagram poverty driven forest overexploitation
Deforestation
Marginalisation Population pressure
Land-use change
Agricultural soil quality Land degradation Infrastructure
Human Well-being
Forest degradation
Employment opportunity
Forest resource
Agriculture
Wood & NWFPs collection
Population dynamics
Governance & policy
Figure 4.2
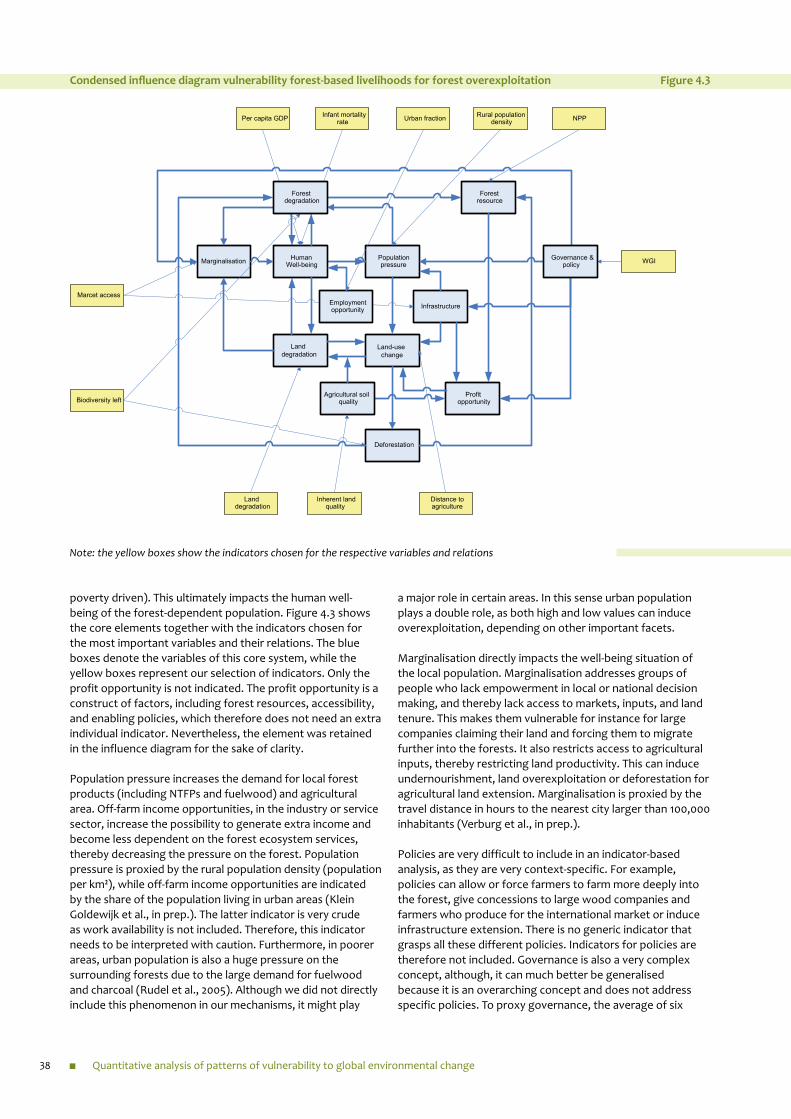
Quantitative analysis of patterns of vulnerability to global environmental change 38
poverty driven). This ultimately impacts the human well-being of the forest-dependent population. Figure 4.3 shows the core elements together with the indicators chosen for the most important variables and their relations. The blue boxes denote the variables of this core system, while the yellow boxes represent our selection of indicators. Only the profit opportunity is not indicated. The profit opportunity is a construct of factors, including forest resources, accessibility, and enabling policies, which therefore does not need an extra individual indicator. Nevertheless, the element was retained in the influence diagram for the sake of clarity.
Population pressure increases the demand for local forest products (including NTFPs and fuelwood) and agricultural area. Off-farm income opportunities, in the industry or service sector, increase the possibility to generate extra income and become less dependent on the forest ecosystem services, thereby decreasing the pressure on the forest. Population pressure is proxied by the rural population density (population per km2), while off-farm income opportunities are indicated by the share of the population living in urban areas (Klein Goldewijk et al., in prep.). The latter indicator is very crude as work availability is not included. Therefore, this indicator needs to be interpreted with caution. Furthermore, in poorer areas, urban population is also a huge pressure on the surrounding forests due to the large demand for fuelwood and charcoal (Rudel et al., 2005). Although we did not directly include this phenomenon in our mechanisms, it might play
a major role in certain areas. In this sense urban population plays a double role, as both high and low values can induce overexploitation, depending on other important facets.
Marginalisation directly impacts the well-being situation of the local population. Marginalisation addresses groups of people who lack empowerment in local or national decision making, and thereby lack access to markets, inputs, and land tenure. This makes them vulnerable for instance for large companies claiming their land and forcing them to migrate further into the forests. It also restricts access to agricultural inputs, thereby restricting land productivity. This can induce undernourishment, land overexploitation or deforestation for agricultural land extension. Marginalisation is proxied by the travel distance in hours to the nearest city larger than 100,000 inhabitants (Verburg et al., in prep.).
Policies are very difficult to include in an indicator-based analysis, as they are very context-specific. For example, policies can allow or force farmers to farm more deeply into the forest, give concessions to large wood companies and farmers who produce for the international market or induce infrastructure extension. There is no generic indicator that grasps all these different policies. Indicators for policies are therefore not included. Governance is also a very complex concept, although, it can much better be generalised because it is an overarching concept and does not address specific policies. To proxy governance, the average of six
Note: the yellow boxes show the indicators chosen for the respective variables and relations
Condensed influence diagram vulnerability forest-based livelihoods for forest overexploitation
Deforestation
Profitopportunity
Population pressure
Land-use change
Land degradation
Human Well-being
Forest resource
Marginalisation
Infrastructure
Agricultural soil quality
NPPPer capita GDP Infant mortality rate
Marcet access
WGI
Inherent land quality
Landdegradation
Rural population densityUrban fraction
Distance to agriculture
Biodiversity left
Forest degradation
Employment opportunity
Governance & policy
Figure 4.3
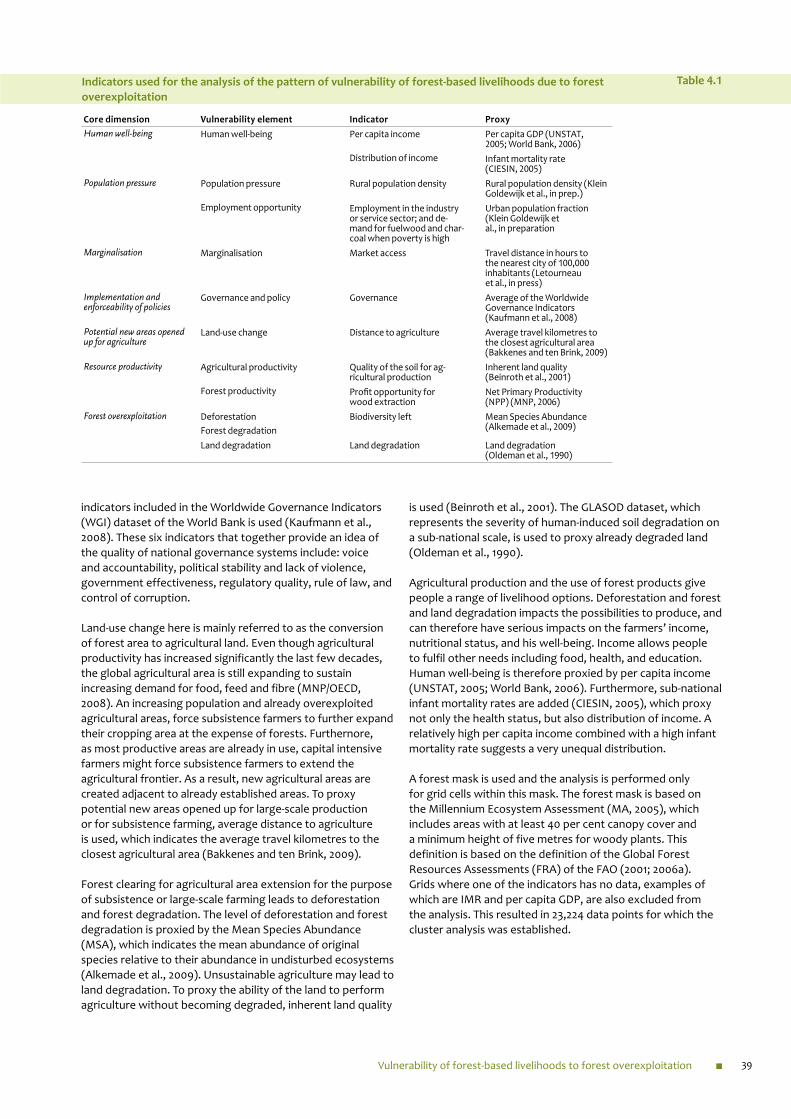
Vulnerability of forest-based livelihoods to forest overexploitation 39
indicators included in the Worldwide Governance Indicators (WGI) dataset of the World Bank is used (Kaufmann et al., 2008). These six indicators that together provide an idea of the quality of national governance systems include: voice and accountability, political stability and lack of violence, government effectiveness, regulatory quality, rule of law, and control of corruption.
Land-use change here is mainly referred to as the conversion of forest area to agricultural land. Even though agricultural productivity has increased significantly the last few decades, the global agricultural area is still expanding to sustain increasing demand for food, feed and fibre (MNP/OECD, 2008). An increasing population and already overexploited agricultural areas, force subsistence farmers to further expand their cropping area at the expense of forests. Furthernore, as most productive areas are already in use, capital intensive farmers might force subsistence farmers to extend the agricultural frontier. As a result, new agricultural areas are created adjacent to already established areas. To proxy potential new areas opened up for large-scale production or for subsistence farming, average distance to agriculture is used, which indicates the average travel kilometres to the closest agricultural area (Bakkenes and ten Brink, 2009).
Forest clearing for agricultural area extension for the purpose of subsistence or large-scale farming leads to deforestation and forest degradation. The level of deforestation and forest degradation is proxied by the Mean Species Abundance (MSA), which indicates the mean abundance of original species relative to their abundance in undisturbed ecosystems (Alkemade et al., 2009). Unsustainable agriculture may lead to land degradation. To proxy the ability of the land to perform agriculture without becoming degraded, inherent land quality
is used (Beinroth et al., 2001). The GLASOD dataset, which represents the severity of human-induced soil degradation on a sub-national scale, is used to proxy already degraded land (Oldeman et al., 1990).
Agricultural production and the use of forest products give people a range of livelihood options. Deforestation and forest and land degradation impacts the possibilities to produce, and can therefore have serious impacts on the farmers’ income, nutritional status, and his well-being. Income allows people to fulfil other needs including food, health, and education. Human well-being is therefore proxied by per capita income (UNSTAT, 2005; World Bank, 2006). Furthermore, sub-national infant mortality rates are added (CIESIN, 2005), which proxy not only the health status, but also distribution of income. A relatively high per capita income combined with a high infant mortality rate suggests a very unequal distribution.
A forest mask is used and the analysis is performed only for grid cells within this mask. The forest mask is based on the Millennium Ecosystem Assessment (MA, 2005), which includes areas with at least 40 per cent canopy cover and a minimum height of five metres for woody plants. This definition is based on the definition of the Global Forest Resources Assessments (FRA) of the FAO (2001; 2006a). Grids where one of the indicators has no data, examples of which are IMR and per capita GDP, are also excluded from the analysis. This resulted in 23,224 data points for which the cluster analysis was established.
Indicators used for the analysis of the pattern of vulnerability of forest-based livelihoods due to forest overexploitation
Core dimension Vulnerability element Indicator ProxyHuman well-being Human well-being Per capita income Per capita GDP (UNSTAT,
2005; World Bank, 2006)Distribution of income Infant mortality rate
(CIESIN, 2005)Population pressure Population pressure Rural population density Rural population density (Klein
Goldewijk et al., in prep.)Employment opportunity Employment in the industry
or service sector; and de-mand for fuelwood and char-coal when poverty is high
Urban population fraction (Klein Goldewijk et al., in preparation
Marginalisation Marginalisation Market access Travel distance in hours to the nearest city of 100,000 inhabitants (Letourneau et al., in press)
Implementation and enforceability of policies
Governance and policy Governance Average of the Worldwide Governance Indicators (Kaufmann et al., 2008)
Potential new areas opened up for agriculture
Land-use change Distance to agriculture Average travel kilometres to the closest agricultural area (Bakkenes and ten Brink, 2009)
Resource productivity Agricultural productivity Quality of the soil for ag-ricultural production
Inherent land quality (Beinroth et al., 2001)
Forest productivity Profit opportunity for wood extraction
Net Primary Productivity (NPP) (MNP, 2006)
Forest overexploitation Deforestation Biodiversity left Mean Species Abundance (Alkemade et al., 2009)Forest degradation
Land degradation Land degradation Land degradation (Oldeman et al., 1990)
Table 4.1
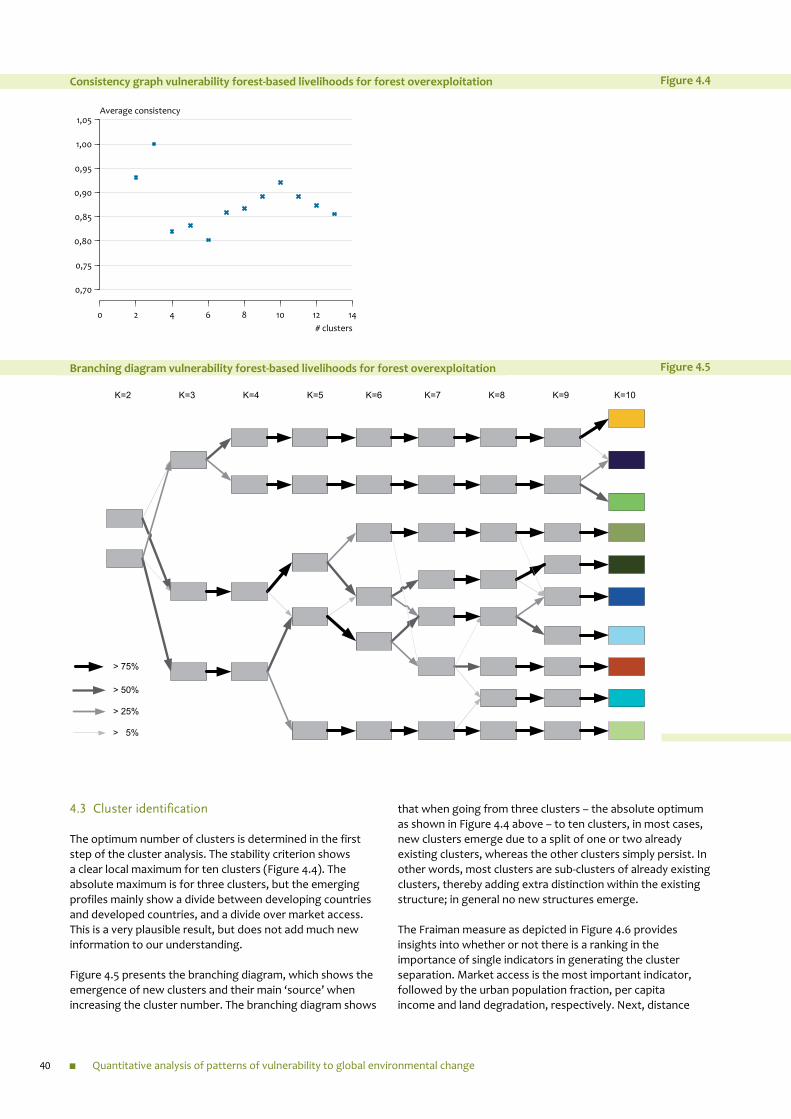
Quantitative analysis of patterns of vulnerability to global environmental change 40
4.3 Cluster identification
The optimum number of clusters is determined in the first step of the cluster analysis. The stability criterion shows a clear local maximum for ten clusters (Figure 4.4). The absolute maximum is for three clusters, but the emerging profiles mainly show a divide between developing countries and developed countries, and a divide over market access. This is a very plausible result, but does not add much new information to our understanding.
Figure 4.5 presents the branching diagram, which shows the emergence of new clusters and their main ‘source’ when increasing the cluster number. The branching diagram shows
that when going from three clusters – the absolute optimum as shown in Figure 4.4 above – to ten clusters, in most cases, new clusters emerge due to a split of one or two already existing clusters, whereas the other clusters simply persist. In other words, most clusters are sub-clusters of already existing clusters, thereby adding extra distinction within the existing structure; in general no new structures emerge.
The Fraiman measure as depicted in Figure 4.6 provides insights into whether or not there is a ranking in the importance of single indicators in generating the cluster separation. Market access is the most important indicator, followed by the urban population fraction, per capita income and land degradation, respectively. Next, distance
Figure 4.4
0 2 4 6 8 10 12 14# clusters
0,70
0,75
0,80
0,85
0,90
0,95
1,00
1,05Average consistency
Consistency graph vulnerability forest-based livelihoods for forest overexploitation
Figure 4.5Branching diagram vulnerability forest-based livelihoods for forest overexploitation
K=10K=2 K=3 K=4 K=5 K=6 K=7 K=8 K=9
> 50%
> 25%
> 5%
> 75%
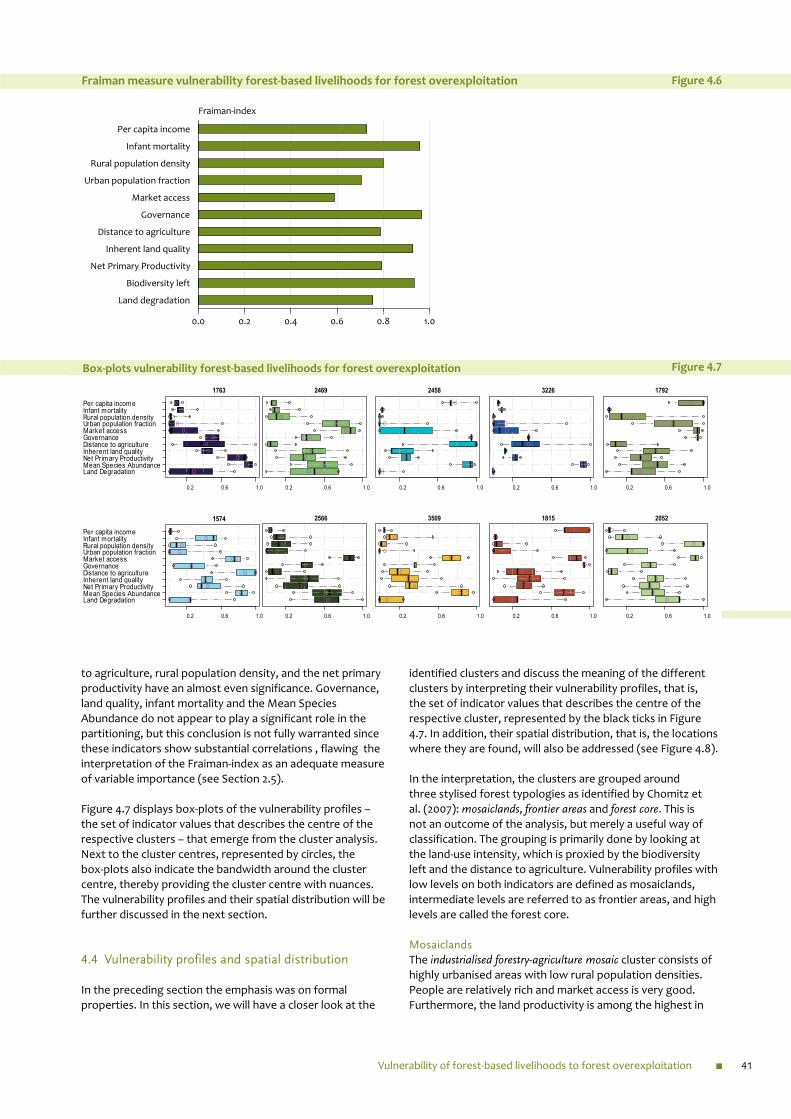
Vulnerability of forest-based livelihoods to forest overexploitation 41
to agriculture, rural population density, and the net primary productivity have an almost even significance. Governance, land quality, infant mortality and the Mean Species Abundance do not appear to play a significant role in the partitioning, but this conclusion is not fully warranted since these indicators show substantial correlations , flawing the interpretation of the Fraiman-index as an adequate measure of variable importance (see Section 2.5).
Figure 4.7 displays box-plots of the vulnerability profiles – the set of indicator values that describes the centre of the respective clusters – that emerge from the cluster analysis. Next to the cluster centres, represented by circles, the box-plots also indicate the bandwidth around the cluster centre, thereby providing the cluster centre with nuances. The vulnerability profiles and their spatial distribution will be further discussed in the next section.
4.4 Vulnerability profiles and spatial distribution
In the preceding section the emphasis was on formal properties. In this section, we will have a closer look at the
identified clusters and discuss the meaning of the different clusters by interpreting their vulnerability profiles, that is, the set of indicator values that describes the centre of the respective cluster, represented by the black ticks in Figure 4.7. In addition, their spatial distribution, that is, the locations where they are found, will also be addressed (see Figure 4.8).
In the interpretation, the clusters are grouped around three stylised forest typologies as identified by Chomitz et al. (2007): mosaiclands, frontier areas and forest core. This is not an outcome of the analysis, but merely a useful way of classification. The grouping is primarily done by looking at the land-use intensity, which is proxied by the biodiversity left and the distance to agriculture. Vulnerability profiles with low levels on both indicators are defined as mosaiclands, intermediate levels are referred to as frontier areas, and high levels are called the forest core.
MosaiclandsThe industrialised forestry-agriculture mosaic cluster consists of highly urbanised areas with low rural population densities. People are relatively rich and market access is very good. Furthermore, the land productivity is among the highest in
Figure 4.6
Per capita income
Infant mortality
Rural population density
Urban population fraction
Market access
Governance
Distance to agriculture
Inherent land quality
Net Primary Productivity
Biodiversity left
Land degradation
Fraiman-index
0.0 0.2 0.4 0.6 0.8 1.0
Fraiman measure vulnerability forest-based livelihoods for forest overexploitation
Figure 4.7Box-plots vulnerability forest-based livelihoods for forest overexploitation
1763
0.2 0.6 1.0
Land DegradationMean Species AbundanceNet Primary ProductivityInherent land qualityDistance to agricultureGovernanceMarket accessUrban population fractionRural population densityInfant mortalityPer capita income
2469
0.2 0.6 1.0
2458
0.2 0.6 1.0
3226
0.2 0.6 1.0
1792
0.2 0.6 1.0
1574
0.2 0.6 1.0
Land DegradationMean Species AbundanceNet Primary ProductivityInherent land qualityDistance to agricultureGovernanceMarket accessUrban population fractionRural population densityInfant mortalityPer capita income
2566
0.2 0.6 1.0
3509
0.2 0.6 1.0
1815
0.2 0.6 1.0
2052
0.2 0.6 1.0
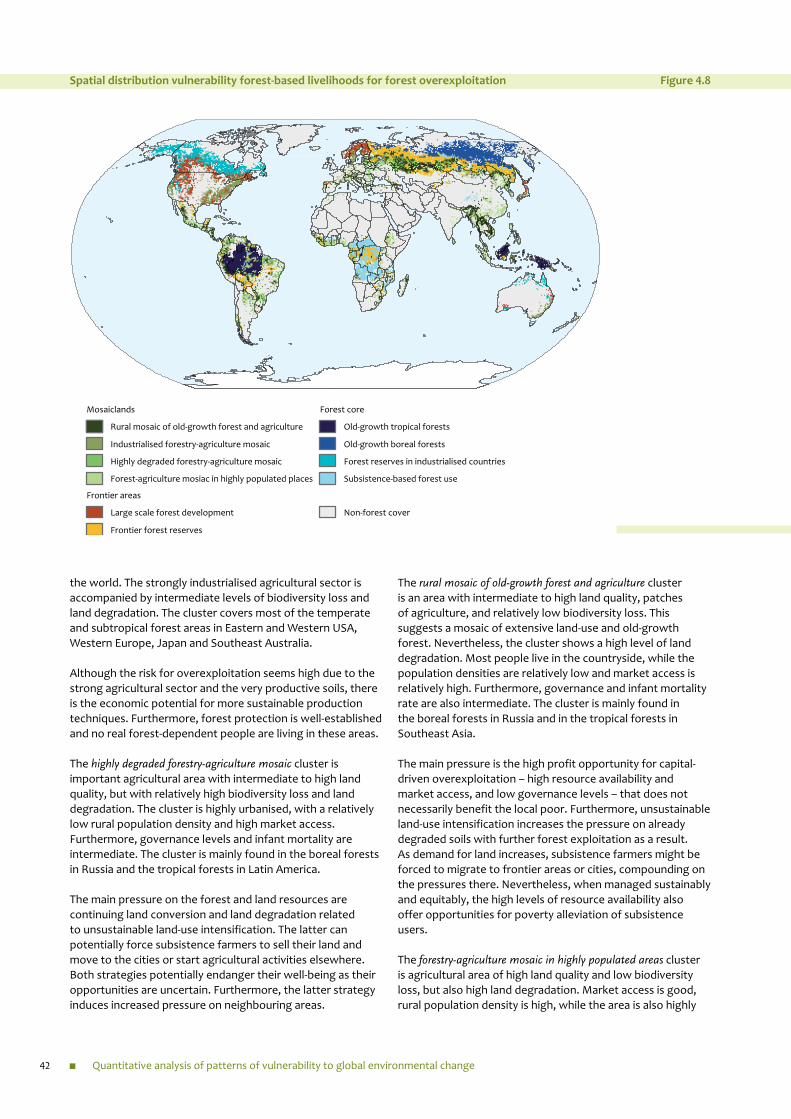
Quantitative analysis of patterns of vulnerability to global environmental change 42
the world. The strongly industrialised agricultural sector is accompanied by intermediate levels of biodiversity loss and land degradation. The cluster covers most of the temperate and subtropical forest areas in Eastern and Western USA, Western Europe, Japan and Southeast Australia.
Although the risk for overexploitation seems high due to the strong agricultural sector and the very productive soils, there is the economic potential for more sustainable production techniques. Furthermore, forest protection is well-established and no real forest-dependent people are living in these areas.
The highly degraded forestry-agriculture mosaic cluster is important agricultural area with intermediate to high land quality, but with relatively high biodiversity loss and land degradation. The cluster is highly urbanised, with a relatively low rural population density and high market access. Furthermore, governance levels and infant mortality are intermediate. The cluster is mainly found in the boreal forests in Russia and the tropical forests in Latin America.
The main pressure on the forest and land resources are continuing land conversion and land degradation related to unsustainable land-use intensification. The latter can potentially force subsistence farmers to sell their land and move to the cities or start agricultural activities elsewhere. Both strategies potentially endanger their well-being as their opportunities are uncertain. Furthermore, the latter strategy induces increased pressure on neighbouring areas.
The rural mosaic of old-growth forest and agriculture cluster is an area with intermediate to high land quality, patches of agriculture, and relatively low biodiversity loss. This suggests a mosaic of extensive land-use and old-growth forest. Nevertheless, the cluster shows a high level of land degradation. Most people live in the countryside, while the population densities are relatively low and market access is relatively high. Furthermore, governance and infant mortality rate are also intermediate. The cluster is mainly found in the boreal forests in Russia and in the tropical forests in Southeast Asia.
The main pressure is the high profit opportunity for capital-driven overexploitation – high resource availability and market access, and low governance levels – that does not necessarily benefit the local poor. Furthermore, unsustainable land-use intensification increases the pressure on already degraded soils with further forest exploitation as a result. As demand for land increases, subsistence farmers might be forced to migrate to frontier areas or cities, compounding on the pressures there. Nevertheless, when managed sustainably and equitably, the high levels of resource availability also offer opportunities for poverty alleviation of subsistence users.
The forestry-agriculture mosaic in highly populated areas cluster is agricultural area of high land quality and low biodiversity loss, but also high land degradation. Market access is good, rural population density is high, while the area is also highly
Figure 4.8Spatial distribution vulnerability forest-based livelihoods for forest overexploitation
Mosaiclands
Rural mosaic of old-growth forest and agriculture
Industrialised forestry-agriculture mosaic
Highly degraded forestry-agriculture mosaic
Forest-agriculture mosiac in highly populated places
Frontier areas
Large scale forest development
Frontier forest reserves
Forest core
Old-growth tropical forests
Old-growth boreal forests
Forest reserves in industrialised countries
Subsistence-based forest use
Non-forest cover
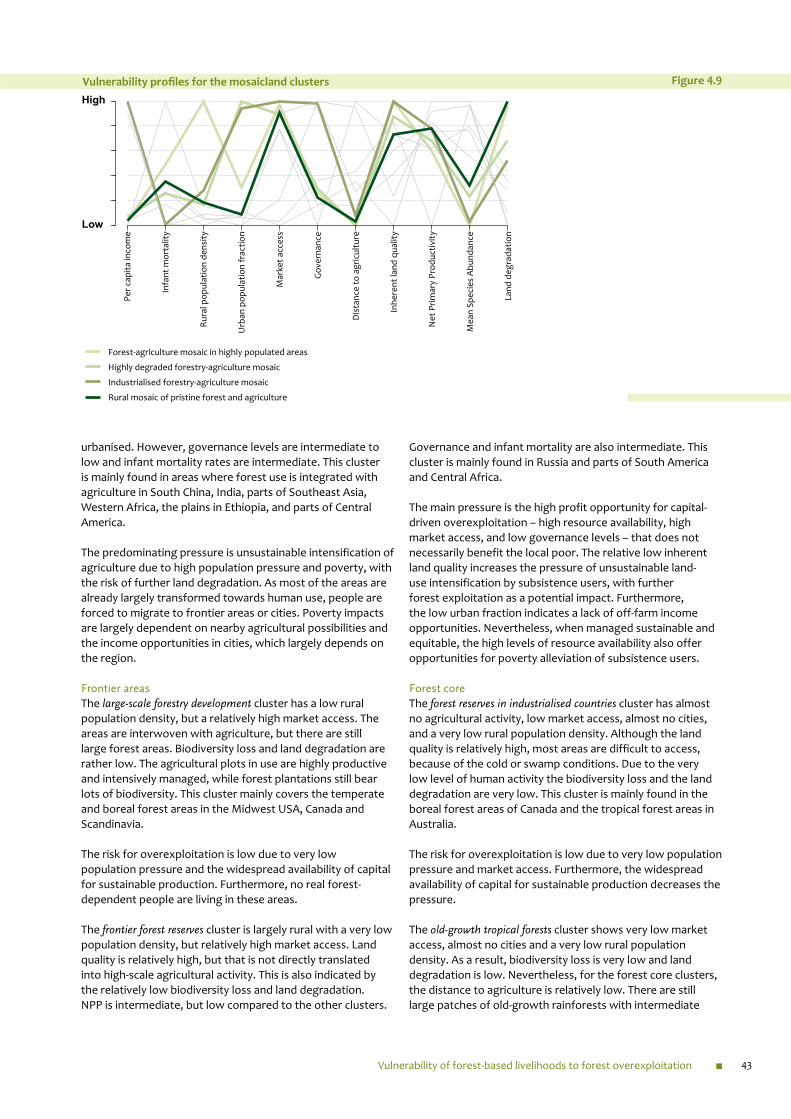
Vulnerability of forest-based livelihoods to forest overexploitation 43
urbanised. However, governance levels are intermediate to low and infant mortality rates are intermediate. This cluster is mainly found in areas where forest use is integrated with agriculture in South China, India, parts of Southeast Asia, Western Africa, the plains in Ethiopia, and parts of Central America.
The predominating pressure is unsustainable intensification of agriculture due to high population pressure and poverty, with the risk of further land degradation. As most of the areas are already largely transformed towards human use, people are forced to migrate to frontier areas or cities. Poverty impacts are largely dependent on nearby agricultural possibilities and the income opportunities in cities, which largely depends on the region.
Frontier areasThe large-scale forestry development cluster has a low rural population density, but a relatively high market access. The areas are interwoven with agriculture, but there are still large forest areas. Biodiversity loss and land degradation are rather low. The agricultural plots in use are highly productive and intensively managed, while forest plantations still bear lots of biodiversity. This cluster mainly covers the temperate and boreal forest areas in the Midwest USA, Canada and Scandinavia.
The risk for overexploitation is low due to very low population pressure and the widespread availability of capital for sustainable production. Furthermore, no real forest-dependent people are living in these areas.
The frontier forest reserves cluster is largely rural with a very low population density, but relatively high market access. Land quality is relatively high, but that is not directly translated into high-scale agricultural activity. This is also indicated by the relatively low biodiversity loss and land degradation. NPP is intermediate, but low compared to the other clusters.
Governance and infant mortality are also intermediate. This cluster is mainly found in Russia and parts of South America and Central Africa.
The main pressure is the high profit opportunity for capital-driven overexploitation – high resource availability, high market access, and low governance levels – that does not necessarily benefit the local poor. The relative low inherent land quality increases the pressure of unsustainable land-use intensification by subsistence users, with further forest exploitation as a potential impact. Furthermore, the low urban fraction indicates a lack of off-farm income opportunities. Nevertheless, when managed sustainable and equitable, the high levels of resource availability also offer opportunities for poverty alleviation of subsistence users.
Forest coreThe forest reserves in industrialised countries cluster has almost no agricultural activity, low market access, almost no cities, and a very low rural population density. Although the land quality is relatively high, most areas are difficult to access, because of the cold or swamp conditions. Due to the very low level of human activity the biodiversity loss and the land degradation are very low. This cluster is mainly found in the boreal forest areas of Canada and the tropical forest areas in Australia.
The risk for overexploitation is low due to very low population pressure and market access. Furthermore, the widespread availability of capital for sustainable production decreases the pressure.
The old-growth tropical forests cluster shows very low market access, almost no cities and a very low rural population density. As a result, biodiversity loss is very low and land degradation is low. Nevertheless, for the forest core clusters, the distance to agriculture is relatively low. There are still large patches of old-growth rainforests with intermediate
Figure 4.9
Per c
apita
inco
me
Infa
nt m
orta
lity
Rur
al p
opul
atio
n de
nsity
Urb
an p
opul
atio
n fr
actio
n
Mar
ket a
cces
s
Gov
erna
nce
Dis
tanc
e to
agr
icul
ture
Inhe
rent
land
qua
lity
Net
Prim
ary
Prod
uctiv
ity
Mea
n Sp
ecie
s A
bund
ance
Land
deg
rada
tion
Forest-agriculture mosaic in highly populated areas
Highly degraded forestry-agriculture mosaic
Industrialised forestry-agriculture mosaic
Rural mosaic of pristine forest and agriculture
Vulnerability profiles for the mosaicland clustersHigh
Low
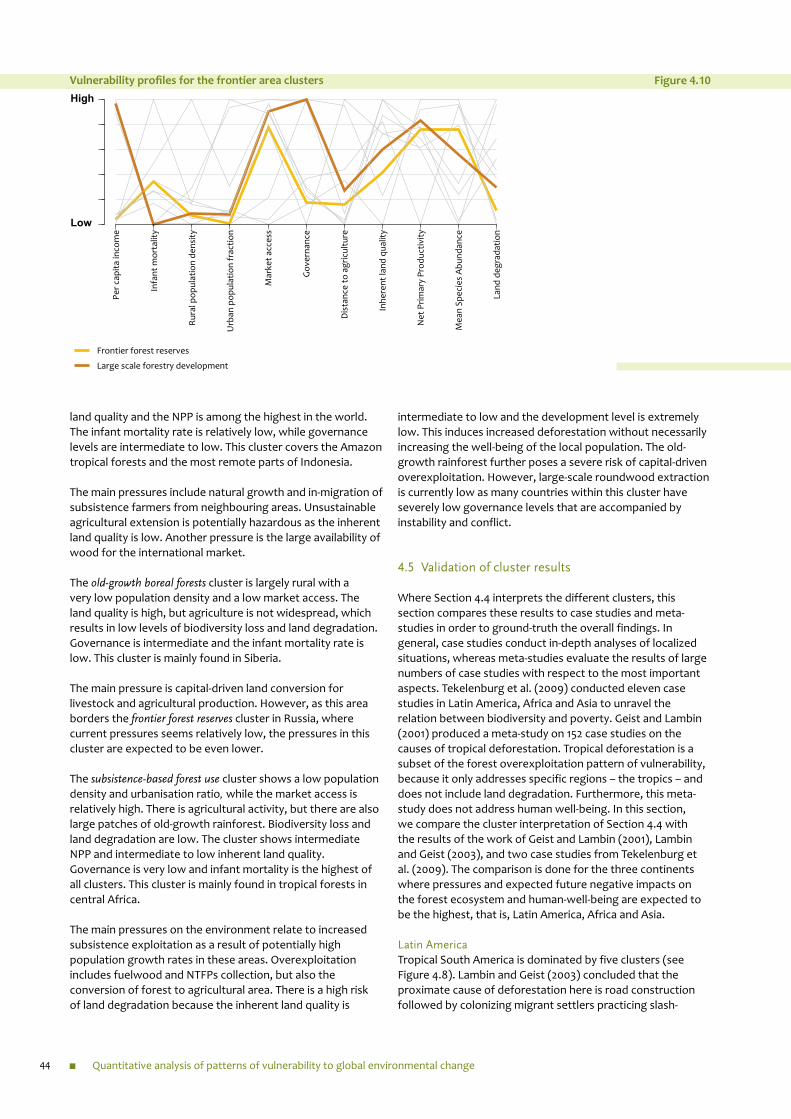
Quantitative analysis of patterns of vulnerability to global environmental change 44
land quality and the NPP is among the highest in the world. The infant mortality rate is relatively low, while governance levels are intermediate to low. This cluster covers the Amazon tropical forests and the most remote parts of Indonesia.
The main pressures include natural growth and in-migration of subsistence farmers from neighbouring areas. Unsustainable agricultural extension is potentially hazardous as the inherent land quality is low. Another pressure is the large availability of wood for the international market.
The old-growth boreal forests cluster is largely rural with a very low population density and a low market access. The land quality is high, but agriculture is not widespread, which results in low levels of biodiversity loss and land degradation. Governance is intermediate and the infant mortality rate is low. This cluster is mainly found in Siberia.
The main pressure is capital-driven land conversion for livestock and agricultural production. However, as this area borders the frontier forest reserves cluster in Russia, where current pressures seems relatively low, the pressures in this cluster are expected to be even lower.
The subsistence-based forest use cluster shows a low population density and urbanisation ratio, while the market access is relatively high. There is agricultural activity, but there are also large patches of old-growth rainforest. Biodiversity loss and land degradation are low. The cluster shows intermediate NPP and intermediate to low inherent land quality. Governance is very low and infant mortality is the highest of all clusters. This cluster is mainly found in tropical forests in central Africa.
The main pressures on the environment relate to increased subsistence exploitation as a result of potentially high population growth rates in these areas. Overexploitation includes fuelwood and NTFPs collection, but also the conversion of forest to agricultural area. There is a high risk of land degradation because the inherent land quality is
intermediate to low and the development level is extremely low. This induces increased deforestation without necessarily increasing the well-being of the local population. The old-growth rainforest further poses a severe risk of capital-driven overexploitation. However, large-scale roundwood extraction is currently low as many countries within this cluster have severely low governance levels that are accompanied by instability and conflict.
4.5 Validation of cluster results
Where Section 4.4 interprets the different clusters, this section compares these results to case studies and meta-studies in order to ground-truth the overall findings. In general, case studies conduct in-depth analyses of localized situations, whereas meta-studies evaluate the results of large numbers of case studies with respect to the most important aspects. Tekelenburg et al. (2009) conducted eleven case studies in Latin America, Africa and Asia to unravel the relation between biodiversity and poverty. Geist and Lambin (2001) produced a meta-study on 152 case studies on the causes of tropical deforestation. Tropical deforestation is a subset of the forest overexploitation pattern of vulnerability, because it only addresses specific regions – the tropics – and does not include land degradation. Furthermore, this meta-study does not address human well-being. In this section, we compare the cluster interpretation of Section 4.4 with the results of the work of Geist and Lambin (2001), Lambin and Geist (2003), and two case studies from Tekelenburg et al. (2009). The comparison is done for the three continents where pressures and expected future negative impacts on the forest ecosystem and human-well-being are expected to be the highest, that is, Latin America, Africa and Asia.
Latin AmericaTropical South America is dominated by five clusters (see Figure 4.8). Lambin and Geist (2003) concluded that the proximate cause of deforestation here is road construction followed by colonizing migrant settlers practicing slash-
Figure 4.10
Per c
apita
inco
me
Infa
nt m
orta
lity
Rur
al p
opul
atio
n de
nsity
Urb
an p
opul
atio
n fr
actio
n
Mar
ket a
cces
s
Gov
erna
nce
Dis
tanc
e to
agr
icul
ture
Inhe
rent
land
qua
lity
Net
Prim
ary
Prod
uctiv
ity
Mea
n Sp
ecie
s A
bund
ance
Land
deg
rada
tion
Frontier forest reserves
Large scale forestry development
Vulnerability profiles for the frontier area clustersHigh
Low
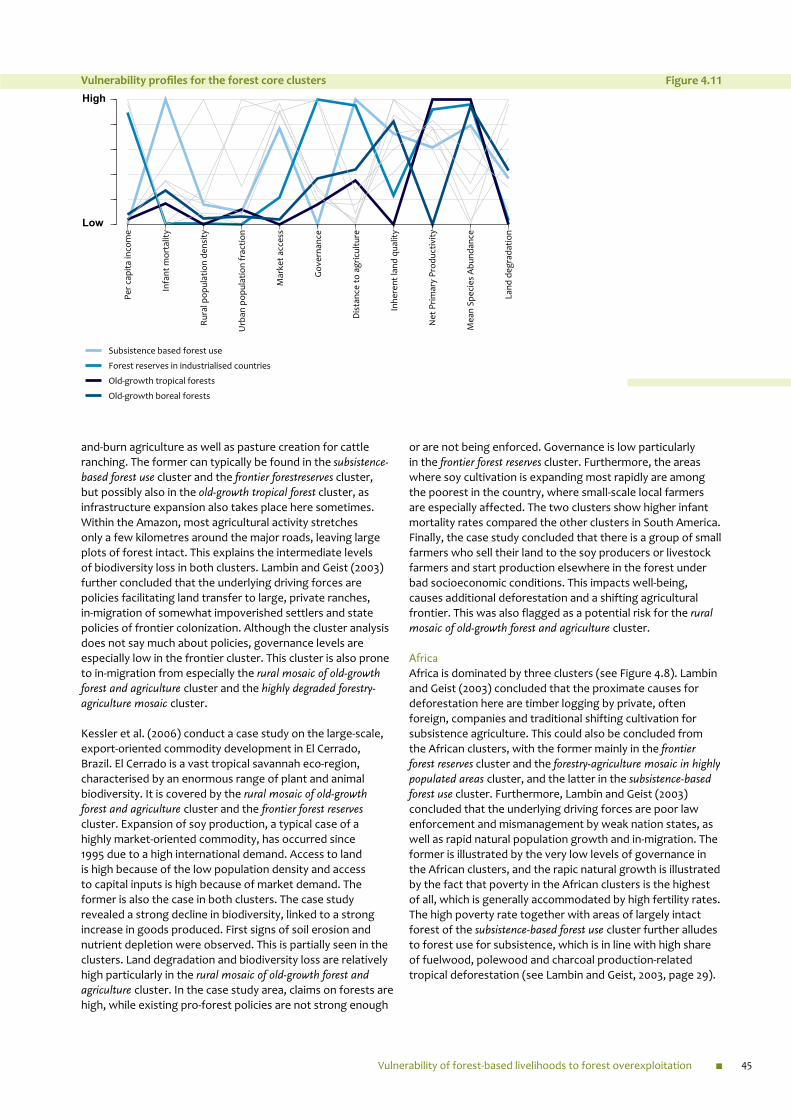
Vulnerability of forest-based livelihoods to forest overexploitation 45
and-burn agriculture as well as pasture creation for cattle ranching. The former can typically be found in the subsistence-based forest use cluster and the frontier forestreserves cluster, but possibly also in the old-growth tropical forest cluster, as infrastructure expansion also takes place here sometimes. Within the Amazon, most agricultural activity stretches only a few kilometres around the major roads, leaving large plots of forest intact. This explains the intermediate levels of biodiversity loss in both clusters. Lambin and Geist (2003) further concluded that the underlying driving forces are policies facilitating land transfer to large, private ranches, in-migration of somewhat impoverished settlers and state policies of frontier colonization. Although the cluster analysis does not say much about policies, governance levels are especially low in the frontier cluster. This cluster is also prone to in-migration from especially the rural mosaic of old-growth forest and agriculture cluster and the highly degraded forestry-agriculture mosaic cluster.
Kessler et al. (2006) conduct a case study on the large-scale, export-oriented commodity development in El Cerrado, Brazil. El Cerrado is a vast tropical savannah eco-region, characterised by an enormous range of plant and animal biodiversity. It is covered by the rural mosaic of old-growth forest and agriculture cluster and the frontier forest reserves cluster. Expansion of soy production, a typical case of a highly market-oriented commodity, has occurred since 1995 due to a high international demand. Access to land is high because of the low population density and access to capital inputs is high because of market demand. The former is also the case in both clusters. The case study revealed a strong decline in biodiversity, linked to a strong increase in goods produced. First signs of soil erosion and nutrient depletion were observed. This is partially seen in the clusters. Land degradation and biodiversity loss are relatively high particularly in the rural mosaic of old-growth forest and agriculture cluster. In the case study area, claims on forests are high, while existing pro-forest policies are not strong enough
or are not being enforced. Governance is low particularly in the frontier forest reserves cluster. Furthermore, the areas where soy cultivation is expanding most rapidly are among the poorest in the country, where small-scale local farmers are especially affected. The two clusters show higher infant mortality rates compared the other clusters in South America. Finally, the case study concluded that there is a group of small farmers who sell their land to the soy producers or livestock farmers and start production elsewhere in the forest under bad socioeconomic conditions. This impacts well-being, causes additional deforestation and a shifting agricultural frontier. This was also flagged as a potential risk for the rural mosaic of old-growth forest and agriculture cluster.
AfricaAfrica is dominated by three clusters (see Figure 4.8). Lambin and Geist (2003) concluded that the proximate causes for deforestation here are timber logging by private, often foreign, companies and traditional shifting cultivation for subsistence agriculture. This could also be concluded from the African clusters, with the former mainly in the frontier forest reserves cluster and the forestry-agriculture mosaic in highly populated areas cluster, and the latter in the subsistence-based forest use cluster. Furthermore, Lambin and Geist (2003) concluded that the underlying driving forces are poor law enforcement and mismanagement by weak nation states, as well as rapid natural population growth and in-migration. The former is illustrated by the very low levels of governance in the African clusters, and the rapic natural growth is illustrated by the fact that poverty in the African clusters is the highest of all, which is generally accommodated by high fertility rates. The high poverty rate together with areas of largely intact forest of the subsistence-based forest use cluster further alludes to forest use for subsistence, which is in line with high share of fuelwood, polewood and charcoal production-related tropical deforestation (see Lambin and Geist, 2003, page 29).
Figure 4.11
Per c
apita
inco
me
Infa
nt m
orta
lity
Rur
al p
opul
atio
n de
nsity
Urb
an p
opul
atio
n fr
actio
n
Mar
ket a
cces
s
Gov
erna
nce
Dis
tanc
e to
agr
icul
ture
Inhe
rent
land
qua
lity
Net
Prim
ary
Prod
uctiv
ity
Mea
n Sp
ecie
s A
bund
ance
Land
deg
rada
tion
Subsistence based forest use
Forest reserves in industrialised countries
Old-growth tropical forests
Old-growth boreal forests
Vulnerability profiles for the forest core clustersHigh
Low
Quantitative analysis of patterns of vulnerability to global environmental change 46
AsiaSoutheast Asia is dominated by three clusters (see Figure 4.8). Lambin and Geist (2003) concluded the proximate cause of deforestation here are private and state-run commercial (often illegal) timber logging, swidden agriculture in uplands, and permanent agriculture (plantations) in lowlands. The first and second causes are typically associated with the old-growth tropical forest cluster in the Indonesian rainforests, with large stocks of valuable intact forests and a low population density. The second and third causes are mainly associated with the rural mosaic of old-growth forest and agriculture clusters and the forestry-agriculture mosaic in highly populated areas cluster, respectively. The former cluster has a lower population density and still some old-growth forest for swidden agriculture, while the cluster is almost fully inhabited. The former cluster also has a higher infant mortality rate than the latter, which is more often associated with swidden agriculture. Lambin and Geist (2003) further conclude that the underlying driving forces are policies facilitating colonization and state plantations, large transmigration projects, corruption, weak enforcement of forestry law, and insecure land ownership. Again, specific policies are not addressed in this analysis. Here, corruption, weak enforcement of forestry law and insecure land ownership relates to the relatively low levels of governance in the three clusters mentioned.
Truong Quang Hoc (2006) conducted a case study on the collapse of shifting cultivation and failing government intervention that causes overexploitation of natural forests in Dakrong, Vietnam. It mainly covers the rural mosaic of old-growth forest and agriculture cluster. There is a tension between protected area management and traditional livelihoods of ethnic minorities. The population of ethnic minorities increases rapidly. They are subsistence-based and pursue different livelihood strategies: a mix of shifting cultivation, forest use and farming on small plots of low productivity paddy rice. Hunting is a popular activity as a way of obtaining more food and protecting crops against damage by game. In 2002, the province implemented a development plan that focused on strict protection of the forest and intensification of agriculture. However, as a result, the forest cover increased, while the overall forest quality decreased. Human well-being indicators for food production, healthcare and education showed a positive trend. However, the standard of living in Dakrong District was low compared with the national average, and the gap was not closing. People who depended on the collapsed shifting cultivation system for their livelihood became increasingly dependent on gathering in the common forests. The question is how much time it will take when income from forest use will drop because of overexploitation.
4.6 Conclusions
Worldwide, more than 1.6 billion people depend to varying degrees on forests for their livelihoods. At the same time, global demand for wood and agricultural products puts increased pressure on the forest resources, affecting the people who are most dependent on them. Using mostly meta-studies, the basic vulnerability creating mechanisms behind the vulnerability of forest-based livelihoods due
to forest overexploitation was formalised and indicated with a set of eleven indicators that describe the most relevant elements and relations of the vulnerability creating mechanisms. Applying an established cluster analysis, a set of ten clearly distinguishable clusters or vulnerability profiles was obtained, mainly formed due to differences in market access, urbanisation, income levels, and land degradation. Differences in the level of agricultural intensity, population density, and the net primary productivity also play some role of importance.
Within these three forest typologies, each cluster revealed its own challenges and opportunities related to the local population’s vulnerability to environmental and socioeconomic changes with market access, population density, human well-being, and current practices playing a prominent role. Interpretation was conducted in line with three distinguishable stylised forest typologies – mosaiclands, frontier areas and forest core –characterised by their land-use intensity, that is, agricultural density and biodiversity impacts.
Within the mosaiclands, the situation is most pressing in areas with very high population densities, low to intermediate levels of human-well-being and severe levels of overexploitation of soil and forest resources. In already highly degraded areas, uncontrolled capital-driven overexploitation might further increase environmental stress without necessarily improving the well-being situation of the local population. For the frontier areas, governance levels are the lowest of the three typologies. Subsistence-based forest use in areas with intermediate to low land quality poses a severe challenge for sustainable resource management. Low levels of governance increase the risk of capital-driven overexploitation. For the forest core, the situation is worst in tropical forests that already suffer from large-scale wood extraction and boreal forests that already include agricultural areas with increased land degradation.
The ground-truthing showed that many of the characteristics of the vulnerability patterns are also found in the case studies and the meta-studies. Nevertheless, the case studies added some extra insights, especially with respect to policies and governance, which were the most difficult and only partly covered aspects in our indicator-based analysis. Furthermore, the comparison shows that the individual clusters are not uniform, and that local dynamics still have their individual characteristics. In both South America and in South-East Asia the old-growth tropical forests cluster was found, with severe risk for capital-driven overexploitation. However, where overexploitation in South Asia was triggered by agricultural demand, in South-East Asia this was triggered by wood demand. Also here, policies and governance seem to be the most distinguishing factors.
Though it is not part of this report, in light of the vulnerability creating mechanisms, the interpretation of the vulnerability profiles alludes to cluster-specific policy options. For OECD countries the risk for overexploitation has largely disappeared, partly due to more sustainable production and partly due to increased imports from other countries.
Vulnerability of forest-based livelihoods to forest overexploitation 47
In mosaiclands in developing countries the main vulnerabilities are related to unsustainable land-use intensification, already severe overexploitation of the soil and forest resources and low governance levels. To decrease vulnerability, policies should promote off-farm income opportunities, as well as improved resource management.
In the frontier areas in developing countries the governance level is the lowest of the three forest typologies. As there are still vast areas with exploitable wood and soil resources, strengthening land tenure and forest protection could overcome the risk of large-scale capital-driven overexploitation. However, the frontier areas offer opportunities for poverty alleviation if land-use intensification takes place in a sustainable way.
The forest core in developing countries is not yet fully confronted with large-scale overexploitation, although the inherent risks are high. The clusters include vast areas with highly valuable old-growth forest, while the already existing agricultural areas show increased land degradation. Furthermore, the cluster offers opportunities to improve the human well-being situation of subsistence users, for example by creating markets in environmental services. However, without improving the level of governance, the forest core might turn into a frontier area. Furthermore, the clusters are threatened by the neighbouring frontier areas potentially moving into the old-growth forest as the demand for wood and agricultural products increases. Therefore, large-scale infrastructure expansion that makes exploitation easier as well as disruptive races for property rights should be avoided.

Quantitative analysis of patterns of vulnerability to global environmental change 48
Vulnerability of rural livelihoods due to competition for land for food and biofuels 49
In this chapter, we investigate the vulnerability of rural livelihoods due to competition for land for food and biofuels. This pattern of vulnerability is defined The pattern of vulnerability is mainly characterised by the increased pressure put on vast areas worldwide that are potentially suitable for cultivating food and biofuels, and the pressure put on ecosystems and the populations dependent on them, as a result of a booming global biofuel market. It is furthermore defined by what influences potential negative trade-offs between crop cultivation for biofuels and food security. Together, these circumstances can put the people dependent on natural resources into a poverty trap by increasing food insecurity, decreasing ecosystem services, and further cutting them off from profits, thereby increasing their vulnerability.
5.1 Vulnerability creating mechanisms
The spatial focus of this analysis is on the medium-scale trade-offs through the local convergence of energy demands with the production or potential production of biofuel crops and food. The topical focus is on how effects would increase vulnerability of rural livelihoods to subsequent socioecological stresses with regard to human well-being in potential cultivation areas.
This pattern of vulnerability is characterised by the vast global area in which its mechanism can potentially take effect, in addition to biofuel crop production’s land-intensiveness (Rajagopal and Zilberman, 2007). In theory, the dual demand increase for food and bioenergy can have future ramifications on all areas with first-generation liquid biofuel growth potential. These areas far outstretch currently tilled agricultural land for respective crops such as maize, sugar cane, and palm oil, and cover vast extents in all continents, except of course Antarctica. They include the most fertile and densely populated regions in the world, and virtually
all currently untouched tropical rain forests in Africa, South America, and Asia. At the same time, very large amounts of land required for making a significant contribution to fulfil global demand would put further pressure on forests and grassland worldwide (Righelato and Spracklen, 2007). Meeting the former EU directive of a ten per cent share for energy from renewable sources in transport with first-generation technologies would take up 20–30 million hectares alone (Eickhout, 2008).
With respect to food security, local resource-dependent livelihoods that are on or adjacent to food crop land may be affected if that land has a reasonable potential of future use for cultivating biofuel crops. Consequently, human well-being may be also affected. Furthermore, the competition over land and resources mainly takes place in areas suitable or potentially suitable for both cultivating crops for liquid biofuels and cultivating food commodities for food end use; keeping in mind the fact that resources can also be drawn from adjacent areas. This chapter explores when and the extent to which these two situations converge, as well as what the consequences will be for rural livelihoods.
Liquid biofuels is the fastest growing segment of the world bioenergy market (FAO, 2007). Global production of biofuels has doubled in the past five years, and it is expected to do the same in the next four years. A sweeping increase in biofuel demand and its assumed beneficial effect on Greenhouse Gas (GHG) balances are tied to resounding concerns about its impacts on food security, which is in itself under pressure from growing populations’ food demands (Elobeid and Hart, 2007). For example, during the dramatic increase of maize and wheat-based ethanol production in the United States in 2006, world corn prices increased by more than 50 per cent (Elobeid and Hart, 2007). Nevertheless, impacts of biofuels on food security are difficult to measure accurately, and there are only few studies that quantify them (Eickhout, 2008).
Vulnerability of rural livelihoods due to competition for land for food and biofuels
5
Quantitative analysis of patterns of vulnerability to global environmental change 50
Unless noted otherwise, first-generation liquid biofuels from food crops for transportation end use1 are the biofuels this pattern of vulnerability focuses on because they are most prominently related to food security issues, and to means for meeting national renewable biofuel targets in industrialised countries (EEA, 2006; EEA, 2007). However, the general processes analyzed are more broadly applicable and should eventually be transferable to identify vulnerability patterns related to agricultural commodity trade.
How the global increases in demand are handled can open windows of opportunity and become pitfalls of risks for human well-being on local, intermediate, and international levels (FAO, 2007; van Vuuren et al., 2008). This is exemplified in how the growing demand for liquid biofuels has caused prices for staple foods from sugar cane, maize, soybean, rapeseed oil, and palm oil to rise: these are all major liquid biofuel feedstock crops (Caeasar et al., 2007; FAO, 2007; UNenergy, 2007).
This convergence of rising demands and production affects people, either by choice or because of dependency, on various scales that stretch beyond food security issues. On local to intermediate scales, food security, land-use and distribution on the limited land available, but also energy distribution and pricing, ecosystem services, and rural development are subject to changes. This does not contradict reports of large-scale biofuel crop production having significantly increased rural development and human well-being (Schmidhuber, 2006; FAO, 2007).
Effects are also in practice on an international to global scale. For example, biofuel crops are often cultivated for the purpose of export (Kok and Hilderink, 2007). A country’s ambition to of establishing itself on a global biofuel market is co-determined by its energy and food imports with respect to its own consumption.
These effects on different scales interconnect. This is illustrated by countries that have ambitious targets of establishing biofuels in their national fuel mix by importing biofuels, while exporting vulnerabilities related to biofuel crop cultivation to countries with greater sensitivity towards them (EEA, 2006).
While the focus is on the areas where rising demand and (potential) production converge, the various scales of effect and interplay between them in this pattern of vulnerability are mirrored in the following sections on the vulnerability
creating mechanism and indication thereof in this pattern of vulnerability.
Thus, the vulnerability creating mechanism is co-determined by the trade-offs between beneficial and detrimental local effects in biofuel crop exporting countries.
In the following paragraphs, we describe the storyline of vulnerability creating mechanisms and systematize it using an influence diagram (see Figure 5.1). This provides the basis from which to choose indicators for depicting the present situation.
Summarily, the emerging global market for liquid biofuels and the demand for them are driven by the needs of countries to depart from oil dependency, to improve energy security, to diversify their energy mix, and to mitigate greenhouse gas emissions in an effort to avoid dangerous climate change (Elobeid and Hart, 2007; Righelato and Spracklen, 2007; Lysen et al., 2008).
This means the following for liquid biofuels used for transportation: While both pricing and price volatility of oil increase (Elobeid and Hart, 2007), and rising motorization is demanding higher energy input, so is the need for a more diversified energy mix to obtain further independence from oil. As a result, different motives are currently compounding into ambitious national policy targets worldwide to cover a significant amount of the fuels for transportation with liquid biofuels (Eickhout, 2008; van Vuuren et al., 2008), with only some countries stepping back from this energy path.
At the same time, and often in the same place, the demand for food is increasing as well. A growing population and changing dietary habits are increasing the worldwide demand for the same staple food crops from which liquid biofuel is produced. This is putting more pressure on local or regional limits to food security, and potentially overstretching them on top of regionally decreasing productivity due to overuse.
Demands for biofuels and food are tightly linked because they are dependent the same crops and on accessible natural resources. Biofuel crop expansion, and ethanol expansion in particular, would result in direct linkages between what happens in the energy markets and food security, thereby increasing floor prices and even uncertainty in global agricultural markets (Schmidhuber and Shetty, 2005; Schmidhuber, 2006; Elobeid and Hart, 2007). Since solely intensifying production is insufficient to cover the rising demands for biofuels and food alike, competition over land resources is a necessary consequence: the land suitable for cultivating end uses from both liquid biofuel crops and food commodities is the terrain where competition will predominantly occur. This entails strong dependencies on both natural resources (soil quality, climate, water availability) and developmental factors (technological advancement, know-how, seed quality). Such substantial yield changes are induced by capital investments or technological improvements.
Large-scale land-use alterations may be necessary to satisfy the demand for liquid biofuels – including resource and
1 In this context, they refer to transportation fuels derived from biomass.
It is currently the medium of choice for meeting targets of the massively
increasing rate of biofuels contributing to national and transnational
energy mixes. Rising biofuel crop production that potentially alters food
security is vastly attributed to liquid biofuels, because they rely strongly
on feedstock from food crops. In this archetype, the focus is on first-
generation biofuels. They rely solely on food crops, and commercially
available and commercially viable techniques (as opposed to second-
generation biofuels). Biofuels are fuels derived from biomass, which can be
in solid, liquid, or gaseous states (Rajagopal and Zilberman, 2007).
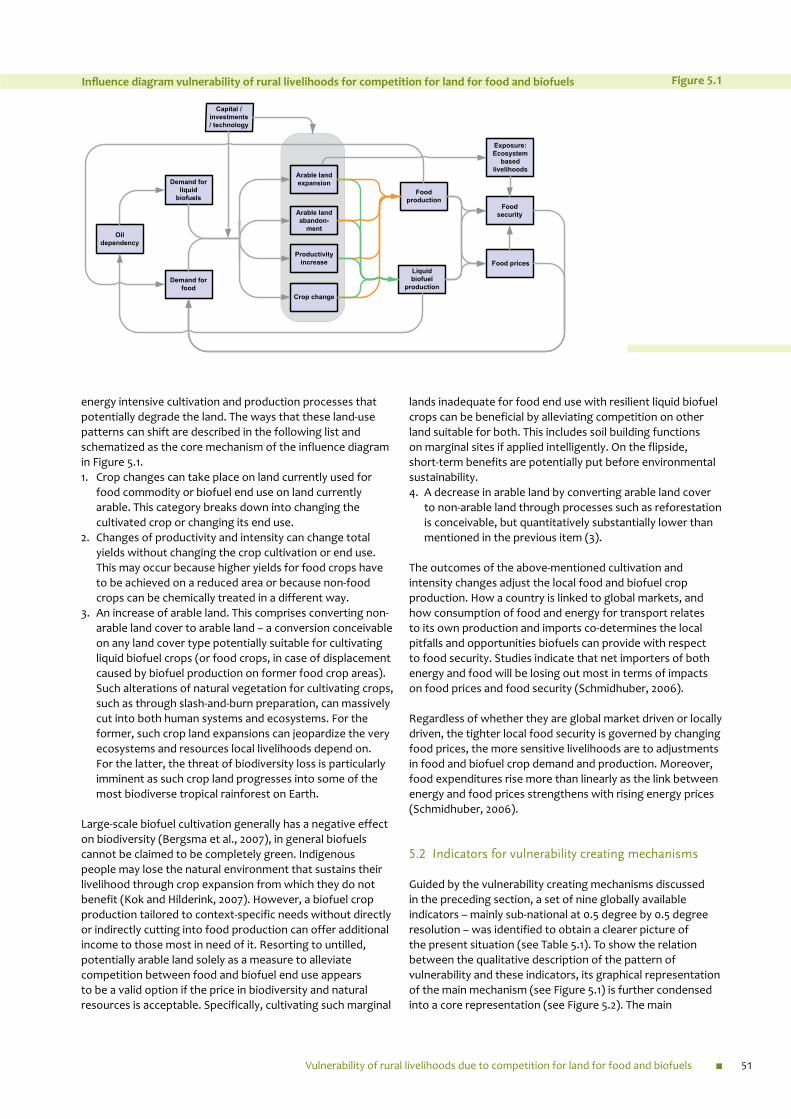
Vulnerability of rural livelihoods due to competition for land for food and biofuels 51
energy intensive cultivation and production processes that potentially degrade the land. The ways that these land-use patterns can shift are described in the following list and schematized as the core mechanism of the influence diagram in Figure 5.1.1. Crop changes can take place on land currently used for
food commodity or biofuel end use on land currently arable. This category breaks down into changing the cultivated crop or changing its end use.
2. Changes of productivity and intensity can change total yields without changing the crop cultivation or end use. This may occur because higher yields for food crops have to be achieved on a reduced area or because non-food crops can be chemically treated in a different way.
3. An increase of arable land. This comprises converting non-arable land cover to arable land – a conversion conceivable on any land cover type potentially suitable for cultivating liquid biofuel crops (or food crops, in case of displacement caused by biofuel production on former food crop areas). Such alterations of natural vegetation for cultivating crops, such as through slash-and-burn preparation, can massively cut into both human systems and ecosystems. For the former, such crop land expansions can jeopardize the very ecosystems and resources local livelihoods depend on. For the latter, the threat of biodiversity loss is particularly imminent as such crop land progresses into some of the most biodiverse tropical rainforest on Earth.
Large-scale biofuel cultivation generally has a negative effect on biodiversity (Bergsma et al., 2007), in general biofuels cannot be claimed to be completely green. Indigenous people may lose the natural environment that sustains their livelihood through crop expansion from which they do not benefit (Kok and Hilderink, 2007). However, a biofuel crop production tailored to context-specific needs without directly or indirectly cutting into food production can offer additional income to those most in need of it. Resorting to untilled, potentially arable land solely as a measure to alleviate competition between food and biofuel end use appears to be a valid option if the price in biodiversity and natural resources is acceptable. Specifically, cultivating such marginal
lands inadequate for food end use with resilient liquid biofuel crops can be beneficial by alleviating competition on other land suitable for both. This includes soil building functions on marginal sites if applied intelligently. On the flipside, short-term benefits are potentially put before environmental sustainability.4. A decrease in arable land by converting arable land cover
to non-arable land through processes such as reforestation is conceivable, but quantitatively substantially lower than mentioned in the previous item (3).
The outcomes of the above-mentioned cultivation and intensity changes adjust the local food and biofuel crop production. How a country is linked to global markets, and how consumption of food and energy for transport relates to its own production and imports co-determines the local pitfalls and opportunities biofuels can provide with respect to food security. Studies indicate that net importers of both energy and food will be losing out most in terms of impacts on food prices and food security (Schmidhuber, 2006).
Regardless of whether they are global market driven or locally driven, the tighter local food security is governed by changing food prices, the more sensitive livelihoods are to adjustments in food and biofuel crop demand and production. Moreover, food expenditures rise more than linearly as the link between energy and food prices strengthens with rising energy prices (Schmidhuber, 2006).
5.2 Indicators for vulnerability creating mechanisms
Guided by the vulnerability creating mechanisms discussed in the preceding section, a set of nine globally available indicators – mainly sub-national at 0.5 degree by 0.5 degree resolution – was identified to obtain a clearer picture of the present situation (see Table 5.1). To show the relation between the qualitative description of the pattern of vulnerability and these indicators, its graphical representation of the main mechanism (see Figure 5.1) is further condensed into a core representation (see Figure 5.2). The main
Figure 5.1Influence diagram vulnerability of rural livelihoods for competition for land for food and biofuels
Oil dependency
Demand for liquid
biofuels
Demand for food
Liquid biofuel
production
Food production
Food security
Food prices
Exposure:Ecosystem
basedlivelihoods
Capital / investments/ technology
Arable land expansion
Arable land abandon-
ment
Crop change
Productivity increase
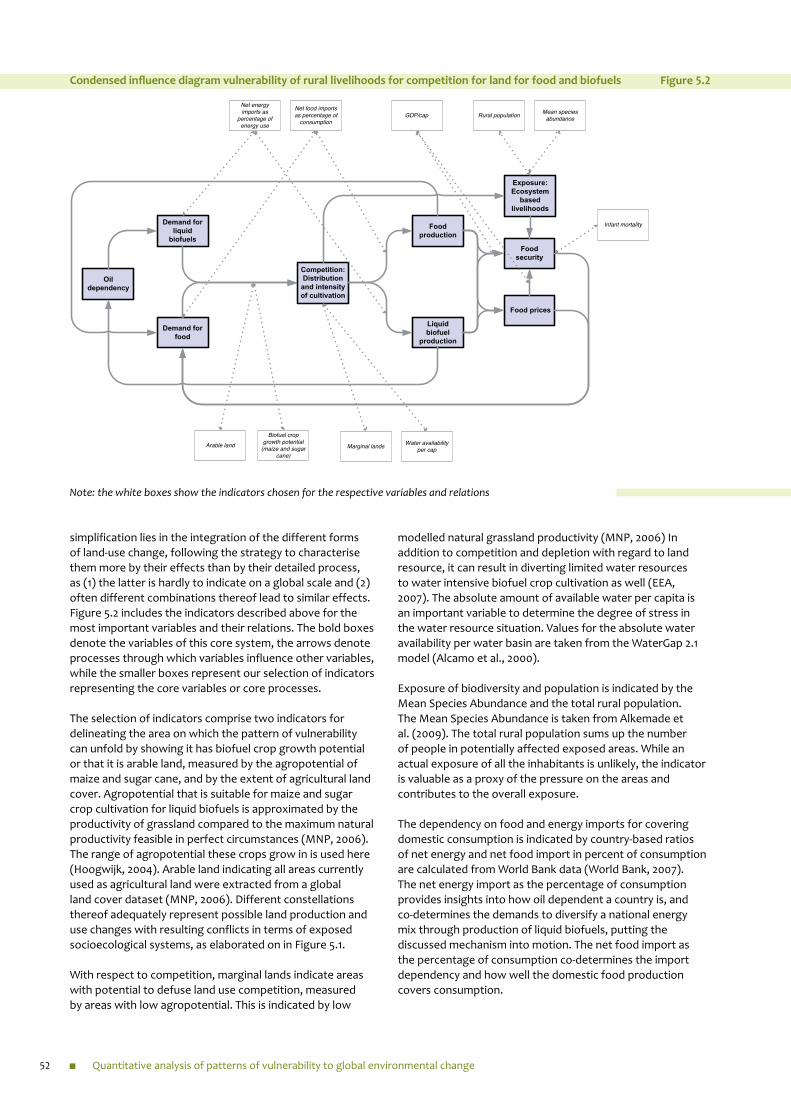
Quantitative analysis of patterns of vulnerability to global environmental change 52
simplification lies in the integration of the different forms of land-use change, following the strategy to characterise them more by their effects than by their detailed process, as (1) the latter is hardly to indicate on a global scale and (2) often different combinations thereof lead to similar effects. Figure 5.2 includes the indicators described above for the most important variables and their relations. The bold boxes denote the variables of this core system, the arrows denote processes through which variables influence other variables, while the smaller boxes represent our selection of indicators representing the core variables or core processes.
The selection of indicators comprise two indicators for delineating the area on which the pattern of vulnerability can unfold by showing it has biofuel crop growth potential or that it is arable land, measured by the agropotential of maize and sugar cane, and by the extent of agricultural land cover. Agropotential that is suitable for maize and sugar crop cultivation for liquid biofuels is approximated by the productivity of grassland compared to the maximum natural productivity feasible in perfect circumstances (MNP, 2006). The range of agropotential these crops grow in is used here (Hoogwijk, 2004). Arable land indicating all areas currently used as agricultural land were extracted from a global land cover dataset (MNP, 2006). Different constellations thereof adequately represent possible land production and use changes with resulting conflicts in terms of exposed socioecological systems, as elaborated on in Figure 5.1.
With respect to competition, marginal lands indicate areas with potential to defuse land use competition, measured by areas with low agropotential. This is indicated by low
modelled natural grassland productivity (MNP, 2006) In addition to competition and depletion with regard to land resource, it can result in diverting limited water resources to water intensive biofuel crop cultivation as well (EEA, 2007). The absolute amount of available water per capita is an important variable to determine the degree of stress in the water resource situation. Values for the absolute water availability per water basin are taken from the WaterGap 2.1 model (Alcamo et al., 2000).
Exposure of biodiversity and population is indicated by the Mean Species Abundance and the total rural population. The Mean Species Abundance is taken from Alkemade et al. (2009). The total rural population sums up the number of people in potentially affected exposed areas. While an actual exposure of all the inhabitants is unlikely, the indicator is valuable as a proxy of the pressure on the areas and contributes to the overall exposure.
The dependency on food and energy imports for covering domestic consumption is indicated by country-based ratios of net energy and net food import in percent of consumption are calculated from World Bank data (World Bank, 2007). The net energy import as the percentage of consumption provides insights into how oil dependent a country is, and co-determines the demands to diversify a national energy mix through production of liquid biofuels, putting the discussed mechanism into motion. The net food import as the percentage of consumption co-determines the import dependency and how well the domestic food production covers consumption.
Note: the white boxes show the indicators chosen for the respective variables and relations
Figure 5.2Condensed influence diagram vulnerability of rural livelihoods for competition for land for food and biofuels
Oil dependency
Demand for liquid
biofuels
Demand for food
Liquid biofuel
production
Food production
Food security
Food prices
Exposure: Ecosystem
basedlivelihoods
Net energy imports as
percentage of energy use
GDP/cap
Biofuel cropgrowth potential
(maize and sugar cane)
Infant mortality
Marginal lands Water availability per cap
Arable land
Competition:Distribution
and intensity of cultivation
Mean species abundanceRural population
Net food importsas percentage of
consumption
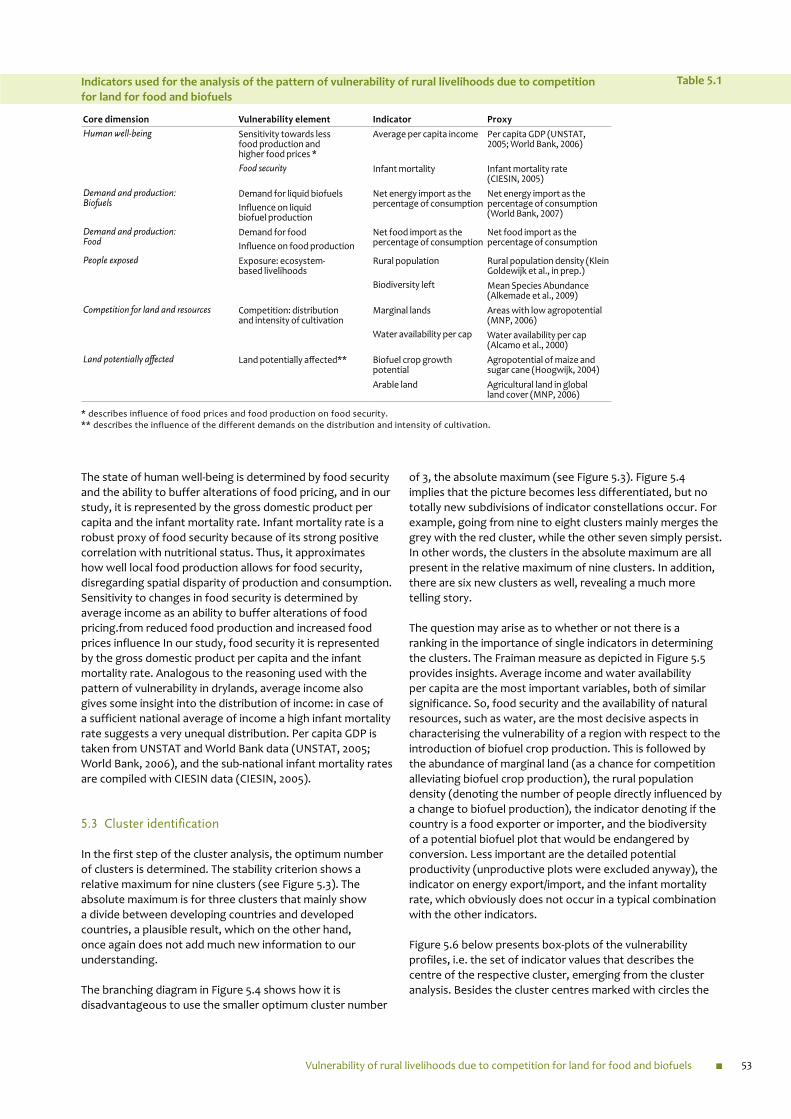
Vulnerability of rural livelihoods due to competition for land for food and biofuels 53
The state of human well-being is determined by food security and the ability to buffer alterations of food pricing, and in our study, it is represented by the gross domestic product per capita and the infant mortality rate. Infant mortality rate is a robust proxy of food security because of its strong positive correlation with nutritional status. Thus, it approximates how well local food production allows for food security, disregarding spatial disparity of production and consumption. Sensitivity to changes in food security is determined by average income as an ability to buffer alterations of food pricing.from reduced food production and increased food prices influence In our study, food security it is represented by the gross domestic product per capita and the infant mortality rate. Analogous to the reasoning used with the pattern of vulnerability in drylands, average income also gives some insight into the distribution of income: in case of a sufficient national average of income a high infant mortality rate suggests a very unequal distribution. Per capita GDP is taken from UNSTAT and World Bank data (UNSTAT, 2005; World Bank, 2006), and the sub-national infant mortality rates are compiled with CIESIN data (CIESIN, 2005).
5.3 Cluster identification
In the first step of the cluster analysis, the optimum number of clusters is determined. The stability criterion shows a relative maximum for nine clusters (see Figure 5.3). The absolute maximum is for three clusters that mainly show a divide between developing countries and developed countries, a plausible result, which on the other hand, once again does not add much new information to our understanding.
The branching diagram in Figure 5.4 shows how it is disadvantageous to use the smaller optimum cluster number
of 3, the absolute maximum (see Figure 5.3). Figure 5.4 implies that the picture becomes less differentiated, but no totally new subdivisions of indicator constellations occur. For example, going from nine to eight clusters mainly merges the grey with the red cluster, while the other seven simply persist. In other words, the clusters in the absolute maximum are all present in the relative maximum of nine clusters. In addition, there are six new clusters as well, revealing a much more telling story.
The question may arise as to whether or not there is a ranking in the importance of single indicators in determining the clusters. The Fraiman measure as depicted in Figure 5.5 provides insights. Average income and water availability per capita are the most important variables, both of similar significance. So, food security and the availability of natural resources, such as water, are the most decisive aspects in characterising the vulnerability of a region with respect to the introduction of biofuel crop production. This is followed by the abundance of marginal land (as a chance for competition alleviating biofuel crop production), the rural population density (denoting the number of people directly influenced by a change to biofuel production), the indicator denoting if the country is a food exporter or importer, and the biodiversity of a potential biofuel plot that would be endangered by conversion. Less important are the detailed potential productivity (unproductive plots were excluded anyway), the indicator on energy export/import, and the infant mortality rate, which obviously does not occur in a typical combination with the other indicators.
Figure 5.6 below presents box-plots of the vulnerability profiles, i.e. the set of indicator values that describes the centre of the respective cluster, emerging from the cluster analysis. Besides the cluster centres marked with circles the
Indicators used for the analysis of the pattern of vulnerability of rural livelihoods due to competition for land for food and biofuels
Core dimension Vulnerability element Indicator ProxyHuman well-being Sensitivity towards less
food production and higher food prices *
Average per capita income Per capita GDP (UNSTAT, 2005; World Bank, 2006)
Food security Infant mortality Infant mortality rate (CIESIN, 2005)
Demand and production:Biofuels
Demand for liquid biofuels Net energy import as the percentage of consumption
Net energy import as the percentage of consumption (World Bank, 2007)
Influence on liquid biofuel production
Demand and production:Food
Demand for food Net food import as the percentage of consumption
Net food import as the percentage of consumption Influence on food production
People exposed Exposure: ecosystem-based livelihoods
Rural population Rural population density (Klein Goldewijk et al., in prep.)
Biodiversity left Mean Species Abundance (Alkemade et al., 2009)
Competition for land and resources Competition: distribution and intensity of cultivation
Marginal lands Areas with low agropotential (MNP, 2006)
Water availability per cap Water availability per cap (Alcamo et al., 2000)
Land potentially affected Land potentially affected** Biofuel crop growth potential
Agropotential of maize and sugar cane (Hoogwijk, 2004)
Arable land Agricultural land in global land cover (MNP, 2006)
* describes influence of food prices and food production on food security.** describes the influence of the different demands on the distribution and intensity of cultivation.
Table 5.1
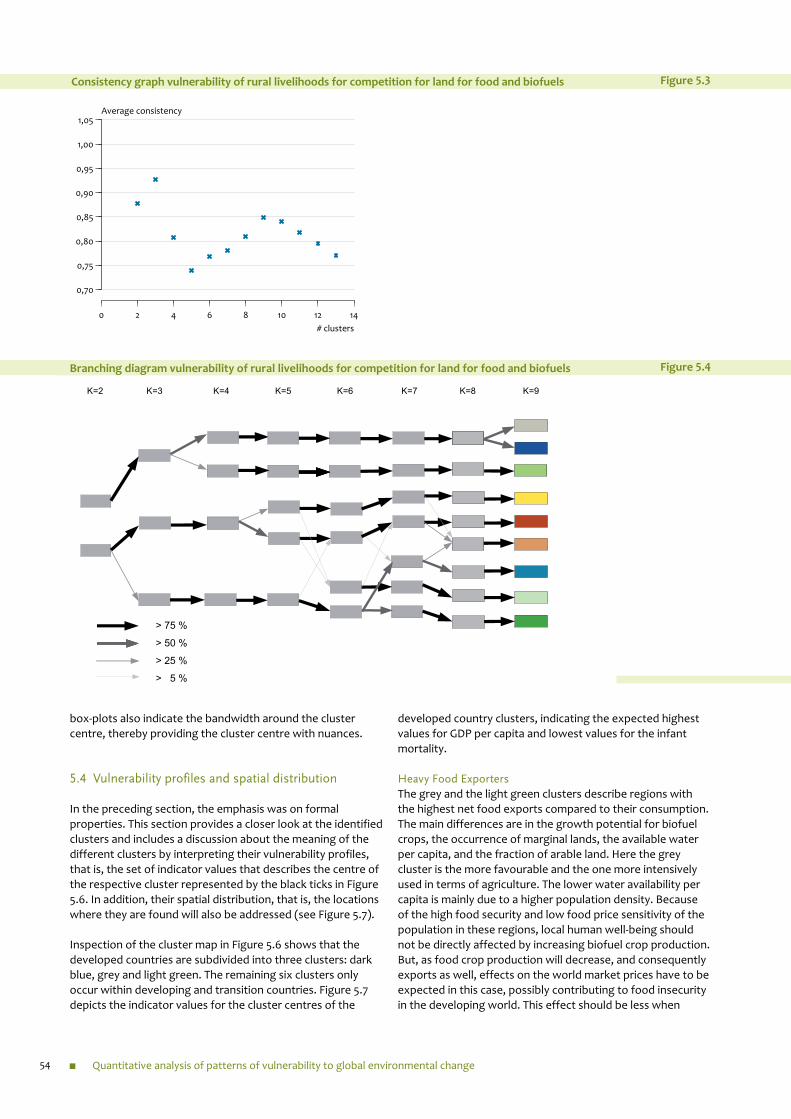
Quantitative analysis of patterns of vulnerability to global environmental change 54
box-plots also indicate the bandwidth around the cluster centre, thereby providing the cluster centre with nuances.
5.4 Vulnerability profiles and spatial distribution
In the preceding section, the emphasis was on formal properties. This section provides a closer look at the identified clusters and includes a discussion about the meaning of the different clusters by interpreting their vulnerability profiles, that is, the set of indicator values that describes the centre of the respective cluster represented by the black ticks in Figure 5.6. In addition, their spatial distribution, that is, the locations where they are found will also be addressed (see Figure 5.7).
Inspection of the cluster map in Figure 5.6 shows that the developed countries are subdivided into three clusters: dark blue, grey and light green. The remaining six clusters only occur within developing and transition countries. Figure 5.7 depicts the indicator values for the cluster centres of the
developed country clusters, indicating the expected highest values for GDP per capita and lowest values for the infant mortality.
Heavy Food ExportersThe grey and the light green clusters describe regions with the highest net food exports compared to their consumption. The main differences are in the growth potential for biofuel crops, the occurrence of marginal lands, the available water per capita, and the fraction of arable land. Here the grey cluster is the more favourable and the one more intensively used in terms of agriculture. The lower water availability per capita is mainly due to a higher population density. Because of the high food security and low food price sensitivity of the population in these regions, local human well-being should not be directly affected by increasing biofuel crop production. But, as food crop production will decrease, and consequently exports as well, effects on the world market prices have to be expected in this case, possibly contributing to food insecurity in the developing world. This effect should be less when
Figure 5.3
0 2 4 6 8 10 12 14# clusters
0,70
0,75
0,80
0,85
0,90
0,95
1,00
1,05Average consistency
Consistency graph vulnerability of rural livelihoods for competition for land for food and biofuels
Figure 5.4Branching diagram vulnerability of rural livelihoods for competition for land for food and biofuels
K=2 K=3 K=4 K=5 K=6 K=7 K=8 K=9
> 75 %
> 50 %
> 25 %
> 5 %
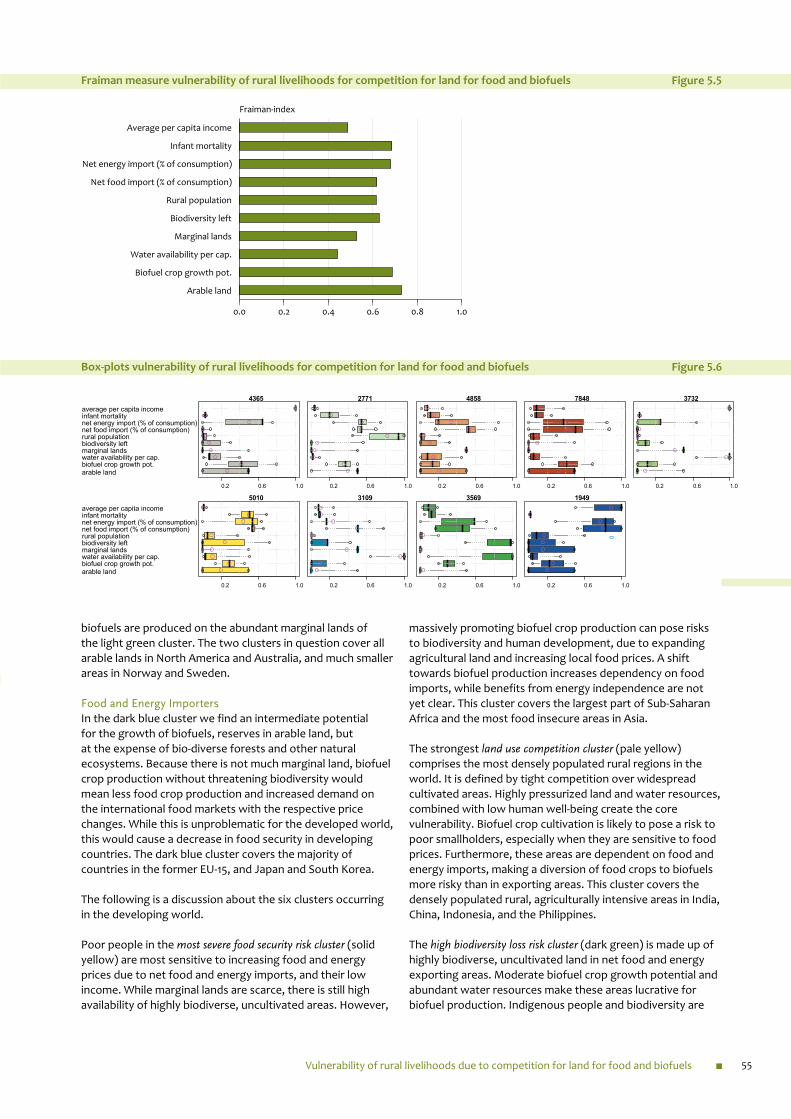
Vulnerability of rural livelihoods due to competition for land for food and biofuels 55
biofuels are produced on the abundant marginal lands of the light green cluster. The two clusters in question cover all arable lands in North America and Australia, and much smaller areas in Norway and Sweden.
Food and Energy ImportersIn the dark blue cluster we find an intermediate potential for the growth of biofuels, reserves in arable land, but at the expense of bio-diverse forests and other natural ecosystems. Because there is not much marginal land, biofuel crop production without threatening biodiversity would mean less food crop production and increased demand on the international food markets with the respective price changes. While this is unproblematic for the developed world, this would cause a decrease in food security in developing countries. The dark blue cluster covers the majority of countries in the former EU-15, and Japan and South Korea.
The following is a discussion about the six clusters occurring in the developing world.
Poor people in the most severe food security risk cluster (solid yellow) are most sensitive to increasing food and energy prices due to net food and energy imports, and their low income. While marginal lands are scarce, there is still high availability of highly biodiverse, uncultivated areas. However,
massively promoting biofuel crop production can pose risks to biodiversity and human development, due to expanding agricultural land and increasing local food prices. A shift towards biofuel production increases dependency on food imports, while benefits from energy independence are not yet clear. This cluster covers the largest part of Sub-Saharan Africa and the most food insecure areas in Asia.
The strongest land use competition cluster (pale yellow) comprises the most densely populated rural regions in the world. It is defined by tight competition over widespread cultivated areas. Highly pressurized land and water resources, combined with low human well-being create the core vulnerability. Biofuel crop cultivation is likely to pose a risk to poor smallholders, especially when they are sensitive to food prices. Furthermore, these areas are dependent on food and energy imports, making a diversion of food crops to biofuels more risky than in exporting areas. This cluster covers the densely populated rural, agriculturally intensive areas in India, China, Indonesia, and the Philippines.
The high biodiversity loss risk cluster (dark green) is made up of highly biodiverse, uncultivated land in net food and energy exporting areas. Moderate biofuel crop growth potential and abundant water resources make these areas lucrative for biofuel production. Indigenous people and biodiversity are
Figure 5.5
Average per capita income
Infant mortality
Net energy import (% of consumption)
Net food import (% of consumption)
Rural population
Biodiversity left
Marginal lands
Water availability per cap.
Biofuel crop growth pot.
Arable land
Fraiman-index
0.0 0.2 0.4 0.6 0.8 1.0
Fraiman measure vulnerability of rural livelihoods for competition for land for food and biofuels
Figure 5.6Box-plots vulnerability of rural livelihoods for competition for land for food and biofuels
4365
0.2 0.6 1.0
2771
0.2 0.6 1.0
4858
0.2 0.6 1.0
7848
0.2 0.6 1.0
3732
0.2 0.6 1.0
5010
0.2 0.6 1.0
3109
0.2 0.6 1.0
3569
0.2 0.6 1.0
1949
0.2 0.6 1.0
0
average per capita incomeinfant mortalitynet energy import (% of consumption)net food import (% of consumption)rural populationbiodiversity leftmarginal landswater availability per cap.biofuel crop growth pot.arable land
average per capita incomeinfant mortalitynet energy import (% of consumption)net food import (% of consumption)rural populationbiodiversity leftmarginal landswater availability per cap.biofuel crop growth pot.arable land
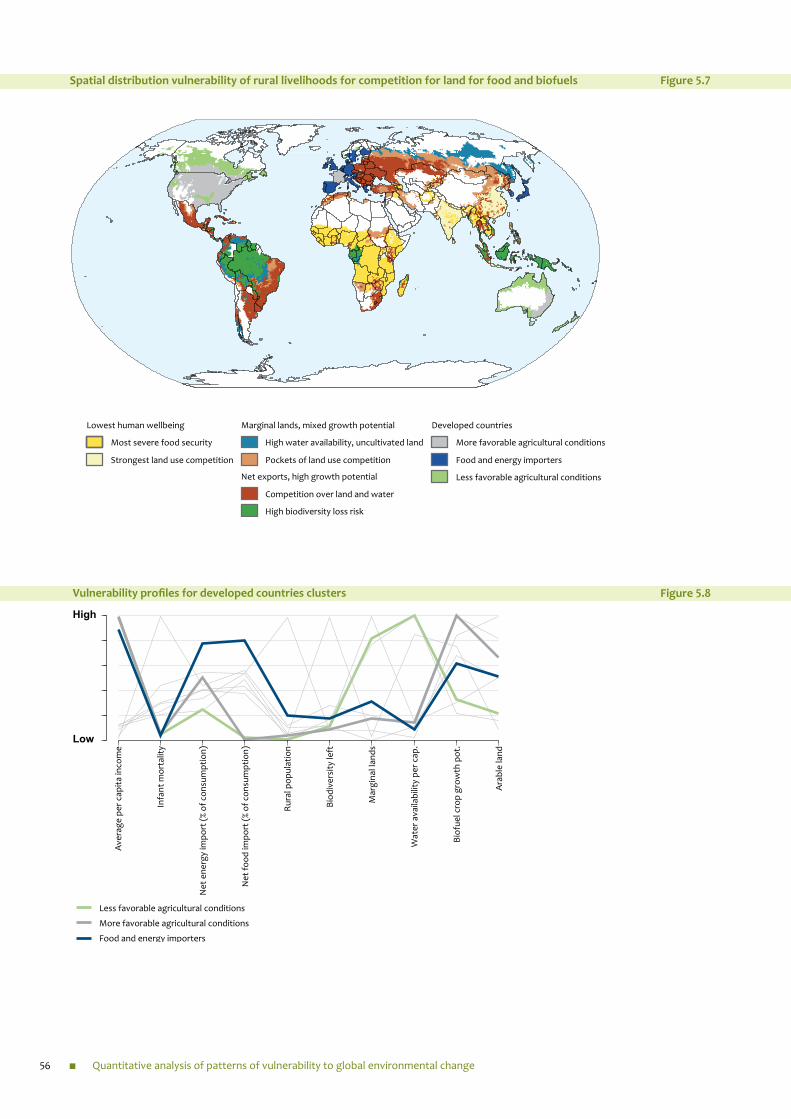
Quantitative analysis of patterns of vulnerability to global environmental change 56
Figure 5.7Spatial distribution vulnerability of rural livelihoods for competition for land for food and biofuels
Lowest human wellbeing
Most severe food security
Strongest land use competition
Marginal lands, mixed growth potential
High water availability, uncultivated land
Pockets of land use competition
Net exports, high growth potential
Competition over land and water
High biodiversity loss risk
Developed countries
More favorable agricultural conditions
Food and energy importers
Less favorable agricultural conditions
Figure 5.8
Ave
rage
per
cap
ita in
com
e
Infa
nt m
orta
lity
Net
ene
rgy
impo
rt (%
of c
onsu
mpt
ion)
Net
food
impo
rt (%
of c
onsu
mpt
ion)
Rur
al p
opul
atio
n
Biod
iver
sity
left
Mar
gina
l lan
ds
Wat
er a
vaila
bilit
y pe
r cap
.
Biof
uel c
rop
grow
th p
ot.
Ara
ble
land
Less favorable agricultural conditions
More favorable agricultural conditions
Food and energy importers
Vulnerability profiles for developed countries clusters
High
Low
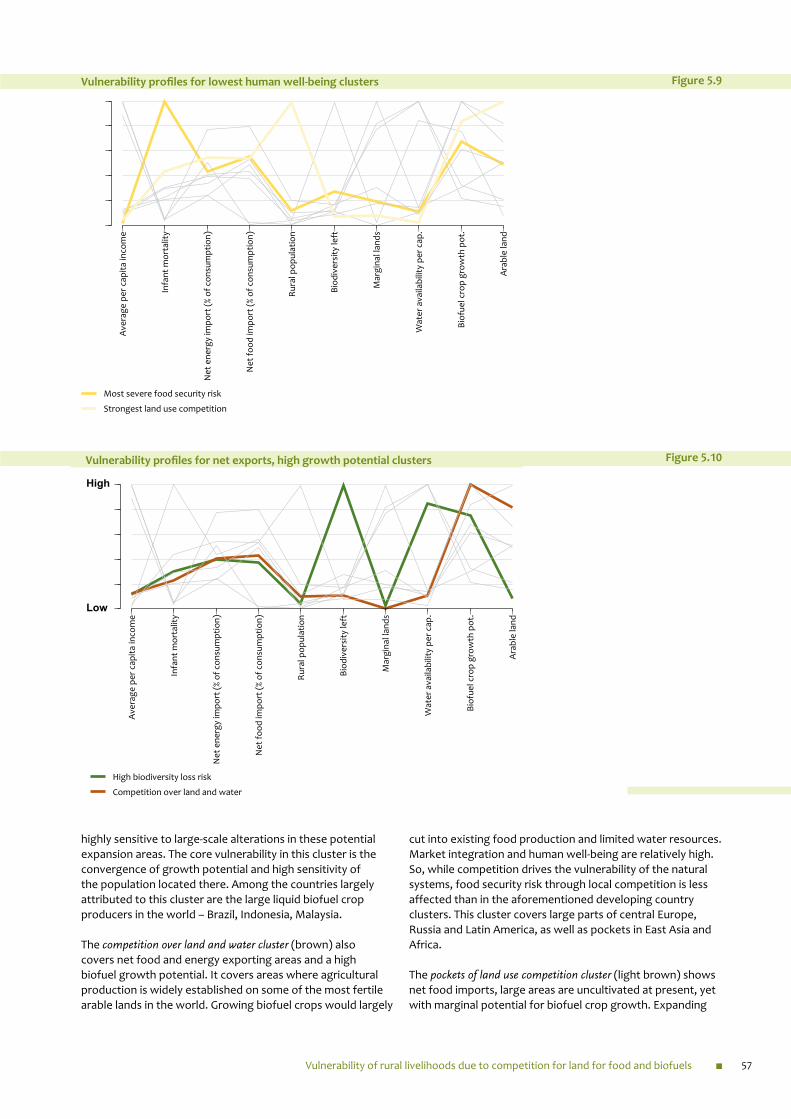
Vulnerability of rural livelihoods due to competition for land for food and biofuels 57
highly sensitive to large-scale alterations in these potential expansion areas. The core vulnerability in this cluster is the convergence of growth potential and high sensitivity of the population located there. Among the countries largely attributed to this cluster are the large liquid biofuel crop producers in the world – Brazil, Indonesia, Malaysia.
The competition over land and water cluster (brown) also covers net food and energy exporting areas and a high biofuel growth potential. It covers areas where agricultural production is widely established on some of the most fertile arable lands in the world. Growing biofuel crops would largely
cut into existing food production and limited water resources. Market integration and human well-being are relatively high. So, while competition drives the vulnerability of the natural systems, food security risk through local competition is less affected than in the aforementioned developing country clusters. This cluster covers large parts of central Europe, Russia and Latin America, as well as pockets in East Asia and Africa.
The pockets of land use competition cluster (light brown) shows net food imports, large areas are uncultivated at present, yet with marginal potential for biofuel crop growth. Expanding
Figure 5.9
Ave
rage
per
cap
ita in
com
e
Infa
nt m
orta
lity
Net
ene
rgy
impo
rt (%
of c
onsu
mpt
ion)
Net
food
impo
rt (%
of c
onsu
mpt
ion)
Rur
al p
opul
atio
n
Biod
iver
sity
left
Mar
gina
l lan
ds
Wat
er a
vaila
bilit
y pe
r cap
.
Biof
uel c
rop
grow
th p
ot.
Ara
ble
land
Most severe food security risk
Strongest land use competition
Vulnerability profiles for lowest human well-being clusters
Figure 5.10
Ave
rage
per
cap
ita in
com
e
Infa
nt m
orta
lity
Net
ene
rgy
impo
rt (%
of c
onsu
mpt
ion)
Net
food
impo
rt (%
of c
onsu
mpt
ion)
Rur
al p
opul
atio
n
Biod
iver
sity
left
Mar
gina
l lan
ds
Wat
er a
vaila
bilit
y pe
r cap
.
Biof
uel c
rop
grow
th p
ot.
Ara
ble
land
High biodiversity loss risk
Competition over land and water
Vulnerability profiles for net exports, high growth potential clusters
High
Low
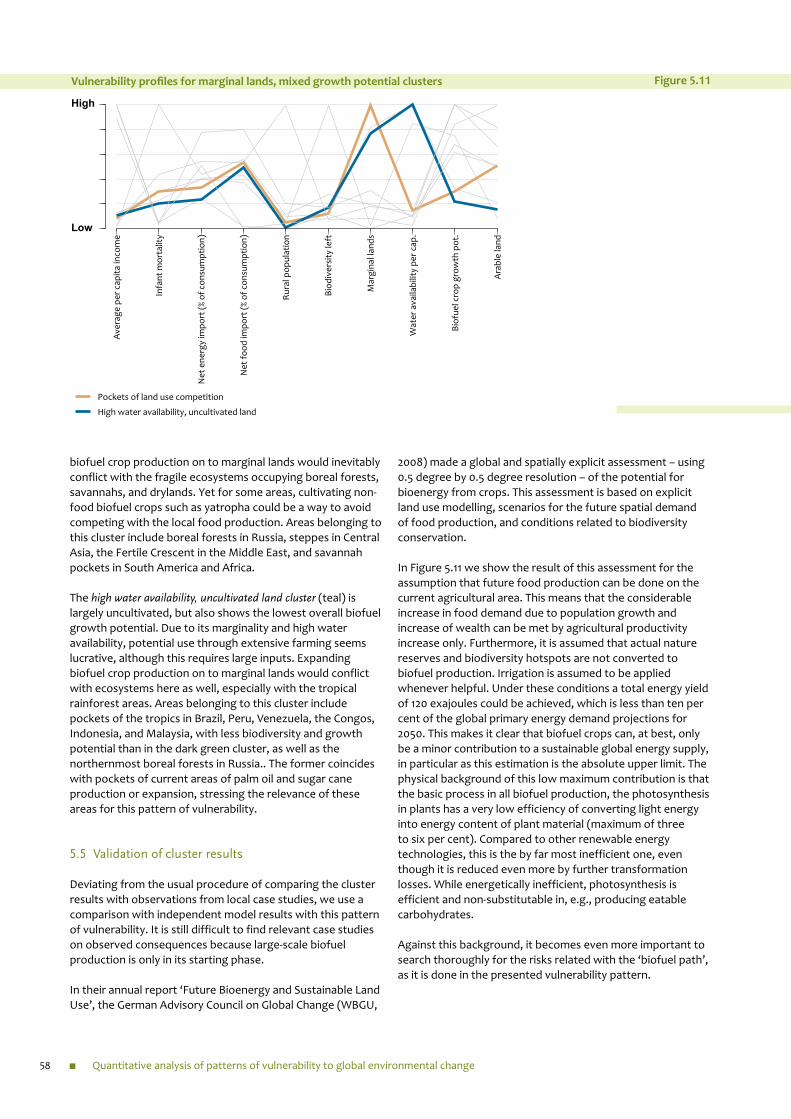
Quantitative analysis of patterns of vulnerability to global environmental change 58
biofuel crop production on to marginal lands would inevitably conflict with the fragile ecosystems occupying boreal forests, savannahs, and drylands. Yet for some areas, cultivating non-food biofuel crops such as yatropha could be a way to avoid competing with the local food production. Areas belonging to this cluster include boreal forests in Russia, steppes in Central Asia, the Fertile Crescent in the Middle East, and savannah pockets in South America and Africa.
The high water availability, uncultivated land cluster (teal) is largely uncultivated, but also shows the lowest overall biofuel growth potential. Due to its marginality and high water availability, potential use through extensive farming seems lucrative, although this requires large inputs. Expanding biofuel crop production on to marginal lands would conflict with ecosystems here as well, especially with the tropical rainforest areas. Areas belonging to this cluster include pockets of the tropics in Brazil, Peru, Venezuela, the Congos, Indonesia, and Malaysia, with less biodiversity and growth potential than in the dark green cluster, as well as the northernmost boreal forests in Russia.. The former coincides with pockets of current areas of palm oil and sugar cane production or expansion, stressing the relevance of these areas for this pattern of vulnerability.
5.5 Validation of cluster results
Deviating from the usual procedure of comparing the cluster results with observations from local case studies, we use a comparison with independent model results with this pattern of vulnerability. It is still difficult to find relevant case studies on observed consequences because large-scale biofuel production is only in its starting phase.
In their annual report ‘Future Bioenergy and Sustainable Land Use’, the German Advisory Council on Global Change (WBGU,
2008) made a global and spatially explicit assessment – using 0.5 degree by 0.5 degree resolution – of the potential for bioenergy from crops. This assessment is based on explicit land use modelling, scenarios for the future spatial demand of food production, and conditions related to biodiversity conservation.
In Figure 5.11 we show the result of this assessment for the assumption that future food production can be done on the current agricultural area. This means that the considerable increase in food demand due to population growth and increase of wealth can be met by agricultural productivity increase only. Furthermore, it is assumed that actual nature reserves and biodiversity hotspots are not converted to biofuel production. Irrigation is assumed to be applied whenever helpful. Under these conditions a total energy yield of 120 exajoules could be achieved, which is less than ten per cent of the global primary energy demand projections for 2050. This makes it clear that biofuel crops can, at best, only be a minor contribution to a sustainable global energy supply, in particular as this estimation is the absolute upper limit. The physical background of this low maximum contribution is that the basic process in all biofuel production, the photosynthesis in plants has a very low efficiency of converting light energy into energy content of plant material (maximum of three to six per cent). Compared to other renewable energy technologies, this is the by far most inefficient one, even though it is reduced even more by further transformation losses. While energetically inefficient, photosynthesis is efficient and non-substitutable in, e.g., producing eatable carbohydrates.
Against this background, it becomes even more important to search thoroughly for the risks related with the ‘biofuel path’, as it is done in the presented vulnerability pattern.
Figure 5.11
Ave
rage
per
cap
ita in
com
e
Infa
nt m
orta
lity
Net
ene
rgy
impo
rt (%
of c
onsu
mpt
ion)
Net
food
impo
rt (%
of c
onsu
mpt
ion)
Rur
al p
opul
atio
n
Biod
iver
sity
left
Mar
gina
l lan
ds
Wat
er a
vaila
bilit
y pe
r cap
.
Biof
uel c
rop
grow
th p
ot.
Ara
ble
land
Pockets of land use competition
High water availability, uncultivated land
Vulnerability profiles for marginal lands, mixed growth potential clusters
High
Low
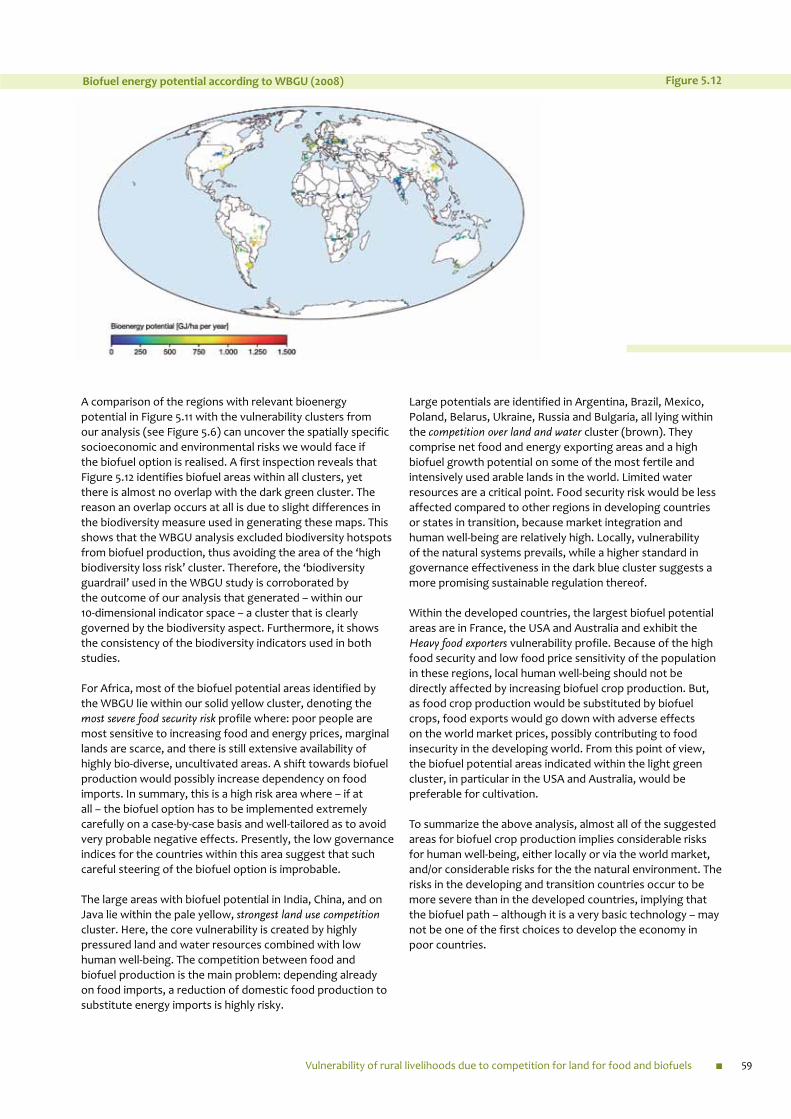
Vulnerability of rural livelihoods due to competition for land for food and biofuels 59
A comparison of the regions with relevant bioenergy potential in Figure 5.11 with the vulnerability clusters from our analysis (see Figure 5.6) can uncover the spatially specific socioeconomic and environmental risks we would face if the biofuel option is realised. A first inspection reveals that Figure 5.12 identifies biofuel areas within all clusters, yet there is almost no overlap with the dark green cluster. The reason an overlap occurs at all is due to slight differences in the biodiversity measure used in generating these maps. This shows that the WBGU analysis excluded biodiversity hotspots from biofuel production, thus avoiding the area of the ‘high biodiversity loss risk’ cluster. Therefore, the ‘biodiversity guardrail’ used in the WBGU study is corroborated by the outcome of our analysis that generated – within our 10-dimensional indicator space – a cluster that is clearly governed by the biodiversity aspect. Furthermore, it shows the consistency of the biodiversity indicators used in both studies.
For Africa, most of the biofuel potential areas identified by the WBGU lie within our solid yellow cluster, denoting the most severe food security risk profile where: poor people are most sensitive to increasing food and energy prices, marginal lands are scarce, and there is still extensive availability of highly bio-diverse, uncultivated areas. A shift towards biofuel production would possibly increase dependency on food imports. In summary, this is a high risk area where – if at all – the biofuel option has to be implemented extremely carefully on a case-by-case basis and well-tailored as to avoid very probable negative effects. Presently, the low governance indices for the countries within this area suggest that such careful steering of the biofuel option is improbable.
The large areas with biofuel potential in India, China, and on Java lie within the pale yellow, strongest land use competition cluster. Here, the core vulnerability is created by highly pressured land and water resources combined with low human well-being. The competition between food and biofuel production is the main problem: depending already on food imports, a reduction of domestic food production to substitute energy imports is highly risky.
Large potentials are identified in Argentina, Brazil, Mexico, Poland, Belarus, Ukraine, Russia and Bulgaria, all lying within the competition over land and water cluster (brown). They comprise net food and energy exporting areas and a high biofuel growth potential on some of the most fertile and intensively used arable lands in the world. Limited water resources are a critical point. Food security risk would be less affected compared to other regions in developing countries or states in transition, because market integration and human well-being are relatively high. Locally, vulnerability of the natural systems prevails, while a higher standard in governance effectiveness in the dark blue cluster suggests a more promising sustainable regulation thereof.
Within the developed countries, the largest biofuel potential areas are in France, the USA and Australia and exhibit the Heavy food exporters vulnerability profile. Because of the high food security and low food price sensitivity of the population in these regions, local human well-being should not be directly affected by increasing biofuel crop production. But, as food crop production would be substituted by biofuel crops, food exports would go down with adverse effects on the world market prices, possibly contributing to food insecurity in the developing world. From this point of view, the biofuel potential areas indicated within the light green cluster, in particular in the USA and Australia, would be preferable for cultivation.
To summarize the above analysis, almost all of the suggested areas for biofuel crop production implies considerable risks for human well-being, either locally or via the world market, and/or considerable risks for the the natural environment. The risks in the developing and transition countries occur to be more severe than in the developed countries, implying that the biofuel path – although it is a very basic technology – may not be one of the first choices to develop the economy in poor countries.
Figure 5.12Biofuel energy potential according to WBGU (2008)
Quantitative analysis of patterns of vulnerability to global environmental change 60
5.6 Conclusions
Drawing on the work completed during the GEO–4 process to determine relevant and typical vulnerability creating mechanisms, we analysed the ‘competition for food and biofuels’ more extensively in this chapter. After the discussion of the relevant mechanisms, we determined a set of ten indicators with global coverage that describe the most relevant relations within this pattern of vulnerability and allow for later projections based on the IMAGE/GISMO modelling framework. A state-of-the-art cluster analysis revealed a set of nine clearly distinguishable clusters. This shows that it is justified by the structure of the indicator space to speak about ‘typical’ vulnerability profiles – this is an important result: if such an approach would not be appropriate there is a more continuous density of points in the indicator space.
The interpretation of the cluster centres as vulnerability profiles describing the vulnerability of human well-being against endogenous and exogenous stresses resulted in three pairs of clusters and three developed countries’ clusters. The three pairs are the ‘low human well-being’, the ‘net exports, high growth potential’ and the ‘marginal lands, mixed growth potential’ clusters.
Although it is not one of the objectives during this project phase, the description of each cluster in light of the vulnerability-creating mechanisms already suggests cluster-specific policy options (for some preliminary ones see PBL, 2009). The two clusters with the low human well-being provide favourable biofuel growth potential with very little marginal lands or degraded lands to fall back and avoid competition on. Despite low dependencies on imports, food insecurity is highest here. These situations are problematic because dependencies on local resources are high, while means to absorb food and energy price changes are low. In light of food security affected by the rising demand for food and liquid biofuels, possible trade-offs between human development and environmental sustainability can have many negative effects. They are pronouncedly negative in two cases:1. high local resource dependency in densely populated,
poorer regions with tight competition over widespread cultivated areas (strongest land use competition cluster);
2. moderate biofuel growth potential combined with vast extents of biodiverse vegetation adjacent to arable land (high biodiversity loss risk cluster). In both cases there are incentives and pressures to cultivate or extend crop growth for biofuels. The more food insecure, and the less non-arable land is available to expand cultivation on, the more dependencies and food insecurity are likely to establish or increase.
It is necessary to establish ground rules based on local contexts. Uncontrolled biofuel crop production may provide opportunities to others besides smallholder farmers and urban poor at the cost of livelihoods dependent on the required resources. However, better outcomes can be realised by taking the locally specific context into account, for example by governing and creating sustainable access to natural resources required for biofuel crop production. This requires reforming or building institutions that consider these
local contexts, and condone equitable distribution of the benefits. Once in place and accepted, such institutions could a) reap the opportunity of cultivating non-food biofuel crops on marginal lands unsuitable for cultivating food crops, and b) promote domestic use of biofuels.
Conservation alongside environmentally sustainable expansion is an opportunity. In biodiversity rich areas, opportunities for ensuring environmental sustainability may lie in conservational measures and sustainable resource management to get an environmental income of these ecosystems. This would need to have the twofold purpose of retaining high biodiversity and contribute to the coping capacity of those livelihoods dependent on these ecosystems, such as is the case with indigenous people. Global market access and a certain required level of development are already in place in certain areas, and visible through export, sometimes massive export, of biofuel crops and food. Sustainable expansion of biofuel crop cultivation would include a mix of avoiding external stresses – for example, through a network of ‘no-go areas’ for crop expansion – and improving access of resource dependent livelihoods to decision-making processes regarding biofuel crops and resource conservation.
In light of ensuring beneficial trade-offs, the marginal land, mixed growth potential clusters reconcile risks and opportunities. This primarily applies to the pockets of land use competition cluster, as it offers more areas where growth potential is feasible enough to profit from, and does not come at dire costs of local environment, for example, rainforest and boreal forests. Biofuel crops attuned to local conditions could serve as an additional source of income on degraded land unsuitable for food production, if only for the farmers themselves or for local use. In theory, this also applies to marginal lands in the low human well-being clusters where non-food biofuel crops such as yatropha are cultivable, yet here a larger competition with local food production is conceivable. Meanwhile the test phase of this alternative continues as the problem with biofuels requires solutions now.
Vulnerability of urban livelihoods under rapid coastal urbanisation 61
In this chapter, we investigate the vulnerability of urban livelihoods under rapid coastal urbanisation. These urban livelihoods are mainly characterised by the increasing pressures placed on urban planning and management and on coastal ecosystems by unprecedentedly increasing urban populations, due to migration and endemic growth, and global environmental change, which increases the vulnerability of marginalised urban populations. A unique set of attractive economic, infrastructural, and social factors in urbanising coastal areas results in rapid, disproportionate concentration and accumulation of urban people. This leads to increasing exposure and sensitivity of the less equipped urban populations to social and ecological stresses under global environmental change, subsequently increasing their vulnerability. In addition, this convergence can overstretch the ability for urban planning and management to decrease vulnerability and to foster human well-being.
6.1 Vulnerability creating mechanisms
Coastal areas have attracted human settlement throughout human history. Coastal cities concentrate economic, infrastructural and societal opportunities, but also expose residents to various hazards, both natural and socioeconomic (McGranahan, 2007). However, the plethora of hazards these coastal populations are exposed to do not reflect in migration paths or the economic incentives that make coastal urban areas grow at such unprecedented paces. Today, coastal urbanisation is characterised by its rapid and disproportionate concentration and accumulation in contrast to rural and many inland urban areas.
As of 2007, more humans have been living in urban settlements than in rural areas for the first time in history (IPCC, 2007). Rising numbers of urban dwellers give the best indication of the scale of unprecedented trends (UNDESA, 2006): urban population increased from 220 million in 1900 to 732 million in 1950, and is estimated to have reached 3.2 billion in 2005. This is an increase of factor four since 1950. Trends show that nearly all expected world population growth from 2000 to 2030 will take place in urban areas (UNDESA,
2002). Over the next 25 years, the global urban population is projected to grow by 1.8 per cent and total population is projected to grow by less than one per cent (UNDESA, 2006), more than 95 per cent of the net increase in the global population will be in cities of the developing world.
This ongoing global process has led to a concentration of 40 per cent of the world population on a narrow coastal band that takes up only seven per cent of the Earth’s surface (McGranahan, 2007). Of the world’s 33 megacities, 21 of the 26 megacities located in developing countries lie in coastal areas (Klein et al., 2003).
These current trends are not expected to stagnate or change in the foreseeable future (Dye, 2008), they put severe pressure on coastal ecosystems, and will increase the number of vulnerable populations. Moreover, due to the acceleration of such transitions, new problems are surfacing before old ones can be addressed (Tanner et al., 2009), resulting in further pressure on urban populations and ecosystems (McGranahan, 2007). In some places, unprecedented population growth rates, uncontrolled urban expansion, and natural hazards compound to overstretch the ability of planning and management, and marginalised people. At the same time climate change and further urban population growth are exacerbating or creating stresses (Nicholls, 2004).The adequacy of living conditions for coastal urban in-migrants or newborns are a function of the access to basic services and capital they have. Access determines if they are integrated into or marginalised from the assets that coastal urban agglomerations offer. Marginalisation manifests in poor access to material assets at the household level, for example, income, food, adequate housing, natural and financial resources, and at the societal level, which includes (physical and service infrastructure, Jäger and Kok, 2007). Dis-connectedness from infrastructure and decision making feeds into a cycle of impoverishment, vulnerability and environmen-tal change. About one out of three urban dwellers lives in a slum – roughly one billion people, 14 per cent of the world’s population (UN-HABITAT, 2007; Dye, 2008). Cities and slums often act as the ‘first step’ out of rural poverty for at least some of the rural immigrants (UN-HABITAT, 2007).
Vulnerability of urban livelihoods under rapid coastal urbanisation
6
Quantitative analysis of patterns of vulnerability to global environmental change 62
Summarily, the rapid accumulation of less equipped populations in coastal areas can pose insurmountable challenges to urban planning and management in itself, impeding an improvement of their living conditions. Together this potentially overrides the equally broad opportunities the coastal urban areas have to offer them. The vulnerability of slum populations in rapidly urbanising coastal areas is also steered by high vulnerability to natural hazards, such as flooding, landslides, storms, earthquakes or tsunamis, and also to climate change. This particularly holds true where ill management presides, that is, building and infrastructure quality, less resilient densely populated areas (Prasad et al., 2008). Despite improvements of access to water and sanitation, the poorest people suffer the most from their absence due to poor infrastructure in marginalised areas and lack of financial resources (Jäger and Kok, 2007), resulting in severe consequences for their health status (UNDP, 2006).
Urban, coastal areas are more densely populated than any other eco-zones (MA, 2005). In monetary terms, coastal ecosystems contribute 77 per cent of the economic value of global ecosystem services (Costanza et al., 1997; M.L. Martínez et al., 2007). With adequate governance, coastal ecosystems provide important services to urban areas and populations. Wetlands and floodplains are the main providers of flood regulation functions in the inland water systems, attenuating negative consequences to human well-being through extreme events. The coastal wetland ecosystems, salt marshes and mangroves in particular, are – amongst others – threatened by climate change. Also due to the decrease of these ecosystems, both inland and coastal floods have become more destructive in recent years, and projections show this will become more pronounced in the future (Bravo de Guenni et al., 2005). Additionally, the degradation of coastal ecosystems, especially wetlands and coral reefs, has serious implications for the well-being of societies dependent on these ecosystems for their provisioning and regulating services (Nicholls, 2004).
Poverty and marginalisation has led to increases in population density in flood-prone areas such as floodplains, and has been driving the growth of informal settlements in susceptible areas around megacities in many developing countries (Bravo de Guenni et al., 2005). This leads to an increase in both the degradation of coastal flood regulating ecosystems presiding there, and increases the populations’ exposure and sensitivity to coastal and inland floods.
Impacts from disasters, risks and hazards can take on unusual and extreme forms in coastal urban areas (Tanner et al., 2009). Both urban disasters and environmental hotspots are already disproportionately located in low-lying coastal areas (Pelling, 2003). The most vulnerable urban settlements are generally those in such coastal and river floodplains, those whose economies are closely linked with climate-sensitive resources, and those in areas prone to extreme weather events, especially where rapid urbanisation is occurring (IPCC, 2007).
One of the main drivers of increased vulnerability to natural hazards is climate change (Jäger and Kok, 2007). Coasts already experience the adverse consequences of hazards
related to climate, to which they are highly vulnerable; tropical cyclones, and floods are perfect examples. Furthermore, they will be exposed to an increase of these and other possible risks during the coming decades due to climate change and sea-level rise (Nicholls, 2004; McGranahan, 2007; Schneider et al., 2007). Most social systems in low-lying coastal areas are expected to have increased vulnerability in light of sea-level rises or storm surges (Schneider et al., 2007). While estimates of the number of additional people at risk from coastal flooding in the future vary widely, all indicate a considerable increase, due to the increase of population and increase of climate change induced sea-level rise. This poses a major challenge to coastal areas both in terms of adapting to rising storm surge levels and to rising flood levels, through rising sea levels (Nicholls, 2004; Wilbanks et al., 2007).
Generally speaking, one key climate change vulnerability for settlements and society lies in climate change and urbanisation. This is most prominent in developing countries where urbanisation is often focused in vulnerable areas such as coastal systems (Nicholls, 2004; Schneider et al., 2007). Cities in developing countries, and their marginalised populations in particular, are mainly endangered by mounting climate change risks due to their locations, the concentration of people, and unsafe housing (Bull-Kamanga et al., 2003).
As a consequence of these current rapid changes and those underway, marginalised urban populations in, and ecosystems adjacent to expanding coastal urban agglomerations are now under increased threat. At the same time, urban planning and management capacities to alleviate this and to increase human well-being are being overstretched due to the rapidity, magnitude, and scope of coastal urban population increase. The most important elements and relations of the above described process are graphically represented in Figure 6.1. It presents the influence diagram of the vulnerability creating mechanism.
6.2 Indicators for vulnerability creating mechanisms
Guided by the vulnerability creating mechanisms discussed in the preceding section, a set of seventeen globally available indicators – mainly sub-national at 0.5 degree by 0.5 degree resolution – was identified to obtain a clearer picture of the current situation (see Table 6.1). Figure 6.2 shows a condensed version of the core variables and relations derived from Figure 6.1 together with the indicators chosen for them, and it shows the relation between the qualitative description of the pattern of vulnerability and these indicators. The blue boxes denote the variables of the main vulnerability creating mechanism, and the smaller yellow boxes represent our selection of indicators representing these variables.
The indicators addressing the state of the environment predominantly evaluate this with datasets from 2000. In order to fully appreciate the change process and acceleration that lie at the core of the pattern of vulnerability of rapid coastal urbanisation, indicators address changes over time when it is available and feasible. Such change indicators are predominantly from the time interval from 1990 to 2000. Table 6.1 summarizes the vulnerability elements and
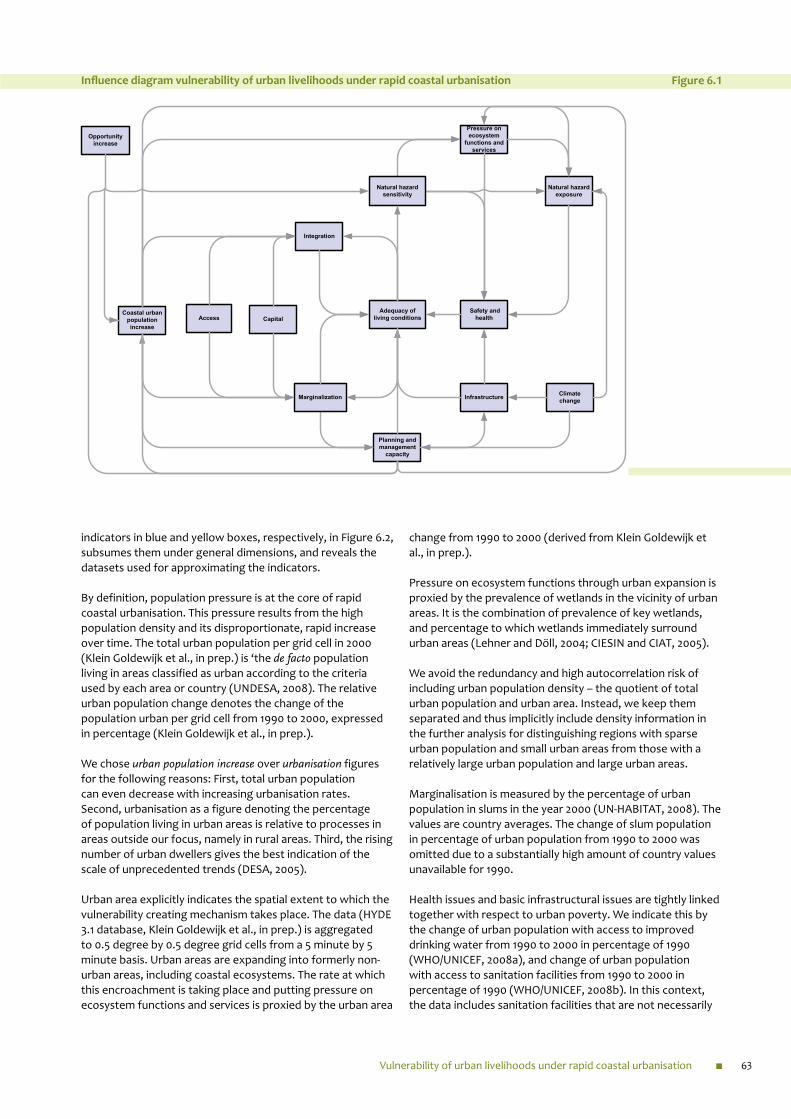
Vulnerability of urban livelihoods under rapid coastal urbanisation 63
indicators in blue and yellow boxes, respectively, in Figure 6.2, subsumes them under general dimensions, and reveals the datasets used for approximating the indicators.
By definition, population pressure is at the core of rapid coastal urbanisation. This pressure results from the high population density and its disproportionate, rapid increase over time. The total urban population per grid cell in 2000 (Klein Goldewijk et al., in prep.) is ‘the de facto population living in areas classified as urban according to the criteria used by each area or country (UNDESA, 2008). The relative urban population change denotes the change of the population urban per grid cell from 1990 to 2000, expressed in percentage (Klein Goldewijk et al., in prep.).
We chose urban population increase over urbanisation figures for the following reasons: First, total urban population can even decrease with increasing urbanisation rates. Second, urbanisation as a figure denoting the percentage of population living in urban areas is relative to processes in areas outside our focus, namely in rural areas. Third, the rising number of urban dwellers gives the best indication of the scale of unprecedented trends (DESA, 2005).
Urban area explicitly indicates the spatial extent to which the vulnerability creating mechanism takes place. The data (HYDE 3.1 database, Klein Goldewijk et al., in prep.) is aggregated to 0.5 degree by 0.5 degree grid cells from a 5 minute by 5 minute basis. Urban areas are expanding into formerly non-urban areas, including coastal ecosystems. The rate at which this encroachment is taking place and putting pressure on ecosystem functions and services is proxied by the urban area
change from 1990 to 2000 (derived from Klein Goldewijk et al., in prep.).
Pressure on ecosystem functions through urban expansion is proxied by the prevalence of wetlands in the vicinity of urban areas. It is the combination of prevalence of key wetlands, and percentage to which wetlands immediately surround urban areas (Lehner and Döll, 2004; CIESIN and CIAT, 2005).
We avoid the redundancy and high autocorrelation risk of including urban population density – the quotient of total urban population and urban area. Instead, we keep them separated and thus implicitly include density information in the further analysis for distinguishing regions with sparse urban population and small urban areas from those with a relatively large urban population and large urban areas.
Marginalisation is measured by the percentage of urban population in slums in the year 2000 (UN-HABITAT, 2008). The values are country averages. The change of slum population in percentage of urban population from 1990 to 2000 was omitted due to a substantially high amount of country values unavailable for 1990.
Health issues and basic infrastructural issues are tightly linked together with respect to urban poverty. We indicate this by the change of urban population with access to improved drinking water from 1990 to 2000 in percentage of 1990 (WHO/UNICEF, 2008a), and change of urban population with access to sanitation facilities from 1990 to 2000 in percentage of 1990 (WHO/UNICEF, 2008b). In this context, the data includes sanitation facilities that are not necessarily
Figure 6.1Influence diagram vulnerability of urban livelihoods under rapid coastal urbanisation
Natural hazard exposure
Safety and health
Climate change
Pressure on ecosystem
functions and services
Adequacy of living conditions
Planning and management
capacity
InfrastructureMarginalization
Coastal urban populationincrease
Integration
Natural hazardsensitivity
Opportunityincrease
Access Capital
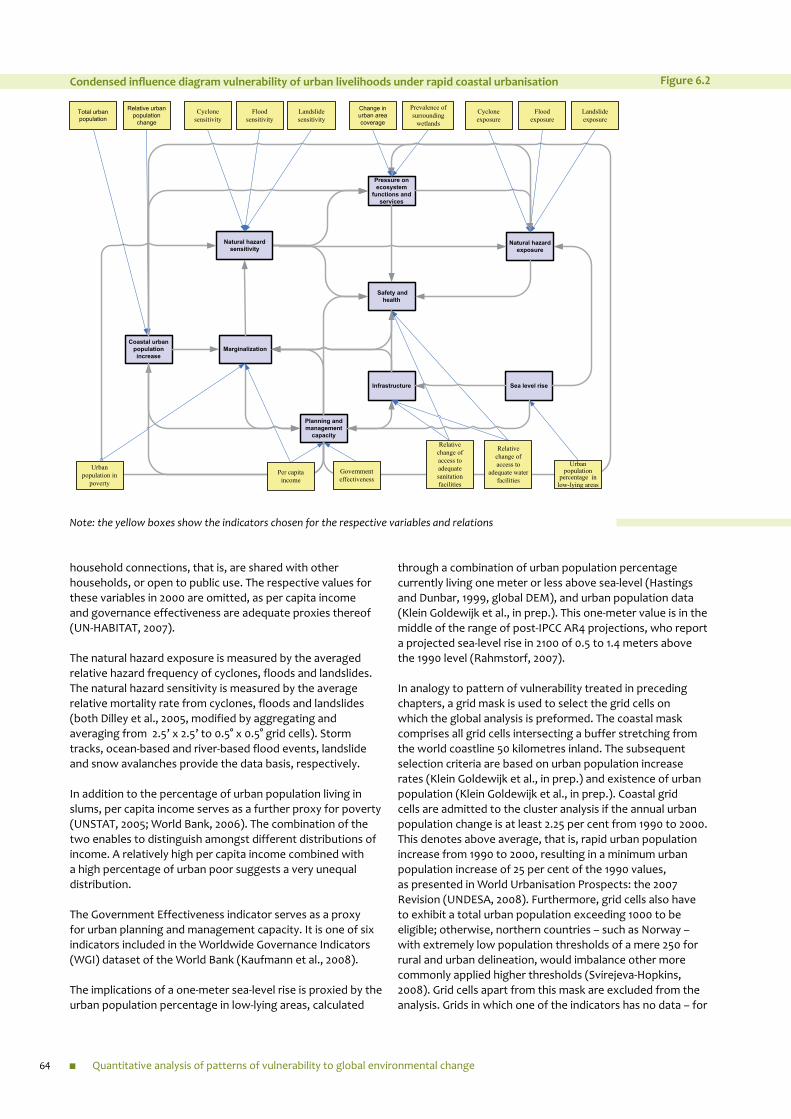
Quantitative analysis of patterns of vulnerability to global environmental change 64
household connections, that is, are shared with other households, or open to public use. The respective values for these variables in 2000 are omitted, as per capita income and governance effectiveness are adequate proxies thereof (UN-HABITAT, 2007).
The natural hazard exposure is measured by the averaged relative hazard frequency of cyclones, floods and landslides. The natural hazard sensitivity is measured by the average relative mortality rate from cyclones, floods and landslides (both Dilley et al., 2005, modified by aggregating and averaging from 2.5’ x 2.5’ to 0.5° x 0.5° grid cells). Storm tracks, ocean-based and river-based flood events, landslide and snow avalanches provide the data basis, respectively.
In addition to the percentage of urban population living in slums, per capita income serves as a further proxy for poverty (UNSTAT, 2005; World Bank, 2006). The combination of the two enables to distinguish amongst different distributions of income. A relatively high per capita income combined with a high percentage of urban poor suggests a very unequal distribution.
The Government Effectiveness indicator serves as a proxy for urban planning and management capacity. It is one of six indicators included in the Worldwide Governance Indicators (WGI) dataset of the World Bank (Kaufmann et al., 2008).
The implications of a one-meter sea-level rise is proxied by the urban population percentage in low-lying areas, calculated
through a combination of urban population percentage currently living one meter or less above sea-level (Hastings and Dunbar, 1999, global DEM), and urban population data (Klein Goldewijk et al., in prep.). This one-meter value is in the middle of the range of post-IPCC AR4 projections, who report a projected sea-level rise in 2100 of 0.5 to 1.4 meters above the 1990 level (Rahmstorf, 2007).
In analogy to pattern of vulnerability treated in preceding chapters, a grid mask is used to select the grid cells on which the global analysis is preformed. The coastal mask comprises all grid cells intersecting a buffer stretching from the world coastline 50 kilometres inland. The subsequent selection criteria are based on urban population increase rates (Klein Goldewijk et al., in prep.) and existence of urban population (Klein Goldewijk et al., in prep.). Coastal grid cells are admitted to the cluster analysis if the annual urban population change is at least 2.25 per cent from 1990 to 2000. This denotes above average, that is, rapid urban population increase from 1990 to 2000, resulting in a minimum urban population increase of 25 per cent of the 1990 values, as presented in World Urbanisation Prospects: the 2007 Revision (UNDESA, 2008). Furthermore, grid cells also have to exhibit a total urban population exceeding 1000 to be eligible; otherwise, northern countries – such as Norway – with extremely low population thresholds of a mere 250 for rural and urban delineation, would imbalance other more commonly applied higher thresholds (Svirejeva-Hopkins, 2008). Grid cells apart from this mask are excluded from the analysis. Grids in which one of the indicators has no data – for
Note: the yellow boxes show the indicators chosen for the respective variables and relations
Figure 6.2Condensed influence diagram vulnerability of urban livelihoods under rapid coastal urbanisation
Natural hazard exposure
Safety and health
Sea level rise
Pressure on ecosystem
functions and services
Planning and management
capacity
Infrastructure
MarginalizationCoastal urban
populationincrease
Relative urban population
change
Total urban population
Floodsensitivity
Prevalence of surrounding
wetlands
Cyclone sensitivity
Landslide sensitivity
Floodexposure
Cyclone exposure
Landslideexposure
Change in urban area coverage
Natural hazardsensitivity
Urbanpopulation in
poverty
Relative change of access to
adequate water facilities
Urban population
percentage in low-lying areas
Governmenteffectiveness
Relative change ofaccess to adequatesanitationfacilities
Per capita income
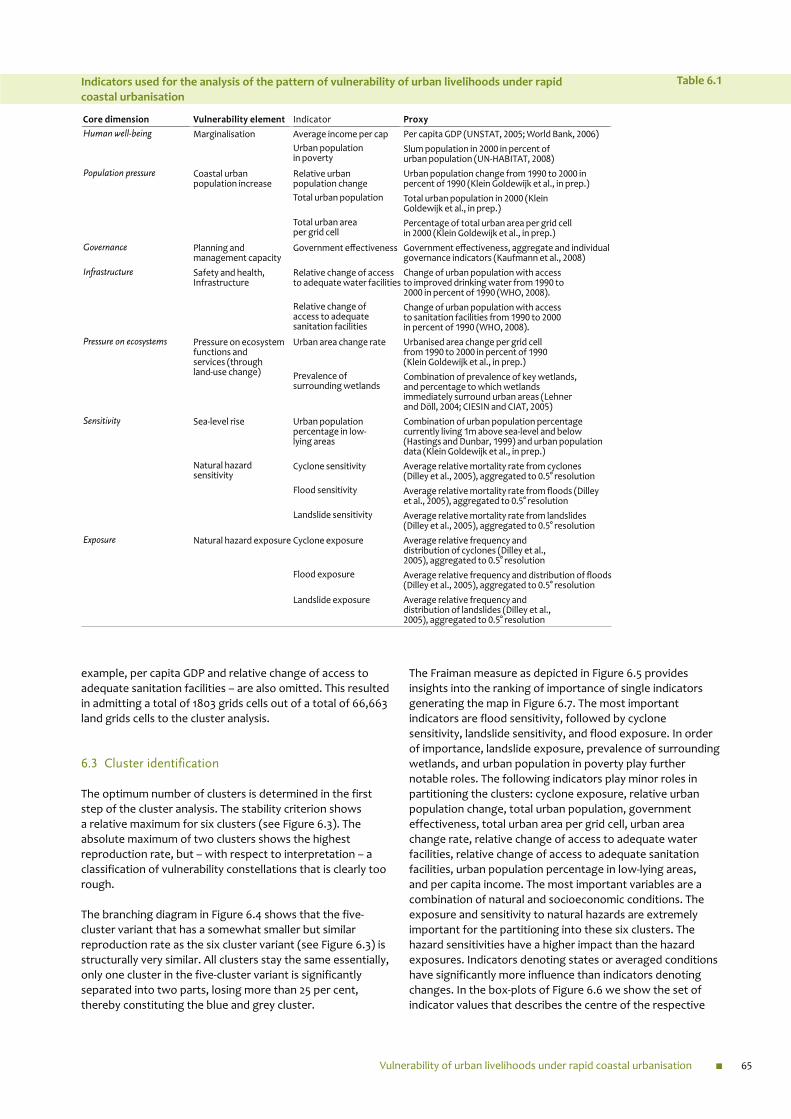
Vulnerability of urban livelihoods under rapid coastal urbanisation 65
example, per capita GDP and relative change of access to adequate sanitation facilities – are also omitted. This resulted in admitting a total of 1803 grids cells out of a total of 66,663 land grids cells to the cluster analysis.
6.3 Cluster identification
The optimum number of clusters is determined in the first step of the cluster analysis. The stability criterion shows a relative maximum for six clusters (see Figure 6.3). The absolute maximum of two clusters shows the highest reproduction rate, but – with respect to interpretation – a classification of vulnerability constellations that is clearly too rough.
The branching diagram in Figure 6.4 shows that the five-cluster variant that has a somewhat smaller but similar reproduction rate as the six cluster variant (see Figure 6.3) is structurally very similar. All clusters stay the same essentially, only one cluster in the five-cluster variant is significantly separated into two parts, losing more than 25 per cent, thereby constituting the blue and grey cluster.
The Fraiman measure as depicted in Figure 6.5 provides insights into the ranking of importance of single indicators generating the map in Figure 6.7. The most important indicators are flood sensitivity, followed by cyclone sensitivity, landslide sensitivity, and flood exposure. In order of importance, landslide exposure, prevalence of surrounding wetlands, and urban population in poverty play further notable roles. The following indicators play minor roles in partitioning the clusters: cyclone exposure, relative urban population change, total urban population, government effectiveness, total urban area per grid cell, urban area change rate, relative change of access to adequate water facilities, relative change of access to adequate sanitation facilities, urban population percentage in low-lying areas, and per capita income. The most important variables are a combination of natural and socioeconomic conditions. The exposure and sensitivity to natural hazards are extremely important for the partitioning into these six clusters. The hazard sensitivities have a higher impact than the hazard exposures. Indicators denoting states or averaged conditions have significantly more influence than indicators denoting changes. In the box-plots of Figure 6.6 we show the set of indicator values that describes the centre of the respective
Indicators used for the analysis of the pattern of vulnerability of urban livelihoods under rapid coastal urbanisation
Core dimension Vulnerability element Indicator ProxyHuman well-being Marginalisation Average income per cap Per capita GDP (UNSTAT, 2005; World Bank, 2006)
Urban population in poverty
Slum population in 2000 in percent of urban population (UN-HABITAT, 2008)
Population pressure Coastal urban population increase
Relative urban population change
Urban population change from 1990 to 2000 in percent of 1990 (Klein Goldewijk et al., in prep.)
Total urban population Total urban population in 2000 (Klein Goldewijk et al., in prep.)
Total urban area per grid cell
Percentage of total urban area per grid cell in 2000 (Klein Goldewijk et al., in prep.)
Governance Planning and management capacity
Government effectiveness Government effectiveness, aggregate and individual governance indicators (Kaufmann et al., 2008)
Infrastructure Safety and health, Infrastructure
Relative change of access to adequate water facilities
Change of urban population with access to improved drinking water from 1990 to 2000 in percent of 1990 (WHO, 2008).
Relative change of access to adequate sanitation facilities
Change of urban population with access to sanitation facilities from 1990 to 2000 in percent of 1990 (WHO, 2008).
Pressure on ecosystems Pressure on ecosystem functions and services (through land-use change)
Urban area change rate Urbanised area change per grid cell from 1990 to 2000 in percent of 1990 (Klein Goldewijk et al., in prep.)
Prevalence of surrounding wetlands
Combination of prevalence of key wetlands, and percentage to which wetlands immediately surround urban areas (Lehner and Döll, 2004; CIESIN and CIAT, 2005)
Sensitivity Sea-level rise Urban population percentage in low-lying areas
Combination of urban population percentage currently living 1m above sea-level and below (Hastings and Dunbar, 1999) and urban population data (Klein Goldewijk et al., in prep.)
Natural hazard sensitivity
Cyclone sensitivity Average relative mortality rate from cyclones (Dilley et al., 2005), aggregated to 0.5° resolution
Flood sensitivity Average relative mortality rate from floods (Dilley et al., 2005), aggregated to 0.5° resolution
Landslide sensitivity Average relative mortality rate from landslides (Dilley et al., 2005), aggregated to 0.5° resolution
Exposure Natural hazard exposure Cyclone exposure Average relative frequency and distribution of cyclones (Dilley et al., 2005), aggregated to 0.5° resolution
Flood exposure Average relative frequency and distribution of floods (Dilley et al., 2005), aggregated to 0.5° resolution
Landslide exposure Average relative frequency and distribution of landslides (Dilley et al., 2005), aggregated to 0.5° resolution
Table 6.1
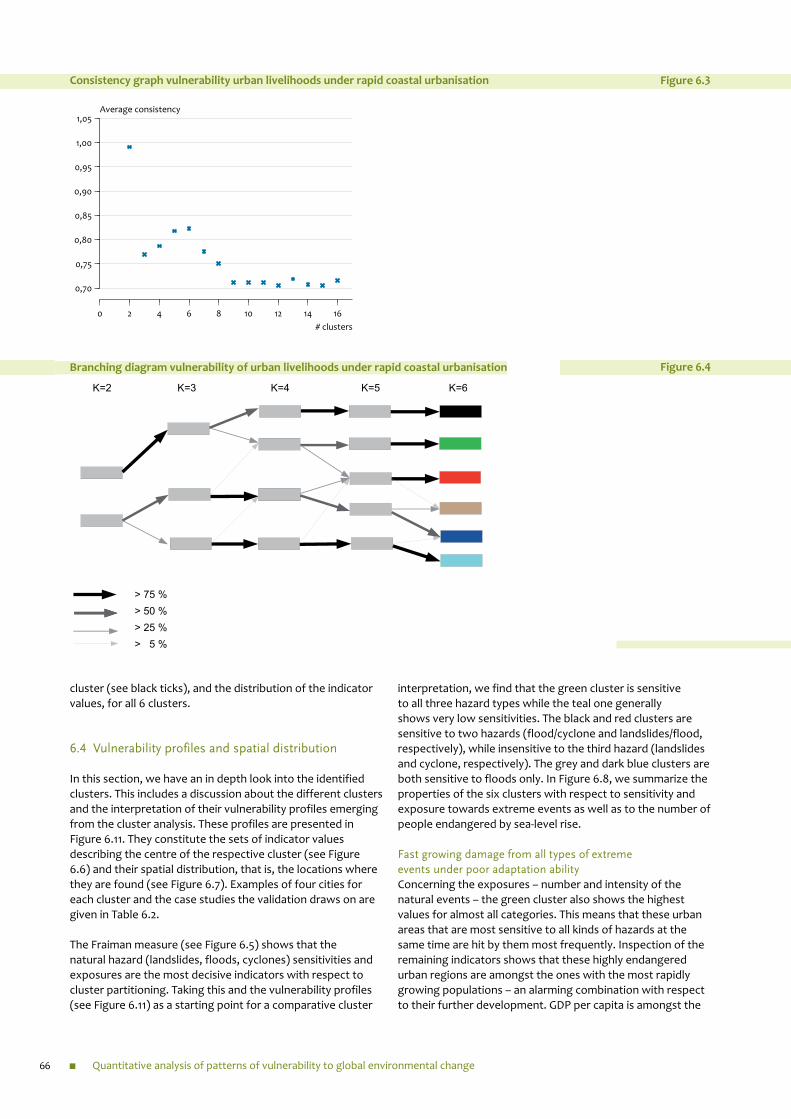
Quantitative analysis of patterns of vulnerability to global environmental change 66
cluster (see black ticks), and the distribution of the indicator values, for all 6 clusters.
6.4 Vulnerability profiles and spatial distribution
In this section, we have an in depth look into the identified clusters. This includes a discussion about the different clusters and the interpretation of their vulnerability profiles emerging from the cluster analysis. These profiles are presented in Figure 6.11. They constitute the sets of indicator values describing the centre of the respective cluster (see Figure 6.6) and their spatial distribution, that is, the locations where they are found (see Figure 6.7). Examples of four cities for each cluster and the case studies the validation draws on are given in Table 6.2.
The Fraiman measure (see Figure 6.5) shows that the natural hazard (landslides, floods, cyclones) sensitivities and exposures are the most decisive indicators with respect to cluster partitioning. Taking this and the vulnerability profiles (see Figure 6.11) as a starting point for a comparative cluster
interpretation, we find that the green cluster is sensitive to all three hazard types while the teal one generally shows very low sensitivities. The black and red clusters are sensitive to two hazards (flood/cyclone and landslides/flood, respectively), while insensitive to the third hazard (landslides and cyclone, respectively). The grey and dark blue clusters are both sensitive to floods only. In Figure 6.8, we summarize the properties of the six clusters with respect to sensitivity and exposure towards extreme events as well as to the number of people endangered by sea-level rise.
Fast growing damage from all types of extreme events under poor adaptation ability Concerning the exposures – number and intensity of the natural events – the green cluster also shows the highest values for almost all categories. This means that these urban areas that are most sensitive to all kinds of hazards at the same time are hit by them most frequently. Inspection of the remaining indicators shows that these highly endangered urban regions are amongst the ones with the most rapidly growing populations – an alarming combination with respect to their further development. GDP per capita is amongst the
Figure 6.3
0 2 4 6 8 10 12 14 16# clusters
0,70
0,75
0,80
0,85
0,90
0,95
1,00
1,05Average consistency
Consistency graph vulnerability urban livelihoods under rapid coastal urbanisation
Figure 6.4Branching diagram vulnerability of urban livelihoods under rapid coastal urbanisation
K=2 K=3 K=4 K=5 K=6
> 75 %> 50 %> 25 %> 5 %
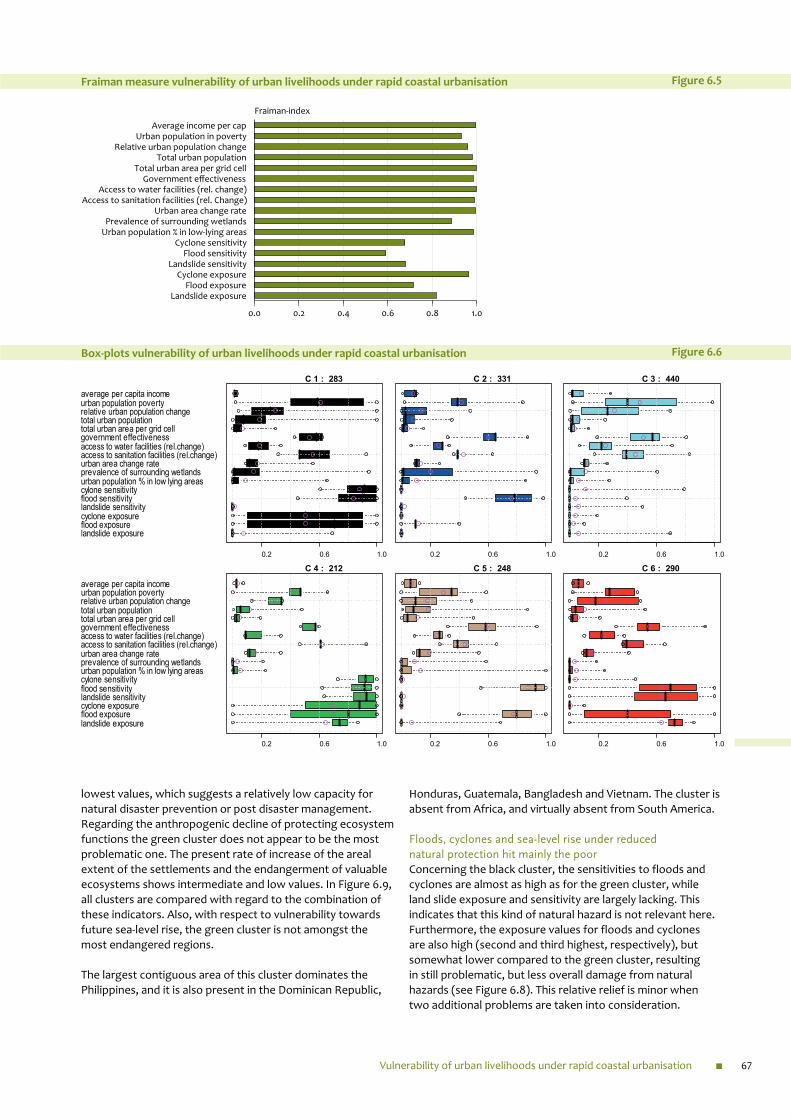
Vulnerability of urban livelihoods under rapid coastal urbanisation 67
lowest values, which suggests a relatively low capacity for natural disaster prevention or post disaster management. Regarding the anthropogenic decline of protecting ecosystem functions the green cluster does not appear to be the most problematic one. The present rate of increase of the areal extent of the settlements and the endangerment of valuable ecosystems shows intermediate and low values. In Figure 6.9, all clusters are compared with regard to the combination of these indicators. Also, with respect to vulnerability towards future sea-level rise, the green cluster is not amongst the most endangered regions.
The largest contiguous area of this cluster dominates the Philippines, and it is also present in the Dominican Republic,
Honduras, Guatemala, Bangladesh and Vietnam. The cluster is absent from Africa, and virtually absent from South America.
Floods, cyclones and sea-level rise under reduced natural protection hit mainly the poorConcerning the black cluster, the sensitivities to floods and cyclones are almost as high as for the green cluster, while land slide exposure and sensitivity are largely lacking. This indicates that this kind of natural hazard is not relevant here. Furthermore, the exposure values for floods and cyclones are also high (second and third highest, respectively), but somewhat lower compared to the green cluster, resulting in still problematic, but less overall damage from natural hazards (see Figure 6.8). This relative relief is minor when two additional problems are taken into consideration.
Figure 6.5
Average income per capUrban population in poverty
Relative urban population changeTotal urban population
Total urban area per grid cellGovernment effectiveness
Access to water facilities (rel. change)Access to sanitation facilities (rel. Change)
Urban area change ratePrevalence of surrounding wetlands
Urban population % in low-lying areasCyclone sensitivity
Flood sensitivityLandslide sensitivity
Cyclone exposureFlood exposure
Landslide exposure
Fraiman-index
0.0 0.2 0.4 0.6 0.8 1.0
Fraiman measure vulnerability of urban livelihoods under rapid coastal urbanisation
Box-plots vulnerability of urban livelihoods under rapid coastal urbanisation
C 1 : 283
0.2 0.6 1.0
C 2 : 331
0.2 0.6 1.0
C 3 : 440
0.2 0.6 1.0
C 4 : 212
0.2 0.6 1.0
C 5 : 248
0.2 0.6 1.0
C 6 : 290
0.2 0.6 1.0
landslide exposureflood exposurecyclone exposurelandslide sensitivityflood sensitivitycylone sensitivityurban population % in low lying areasprevalence of surrounding wetlandsurban area change rateaccess to sanitation facilities (rel.change)access to water facilities (rel.change)government effectivenesstotal urban area per grid celltotal urban populationrelative urban population changeurban population povertyaverage per capita income
landslide exposureflood exposurecyclone exposurelandslide sensitivityflood sensitivitycylone sensitivityurban population % in low lying areasprevalence of surrounding wetlandsurban area change rateaccess to sanitation facilities (rel.change)access to water facilities (rel.change)government effectivenesstotal urban area per grid celltotal urban populationrelative urban population changeurban population povertyaverage per capita income
Figure 6.6
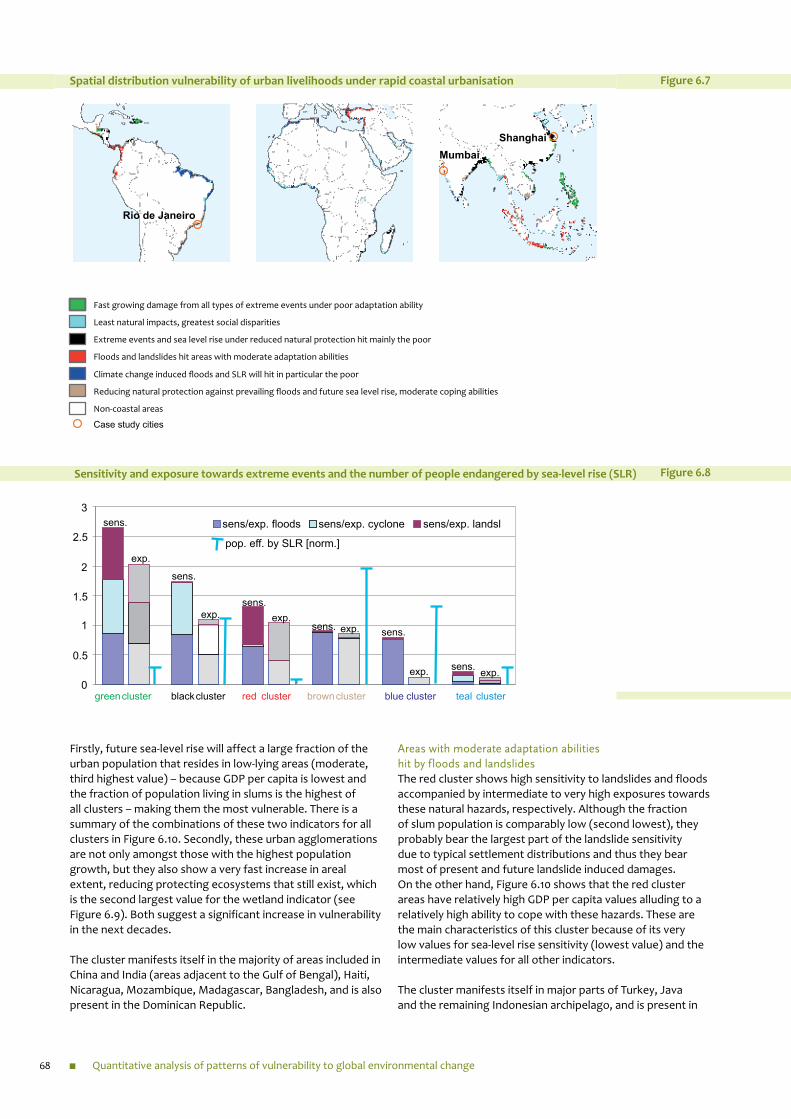
Quantitative analysis of patterns of vulnerability to global environmental change 68
Firstly, future sea-level rise will affect a large fraction of the urban population that resides in low-lying areas (moderate, third highest value) – because GDP per capita is lowest and the fraction of population living in slums is the highest of all clusters – making them the most vulnerable. There is a summary of the combinations of these two indicators for all clusters in Figure 6.10. Secondly, these urban agglomerations are not only amongst those with the highest population growth, but they also show a very fast increase in areal extent, reducing protecting ecosystems that still exist, which is the second largest value for the wetland indicator (see Figure 6.9). Both suggest a significant increase in vulnerability in the next decades.
The cluster manifests itself in the majority of areas included in China and India (areas adjacent to the Gulf of Bengal), Haiti, Nicaragua, Mozambique, Madagascar, Bangladesh, and is also present in the Dominican Republic.
Areas with moderate adaptation abilities hit by floods and landslides The red cluster shows high sensitivity to landslides and floods accompanied by intermediate to very high exposures towards these natural hazards, respectively. Although the fraction of slum population is comparably low (second lowest), they probably bear the largest part of the landslide sensitivity due to typical settlement distributions and thus they bear most of present and future landslide induced damages. On the other hand, Figure 6.10 shows that the red cluster areas have relatively high GDP per capita values alluding to a relatively high ability to cope with these hazards. These are the main characteristics of this cluster because of its very low values for sea-level rise sensitivity (lowest value) and the intermediate values for all other indicators.
The cluster manifests itself in major parts of Turkey, Java and the remaining Indonesian archipelago, and is present in
Figure 6.7
Rio de Janeiro
Spatial distribution vulnerability of urban livelihoods under rapid coastal urbanisation
Fast growing damage from all types of extreme events under poor adaptation ability
Least natural impacts, greatest social disparities
Extreme events and sea level rise under reduced natural protection hit mainly the poor
Floods and landslides hit areas with moderate adaptation abilities
Climate change induced floods and SLR will hit in particular the poor
Reducing natural protection against prevailing floods and future sea level rise, moderate coping abilities
Non-coastal areas
Case study cities
ShanghaiMumbai
Figure 6.8Sensitivity and exposure towards extreme events and the number of people endangered by sea-level rise (SLR)
0
0.5
1
1.5
2
2.5
3
greencluster blackcluster red cluster browncluster blue cluster teal cluster
sens/exp. floods sens/exp. cyclone sens/exp. landsl
sens.sens.
sens.
sens.
sens.
sens. exp.exp.
exp.exp.exp.
exp.pop. eff. by SLR [norm.]
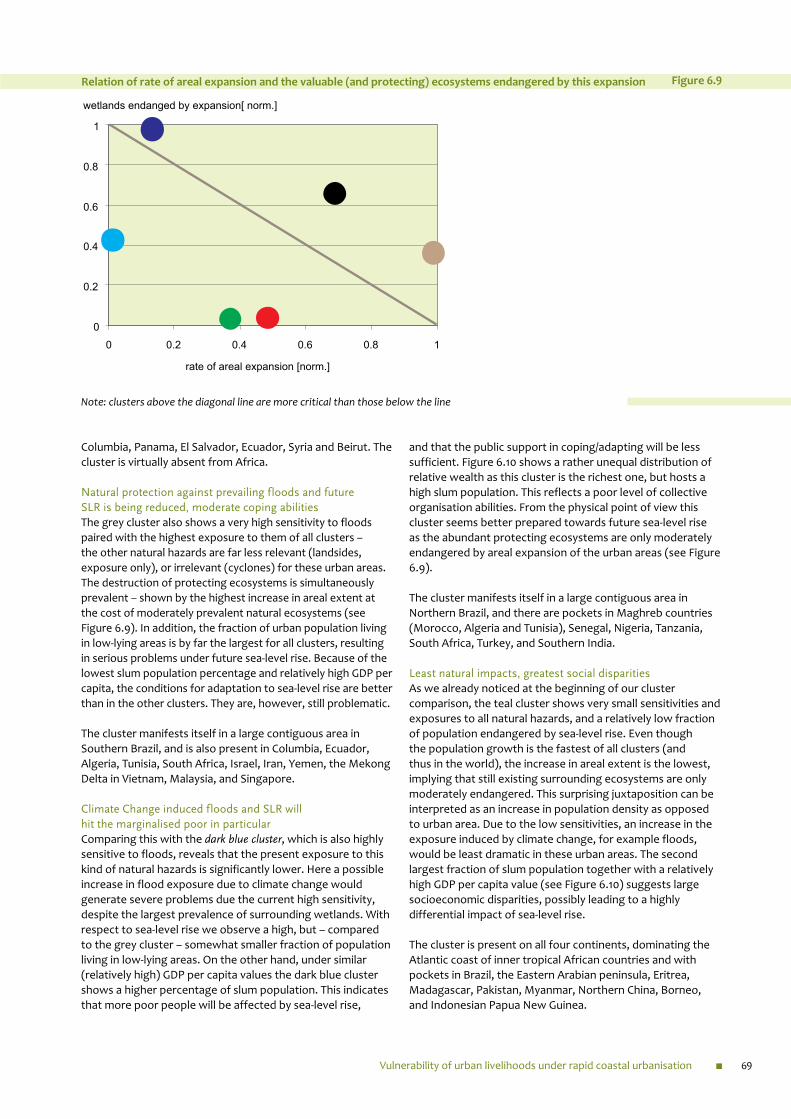
Vulnerability of urban livelihoods under rapid coastal urbanisation 69
Columbia, Panama, El Salvador, Ecuador, Syria and Beirut. The cluster is virtually absent from Africa.
Natural protection against prevailing floods and future SLR is being reduced, moderate coping abilitiesThe grey cluster also shows a very high sensitivity to floods paired with the highest exposure to them of all clusters – the other natural hazards are far less relevant (landsides, exposure only), or irrelevant (cyclones) for these urban areas. The destruction of protecting ecosystems is simultaneously prevalent – shown by the highest increase in areal extent at the cost of moderately prevalent natural ecosystems (see Figure 6.9). In addition, the fraction of urban population living in low-lying areas is by far the largest for all clusters, resulting in serious problems under future sea-level rise. Because of the lowest slum population percentage and relatively high GDP per capita, the conditions for adaptation to sea-level rise are better than in the other clusters. They are, however, still problematic.
The cluster manifests itself in a large contiguous area in Southern Brazil, and is also present in Columbia, Ecuador, Algeria, Tunisia, South Africa, Israel, Iran, Yemen, the Mekong Delta in Vietnam, Malaysia, and Singapore.
Climate Change induced floods and SLR will hit the marginalised poor in particularComparing this with the dark blue cluster, which is also highly sensitive to floods, reveals that the present exposure to this kind of natural hazards is significantly lower. Here a possible increase in flood exposure due to climate change would generate severe problems due the current high sensitivity, despite the largest prevalence of surrounding wetlands. With respect to sea-level rise we observe a high, but – compared to the grey cluster – somewhat smaller fraction of population living in low-lying areas. On the other hand, under similar (relatively high) GDP per capita values the dark blue cluster shows a higher percentage of slum population. This indicates that more poor people will be affected by sea-level rise,
and that the public support in coping/adapting will be less sufficient. Figure 6.10 shows a rather unequal distribution of relative wealth as this cluster is the richest one, but hosts a high slum population. This reflects a poor level of collective organisation abilities. From the physical point of view this cluster seems better prepared towards future sea-level rise as the abundant protecting ecosystems are only moderately endangered by areal expansion of the urban areas (see Figure 6.9).
The cluster manifests itself in a large contiguous area in Northern Brazil, and there are pockets in Maghreb countries (Morocco, Algeria and Tunisia), Senegal, Nigeria, Tanzania, South Africa, Turkey, and Southern India.
Least natural impacts, greatest social disparitiesAs we already noticed at the beginning of our cluster comparison, the teal cluster shows very small sensitivities and exposures to all natural hazards, and a relatively low fraction of population endangered by sea-level rise. Even though the population growth is the fastest of all clusters (and thus in the world), the increase in areal extent is the lowest, implying that still existing surrounding ecosystems are only moderately endangered. This surprising juxtaposition can be interpreted as an increase in population density as opposed to urban area. Due to the low sensitivities, an increase in the exposure induced by climate change, for example floods, would be least dramatic in these urban areas. The second largest fraction of slum population together with a relatively high GDP per capita value (see Figure 6.10) suggests large socioeconomic disparities, possibly leading to a highly differential impact of sea-level rise.
The cluster is present on all four continents, dominating the Atlantic coast of inner tropical African countries and with pockets in Brazil, the Eastern Arabian peninsula, Eritrea, Madagascar, Pakistan, Myanmar, Northern China, Borneo, and Indonesian Papua New Guinea.
Note: clusters above the diagonal line are more critical than those below the line
Figure 6.9Relation of rate of areal expansion and the valuable (and protecting) ecosystems endangered by this expansion
0
0.2
0.4
0.6
0.8
1
0 0.2 0.4 0.6 0.8 1
rate of areal expansion [norm.]
wetlands endanged by expansion[ norm.]
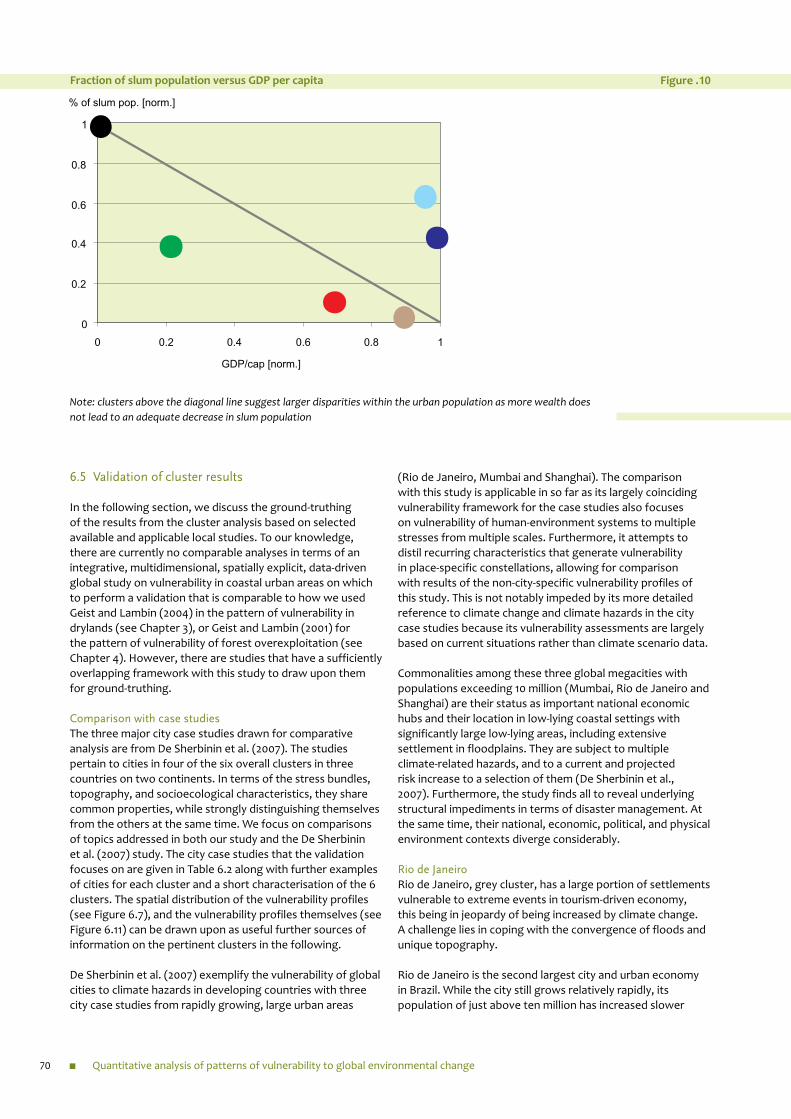
Quantitative analysis of patterns of vulnerability to global environmental change 70
6.5 Validation of cluster results
In the following section, we discuss the ground-truthing of the results from the cluster analysis based on selected available and applicable local studies. To our knowledge, there are currently no comparable analyses in terms of an integrative, multidimensional, spatially explicit, data-driven global study on vulnerability in coastal urban areas on which to perform a validation that is comparable to how we used Geist and Lambin (2004) in the pattern of vulnerability in drylands (see Chapter 3), or Geist and Lambin (2001) for the pattern of vulnerability of forest overexploitation (see Chapter 4). However, there are studies that have a sufficiently overlapping framework with this study to draw upon them for ground-truthing.
Comparison with case studiesThe three major city case studies drawn for comparative analysis are from De Sherbinin et al. (2007). The studies pertain to cities in four of the six overall clusters in three countries on two continents. In terms of the stress bundles, topography, and socioecological characteristics, they share common properties, while strongly distinguishing themselves from the others at the same time. We focus on comparisons of topics addressed in both our study and the De Sherbinin et al. (2007) study. The city case studies that the validation focuses on are given in Table 6.2 along with further examples of cities for each cluster and a short characterisation of the 6 clusters. The spatial distribution of the vulnerability profiles (see Figure 6.7), and the vulnerability profiles themselves (see Figure 6.11) can be drawn upon as useful further sources of information on the pertinent clusters in the following.
De Sherbinin et al. (2007) exemplify the vulnerability of global cities to climate hazards in developing countries with three city case studies from rapidly growing, large urban areas
(Rio de Janeiro, Mumbai and Shanghai). The comparison with this study is applicable in so far as its largely coinciding vulnerability framework for the case studies also focuses on vulnerability of human-environment systems to multiple stresses from multiple scales. Furthermore, it attempts to distil recurring characteristics that generate vulnerability in place-specific constellations, allowing for comparison with results of the non-city-specific vulnerability profiles of this study. This is not notably impeded by its more detailed reference to climate change and climate hazards in the city case studies because its vulnerability assessments are largely based on current situations rather than climate scenario data.
Commonalities among these three global megacities with populations exceeding 10 million (Mumbai, Rio de Janeiro and Shanghai) are their status as important national economic hubs and their location in low-lying coastal settings with significantly large low-lying areas, including extensive settlement in floodplains. They are subject to multiple climate-related hazards, and to a current and projected risk increase to a selection of them (De Sherbinin et al., 2007). Furthermore, the study finds all to reveal underlying structural impediments in terms of disaster management. At the same time, their national, economic, political, and physical environment contexts diverge considerably.
Rio de JaneiroRio de Janeiro, grey cluster, has a large portion of settlements vulnerable to extreme events in tourism-driven economy, this being in jeopardy of being increased by climate change. A challenge lies in coping with the convergence of floods and unique topography.
Rio de Janeiro is the second largest city and urban economy in Brazil. While the city still grows relatively rapidly, its population of just above ten million has increased slower
Note: clusters above the diagonal line suggest larger disparities within the urban population as more wealth does not lead to an adequate decrease in slum population
Figure .10Fraction of slum population versus GDP per capita
0
0.2
0.4
0.6
0.8
1
0 0.2 0.4 0.6 0.8 1
GDP/cap [norm.]
% of slum pop. [norm.]
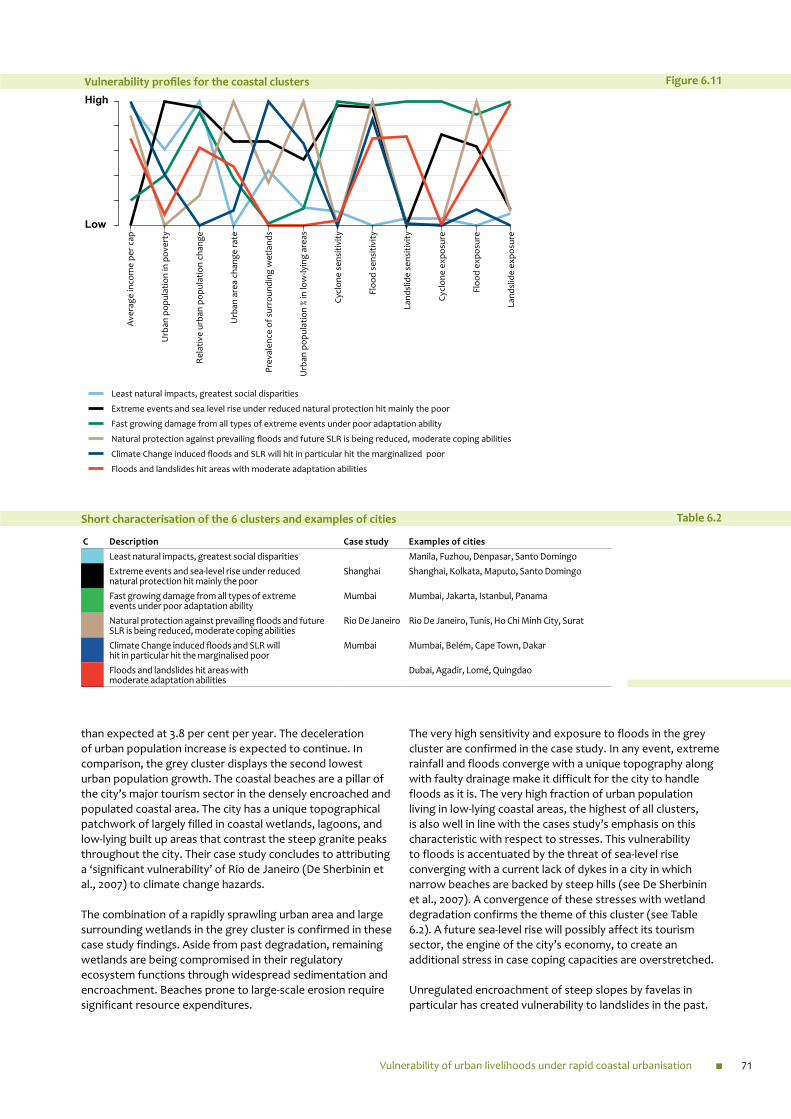
Vulnerability of urban livelihoods under rapid coastal urbanisation 71
than expected at 3.8 per cent per year. The deceleration of urban population increase is expected to continue. In comparison, the grey cluster displays the second lowest urban population growth. The coastal beaches are a pillar of the city’s major tourism sector in the densely encroached and populated coastal area. The city has a unique topographical patchwork of largely filled in coastal wetlands, lagoons, and low-lying built up areas that contrast the steep granite peaks throughout the city. Their case study concludes to attributing a ‘significant vulnerability’ of Rio de Janeiro (De Sherbinin et al., 2007) to climate change hazards.
The combination of a rapidly sprawling urban area and large surrounding wetlands in the grey cluster is confirmed in these case study findings. Aside from past degradation, remaining wetlands are being compromised in their regulatory ecosystem functions through widespread sedimentation and encroachment. Beaches prone to large-scale erosion require significant resource expenditures.
The very high sensitivity and exposure to floods in the grey cluster are confirmed in the case study. In any event, extreme rainfall and floods converge with a unique topography along with faulty drainage make it difficult for the city to handle floods as it is. The very high fraction of urban population living in low-lying coastal areas, the highest of all clusters, is also well in line with the cases study’s emphasis on this characteristic with respect to stresses. This vulnerability to floods is accentuated by the threat of sea-level rise converging with a current lack of dykes in a city in which narrow beaches are backed by steep hills (see De Sherbinin et al., 2007). A convergence of these stresses with wetland degradation confirms the theme of this cluster (see Table 6.2). A future sea-level rise will possibly affect its tourism sector, the engine of the city’s economy, to create an additional stress in case coping capacities are overstretched.
Unregulated encroachment of steep slopes by favelas in particular has created vulnerability to landslides in the past.
Figure 6.11
Ave
rage
inco
me
per c
ap
Urb
an p
opul
atio
n in
pov
erty
Rel
ativ
e ur
ban
popu
latio
n ch
ange
Urb
an a
rea
chan
ge ra
te
Prev
alen
ce o
f sur
roun
ding
wet
land
s
Urb
an p
opul
atio
n %
in lo
w-ly
ing
area
s
Cycl
one
sens
itivi
ty
Floo
d se
nsiti
vity
Land
slid
e se
nsiti
vity
Cycl
one
expo
sure
Floo
d ex
posu
re
Land
slid
e ex
posu
re
Least natural impacts, greatest social disparities
Extreme events and sea level rise under reduced natural protection hit mainly the poor
Fast growing damage from all types of extreme events under poor adaptation ability
Natural protection against prevailing floods and future SLR is being reduced, moderate coping abilities
Climate Change induced floods and SLR will hit in particular hit the marginalized poor
Floods and landslides hit areas with moderate adaptation abilities
Vulnerability profiles for the coastal clustersHigh
Low
Short characterisation of the 6 clusters and examples of cities
C Description Case study Examples of citiesLeast natural impacts, greatest social disparities Manila, Fuzhou, Denpasar, Santo DomingoExtreme events and sea-level rise under reduced natural protection hit mainly the poor
Shanghai Shanghai, Kolkata, Maputo, Santo Domingo
Fast growing damage from all types of extreme events under poor adaptation ability
Mumbai Mumbai, Jakarta, Istanbul, Panama
Natural protection against prevailing floods and future SLR is being reduced, moderate coping abilities
Rio De Janeiro Rio De Janeiro, Tunis, Ho Chi Minh City, Surat
Climate Change induced floods and SLR will hit in particular hit the marginalised poor
Mumbai Mumbai, Belém, Cape Town, Dakar
Floods and landslides hit areas with moderate adaptation abilities
Dubai, Agadir, Lomé, Quingdao
Table 6.2
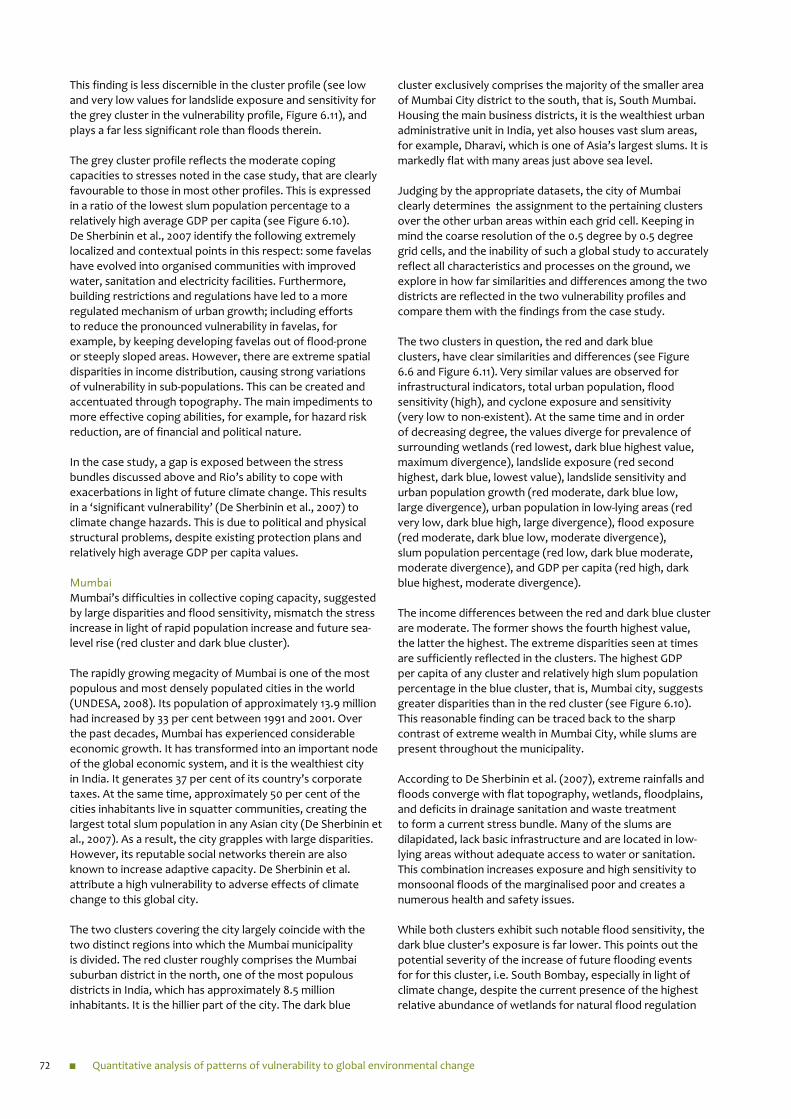
Quantitative analysis of patterns of vulnerability to global environmental change 72
This finding is less discernible in the cluster profile (see low and very low values for landslide exposure and sensitivity for the grey cluster in the vulnerability profile, Figure 6.11), and plays a far less significant role than floods therein.
The grey cluster profile reflects the moderate coping capacities to stresses noted in the case study, that are clearly favourable to those in most other profiles. This is expressed in a ratio of the lowest slum population percentage to a relatively high average GDP per capita (see Figure 6.10). De Sherbinin et al., 2007 identify the following extremely localized and contextual points in this respect: some favelas have evolved into organised communities with improved water, sanitation and electricity facilities. Furthermore, building restrictions and regulations have led to a more regulated mechanism of urban growth; including efforts to reduce the pronounced vulnerability in favelas, for example, by keeping developing favelas out of flood-prone or steeply sloped areas. However, there are extreme spatial disparities in income distribution, causing strong variations of vulnerability in sub-populations. This can be created and accentuated through topography. The main impediments to more effective coping abilities, for example, for hazard risk reduction, are of financial and political nature.
In the case study, a gap is exposed between the stress bundles discussed above and Rio’s ability to cope with exacerbations in light of future climate change. This results in a ‘significant vulnerability’ (De Sherbinin et al., 2007) to climate change hazards. This is due to political and physical structural problems, despite existing protection plans and relatively high average GDP per capita values.
MumbaiMumbai’s difficulties in collective coping capacity, suggested by large disparities and flood sensitivity, mismatch the stress increase in light of rapid population increase and future sea-level rise (red cluster and dark blue cluster).
The rapidly growing megacity of Mumbai is one of the most populous and most densely populated cities in the world (UNDESA, 2008). Its population of approximately 13.9 million had increased by 33 per cent between 1991 and 2001. Over the past decades, Mumbai has experienced considerable economic growth. It has transformed into an important node of the global economic system, and it is the wealthiest city in India. It generates 37 per cent of its country’s corporate taxes. At the same time, approximately 50 per cent of the cities inhabitants live in squatter communities, creating the largest total slum population in any Asian city (De Sherbinin et al., 2007). As a result, the city grapples with large disparities. However, its reputable social networks therein are also known to increase adaptive capacity. De Sherbinin et al. attribute a high vulnerability to adverse effects of climate change to this global city.
The two clusters covering the city largely coincide with the two distinct regions into which the Mumbai municipality is divided. The red cluster roughly comprises the Mumbai suburban district in the north, one of the most populous districts in India, which has approximately 8.5 million inhabitants. It is the hillier part of the city. The dark blue
cluster exclusively comprises the majority of the smaller area of Mumbai City district to the south, that is, South Mumbai. Housing the main business districts, it is the wealthiest urban administrative unit in India, yet also houses vast slum areas, for example, Dharavi, which is one of Asia’s largest slums. It is markedly flat with many areas just above sea level.
Judging by the appropriate datasets, the city of Mumbai clearly determines the assignment to the pertaining clusters over the other urban areas within each grid cell. Keeping in mind the coarse resolution of the 0.5 degree by 0.5 degree grid cells, and the inability of such a global study to accurately reflect all characteristics and processes on the ground, we explore in how far similarities and differences among the two districts are reflected in the two vulnerability profiles and compare them with the findings from the case study.
The two clusters in question, the red and dark blue clusters, have clear similarities and differences (see Figure 6.6 and Figure 6.11). Very similar values are observed for infrastructural indicators, total urban population, flood sensitivity (high), and cyclone exposure and sensitivity (very low to non-existent). At the same time and in order of decreasing degree, the values diverge for prevalence of surrounding wetlands (red lowest, dark blue highest value, maximum divergence), landslide exposure (red second highest, dark blue, lowest value), landslide sensitivity and urban population growth (red moderate, dark blue low, large divergence), urban population in low-lying areas (red very low, dark blue high, large divergence), flood exposure (red moderate, dark blue low, moderate divergence), slum population percentage (red low, dark blue moderate, moderate divergence), and GDP per capita (red high, dark blue highest, moderate divergence).
The income differences between the red and dark blue cluster are moderate. The former shows the fourth highest value, the latter the highest. The extreme disparities seen at times are sufficiently reflected in the clusters. The highest GDP per capita of any cluster and relatively high slum population percentage in the blue cluster, that is, Mumbai city, suggests greater disparities than in the red cluster (see Figure 6.10). This reasonable finding can be traced back to the sharp contrast of extreme wealth in Mumbai City, while slums are present throughout the municipality.
According to De Sherbinin et al. (2007), extreme rainfalls and floods converge with flat topography, wetlands, floodplains, and deficits in drainage sanitation and waste treatment to form a current stress bundle. Many of the slums are dilapidated, lack basic infrastructure and are located in low-lying areas without adequate access to water or sanitation. This combination increases exposure and high sensitivity to monsoonal floods of the marginalised poor and creates a numerous health and safety issues.
While both clusters exhibit such notable flood sensitivity, the dark blue cluster’s exposure is far lower. This points out the potential severity of the increase of future flooding events for for this cluster, i.e. South Bombay, especially in light of climate change, despite the current presence of the highest relative abundance of wetlands for natural flood regulation
Vulnerability of urban livelihoods under rapid coastal urbanisation 73
and the complete lack of them in the red cluster, and little urban expansion (see Figure 6.9).This adds further detail to the localized case study.
According to De Sherbinin et al. (2007), these stresses will be increased by sea-level rise as the city continues to expand into low-lying coastal areas, despite legislation to keep residential areas away from them. Again, a differentiation within municipal Mumbai is well reflected in the clusters through a very high vulnerability to sea-level rise in prone low-lying areas in the south (dark blue cluster) – due to the large population living in such areas – and far less so in the north.
In the case study, this forms a further stress bundle by converging with a rapid increase of a large and growing population, a lack of dykes and armaments, low income, and local authorities with little ability to improve this. Thus, the cities marginalised population is highly vulnerable, however uncertain the actual degree is, to climate-change-driven sea-level rise, and an increase of natural hazard frequency and intensity. In how far this plays out differently according to the two clusters is a function of urban planning and management, wetland protection, flood sensitivity, and further population increase in flood-prone areas.
Landslides are an additional hazard close to steeper slopes in combination with torrential rainfall. According to the clusters, and in agreement with the ground, this only applies to the hilly northern Mumbai suburban district, where both exposure and sensitivity to landslides are high, and very high, respectively. The Mumbai City district is flat and devoid of such landslide vulnerability.
ShanghaiShanghai, black cluster, has a moderate percentage of low-lying and marginalised populations reliant on increasingly stressed yet adaptable urban management for coping with stress bundles causing or favouring floods.
According to the case study, Shanghai has been undergoing a fundamental transition in the past two decades. It is a city of superlatives in many aspects. It has the largest urban population of any area in China with approximately 16.5 million inhabitants in the municipality. The financial capital of the country is also a major industrial centre and hosts one of the largest cargo ports in the world. While endemic city growth was the first in China to come to a halt, and even decrease, this phenomenon has been overcompensated by very rapid in-migration. This has led to an increase of disparities (De Sherbinin et al., 2007). With an average elevation of four metres above sea level, a rapidly growing urban population and area, and a large percentage of marginalised people, this city located on a favourable port is perhaps exemplary for this pattern of vulnerability in terms of an increasingly challenged urban management.
The climate is subtropical and monsoonal. The city is built on the soft soil of the low-lying alluvial plain at the mouth of the major Yangtze River Delta, adjacent to the East China Sea. The Huangpu River bisects the city as an additional source of water. Tropical cyclones and accompanying storm surges are common in the summer and autumn months, and
can converge with riverine flooding from various sources. Thus, the flourishing economy has numerous incentives for protecting itself against the hazards arising from its setting. Water resource extraction to supply the city causes pronounced subsidence. The increasing intrusion of seawater leads to salination of the water table. These processes are ongoing despite massive projects to decrease these effects (see De Sherbinin et al., 2007).
The city’s notable and well-established prevention measures against floods have markedly decreased the sensitivity to floods through dykes, afforestation and reforestation. At the same time, the city also suffers impediments from lack of structural coordination and fragmented political authority on different levels of governance.
De Sherbinin et al. (2007) identified two stress bundles to present and future climate hazards related to flooding and future climate change. Shanghai’s flat topography, flood-prone areas, and widespread subsidence converge with future sea-level rise, potential precipitation increase, and current proneness to riverine and coastal flooding. Furthermore, rapid population growth, sea-level rise, increased water use, subsidence, and concentration population growth in increasingly flood-prone areas can converge with a diminishing capacity to curb and deal with these processes. The result would be a gap in the city’s ability to cope with these stresses.
In light of the mechanism, the interpretation of the black cluster displayed very similar characteristics to those in both stress bundles for the current situation. The second most rapid urban population growth, high exposure combined with very high sensitivity to floods and cyclones, converge with a moderate percentage of the urban population in areas prone to a one metre sea-level rise – and thus flooding as well –, the highest percentage of slum population of any cluster, and the lowest average GDP per capita. At the same time, a rapidly sprawling urban area threatens to further reduce flood-alleviating functions of the abundance of surrounding wetlands characterizing the flat topography in this cluster, indicating an additional bundle of stresses, with evident links to the one already discerned. In our study, the noted reduction of vulnerability to floods in Shanghai is not reflected in the proxies for adaptive capacity. The virtual absence of landslide sensitivity and exposure is in line with their absence of being a threat in Shanghai with its flat topography.
Overall conclusionWithin the constraint of in how far they are methodologically comparable, the validation of selected clusters through city case studies shows very large agreements in each of the three examples. The general characteristics largely match, and in many cases this also pertains to the ‘stress bundles’ identified in this study and in the case studies (see Section 1.8). In any case, localized studies provide much needed insights into detailed knowledge that lies beyond what this intermediate scale study – between global and local – can incorporate and explain. This especially pertains to governance and management issues, which are incorporated in the qualitative and quantitative analysis.
Quantitative analysis of patterns of vulnerability to global environmental change 74
6.6 Conclusions
Based on a collection of relevant mechanisms generating vulnerability in rapidly urbanising coastal areas, 17 indicators that describe the current situation were identified. The subsequent cluster analysis yielded six clearly distinguishable vulnerability profiles. During the interpretation of these profiles – typical indicator constellations – six major aspects were identified to be most important, including the combination of sensitivity and exposure to natural hazards, the sensitivity to future sea-level rise, the rate of population growth, the rate of destruction of natural protection structures by urban spatial expansion, the average income and the distribution of wealth and marginalisation. It appeared that these problems occur in specific combinations as explained in Section 6.4.
With the interpretation of the vulnerability profiles alone, some interesting policy relevant conclusions can be already drawn from the study. An example of this would be the dark blue profile in Figure 6.11, including cities like Belém, Cape Town and Dakar, which show high sensitivities while present exposures are relatively low at the same time. This tells us that here present damages – exposure and sensitivity – do not act as an ‘early warning sign’ for the much larger damages to be expected under climate change. Furthermore, this typically coincides with a relatively high income – adaptation is possible – but also a large fraction of marginalised people, the latter suggesting poor social coherence with adverse effects on necessary collective actions. A multitude of conclusions of this type can be drawn from the vulnerability profiles, depending on the particular viewing angle taken.
On the other hand, urban agglomerations belonging to one vulnerability profile are not totally uniform. The three case studies discussed show detailed local dynamics that are beyond the functional resolution of the cluster analysis – they have their individual characteristics. Even if these could, in principle, be covered by the chosen indicators, it is possible that they would would not play a role in the discrimination of clusters.
Of high importance for cluster discrimination are the sensitivity and exposure indicators stressing how natural disasters and extreme events are key vulnerabilities of rapidly growing urban agglomerations, as has been also identified for cities in general (Pelling, 2003). This point is emphasized further by rapid urban growth and a potential increase in frequency and intensity driven by climate change. Furthermore, there are clear and interpretable relations between these hazard patterns and the socioeconomic indicators such as slum population or average GDP per capita, as well as between these hazard patterns and the characteristics of spatial expansion of the urban agglomerations.
These findings help explain how these indicators potentially override information from infrastructure and management dimensions, which results in the latter playing a less important role in the interpretation than in the mechanism (see Table 1.1). For example, infrastructural and health indicators – such as relative change of access to adequate
water and sanitation facilities – and the management indicator for government effectiveness reveal less distinct profiles and evident interpretations for each cluster. There seems to be no typical and interpretable constellations of these indicators with respect to the dominating natural hazard and the socioeconomic indicators. At the current stage of this study, this finding points out limits of stereotyping such a mechanism into clusters, because it does not enable systematic handling of how urban management interplays with other important parts of the basic vulnerability creating mechanism. Because no typical combinations exist, it seems a case-by-case analysis is necessary with respect to these aspects.
The study reveals how the cluster most exposed and sensitive to all three inspected natural hazards is also experiencing some of the highest urban population growth worldwide. This gives rise to the question in how far urban management can effectively tackle such a stress bundle in the present and future in light of climate change.
Using patterns of vulnerability to explain other outcomes 75
The methodology developed in this report and applied in the previous chapters look into vulnerability creating mechanisms that create specific patterns of vulnerability. Some issues are, however, not included, because incidence is too low to become part of the general pattern of vulnerability or hard to capture as part of an indicator-based analysis. This is due to the lack of data regarding conflict, migration and collapse of ecosystems. When that occurs, we assess whether or not the patterns of vulnerability can also be used to analyse specific outcome measures, that is, impacts. We use the analysis of the pattern of vulnerability on the vulnerability of smallholder farmers in drylands (Chapter 3) to assess the possible connection between environmental and socioeconomic conditions, and violent conflicts. In addition to this, the analysis tries to contribute to the discussion regarding the predominant factors that explain armed conflicts and it presents arguments for a more integrated understanding. Due to the fact that several potentially important factors regarding the political system or the existence of non-renewable resources are beyond the scope of this report, the analysis here describes the additional effect of the considered environmental and socioeconomical conditions, which do appear to be significant. It also discusses if the effect of these conditions can be better described with an additive linear or a non-linear approach, the latter based on the clusters as identified in Chapter 3.
7.1 Global environmental change and the incidence of armed conflict
Presently, there is a vibrant discussion on the possible connection that environmental and socioeconomic conditions have with violent conflicts; and in relation to this is the question as to whether or not the change of the environmental factor ‘climate’ will have a significant impact on violent conflict occurrence (Burke et al., 2009).
Neo-Malthusians and their detractors have been arguing the effects of resource scarcity and resource abundance on social outcomes. Thomas Homer-Dixon has elaborated the argument that conflicts occur due to ‘supply-induced’ scarcity
of resources, particularly renewable resources (Homer-Dixon and Blitt, 1998; Homer-Dixon, 1999; Bächler, 2000). Others have challenged these views as being too simplistic, often pointing to the fact that countries with large resources such as lootable diamonds, oil, timber and the like, have tended to do worse both economically and politically. Thus, access to profits from selling resources for overcoming poverty-related social predicaments have not generally helped societies, and in many cases harm them (de Soysa, 2002; Collier et al., 2003; Ross, 2004; Theisen, 2008). Moreover, studies that particularly focused on a single indicator, such as water, as a source of conflict have generally not been able to find definitive evidence in support of the environmental scarcity arguments (Wolf, 1999; Meier et al., 2007; Benjaminsen, 2008). On the other hand, the recent study by Burke et al. (2009) shows a significant relation between the incidences of civil war in Africa with the variations in mean annual temperature. It also supports the viewpoint that climate change, which will affect the environment in which we live, could accelerate the security risks emanating from environmental factors (MA, 2003) (Stern, 2006). Other assessments mention changing weather patterns as possible causes of conflict within and between states (MA, 2003; Barnett and Adger, 2007; Salehyan, 2008). This can result in feedback loops, as it is argued that non-climate stresses, such as conflict, can increase the vulnerability to climate change and reduce the capacity to adapt to it (Pachauri, 2007).
Few large-N empirical studies have tried to understand how environmental scarcities and poverty-related factors may cluster in space to form vulnerability of a broader nature that may influence the outbreak of violent conflict. In this chapter, we use the map of vulnerability profiles within a drylands and overlay this map with a map of conflict occurrence to see how well they correspond with each other, and which of the clusters are likely to explain conflict.
Using patterns of vulnerability to explain other outcomes
7
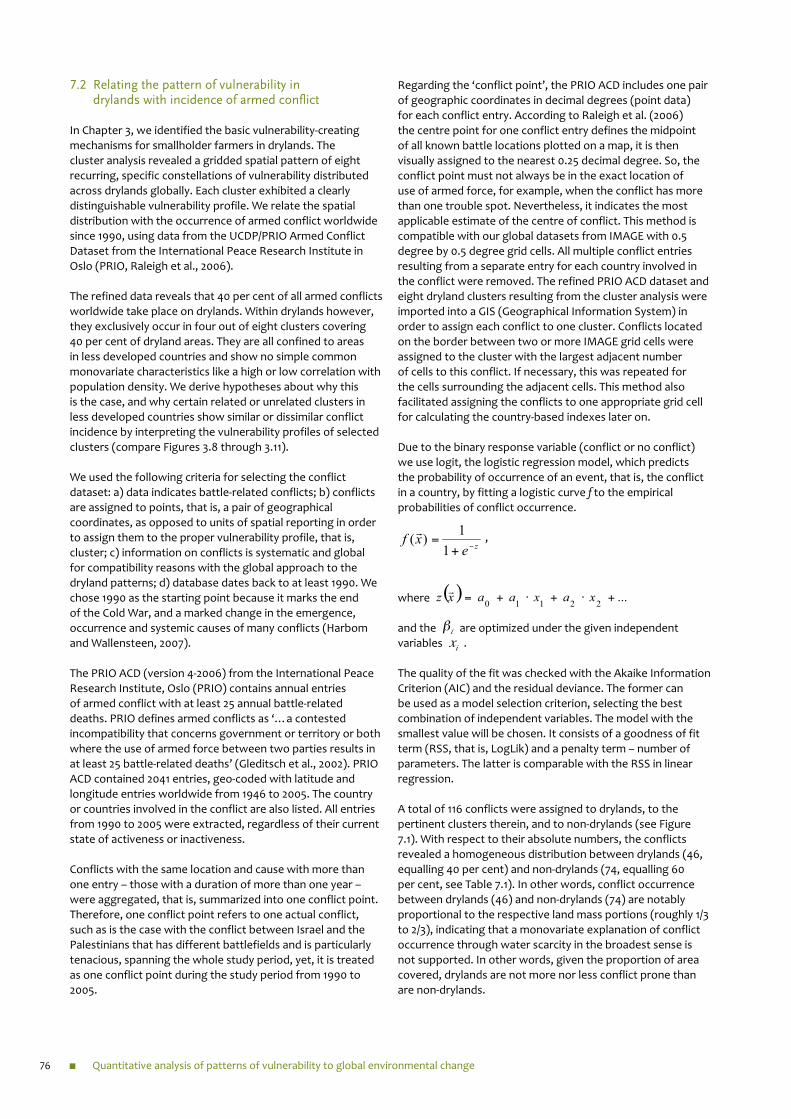
Quantitative analysis of patterns of vulnerability to global environmental change 76
7.2 Relating the pattern of vulnerability in drylands with incidence of armed conflict
In Chapter 3, we identified the basic vulnerability-creating mechanisms for smallholder farmers in drylands. The cluster analysis revealed a gridded spatial pattern of eight recurring, specific constellations of vulnerability distributed across drylands globally. Each cluster exhibited a clearly distinguishable vulnerability profile. We relate the spatial distribution with the occurrence of armed conflict worldwide since 1990, using data from the UCDP/PRIO Armed Conflict Dataset from the International Peace Research Institute in Oslo (PRIO, Raleigh et al., 2006).
The refined data reveals that 40 per cent of all armed conflicts worldwide take place on drylands. Within drylands however, they exclusively occur in four out of eight clusters covering 40 per cent of dryland areas. They are all confined to areas in less developed countries and show no simple common monovariate characteristics like a high or low correlation with population density. We derive hypotheses about why this is the case, and why certain related or unrelated clusters in less developed countries show similar or dissimilar conflict incidence by interpreting the vulnerability profiles of selected clusters (compare Figures 3.8 through 3.11).
We used the following criteria for selecting the conflict dataset: a) data indicates battle-related conflicts; b) conflicts are assigned to points, that is, a pair of geographical coordinates, as opposed to units of spatial reporting in order to assign them to the proper vulnerability profile, that is, cluster; c) information on conflicts is systematic and global for compatibility reasons with the global approach to the dryland patterns; d) database dates back to at least 1990. We chose 1990 as the starting point because it marks the end of the Cold War, and a marked change in the emergence, occurrence and systemic causes of many conflicts (Harbom and Wallensteen, 2007).
The PRIO ACD (version 4-2006) from the International Peace Research Institute, Oslo (PRIO) contains annual entries of armed conflict with at least 25 annual battle-related deaths. PRIO defines armed conflicts as ‘…a contested incompatibility that concerns government or territory or both where the use of armed force between two parties results in at least 25 battle-related deaths’ (Gleditsch et al., 2002). PRIO ACD contained 2041 entries, geo-coded with latitude and longitude entries worldwide from 1946 to 2005. The country or countries involved in the conflict are also listed. All entries from 1990 to 2005 were extracted, regardless of their current state of activeness or inactiveness.
Conflicts with the same location and cause with more than one entry – those with a duration of more than one year – were aggregated, that is, summarized into one conflict point. Therefore, one conflict point refers to one actual conflict, such as is the case with the conflict between Israel and the Palestinians that has different battlefields and is particularly tenacious, spanning the whole study period, yet, it is treated as one conflict point during the study period from 1990 to 2005.
Regarding the ‘conflict point’, the PRIO ACD includes one pair of geographic coordinates in decimal degrees (point data) for each conflict entry. According to Raleigh et al. (2006) the centre point for one conflict entry defines the midpoint of all known battle locations plotted on a map, it is then visually assigned to the nearest 0.25 decimal degree. So, the conflict point must not always be in the exact location of use of armed force, for example, when the conflict has more than one trouble spot. Nevertheless, it indicates the most applicable estimate of the centre of conflict. This method is compatible with our global datasets from IMAGE with 0.5 degree by 0.5 degree grid cells. All multiple conflict entries resulting from a separate entry for each country involved in the conflict were removed. The refined PRIO ACD dataset and eight dryland clusters resulting from the cluster analysis were imported into a GIS (Geographical Information System) in order to assign each conflict to one cluster. Conflicts located on the border between two or more IMAGE grid cells were assigned to the cluster with the largest adjacent number of cells to this conflict. If necessary, this was repeated for the cells surrounding the adjacent cells. This method also facilitated assigning the conflicts to one appropriate grid cell for calculating the country-based indexes later on.
Due to the binary response variable (conflict or no conflict) we use logit, the logistic regression model, which predicts the probability of occurrence of an event, that is, the conflict in a country, by fitting a logistic curve f to the empirical probabilities of conflict occurrence.
zexf
−+=
11)( ,
where ( ) ...22110 +⋅+⋅+= xaxaaxz
and the iβ are optimized under the given independent variables ix .
The quality of the fit was checked with the Akaike Information Criterion (AIC) and the residual deviance. The former can be used as a model selection criterion, selecting the best combination of independent variables. The model with the smallest value will be chosen. It consists of a goodness of fit term (RSS, that is, LogLik) and a penalty term – number of parameters. The latter is comparable with the RSS in linear regression.
A total of 116 conflicts were assigned to drylands, to the pertinent clusters therein, and to non-drylands (see Figure 7.1). With respect to their absolute numbers, the conflicts revealed a homogeneous distribution between drylands (46, equalling 40 per cent) and non-drylands (74, equalling 60 per cent, see Table 7.1). In other words, conflict occurrence between drylands (46) and non-drylands (74) are notably proportional to the respective land mass portions (roughly 1/3 to 2/3), indicating that a monovariate explanation of conflict occurrence through water scarcity in the broadest sense is not supported. In other words, given the proportion of area covered, drylands are not more nor less conflict prone than are non-drylands.
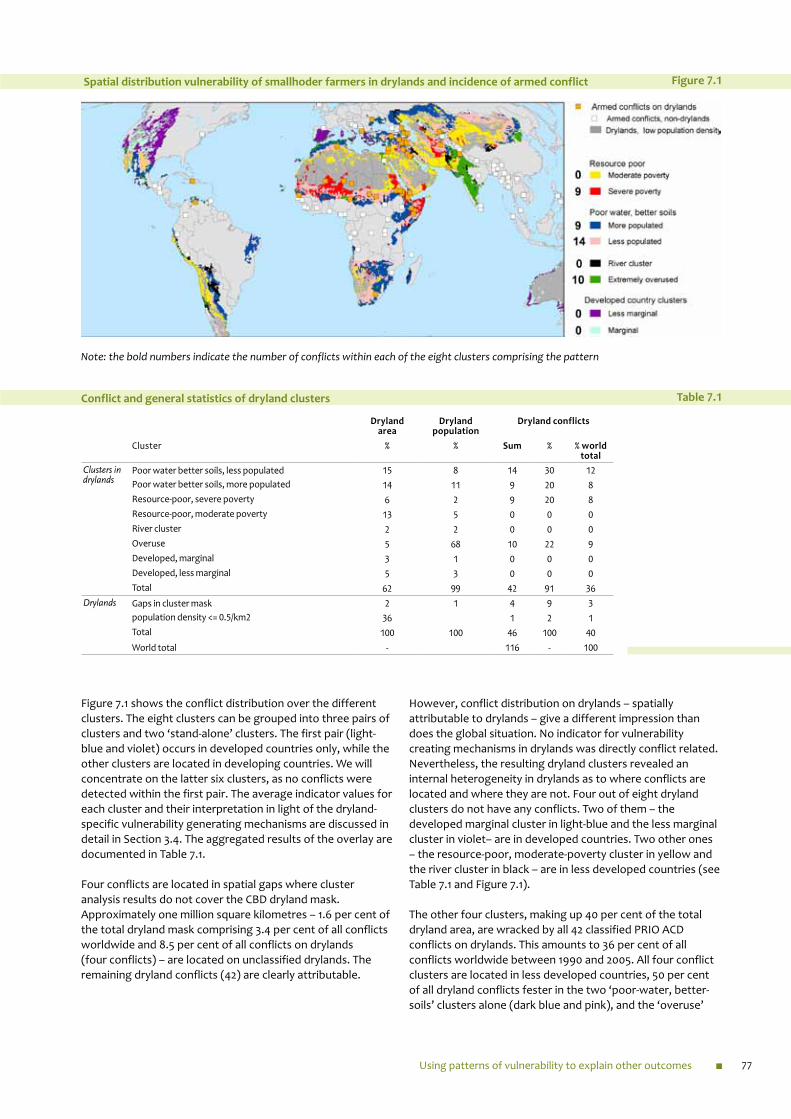
Using patterns of vulnerability to explain other outcomes 77
Figure 7.1 shows the conflict distribution over the different clusters. The eight clusters can be grouped into three pairs of clusters and two ‘stand-alone’ clusters. The first pair (light-blue and violet) occurs in developed countries only, while the other clusters are located in developing countries. We will concentrate on the latter six clusters, as no conflicts were detected within the first pair. The average indicator values for each cluster and their interpretation in light of the dryland-specific vulnerability generating mechanisms are discussed in detail in Section 3.4. The aggregated results of the overlay are documented in Table 7.1.
Four conflicts are located in spatial gaps where cluster analysis results do not cover the CBD dryland mask. Approximately one million square kilometres – 1.6 per cent of the total dryland mask comprising 3.4 per cent of all conflicts worldwide and 8.5 per cent of all conflicts on drylands (four conflicts) – are located on unclassified drylands. The remaining dryland conflicts (42) are clearly attributable.
However, conflict distribution on drylands – spatially attributable to drylands – give a different impression than does the global situation. No indicator for vulnerability creating mechanisms in drylands was directly conflict related. Nevertheless, the resulting dryland clusters revealed an internal heterogeneity in drylands as to where conflicts are located and where they are not. Four out of eight dryland clusters do not have any conflicts. Two of them – the developed marginal cluster in light-blue and the less marginal cluster in violet– are in developed countries. Two other ones – the resource-poor, moderate-poverty cluster in yellow and the river cluster in black – are in less developed countries (see Table 7.1 and Figure 7.1).
The other four clusters, making up 40 per cent of the total dryland area, are wracked by all 42 classified PRIO ACD conflicts on drylands. This amounts to 36 per cent of all conflicts worldwide between 1990 and 2005. All four conflict clusters are located in less developed countries, 50 per cent of all dryland conflicts fester in the two ‘poor-water, better-soils’ clusters alone (dark blue and pink), and the ‘overuse’
Spatial distribution vulnerability of smallhoder farmers in drylands and incidence of armed conflict
Note: the bold numbers indicate the number of conflicts within each of the eight clusters comprising the pattern
Figure 7.1
Conflict and general statistics of dryland clusters
Dryland area
Dryland population
Dryland conflicts
Cluster % % Sum % % world total
Clusters in drylands
Poor water better soils, less populated 15 8 14 30 12Poor water better soils, more populated 14 11 9 20 8Resource-poor, severe poverty 6 2 9 20 8Resource-poor, moderate poverty 13 5 0 0 0River cluster 2 2 0 0 0Overuse 5 68 10 22 9Developed, marginal 3 1 0 0 0Developed, less marginal 5 3 0 0 0Total 62 99 42 91 36
Drylands Gaps in cluster mask 2 1 4 9 3population density <= 0.5/km2 36 1 2 1Total 100 100 46 100 40World total - 116 - 100
Table 7.1
Quantitative analysis of patterns of vulnerability to global environmental change 78
cluster (green) is also disproportionately prone to conflict (22 per cent), despite occupying a mere five per cent of all drylands.
The concentration of conflicts within drylands is further accentuated by ruling out the 36 per cent of all drylands that are virtually uninhabited – population less than 0.5 per square kilometre with one conflict. Then 91 per cent of all dryland conflicts fester in four out of eight clusters covering 40 per cent of all dryland areas. In addition, the clusters with conflicts do not have the highest population density. This raises some doubts about some of the broader Malthusian claims about population pressure, resource scarcity and conflict.
Closer inspection of Table 7.1 reveals that the two ‘resource-poor’ clusters show significantly different conflict proneness, as well as the two ‘poor-water, better-soils’ clusters. Here the less populated clusters show the double number of conflicts per person compared to the more populated ones.
These findings suggest a relationship between the clusters and conflict occurrence, stating that the cluster vulnerability profiles exhibit some explanatory power with respect to the conflict proneness of a region. This hypothesis is investigated in the following sections.
Extremely resource-poor situations: less poverty, less conflictsOne of the two developing country clusters in yellow that have no conflicts, belongs to the ‘resource-poor clusters’, which is a pair of clusters that is characterised by the most critical situations with respect to water availability and soil quality (see Figure 3.9). In terms of the cluster centres as manifestations of typical indicator values, both clusters show almost equal values for soil degradation, population density and road density. The fact that one of the resource-poor clusters is conflict prone and the other is conflict free (see Table 7.1) allows for differential analysis of the vulnerability profiles. In this case, the difference is obvious: the conflict free cluster shows a larger value for GDP per capita and a much lower value for infant mortality, that is, less poverty (see Figure 3.9). So, under extreme resource scarcity, higher incomes obviously matter for mitigating the vulnerability of conflict.
‘Poor-water, better-soils’ conditions: more population density, less conflictsFor the next pair of developing country clusters (poor-water, better-soils) both of which host conflicts, that is, are conflict prone to some degree (see Table 7.1), but the dark blue one hosts less conflicts per capita than the pink cluster despite having identical values of GDP per capita and infant mortality. In other words, under the resource conditions of this cluster pair, the above rule for conflict proneness does not apply. Here the differential analysis shows that while both clusters have nearly identical values for resource availability per capita, soil degradation rate (see Figure 3.10), the more densely populated cluster is the less conflict prone
From these four examples we can conclude that within the dryland regions in developing countries, the natural resource endowment appears to decide if the human well-being
indicators – GDP per capita and infant mortality rate – or the population density determines the conflict proneness. The human well-being indicators seem to be relevant in extremely resource-scarce cases, whereas population density becomes decisive for more moderate resource scarcity (‘poor-water, better-soils’). This shows clearly that neither a purely resource-scarcity-oriented approach to conflict proneness nor an approach purely based on socio-economic variables is applicable. In the first case, the different outcome for similar resource situations would not be accounted for; in the latter case, the right choice of the socioeconomic variable depends on the environmental conditions
Relatively resource-rich situations: less poverty, less conflictsThe remaining two developing country clusters are the ‘overuse’ (green) and the ‘rivers’ (black) cluster. Compared to the already discussed clusters, the first cluster shows relatively low conflict proneness – 68 per cent of the dryland population, but only 22 per cent of the dryland conflicts – whereas the second one is totally conflict free. Analysis of the vulnerability profiles reveals that both clusters are, for dryland conditions, equally resource-rich – highest water availability, second and third rank in agropotential. In the ‘rivers’ cluster, population density is significantly lower, resulting in a lower soil degradation rate and higher GDP per capita values compared to the densely populated ‘overuse’ cluster (see Figure 3.11). So, in a relatively resource-rich environment within the drylands, again GDP per capita seems to be decisive for avoiding conflicts. Interestingly, the two clusters also differ significantly in population density, but here the less populated cluster is less conflict prone.
In our opinion, the above analysis shows that the two ‘extreme’ positions of explaining conflicts either purely as resource scarcity induced (‘neo-Malthusian’) or as purely economically/socially/politically induced (‘neo-Durkheimian’) appear to be insufficient to understand the discussed observation in drylands.
7.3 Conflict reproduction with linear and non-linear methods
In this section, the use of the dryland clusters for explaining conflicts will be compared to conventional logit approaches. Here we recall that the dryland clusters were calculated on the basis of seven globally available indicators covering socioeconomic and natural aspects of the dryland regions. This raises the question as to whether the calculation of clusters is a detour and if it would not be better to take the seven indicators directly in a logit-approach.
By doing so, another question can also be addressed; namely, what is the change of the quality of the logit fit depending on the choice of the independent variables. So, we first performed monovariate fits with all seven indicators, then a bivariate fit using GDP per capita and infant mortality; and lastly, we performed a multivariate fit using all seven indicators. The spatial characteristics of the conflict and the indicator data made it necessary to aggregate them to a common level, in this case, a common country level.
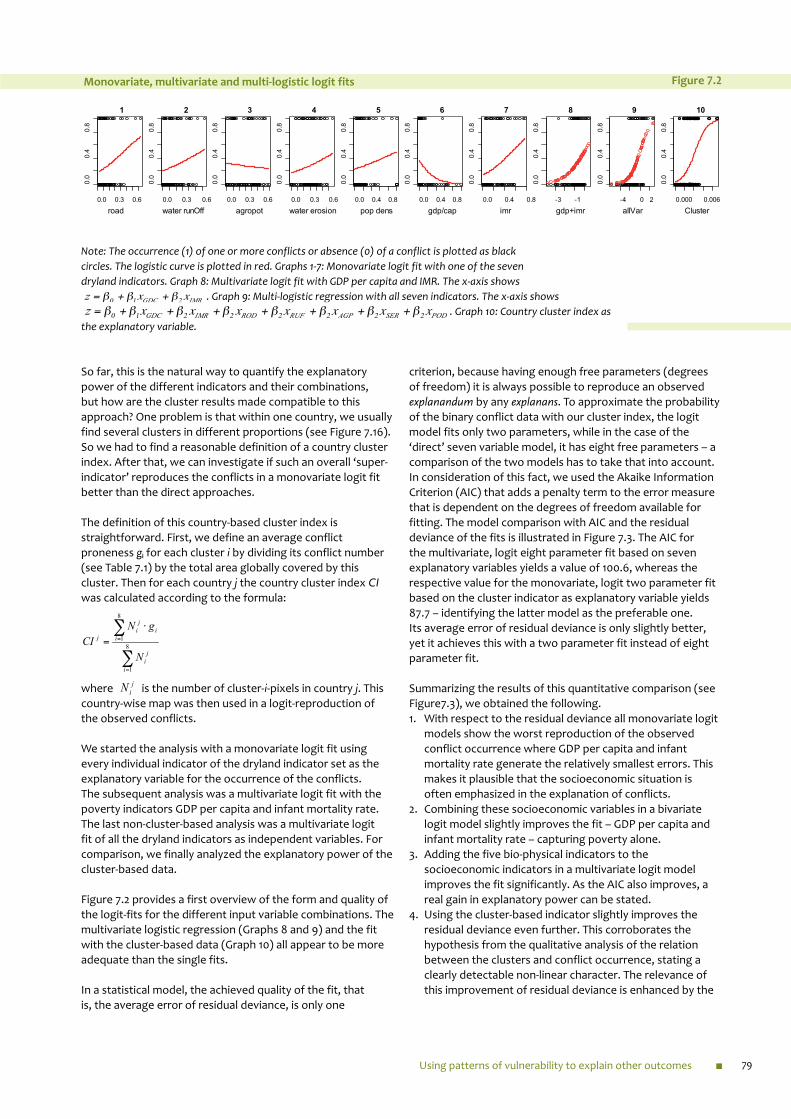
Using patterns of vulnerability to explain other outcomes 79
So far, this is the natural way to quantify the explanatory power of the different indicators and their combinations, but how are the cluster results made compatible to this approach? One problem is that within one country, we usually find several clusters in different proportions (see Figure 7.16). So we had to find a reasonable definition of a country cluster index. After that, we can investigate if such an overall ‘super-indicator’ reproduces the conflicts in a monovariate logit fit better than the direct approaches.
The definition of this country-based cluster index is straightforward. First, we define an average conflict proneness gi for each cluster i by dividing its conflict number (see Table 7.1) by the total area globally covered by this cluster. Then for each country j the country cluster index CI was calculated according to the formula:
∑
∑
=
=
⋅= 8
1
8
1
i
ji
ii
ji
j
N
gNCI
where jiN is the number of cluster-i-pixels in country j. This
country-wise map was then used in a logit-reproduction of the observed conflicts.
We started the analysis with a monovariate logit fit using every individual indicator of the dryland indicator set as the explanatory variable for the occurrence of the conflicts. The subsequent analysis was a multivariate logit fit with the poverty indicators GDP per capita and infant mortality rate. The last non-cluster-based analysis was a multivariate logit fit of all the dryland indicators as independent variables. For comparison, we finally analyzed the explanatory power of the cluster-based data.
Figure 7.2 provides a first overview of the form and quality of the logit-fits for the different input variable combinations. The multivariate logistic regression (Graphs 8 and 9) and the fit with the cluster-based data (Graph 10) all appear to be more adequate than the single fits.
In a statistical model, the achieved quality of the fit, that is, the average error of residual deviance, is only one
criterion, because having enough free parameters (degrees of freedom) it is always possible to reproduce an observed explanandum by any explanans. To approximate the probability of the binary conflict data with our cluster index, the logit model fits only two parameters, while in the case of the ‘direct’ seven variable model, it has eight free parameters – a comparison of the two models has to take that into account. In consideration of this fact, we used the Akaike Information Criterion (AIC) that adds a penalty term to the error measure that is dependent on the degrees of freedom available for fitting. The model comparison with AIC and the residual deviance of the fits is illustrated in Figure 7.3. The AIC for the multivariate, logit eight parameter fit based on seven explanatory variables yields a value of 100.6, whereas the respective value for the monovariate, logit two parameter fit based on the cluster indicator as explanatory variable yields 87.7 – identifying the latter model as the preferable one. Its average error of residual deviance is only slightly better, yet it achieves this with a two parameter fit instead of eight parameter fit.
Summarizing the results of this quantitative comparison (see Figure7.3), we obtained the following.1. With respect to the residual deviance all monovariate logit
models show the worst reproduction of the observed conflict occurrence where GDP per capita and infant mortality rate generate the relatively smallest errors. This makes it plausible that the socioeconomic situation is often emphasized in the explanation of conflicts.
2. Combining these socioeconomic variables in a bivariate logit model slightly improves the fit – GDP per capita and infant mortality rate – capturing poverty alone.
3. Adding the five bio-physical indicators to the socioeconomic indicators in a multivariate logit model improves the fit significantly. As the AIC also improves, a real gain in explanatory power can be stated.
4. Using the cluster-based indicator slightly improves the residual deviance even further. This corroborates the hypothesis from the qualitative analysis of the relation between the clusters and conflict occurrence, stating a clearly detectable non-linear character. The relevance of this improvement of residual deviance is enhanced by the
Monovariate, multivariate and multi-logistic logit fits
Note: The occurrence (1) of one or more conflicts or absence (0) of a conflict is plotted as black circles. The logistic curve is plotted in red. Graphs 1-7: Monovariate logit fit with one of the seven dryland indicators. Graph 8: Multivariate logit fit with GDP per capita and IMR. The x-axis shows
IMRGDC xxz 210 βββ ++= . Graph 9: Multi-logistic regression with all seven indicators. The x-axis showsPODSERAGPRUFRODIMRGDC xxxxxxxz 22222210 ββββββββ +++++++= . Graph 10: Country cluster index as
the explanatory variable.
Monovariate, multivariate and multi-logistic logit fits
0.0 0.3 0.6
0.0
0.4
0.8
1
road0.0 0.3 0.6
0.0
0.4
0.8
2
conf
lict.l
m[,
1]
water runOff0.0 0.3 0.6
0.0
0.4
0.8
3
conf
lict.l
m[,
1]
agropot0.0 0.3 0.6
0.0
0.4
0.8
4
conf
lict.l
m[,
1]
water erosion0.0 0.4 0.8
0.0
0.4
0.8
5
conf
lict.l
m[,
1]
pop dens0.0 0.4 0.8
0.0
0.4
0.8
6
conf
lict.l
m[,
1]
gdp/cap0.0 0.4 0.8
0.0
0.4
0.8
7
conf
lict.l
m[,
1]
imr-3 -1
0.0
0.4
0.8
8
1/(1
+exp
(-z1)
)
gdp+imr-4 0 2
0.0
0.4
0.8
9
1/(1
+exp
(-z2)
)
allVar0.000 0.006
0.0
0.4
0.8
10
conf
lict p
roba
bility
(red
line)
, obs
erve
d co
nflic
t (bl
ack
circ
les)
Cluster
Figure 7.2
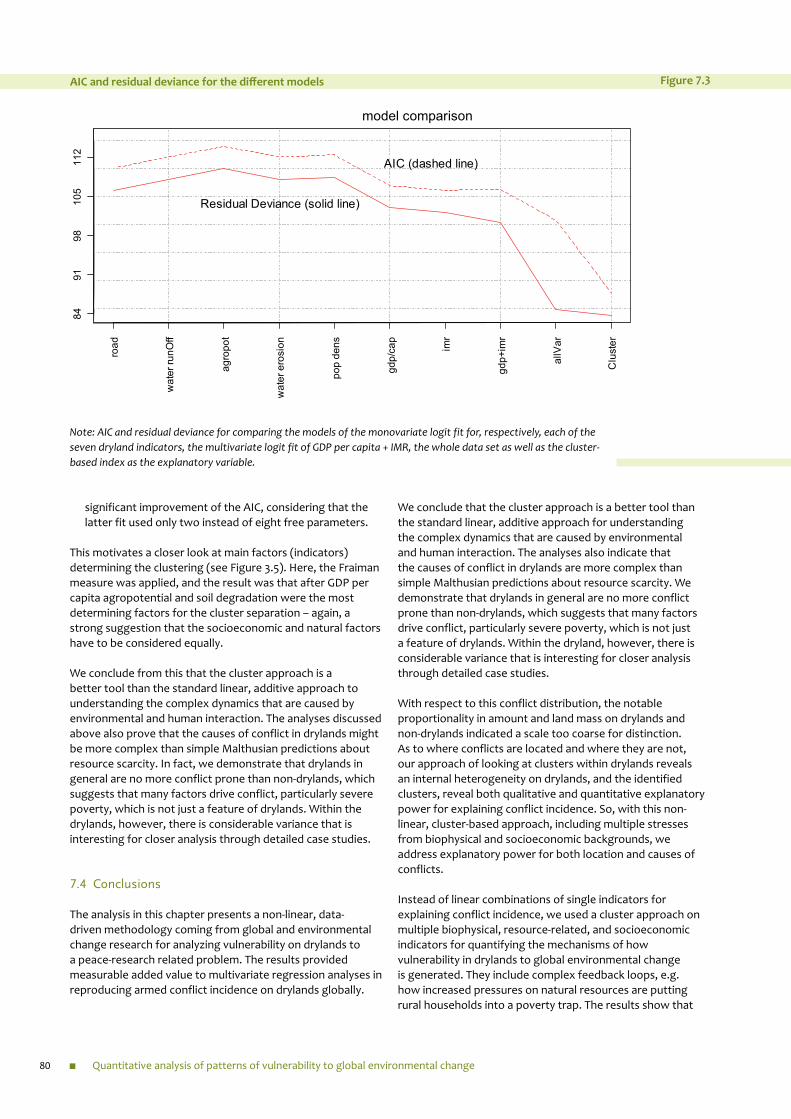
Quantitative analysis of patterns of vulnerability to global environmental change 80
significant improvement of the AIC, considering that the latter fit used only two instead of eight free parameters.
This motivates a closer look at main factors (indicators) determining the clustering (see Figure 3.5). Here, the Fraiman measure was applied, and the result was that after GDP per capita agropotential and soil degradation were the most determining factors for the cluster separation – again, a strong suggestion that the socioeconomic and natural factors have to be considered equally.
We conclude from this that the cluster approach is a better tool than the standard linear, additive approach to understanding the complex dynamics that are caused by environmental and human interaction. The analyses discussed above also prove that the causes of conflict in drylands might be more complex than simple Malthusian predictions about resource scarcity. In fact, we demonstrate that drylands in general are no more conflict prone than non-drylands, which suggests that many factors drive conflict, particularly severe poverty, which is not just a feature of drylands. Within the drylands, however, there is considerable variance that is interesting for closer analysis through detailed case studies.
7.4 Conclusions
The analysis in this chapter presents a non-linear, data-driven methodology coming from global and environmental change research for analyzing vulnerability on drylands to a peace-research related problem. The results provided measurable added value to multivariate regression analyses in reproducing armed conflict incidence on drylands globally.
We conclude that the cluster approach is a better tool than the standard linear, additive approach for understanding the complex dynamics that are caused by environmental and human interaction. The analyses also indicate that the causes of conflict in drylands are more complex than simple Malthusian predictions about resource scarcity. We demonstrate that drylands in general are no more conflict prone than non-drylands, which suggests that many factors drive conflict, particularly severe poverty, which is not just a feature of drylands. Within the dryland, however, there is considerable variance that is interesting for closer analysis through detailed case studies.
With respect to this conflict distribution, the notable proportionality in amount and land mass on drylands and non-drylands indicated a scale too coarse for distinction. As to where conflicts are located and where they are not, our approach of looking at clusters within drylands reveals an internal heterogeneity on drylands, and the identified clusters, reveal both qualitative and quantitative explanatory power for explaining conflict incidence. So, with this non-linear, cluster-based approach, including multiple stresses from biophysical and socioeconomic backgrounds, we address explanatory power for both location and causes of conflicts.
Instead of linear combinations of single indicators for explaining conflict incidence, we used a cluster approach on multiple biophysical, resource-related, and socioeconomic indicators for quantifying the mechanisms of how vulnerability in drylands to global environmental change is generated. They include complex feedback loops, e.g. how increased pressures on natural resources are putting rural households into a poverty trap. The results show that
Note: AIC and residual deviance for comparing the models of the monovariate logit fit for, respectively, each of the seven dryland indicators, the multivariate logit fit of GDP per capita + IMR, the whole data set as well as the cluster-based index as the explanatory variable.
Figure 7.3AIC and residual deviance for the different models
ro
ad
wat
er ru
nOff
agro
pot
wat
er e
rosi
on
pop
dens
gdp/
cap
imr
gdp+
imr
allV
ar
Clu
ster
8491
9810
511
2
Residual Deviance (solid line)
AIC (dashed line)
model comparison
Using patterns of vulnerability to explain other outcomes 81
including the non-linear aspects of the problem by clustering clearly added value to the common linear or logit approaches to conflict explanation. The dryland clusters explain the occurrence of conflicts more effectively than these regression approaches with the same set of variables. According to the Akaike Information Criterion (AIC) a real gain in explanatory power can be stated. Nonetheless, the regression fit also improved significantly by adding the five bio-physical indicators to the socioeconomic ones, which were used all together in the cluster approach.
The qualitative analysis of the vulnerability profiles and conflict occurrence revealed a complex relation between the socioeconomic and bio-physical constellations – here the interpretation of why the ‘rivers’ cluster and the less populated ‘resource-scarce’ cluster show no conflict occurrence is still pending, but the statistical evidence of the explanatory power seems to justify research in this direction.
It is clear that the applied indicators only cover a part of typical reasons for dryland conflicts – we are dealing with an incomplete set of parameters capturing part, not all, of the causes. In addition, the conflicts considered from the PRIO ACD database only cover some of the types of conflicts. The acceptable, but by no means perfect, reproduction of the observed conflicts alludes to these facts. Ultimately, our indicator subset appropriately explains a ‘conflict subset’, ruling out neither further indicators nor their applicability to explaining different types of conflict. This extensibility can be a next step if proper data becomes available.
The analysis in this chapter also holds promise to use this approach to analyse other issues than conflict, such as migration, the collapse of ecosystems or impacts of extreme weather events.

Quantitative analysis of patterns of vulnerability to global environmental change 82
Discussion and conclusions 83
With this explorative study we aimed to (1) elaborate upon a methodology for the analysis of patterns of vulnerability, both quantitatively and qualitatively and to (2) apply this methodology in specific human-environment systems in order to get a better understanding of the patterns of vulnerability in these situations. Even though it is not part of the report, this analysis is also intended to (3) provide a basis for further analysis of responses to reduce vulnerability. In addition to these, we also (4) identify a number of potential subsequent steps for further research based on the analysis. Here, we discuss these four points.
1. A robust methodologyThe methodology we developed consists of five steps and includes both quantitative and qualitative analyses. It combines an indicator-based analysis with a meta-analysis of available case studies, and uses cluster analysis as a statistical method for analysing these data. Data is provided by integrated assessment models. This allows extending the analysis in a next step to include different future situations and evaluate the positive and negative impact of specific trends or policy interventions at the global level in terms of vulnerability. Because methodology development and analysis of patterns of vulnerability went hand in hand during the research for this report, different iterations have improved the proposed methodology.
Clustering, and an identifiable optimum cluster number, occurs in all four patterns of vulnerability that were analyzed. Furthermore, the branching diagrams reveal that using an increasing cluster number does not result in a completely different set of profiles. In most cases, new clusters emerge from one or two already existing clusters, while the other clusters remain moreover the same. This concludes that the methodology is robust and can also be applied to analyse other patterns of vulnerability in a standardised way. We are however also aware of a number of methodological limitations that need to be taken into account in further work:Time intensity: the proposed methodology is necessarily quite comprehensive to capture relevant mechanisms, bridge the global and local scale and include both qualitative and quantitative analysis. Furthermore, this methodology is an iterative process, in which further analysis requires the analyst to return to earlier steps. Applying it fully is therefore time-consuming.
Data requirements: data are needed both in the form of case studies as well as in the form of indicator data. The former is becoming easier because of the increasing number of meta-analyses of case studies that are becoming available. Because the indicators have to be produced by integrated assessment models their choice is constrained by the possibilities of the models. Not having this constraint makes many more data sets available. Furthermore, the spatial scale and resolution of the models have their advantages and disadvantages for localizing results. Lastly, the limited availability on the global level of socioeconomic data is of concern. Rather crude proxies had to be used in a number of cases. An assessment of the quality and uncertainty in these data and its effects on the results of the analysis is still lacking.
Combining quantitative and qualitative analyses: the formali-sation of the pattern of vulnerability in an influence diagram and its indication is a necessary step, but this is not a one-to-one relation, while available indicators are used as proxies. Furthermore, the assumed logic in the dynamics of the patterns of vulnerability is not by definition fully consistent with the dynamics in the integrated assessment models used. Finally, it needs to be realised that the ground-truthing and validation of the patterns of vulnerability addresses the vulnerability profiles within one pattern of vulnerability, as of course general mechanism are derived from available case studies and are expert-based.
2. Increased understanding of vulnerability on intermediate levelFrom applying this methodology and analysing the four patterns of vulnerability, we have gained an increased understanding of vulnerability at the intermediate level – between the local and global levels. The four patterns of vulnerability analysed include smallholder farming in dryland areas, overexploitation of natural resources, competition for land for food and biofuels, and rapid urbanisation of the coast fringe.
We are able to identify vulnerability profiles within all four patterns of vulnerability. These are distinct and robust constellations of indicators that result predominantly from differentiation in developing countries. We are also able to connect these vulnerability profiles to (meta-analysis of) case studies. Only in the case of the analysis of vulnerability
Discussion and conclusions
8
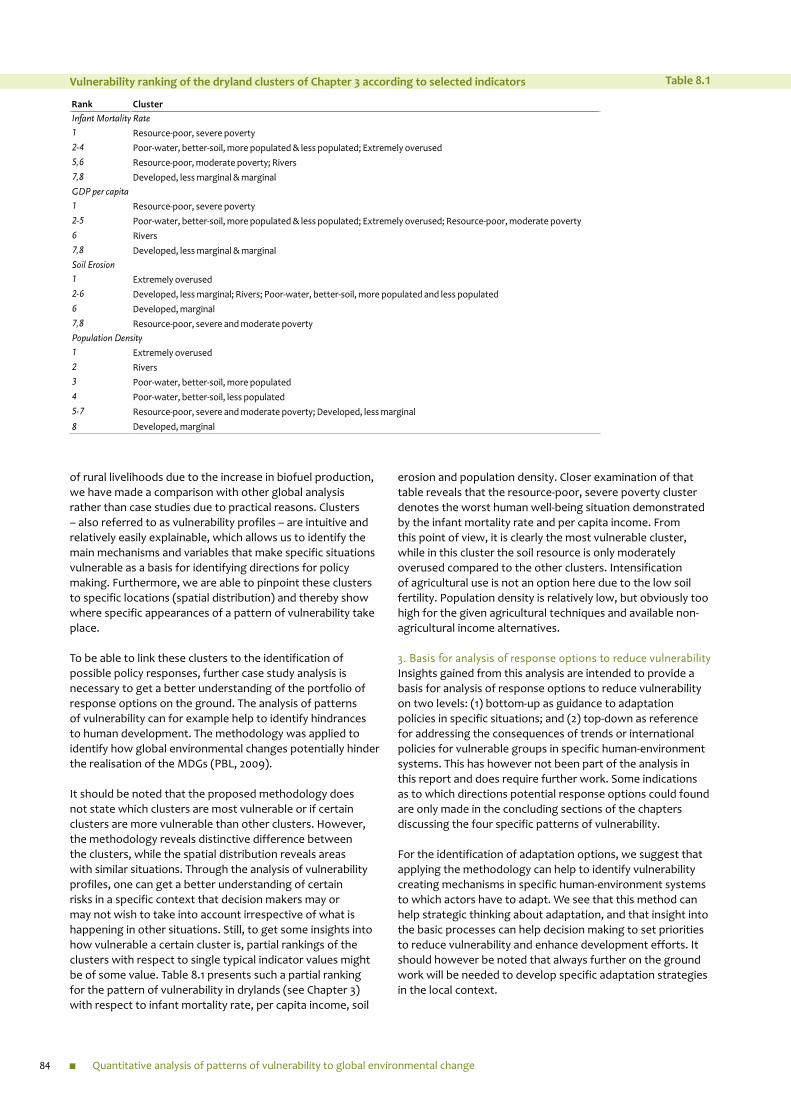
Quantitative analysis of patterns of vulnerability to global environmental change 84
of rural livelihoods due to the increase in biofuel production, we have made a comparison with other global analysis rather than case studies due to practical reasons. Clusters – also referred to as vulnerability profiles – are intuitive and relatively easily explainable, which allows us to identify the main mechanisms and variables that make specific situations vulnerable as a basis for identifying directions for policy making. Furthermore, we are able to pinpoint these clusters to specific locations (spatial distribution) and thereby show where specific appearances of a pattern of vulnerability take place.
To be able to link these clusters to the identification of possible policy responses, further case study analysis is necessary to get a better understanding of the portfolio of response options on the ground. The analysis of patterns of vulnerability can for example help to identify hindrances to human development. The methodology was applied to identify how global environmental changes potentially hinder the realisation of the MDGs (PBL, 2009).
It should be noted that the proposed methodology does not state which clusters are most vulnerable or if certain clusters are more vulnerable than other clusters. However, the methodology reveals distinctive difference between the clusters, while the spatial distribution reveals areas with similar situations. Through the analysis of vulnerability profiles, one can get a better understanding of certain risks in a specific context that decision makers may or may not wish to take into account irrespective of what is happening in other situations. Still, to get some insights into how vulnerable a certain cluster is, partial rankings of the clusters with respect to single typical indicator values might be of some value. Table 8.1 presents such a partial ranking for the pattern of vulnerability in drylands (see Chapter 3) with respect to infant mortality rate, per capita income, soil
erosion and population density. Closer examination of that table reveals that the resource-poor, severe poverty cluster denotes the worst human well-being situation demonstrated by the infant mortality rate and per capita income. From this point of view, it is clearly the most vulnerable cluster, while in this cluster the soil resource is only moderately overused compared to the other clusters. Intensification of agricultural use is not an option here due to the low soil fertility. Population density is relatively low, but obviously too high for the given agricultural techniques and available non-agricultural income alternatives.
3. Basis for analysis of response options to reduce vulnerabilityInsights gained from this analysis are intended to provide a basis for analysis of response options to reduce vulnerability on two levels: (1) bottom-up as guidance to adaptation policies in specific situations; and (2) top-down as reference for addressing the consequences of trends or international policies for vulnerable groups in specific human-environment systems. This has however not been part of the analysis in this report and does require further work. Some indications as to which directions potential response options could found are only made in the concluding sections of the chapters discussing the four specific patterns of vulnerability.
For the identification of adaptation options, we suggest that applying the methodology can help to identify vulnerability creating mechanisms in specific human-environment systems to which actors have to adapt. We see that this method can help strategic thinking about adaptation, and that insight into the basic processes can help decision making to set priorities to reduce vulnerability and enhance development efforts. It should however be noted that always further on the ground work will be needed to develop specific adaptation strategies in the local context.
Vulnerability ranking of the dryland clusters of Chapter 3 according to selected indicators
Rank ClusterInfant Mortality Rate
1 Resource-poor, severe poverty2-4 Poor-water, better-soil, more populated & less populated; Extremely overused5,6 Resource-poor, moderate poverty; Rivers7,8 Developed, less marginal & marginalGDP per capita
1 Resource-poor, severe poverty2-5 Poor-water, better-soil, more populated & less populated; Extremely overused; Resource-poor, moderate poverty6 Rivers7,8 Developed, less marginal & marginalSoil Erosion
1 Extremely overused2-6 Developed, less marginal; Rivers; Poor-water, better-soil, more populated and less populated6 Developed, marginal7,8 Resource-poor, severe and moderate povertyPopulation Density
1 Extremely overused2 Rivers3 Poor-water, better-soil, more populated4 Poor-water, better-soil, less populated5-7 Resource-poor, severe and moderate poverty; Developed, less marginal8 Developed, marginal
Table 8.1
Discussion and conclusions 85
The top-down use allows for the identification of options to mitigate core vulnerability creating mechanisms that stem from or can be influenced by regional (supra-national) or global processes. The analysis in this report then provides a reference for addressing the consequences of international trends or policies for vulnerable groups in specific human-environment system. For example it could be analysed what unmitigated or mitigated climate change may imply for the different patterns of vulnerability.
4. Next stepsBesides the application of this methodology on other human-environment systems such as identified in the fourth Global Environmental Outlook (UNEP, 2007), we see a number of other possible next steps.
Analysis of response options to reduce vulnerability. As mentioned in the previous paragraph, this can de done along a bottom-up, qualitative line and a top-down, model-based line. Both will require further methodological work. For the bottom-up line, one could think of a systematic analysis of case studies to identify the options for adaptation in a specific pattern of vulnerability (see Sietz et al., accepted) and the local conditions that either make them work or not. For the top-down line a further development of the methodology for quantitative, indicator-based analysis on scenario data will be required.
Linking different patterns of vulnerability. So far we have only analyzed these patterns of vulnerability independently. But of course there will be links and connections one needs to take into account. It may help in identifying hotspots of vulnerability where different types of vulnerability culminate. Combining different patterns of vulnerability can for example result in a typology for climate change adaptation.
Applying patterns of vulnerability to explain other human well-being outcomes or highlight the role of specific issues. As the analysis in Chapter 7 showed, the methodology lends itself to contribute to a vulnerability perspective orientation, trying to understand specific outcomes, like migration or the impacts of extreme events that cannot be included in the cluster analysis. Furthermore, the approach can be used to better understand what role specific issues, for example, the collapse of specific ecosystem services, play within a pattern of vulnerability. This can be done through case study analysis or overlays as done in the conflict analysis in this report or a combination of both.
Quantitative analysis of patterns of vulnerability to global environmental change 86
Alcamo, J., Henrichs, T. and Rösch, T. (2000) World Water in 2025 – Global modeling and scenario analysis for the World Commission on Water for the 21st Century. no. 2, University of Kassel.
Alkemade, R., van Oorschot, M., Miles, L., Nellemann, C., Bakkenes, M. and Ten Brink, B. (2009) GLOBIO3: A Framework to Investigate Options for Reducing Global Terrestrial Biodiversity Loss. Ecosystems, 12(3): 374-390.
Angelsen, A. and Wunder, S. (2003) Exploring the forestry-poverty link: key concepts, issues and research implications. CIFOR Occasional paper No. 40.
Bächler, G. (2000) Environmental Degradation in the South as a Cause of Armed Conflict. In: A. Carius and K.M. Lietzmann (Editors), Environmental Change and Security. A European Perspective. Springer, Berlin.
Bakkenes, M. and ten Brink, B. (2009) A Green Development Mechanism: Biodiversity compensation within the globe, regions and biomes. PBL Report 555050003/2009.
Barnett, J. and Adger, N. (2007) Climate Change, Human Security and Violent Conflict. Political Geography, 26(6): 639-655.
Beinroth, F.H., Eswaran, H. and Reich, P.F. (2001) Global assessment of land quality. In: D.E. Stott, M.H. Mohtar and G.C. Steinhardt (Editors), Sustaining the global farm. Selected papers from the 10th international soil conservation organization meeting held may 24-29, 1999 at Perdue University and the USDA-ARS National Soil Erosion Research laboratory.
Ben-Hur, A., Elisseeff, A. and Guyon, I. (2002) A stability based method for discovering structure in clustered data. In: R.B. Altman, A. Keith Dunker, L. Hunter, K. Lauderdale and T.E. Klein (Editors), Pacific Symposium on Biocomputing 2002.
Benjaminsen, T.A. (2008) Does Supply-Induced Scarcity Drive Violent Conflicts in the African Sahel? The Case of the Tuareg Rebellion in Northern Mali. Journal of Peace Research, 45(6): 819–836.
Bergsma, G., Kampman, B., Croezen, H. and Sevenster, M (2007) Biofuels and their global influence on land availability for agriculture and nature. A first evaluation and a proposal for further fact finding, CE, Delft.
Bravo de Guenni, L., Cardoso, M., Goldammer, J., Hurtt, G., J., Mata L., Ebi, K., House, J. and Valdes, J. (2005) Regulation of Natural Hazards: Floods and Fires. In: R. Norgaard (Editor), Millenium Ecosystem Assessment. Ecosystems and Human Well-Being: Current State and Trends. Island Press, Washington, D.C.
Bull-Kamanga, L., Diagne, K., LAvell, A., Leon, E., Lerise, F., MacGregor, H., H., Maskrey, A., A., Meshack, M., M., Pelling, M., M., Reid, H., Satterthwaite, D., D., Songsore, J., J., Westgate, K. and K., Yitambe, A. (2003) From everyday hazards to disasters: the accumulation of risk in urban areas. Environment and Urbanization, 15(1): 193-204.
Burke, M.B., Miguel, E., Satyanath, S., Dykema, J. and Lobell, D.B. (2009) Warming increases the risk of civil war in Africa. Proceedings of the National Academy of Sciences of the United States of America, 106(49): 20670-20674.
Caeasar, B., Riese, J. and Seitz, T. (2007) Betting on Biofuels. McKinsey Quarterly.
Chomitz, K.M., Buys, P., De Luca, G., Thomas, T.S. and Wertz-Kanounnikoff, S. (2007) At loggerheads? Agricultural expansion, poverty reduction and environment in the tropical forests, World Bank policy research report.
CIESIN (2005) Poverty Mapping Project: Global Subnational Infant Mortality Rates, Center for International Earth Science Information Network (CIESIN), Socioeconomic Data and Applications Center (SEDAC), Columbia University, Palisades, NY, Available at: http://sedac.ciesin.columbia.edu/povmap/.
CIESIN and CIAT (2005) Gridded Population of the World Version 3 (GPWv3). Socioeconomic Data and Applications Center (SEDAC), Columbia University. sedac.ciesin.columbia.edu/gpw, sedac.ciesin.org/plue/gpw.
Collier, P., Elliot, L., H., Hegre, Hoeffler, A., Reynal-Querol, M. and Sambanis, N. (2003) Breaking the Conflict Trap: Civil War and Development Policy. Oxford University Press, Oxford.
Conacher, A. and Sala, M. (1998) Vegetation-related solutions. In: A.J. Conacher and M. Sala (Editors), Land degradation in Mediterranean environments of the world. Wiley, Chichester, pp. 397-413.
Costanza, R., d’Arge, R., de Groot, R., Farberk, S., Grasso, M., Hannon, B., Limburg, K., Naeem, S. , O’Neill, R.V., Paruelo, J., Raskin, R.G., Sutton, P. and van den Belt, M. (1997) The value of the world’s ecosystem services and natural capital. Nature, 387: 253-260.
De Sherbinin, A., Schiller, A. and Pulpisher, A. (2007) The Vulnerability of Global Cities to Climate Hazards. Environment and Urbanization, 19: 39-64.
de Soysa, I. (2002) Paradise is a Bazaar? Greed, Creed, and Governance in Civil War, 1989–1999. Journal of Peace Research, 39(4): 395–416.
Dilley, M., Chen, R.S., Deichmann, U., Lerner-Lam, A.L., Arnold, M., Agwe, J., Buys, P., Kjekstad, O., Lyon, B. and Yetman, G. (2005) Natural Disaster Hotspots: A Global Risk Analysis, The World Bank, Washington, D.C.
Dixon, J., Gulliver, A. and Gibbon, D. (2001) Farming Systems and Poverty Improving Farmers’ Livelihoods in a Changing World, FAO and World Bank, Rome and Washington DC.
Dobie, P. (2001) Poverty and the Drylands, United Nations Development Programme.
Dudoit, S. and Fridlyand, J. (2002) A prediction-based resampling method for estimating the number of clusters in a dataset. Genome Biology, 3(7).
References
References 87
Dye, C. (2008) Health and Urban Living. Science, 319(5864): 766-769.
EEA (2006) How much energy can Europe produce without harming the environment? Report No. 7/2006, European Environmental Agency (EEA) 72 pp.
EEA (2007) Estimating the Environmentally Compatible Bioenergy Potential from Agriculture. Technical Report No, 12/2007, European Environmental Agency (EEA) 138 pp.
Eickhout, B. (2008) Local and global consequences of the EU renewable directive for biofuels. Testing the sustainability criteria. MNP Report, Netherlands Environmental Assessment Agency.
Eisenack, K., Luedeke, M.K.B., Petschel-Held, G., Scheffran, J. and Kropp, J.P. (2006) Qualitative modeling techniques to assess patterns of global change. In: J.P. Kropp and J. Scheffran (Editors), Advanced methods for descision making and risak management in sustainability science. Nova science publishers, Hauppage, New York.
Elobeid, A. and Hart, C. (2007) Ethanol expansion in the food versus biofuel debate: How will developing countries fare? Journal of Agricultural and Industrial Food Organization, Special Issue: Explorations in Biofuel Economics, Policy, and History, 5
Everitt, B.S., Landau, S. and Leese, M. (2001) Cluster Analysis. Fourth edition. Arnold Publishers.
FAO (2001) Global forest resources assessment 2000: main report, Food and Agriculture Organisation of the United Nations (FAO).
FAO (2006a) Global forest resources assessment 2005: progress towards sustainable forest management, Food and Agriculture Organisation of the United Nations.
FAO (2006b) Livestock’s long shadow: environmental issues and options, Food and Agriculture Organisation of the United Nations (FAO), Rome, Italy.
FAO (2007) Assessment of the World Food Security Situation, Committee on World Food Security. Thirty-third Session, Rome, 7 – 10 May 2007, ftp://ftp.fao.org/docrep/fao/meeting/011/J9455e.pdf.
Fraiman, R., Justel, A. and Svarc, M. (2008) Selection of Variables for Cluster Analysis and Classification Rules. Journal of the American Statistical Association September 2008, 103(483): 1294-1303.
Geist, H.J and Lambin, E.F. (2004) Dynamic Causal Patterns of Desertification. BioSience, 54: 9.
Geist, H.J. and Lambin, E.F. (2001) What drives tropical deforestation? A meta-analysis of proximate and underlying causes of deforestation based on subnational case study evidence, University of Louvain, Louvain-la-Neuve.
Gleditsch, N.P., Wallensteen, P., Eriksson, M., Sollenberg, M. and Strand, H. (2002) Armed Conflict 1946–2001: A New Dataset. Journal of Peace Research, 39(5): 615-637.
Gnanadesikan, R., Kettenring, J.R. and Maloor, S. (2007) Better alternatives to current methods of scaling and weighting data for cluster analysis. Journal of Statistical planning and Inference, 137: 3483-3496.
González-Morán, T., Rodríguez, R. and Cortes, S.A. (1999) The Basin of Mexico and its metropolitan area: water abstraction and related environmental problems. Journal of South American Earth Sciences, 12: 607-613.
Harbom, L. and Wallensteen, P. (2007) Armed Conflict, 1989-2006. Journal of Peace Research, 5(44): 623–634.
Hastings, D.A. and Dunbar, P. K. (1999) Global Land One-km Base Elevation (GLOBE) Digital Elevation Model Documentation. Publication KGRD 34, http://www.ngdc.noaa.gov/mgg/topo/globe.html, Boulder, Colorado, NOAA National Geophysical Data Center.
Hilderink, H.B.M. and Lucas, P.L. (Editors) (2008) Towards a Global Integrated Sustainability Model: GISMO 1.0 status report. Netherlands Environmental Assessment Agency (PBL), Bilthoven, the Netherlands.
Homer-Dixon, T. (1999) Environment, scarcity and violence. Princeton University Press, Princeton, NJ.
Homer-Dixon, T. and Blitt, J. (1998) Ecoviolence: Links Among Environment, Population, and Security. Oxford: Rowman & Littlefield.
Hoogwijk, M. (2004) On the global and regional potential of renewable energy sources, Utrecht University, Utrecht, The Netherlands.
Hootsman, R., Bouwan, A., Leemans, R. and Kreileman, G.J.J. (2001) Modelling land degradation in IMAGE 2. Report 481508009, National Institute for Public Health and the Environment, Bilthoven 33 pp.
Hubert, L. and Arabie, P. (1985) Comparing Partitions. Journal of Classification, 2: 193–218.
Ifejika Speranza, C., Kiteme, K. and Wiesmann, U. (2008) Droughts and famines: The underlying factors and the causal links among agro-pastoral households in semi-arid Makueni district, Kenya. Global Environmental Change, 18: 220-233.
IPCC (2007) Climate Change 2007: Impacts, Adaptation and Vulnerability. Contribution of Working Group II to the Fourth Assessment Report of the Intergovernmental Panel on Climate Change. M.L. Parry, O.F. Canziani, J.P. Palutikof, P.J. van der Linde and C.E. Hanson (Editors). Cambridge University Press, Cambridge, U.K.
Jäger, J and Kok, M.T.J. (2007) Vulnerability of People and the Environment: Challenges and opportunities, Global Environmental Outlook-4. Environment for Development. Earthscan, Nairobi.
Juo, A.S.R. and Franzluebbers, K. (2003) Tropical Soils: Properties and Management for Sustainable Agriculture. Oxford University Press Inc., New York.
Kassahun, A., Snyman, H.A. and Smit, G.N. (2008) Impact of rangeland degradation on the pastoral production systems, livelihoods and perceptions of the Somali pastoralists in Eastern Ethiopia. Journal of Arid Environments, 72(7): 1265-1281.
Kaufman, L. and Rousseeuw, P.J. (1990) Finding Groups in Data. John Wiley and Sons, New York.
Kaufmann, D., Kraay, A. and Mastruzzi, M. (2008) Governance Matters VII: Governance Indicators for 1996-2007, World Bank Policy Research.
Kessler, J.J. (2003) Working towards SEAN-ERA : A framework and principles for integrating environmental sustainability into planning. Dissertation Thesis.
Kessler, J.J., Dros, J.M. and De Bruin, I. (2006) Ecosystem–human development dynamics in soy bean production in the Brazilian El Cerrado ecosystem, AIDEnvironment, Amsterdam, The Netherlands.
Klein Goldewijk, K., Beusen, A. and Janssen, P. (in prep.) Long term dynamic modeling of global population and built-up area in a spatially explicit way; HYDE 3.1.
Quantitative analysis of patterns of vulnerability to global environmental change 88
Klein, R.J.T., Nicholls, R.J. and Thomalla, F. (2003) The Resilience of Coastal Megacities to Weather-Related Hazards. In: A. Kreimer, M. Arnold and A. Carlin (Editors), Building Safer Cities: The Future of Disaster Risk. World Bank, pp. 101-120.
Kok, M. and Hilderink, H.B.M. (2007) Towards patterns of vulnerability. Export-oriented agriculture and the oil palm case. MNP Report, Netherlands Environmental Assessment Agency.
Kok, M. and Jäger, J. (2009) Vulnerability of people and the environment - challenges and opportunities. Background Report on Chapter 7 of GEO-4. Report no. 555048002, Netherlands Environmental Assessment Agency (PBL), Bilthoven, the Netherlands.
Kusters, K. (2009) Non-timer forest product trade: a trade-off between conservation and development. PhD dissertation Thesis, University of Amsterdam, Amsterdam.
Lambin, E.F. and Geist, H.J. (2003) Regional differences in tropical deforestation. Environment, 45(6): 22-36.
Lambin, E.F., Turner, B.L. , Geist, H.J., Agbola, S.B. , Angelsen, A., Bruce, J.W., Coomes, O.T., Dirzo, R., Fischer, G., Folke, C., George, P.S., Homewood, K., Imbernon, J., Leemans, R., Li, X., Moran, E.F., Mortimore, M., Ramakrishnan, P.S., Richards, J.F., Skanes, H., Glenn, S., Stone, D. , Svedin, U., Veldkamp, T.A., Vogel, C. and Xu, J. (2001) The causes of land-use and land-cover change: moving beyond the myths. Global Environmental Change, 11: 261–269.
Lange, T., Braun, M.L., Roth, V. and Buhmann, J. (2003) Stability-based model selection. In: S. Thrun, S. Becker and K. Obermayer (Editors), Advances in Neural Information Processing Systems 15. MIT Press, Cambridge, MA, pp. 617–624.
Lanly, J.-P. (2003) Deforestation and forest degradation factors, XII World Forestry Congress, Quebec City, Canada.
Lehner, B. and Döll, P. (2004) Development and validation of a global database of lakes, reservoirs and wetlands. Journal of Hydrology, 296(1-4): 1-22.
Letourneau, A. , Verburg, P. and Neumann, K. (in press) Global change of land use systems. Wageningen. rapport xx, Wettelijke Onderzoekstaken Natuur & Milieu, WOt.
Lüdeke, M.K.B., Petschel-Held, G. and Schellnhuber, H.J. (2004) Syndromes of Global Change: The First Panoramic View. GAIA, 13(1).
Lysen, E. (Eds.), van Egmond, S. (Eds.), Dornburg, V., Faaij, A., Verweij, P., Langeveld, H., van de Ven, G., Wester, F., van Keulen, H., van Diepen, K., Meeusen, M., Banse, M., Ros, J. , van Vuuren, D.P., van den Born, G., van Oorschot, M., Smout, F., van Vliet, J., Aiking, H., Londo, M., Mozaffarian, H. and Smekens, K. (2008) Biomass Assessment Assessment of global biomass potentials and their links to food, water, biodiversity, energy demand and economy, Main Report for Netherlands Research Programme on Scientific Assessment and Policy Analysis for Climate Change (WAB).
M.L. Martínez, Intralawan, A., Vázquez, G., Pérez-Maqueoa, O., Sutton, P. and Landgrave, R. (2007) The coasts of our world: Ecological, economic and social importance. Ecological Economics, 63(2-3): 254-272.
MA (2003) Ecosystems and human well-being: a framework for assessment. Millennium Ecosystem Assessment, Island Press, Washington.
MA (2005) Ecosystems and Human Well-being: Synthesis, Millennium Ecosystem Assessment. Island Press, Washington, DC.
MacQueen, J. (1967) Some methods of classification and analysis of multivariate observations. In: L.C. L.M. and N. J. (Editors), Proceedings of the fifth Berkeley symposium on mathematical statistics and probability. Berkeley, CA: University of California Press., pp. 281–297.
McGranahan, G. (2007) The Rising Tide: assessing risks of climate change and human settlements in low elevation coastal zones. Environment and Urbanization, 19(1): 17-37.
Meier, P., Bond, D. and Bond, J. (2007) Environmental Influence on Pastoral Conflict in the Horn of Africa. Political Geography, 26(6): 716–735.
Meijer, J. and Klein Goldewijk, K. (2009) Global Roads Inventory Project (GRIP). Netherlands Environmental Assessment Agency, Bilthoven, The Netherlands, http://mapserver.mnp.nl/geonetwork.
Milligan, G.W. (1980) An examination of the effect of six types of error perturbation on fifteen clustering algorithms. Psychometrika, 45: 325-342. .
Milligan, G.W. and Cooper., M.C (1988) A study of standardisation of variable in cluster analysis. Journal of Classification, 5: 181–204.
MNP (2006) Integrated modelling of global environmental change. An overview of IMAGE 2.4. A.F. Bouwman, T. Kram and K. Klein Goldewijk (Editors). Netherlands Environmental Assessment Agency (MNP), Bilthoven, The Netherlands.
MNP/OECD (2008) Background report to the OECD Environmental Outlook to 2030: Overviews, details en methodology of model-based analysis. MNP report no. 500113001/2008, Netherlands Environmental Assessment Agency (MNP) and Organisation for Economic Co-operation and Development (OECD).
Nicholls, R.J. (2004) Coastal flooding and wetland loss in the 21st century: changes under the SRES climate and socio-economic scenarios. Global Environmental Change, 14(1): 69-86.
Oldeman, L.R., Hakkeling, R.T.A. and Sombroek, W.G. (1990) World map of the status of human-induced soil degradation; explanatory note, International Soil Reference and Information Centre, Wageningen, United Nations Environment Programme, Nairobi.
Pachauri, R. K. (2007) Nobel Lecture on the occasion of the Nobel Peace Prize awarded to the Intergovernmental Panel on Climate Change, Oslo, 10 December 2007, http://nobelpeaceprize.org/en_GB/laureates/laureates-2007/ipcc lecture/.
Patt, A.G., Schröter, D., de la Vga-Leiner, A.C. and Klein, R.J.T. (2009) Vulnerability research and assessment to support Adaptation and mitigation: common themes from the diversity of approaches. In: A.G. Patt, D. Schröter, R.J.T. Klein and A.C. de la Vga-Leiner (Editors), Assessing vulnerability to global environmental change. Earthscan, London.
PBL (2009) Beyond 2015: Long-term development and the Millennium Development Goals. H.B.M. Hilderink, P.L. Lucas and M. Kok (Editors). Netherlands Environmental Assessment Agency (PBL), Bilthoven, the Netherlands.
Pelling, M. (2003) The Vulnerability of Cities: Natural Disasters and Social Resilience. Earthscan, London.
References 89
Petschel-Held, G., Block, A., Cassel-Gintz, M., Kropp, J., Lüdeke, M.K.B., Moldenhauer, O., Reusswig, F. and Schellnhuber, H.J. (1999) Syndromes of Global Change: a qualitative modelling approach to assist global environmental management. Environmental Modeling and Assessment, 4: 295-314.
Prasad, N., Ranghieri, F. and F., Shah (2008) Climate Resilient Cities. A Primer on Reducing Vulnerbility to Disasters, The World Bank.
Puigdefabregas, J. and Mendizabal, T. (1998) Perspectives on desertification: western Mediterranean. Journal of Arid Environments, 39: 209-224.
Rahmstorf, S. (2007) A Semi-Empirical Approach to Projecting Future Sea-Level Rise. Science, 315: 368-370.
Rajagopal, D. and Zilberman, D. (2007) Review of environmental, economic and policy aspects of biofuels. Policy Research Working Paper, World Bank, Washington DC.
Raleigh, C., Cunningham, D., Wilhelmsen, L. and Gleditsch, N.P. (2006) Conflict Sites 1946 – 2005. UCDP/PRIO Armed Conflicts Dataset Codebook. Version 2.0, 17 October 2006, http://www.prio.no/sptrans/1140767671/conflict%20site%20codebook%20v2.pdf.
Reynolds, J.F., Mark Stafford Smith, D., Lambin, E.F., Turner II, B.L., Mortimore, M., Batterbury, S.P.J., Downing, T.E., Dowlatabadi, H., Fernández, R.J., Herrick, J.E., Huber-Sannwald, E., Jiang, H., Leemans, R., Lynam, T., Maestre, F.T., Ayarza, M. and Walker, B. (2007) Global Desertification: Building a Science for Dryland Development. Science 316: 847.
Richards, P. (1990) Land transformation. In: B.L. Turner II et al. (Editors), The earth as transformed by human action: Global and regional changes in the biosphere over the past 300 years. Cambridge University Press, Amsterdam.
Righelato, R. and Spracklen, D. (2007) Cabon Mitigation by Biofuels or by Saving and Restoring Rainforests? Science, 317: 902.
Ross, M. (2004) What Do We Know About Natural Resources and Civil War? Journal of Peace Research, 41(3): 337-356.
Rudel, T.K., Coomes, O., Moran, E., Angelsen, A., Achard, F., Lambin, E. and Xu, J. (2005) Forest transitions: towards an understanding of global land use change. Global Environmental Change, 14(4): 23-31.
Safriel, U., Adeel, Z., Niemeijer, D., Puigdefabres, J., White, R., Lal, R., Winslow, M., Ziedler, J., Prince, S., Archer, E. and King, C. (2005) Dryland Systems. In: R. Hassan, R. Scholes and N. Ash (Editors), Ecosystems and human well-being: Current state and trends. Vol. 1. Island Press, Washington, Covelo, London, pp. 623-662.
Salehyan, I. (2008) From Climate Change to Conflict? No Consensus Yet. Journal of Peace Research, 45(3): 315-326.
Schellnhuber, H.J., Block, A., Cassel-Gintz, M., Kropp, J., Lammel, G., Lass, W., Lienenkamp, R., Loose, C., Lüdeke, M.K.B., Moldenhauer, O., Petschel-Held, G., Plöchl, M. and Reusswig, F. (1997) Syndromes of Global Change. GAIA, 6(1): 19-34.
Schmidhuber, J and Shetty, P. (2005) The nutrition transition to 2030. Why developing countries are likely to bear the major burden. Food Economics - Acta Agriculturae Scandinavica, Section C, 2(3&4): 150-166.
Schmidhuber, J. (2006) Impact of an increased biomass use on agriculture markets, prices ,and food security: A longer-term perspective, Paper for International Conference or Notre Europe, Paris.
Schneider, S.H., Semenov, S., Patwardhan, A., Burton, I., Magadza, C.H.D., Oppenheimer, M., Pittock, A.B., Rahman, A., Smith, J.B., Suarez, A. and Yamin, F. (2007) Assessing key vulnerabilities and the risk from climate change. In: M.L. Parry, O.F. Canziani, J.P. Palutikof, P.J. van der Linden and C.E. Hanson (Editors), Climate Change 2007: Impacts, Adaptation and Vulnerability. Contribution of Working Group II to the Fourth Assessment Report of the Intergovernmental Panel on Climate Change. Cambridge University Press, Cambridge, UK, pp. 779-810.
Sherbinbin, A. de, VanWeyb, L. K., McSweeneyc, K., Aggarwald, R., Barbierie, A., Henryf, S., Hunterg, L.M., Twineh, W. and Walker, R. (2008) Rural household demographics, livelihoods and the environment. Global Environmental Change, 18(1): 38-53.
Siebert, S., Döll, P. and Hoogeveen, J. (2001) Global map of irrigated areas version 2.0, Center for Environmental Systems Research, Univerity of Kassel, Germany / Food and Agriculture Organization of the United Nations, Rome, Italy FAO.
Sietz, D., Lüdeke, M.K.B. and Walther, C. (accepted) Categorisation of typical vulnerability patterns in global drylands. Global Environmental Change.
Stafford Smith, D. M., McKeon, G. M., Watson, I. W., Henry, B. K., Stone, G. S., Hall, W. B. and Howden, S. M. (2007) Learning from episodes of degradation and recovery in variable Australian rangelands. PNAS, 104(52): 20690-20695.
Stern, N. (2006) Stern Review on The Economics of Climate Change. Executive Summary, HM Treasury, London.
Svirejeva-Hopkins, A. (2008) Urbanization as a Global Ecological Process. Global Ecology: 3672-3678.
Tanner, T., Mitchell, T., Polack, E. and Guenther, B. (2009) Urban Governance for Adaptation: Assessing Climate Change Resilience in Ten Asian Cities. IDS Working Paper 315.
Tekelenburg, T., ten Brink, B. and Witmer, M. (2009) How do biodiversity and poverty relate? An explorative study. PBL-report No. 555050004, Netherlands Environmental Assessment Agency.
Theisen, O. M. (2008) Blood and Soil? Resource Scarcity and Internal Armed Conflict Revisited. Journal of Peace Research, 45(6): 801-818.
Thywissen, K. (2006) Core terminology of disaster reduction: A comparative glossary. In: B. Birkmann (Editor), Measuring vulnerability to natural hazards: towards disaster resilient soceities. TERI press, New Dehli, India.
Truong Quang Hoc, et al. (2006) Biodiversity - Human Well-being Linkages, a case study in Dakrong District, Quang tri Province, Vietnam, Center for Natural Resources and Environmental Studies, Vietnam National University, with support of The Netherlands Development Organization (SNV), Hanoi, Vietnam.
Tukey, J.W. (1962) The Future of Data Analysis. The Annals of Mathematical Statistics, 33: 18.
Quantitative analysis of patterns of vulnerability to global environmental change 90
Turner, B.L., Kasperson, R.E. , Matson, P.A. , McCarthy, J.J. , Corell, R.W. , Christensen, L. , Eckley, N. , Kasperson, J.X. , Luers, A. , Martello, M.L. , Polsky, C. , Pulsipher, A. and Schiller, A. (2003) A framework for vulnerability analysis in sustainability science. PNAS, 100(14): 8074–79.
UN-HABITAT (2007) Global Report on Human Settlements 2007 - Enhancing Urban Safety and Security, United Nations Human Settlements Programme (UN-HABITAT), New York.
UN-HABITAT (2008) State of the world cities 2008/09, United Nations Human Settlements Programme (UN-HABITAT), Nairobi, Kenya.
UNCCD (2005) The consequences of desertification. Fact sheet 3, United Nations Convention to Combat desertification.
UNDESA (2002) World Urbanization Prospects: the 2001 Revision. United Nations Population, Division Department of Economic and Social Affairs, New York.
UNDESA (2006) World Urbanization Prospects: the 2005 Revision, United Nations Population, Division Department of Economic and Social Affairs, New York.
UNDESA (2008) World Urbanization Prospects: the 2007 Revision, United Nations Population, Division Department of Economic and Social Affairs, New York.
UNDP (1997) Human development report, United Nations Development Programme, New York.
UNDP (2002) Human development report, United Nations Development Programme, New York.
UNDP (2006) Human development report. Beyond scarcity: Power, poverty and the global water crisis, United Nations Development Programme, New York 440 pp.
UNenergy (2007) sustainable Bioenergy: A Framework for Decision Makers.
UNEP (2007) Global Environmental Outlook IV, United Nations Environmental Programme, EarthScan, London.
UNEP, FAO and UNFF (2008) Vital Forest Graphics: Stopping the Downswing?, The United Nations Environmental Programme (UNEP), The Food and Agriculture Organization of the United Nations (FAO) and The United Nations Forum on Forests Secretariat (UNFF).
UNSTAT (2005) National Accounts Main Aggregates Database. United Nations Statistics Division.
Van der Sluijs, J.P. (2002) Integrated Assessment. In: R.E. Munn and M. Tolba (Editors), Encyclopedia of Global Environmental Change, Volume 4, Responding to global environmental change. Wiley, London, pp. 250–253.
Van Vuuren, D., Lucas, P.L. and Hilderink, H.B.M. (2005) Downscaling drivers of global environmental change scenarios: Enabling use of the IPCC SRES scenarios at the national and grid level. Global Environmental Change, 17(1): 114-130.
van Vuuren, D.P., van den Born, G. , van Oorschot, M. , Smout, F., van Vliet, J., Aiking, H., Londo, M., Mozaffarian, H. and Smekens, K. (2008) Biomass Assessment Assessment of global biomass potentials and their links to food, water, biodiversity, energy demand and economy, Main Report for Netherlands Research Programme on Scientific Assessment and Policy Analysis for Climate Change (WAB) 108 pp.
Vásquez-León, M., West, CT. and Finan, TJ. (2003) A comparative assessment of climate vulnerability: agriculture and ranching on both sides of the US–Mexico border. Global Environmental Change, 13: 159-173.
Verburg, P.H. , Ellis, E.C. and Letourneau, A. (in prep.) A global assessment of accessibility and market influence for global environmental change studies.
Walther, C., Janssen, P. and Luedeke, M.K.B. (forthcoming) Cluster Analysis: techniques for global change research. PIK report series, Potsdam Institute for Climate Impact Research (PIK) and Netherlands Environmental Assessment Agency (PBL).
WBGU (1995) World in trasition: The threath to soils. Annual report of the German Advisory Council on Global Change (WBGU), Bonn: Economica Verlag.
WBGU (2008) World in Transition: Future Bioenergy and Sustainable Land Use, German Advisory Council on Global Change (WBGU).
WCED (1987) Our common future. World Commission on Environment and Development, Oxford University Press, Oxford, UK.
WHO/UNICEF (2008a) Joint Monitoring Programme for Water and Sanitation (2008 A): Tables: urban population with access to improved drinking water, 1990 and 2000. Accessed on June 15th, 2008.
WHO/UNICEF (2008b) Joint Monitoring Programme for Water and Sanitation (2008 A): Tables: urban population with access to sanitation facilities, 1990 and 2000. Accessed on June 15th, 2008.
Wilbanks, T.J., Romero Lankao, P., Bao, M., Berkhout, F., Cairncross, S., Ceron, J.-P., Kapshe, M., Muir-Wood, R. and Zapata-Marti, R. (2007) Industry, settlement and society. In: M.L. Parry, O.F. Canziani, J.P. Palutikof, P.J. van der Linden and C.E. Hanson (Editors), Climate Change 2007: Impacts, Adaptation and Vulnerability. Contribution of Working Group II to the Fourth Assessment Report of the Intergovernmental Panel on Climate Change. Cambridge University Press, Cambridge, UK, pp. 357-390.
Wolf, A.T. (1999) Water Wars and Water Reality: Conflict and Cooperation Along International Waterways. S.C. Lonergan (Editors). Environmental Change, Adaption, and Human Security. Dordrecht: Kluwer. Kluwer, Dordrecht.
World Bank (2006) World Development Indicators. World Bank, Washington DC, www.worldbank.org/data, www.worldbank.org/data.
World Bank (2007) World Development Indicators. World Bank, Washington DC, www.worldbank.org/data, www.worldbank.org/data.
WorldBank (2004) Sustaining Forests: A Development Strategy, Washington, D.C.
WRI (2002) Drylands, people, and ecosystem goods and services: a web-based geo-spatial Analysis, World Resources Institute.
Xu, R. and Wunsch II, D.C. (2008) Recent advances in cluster analysis. International Journal of Intelligent Computing and Cybernetics, 1(4): 484-508.
References 91
Colophon
ResponsibilityNetherlands Environmental Assessment Agency
Co-ordinatorMarcel Kok
Contributing authorsMarcel Kok, Mathias Lüdeke (PIK), Till Sterzel (PIK), Paul Lucas, Carsten Walter (PIK), Peter. Janssen and Indra de Soysa (NTNU)
With contributions fromTonnie Tekelenburg, Diana Sietz (PIK) and Jessica Brighenti (PIK)
Language editingJames Caulfield and Annemiek Righart
Graphics designPaul Lucas and Kees Klein Goldewijk
LayoutRIVM publications
Corresponding [email protected]
PBL Netherlands Environmental Assessment Agency, December 2010
Quantitative analysis of patterns of vulnerability to global environmental change
Patterns of vulnerability bridge the gap between local case
studies and global vulnerability assessments
The impacts of global change, including environmental changes,
pose increasing risks for people around the globe. In this context,
we developed and applied a methodology to quantitatively assess
the extent to which specific groups of people are vulnerable to
losing their livelihoods. Local vulnerability analyses are often
based on case studies, while global vulnerability assessments are
essentially based on aggregated data and rather crude assumptions
about underlying mechanisms. Recognising the need and the
potential for looking at similarities between related situations
around the globe, the methodology generalises the outcomes of
case studies towards patterns of vulnerability, using insights from
global assessments.
Using indicators from global Integrated Assessment Models,
the methodology quantifies the core mechanisms that cause
vulnerability. Different manifestations of the patterns and their
geographic location are assessed through cluster analysis. The
methodology has been applied to the following four patterns of
vulnerability: smallholder farming in dryland areas, overexploitation
of natural resources, competition over land for food and biofuels,
and rapid urbanisation in coastal areas. Insights gained from this
study can give guidance to adaptation and mitigation policies in
specific situations, and can serve as a reference for identifying the
consequences of international policies for vulnerable groups.Background Studies