Embed Size (px)
Citation preview

Quantitative Analysis of Microtubule DynamicsDuring Adhesion-Mediated Growth Cone Guidance
Aih Cheun Lee,1 Daniel M. Suter1,2
1 Department of Biological Sciences, Purdue University, West Lafayette, Indiana 47907
2 Bindley Bioscience Center, Purdue University, West Lafayette, Indiana 47907
Received 30 April 2008; revised 3 June 2008; accepted 9 June 2008
ABSTRACT: During adhesion-mediated neuronal
growth cone guidance microtubules undergo major
rearrangements. However, it is unknown whether
microtubules extend to adhesion sites because of
changes in plus-end polymerization and/or translocation
dynamics, because of changes in actin–microtubule
interactions, or because they follow the reorganization
of the actin cytoskeleton. Here, we used fluorescent
speckle microscopy to directly quantify microtubule and
actin dynamics in Aplysia growth cones as they turn
towards beads coated with the cell adhesion molecule
apCAM. During the initial phase of adhesion formation,
dynamic microtubules in the peripheral domain prefer-
entially explore apCAM-beads prior to changes in
growth cone morphology and retrograde actin flow.
Interestingly, these early microtubules have unchanged
polymerization rates but spend less time in retrograde
translocation due to uncoupling from actin flow. Fur-
thermore, microtubules exploring the adhesion site
spend less time in depolymerization. During the later
phase of traction force generation, the central domain
advances and more microtubules in the peripheral do-
main extend because of attenuation of actin flow and
clearance of F-actin structures. Microtubules in the
transition zone and central domain, however, translo-
cate towards the adhesion site in concert with actin arcs
and bundles, respectively. We conclude that adhesion
molecules guide neuronal growth cones and underlying
microtubule rearrangements largely by differentially
regulating microtubule–actin coupling and actin move-
ments according to growth cone region and not by con-
trolling plus-end polymerization rates. ' 2008 Wiley
Periodicals, Inc. Develop Neurobiol 68: 1363–1377, 2008
Keywords: microtubule dynamics; actin dynamics;
growth cone guidance; cell adhesion; fluorescent speckle
microscopy
INTRODUCTION
Neuronal growth cones are highly specialized signal-
ing devices at the tip of axons, integrating extracellu-
lar guidance information and transducing it into
directional movement towards target cells. The two
major cytoskeletal components that drive this direc-
tional locomotion are microtubules and actin fila-
ments (Dent and Gertler, 2003; Gordon-Weeks, 2004;
Kalil and Dent, 2005). It is well established that the
actin cytoskeleton is critical for growth cone motility,
while microtubules are essential for axonal elonga-
tion (Yamada et al., 1970; Letourneau and Ressler,
1984; Marsh and Letourneau, 1984). In addition, both
microtubule and actin dynamics are required for
growth cone guidance (Bentley and Toroian-Ray-
mond, 1986; Sabry et al., 1991; Chien et al., 1993;
Tanaka and Kirschner, 1995; Williamson et al., 1996;
Challacombe et al., 1997; Buck and Zheng, 2002;
Suter et al., 2004). Growth cone steering in vivo and
Additional Supporting Information may be found in the onlineversion of this article.
Correspondence to: D.M. Suter ([email protected]).Contract grant sponsor: NIH; contract grant number: R01
NS049233.Contract grant sponsor: Bindley Bioscience Center, Purdue Uni-
versity.
' 2008 Wiley Periodicals, Inc.Published online 12 August 2008 in Wiley InterScience (www.interscience.wiley.com).DOI 10.1002/dneu.20662
1363

in vitro involves major rearrangements of both micro-
tubules and actin filaments (Sabry et al., 1991; Lin
and Forscher, 1993; O’Connor and Bentley, 1993;
Tanaka and Kirschner, 1995; Tanaka and Sabry,
1995; Suter et al., 1998; Dent and Gertler, 2003;
Zhou and Cohan, 2004).
Dynamic microtubules explore the growth cone pe-
ripheral (P) domain, where they interact with F-actin
bundles (Tanaka and Kirschner, 1991; Dent and Kalil,
2001; Schaefer et al., 2002; Zhou et al., 2002; Suter
et al., 2004). The steady state distribution of these
dynamic microtubules is largely determined by plus-
end polymerization and retrograde translocation.
Although not required for microtubule exploration of
the P domain, filopodial actin bundles guide the poly-
merization of microtubules, while removing them at
the same time from the periphery by coupling to retro-
grade actin flow (Schaefer et al., 2002; Burnette et al.,
2007). Furthermore, actin–microtubule interactions are
critical for growth cone guidance and directed axonal
outgrowth (Challacombe et al., 1996; Dent and Kalil,
2001; Buck and Zheng, 2002; Schaefer et al., 2002;
Zhou et al., 2002; Gordon-Weeks, 2004; Suter et al.,
2004; Zhou and Cohan, 2004). Despite this wealth of
information on the role of the growth cone cytoskele-
ton, surprisingly little is known about which aspects of
actin and microtubule polymerization and transloca-
tion dynamics are affected during growth cone turning
induced by specific guidance cues. The Aplysia cell
adhesion molecule (apCAM) mediates growth cone
steering involving leading edge protrusion and central
(C) domain advance accompanied by attenuation of
retrograde F-actin flow, traction force generation and
microtubule extension to adhesion sites (Suter et al.,
1998). These findings provided evidence for a mecha-
nism of substrate–cytoskeletal coupling controlling not
only growth cone movements (Mitchison and Kirsch-
ner, 1988; Jay, 2000; Suter and Forscher, 2000) but
cell migration in general (Lauffenburger and Horwitz,
1996; Jurado et al., 2005; Gupton and Waterman-
Storer, 2006; Giannone et al., 2007). In addition, two
molecular motors, myosin II and dynein, have recently
been implicated in laminin-mediated growth cone
guidance and remodeling (Turney and Bridgman,
2005; Myers et al., 2006; Grabham et al., 2007). How-
ever, it is unclear whether microtubule polymerization
or translocation dynamics actually change during ad-
hesion-mediated growth cone turning, whether micro-
tubule–actin interactions are altered or whether micro-
tubules simply follow the actin reorganization.
To address these basic questions we combined
microtubule/actin fluorescent speckle microscopy
(FSM) (Waterman-Storer et al., 1998) with the
restrained bead interaction (RBI) assay, which utilizes
apCAM-coated beads to induce adhesion-mediated
growth cone steering (Suter et al., 1998). The combina-
tion of these two techniques enabled us to directly
quantify both actin and microtubule dynamics during
apCAM-mediated adhesion formation and traction
force generation. Our results show that microtubules
explore the adhesion site before morphological changes
occur and that these early microtubules extend due to
uncoupling from retrograde actin flow and not due to
changes in plus-end polymerization dynamics. During
the second phase of growth cone guidance when trac-
tion force builds up, the bulk of microtubules reorient
largely due to changes of the actin organization.
METHODS
Aplysia Bag Cell Neuronal Culture
Aplysia bag cell neurons were dissected and cultured on
poly-L-lysine-coated coverslips as previously described
(Forscher and Smith, 1988; Suter et al., 1998). Cultured
cells were kept in L15 medium (Invitrogen) supplemented
with artificial seawater (ASW) overnight in a 148C incuba-
tor. All procedures were performed in accordance with
institutional guidelines.
FSM of Microtubule and F-ActinDynamics
We performed multimode Differential Interference Contrast
(DIC)/microtubule/actin FSM as recently described
(Waterman-Storer et al., 1998; Schaefer et al., 2002). 1 mg/
mL rhodamine-labeled tubulin (Cytoskeleton) and 20 lMAlexa 488-phalloidin (Molecular Probes) were prepared in
injection buffer (100 mM PIPES pH 7.0, 1 mM MgCl2,
1 mM EGTA) and clarified at 10,000g for 30 min at 48Cbefore microinjection into the cell bodies of Aplysia bag cell
neurons after one day in culture, using an NP-2 micromani-
pulator and Femtojet microinjection system (Eppendorf).
Cells were allowed to recover for at least 1 h before L15-
ASW was exchanged with imaging medium (ASW supple-
mented with 2 mg/mL BSA, 1 mg/mL L-carnosine, and 25
mM vitamin E; all chemicals from Sigma-Aldrich or Calbio-
chem). Triple channel DIC/microtubule/actin time-lapse
sequences were taken at 10 s intervals, using an Eclipse
TE2000E (Nikon) microscope equipped with a 60 3 1.4 NA
oil objective and an EMCCD camera (Cascade II, Photomet-
rics) controlled with MetaMorph 7.0 software (Molecular
Devices). Fluorescent epi-illumination was provided by an
X-cite 120 metal halide lamp (EXFO Photonic Solutions)
and appropriate single band pass filter sets (Chroma).
RBI Assay
RBI assays were performed as previously reported (Suter
et al., 1998; Suter et al., 2004). About 5 lm-diameter Ni-
1364 Lee and Suter
Developmental Neurobiology

NTA silica beads (Micromod) were coated with recombi-
nant 6His-tagged apCAM purified from baculovirus-
infected Sf9 cells (Suter et al., 2004). apCAM-coated beads
were prepared as a 1:5000 dilution from 1% stocks in imag-
ing medium. Cells were perfused with imaging medium
throughout the experiment. We used a 3D-hydraulic micro-
manipulator (Narishige) to move individual beads with a
microneedle onto the center quadrants Q2 or Q3 of the
growth cone P domain and prevent them from retrograde
movement. Because of the regional difference in microtu-
bule distribution (Fig. 1), beads were consistently placed on
the center quadrants to assess microtubule and actin dynam-
ics. Triple channel time-lapse recording was performed
before and immediately after bead placement until the C
domain boundary reached the bead site, as determined by
DIC imaging.
Image Processing and Analysis ofCytoskeletal Dynamics
MetaMorph 7.0 software (Molecular Devices) was used for
image processing, quantitative analysis of microtubule and
actin dynamics and making of movies and montages. To
enhance speckles, microtubule and actin images were proc-
essed with spatial filters in the following sequence: (1) Low
pass 4 3 4; (2) Laplace 2 edge enhancement; (3) Low pass
3 3 3. For measuring microtubule density past 75% line,
10 min time-lapse stacks (60 images) were processed,
binarized, and summed per segment. The C domain-bead
axis was defined as the 5 lm wide corridor between the
bead position and the C domain boundary. Using individual
microtubule montages, polymerization, and depolymeriza-
tion rates were measured as the length change between the
first speckle at the plus-end and an internal microtubule fi-
duciary mark over time, while translocation was defined by
position changes of an internal speckle (Schaefer et al.,
2002). For analysis of microtubule polymerization and
translocation dynamics, we only selected clearly identifia-
ble single microtubules in the P domain. Rates were deter-
mined on a time-weighted basis. Retrograde F-actin flow
rates were assessed by kymograph analysis of actin speck-
les. One tailed paired t-tests were performed to identify sig-
nificant changes in dynamics parameters between side vs.
center, on- vs. off-axis, and pre-bead vs. latency microtu-
bules. Photoshop CS3 (Adobe) and Canvas 8 (Deneba)
were used for image processing and final figure assembly.
RESULTS
Dynamic Microtubules PreferentiallyExplore the Growth Cone Peripheryon the Side
Before analyzing microtubule dynamics during adhe-
sion-mediated growth cone guidance, we first won-
dered whether there are regional differences in micro-
tubule dynamics along the periphery in steady state
Aplysia growth cones on poly-lysine substrates (Fig.
1). Such information is critical for the proper analysis
and interpretation of changes in microtubule behavior
during growth cone responses to more specific adhe-
sion substrates, such as apCAM. In agreement with
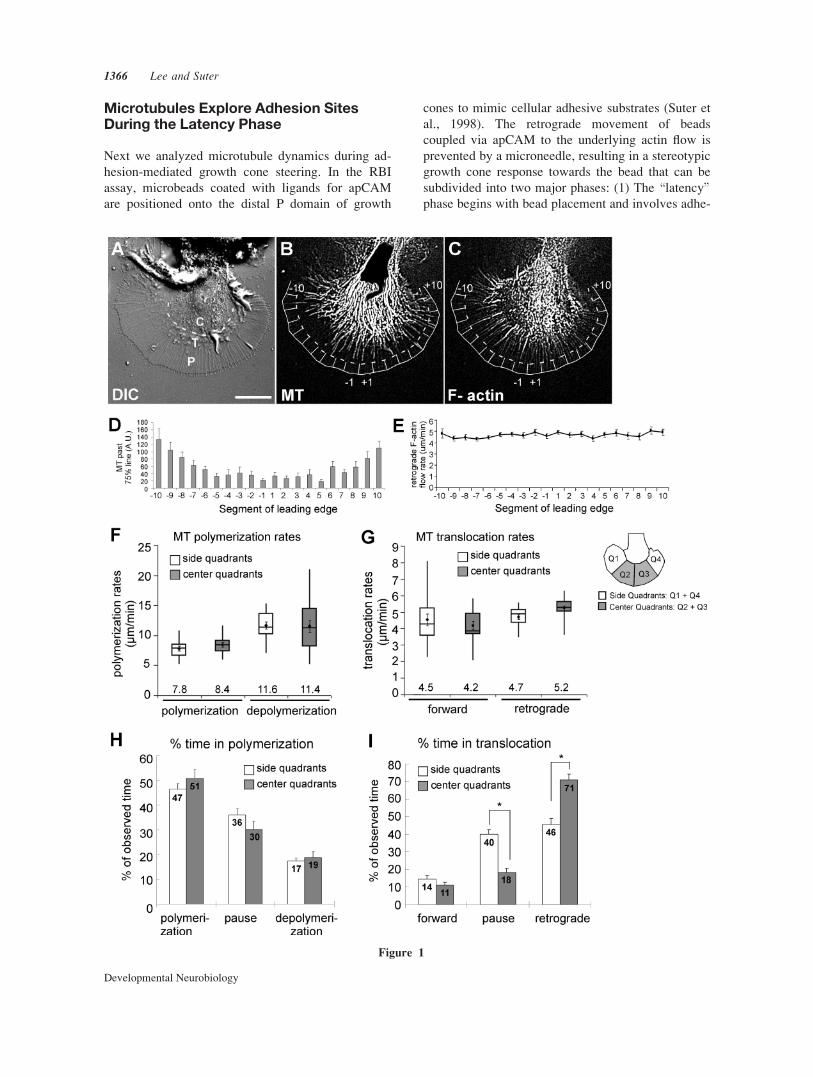
our previous study (Suter et al., 2004), we found that
in steady state growth cones dynamic microtubules
explore the distal P domain 67% more frequently in
the side than in the center segments [Fig. 1(B,D);
Movie 1]. Since microtubules are often associated
with retrogradely moving filopodial actin bundles in
the P domain (Schaefer et al., 2002), a slower actin
flow in the side sections would result in less
\clearing" of microtubules from the growth cone pe-
riphery. However, here we did not measure any sig-
nificant differences in actin flow rates along the
growth cone periphery [Fig. 1(C,E); average actin
flow rate 4.7 6 0.2 lm/min] and therefore propose
that the increased density of microtubules in distal
side areas is not due to a similar decrease in retro-
grade F-actin flow rates.
Next, we analyzed microtubule plus-end polymer-
ization and translocation dynamics in side versus cen-
ter quadrants by FSM [Fig. 1(F–I)]. Polymerization
rates were not significantly different between side
(7.8 6 0.4 lm/min) and center region microtubules
(8.4 6 0.4 lm/min), and similar observations were
made for depolymerization rates [Fig. 1(F)]. In addi-
tion, forward (4.5 6 0.4/4.2 6 0.3 lm/min) and retro-
grade (4.7 6 0.2/5.2 6 0.2 lm/min) translocation
rates did not differ between microtubules in side ver-
sus center regions, respectively [Fig. 1(G)]. Retro-
grade translocation rates of microtubules were similar
to retrograde actin flow rates. This is suggestive of
actin-microtubule coupling, which occurs 65% of
time between microtubules and actin bundles in the
growth cone periphery (Schaefer et al., 2002). Fur-
thermore, the percentage of time microtubules spent
in polymerization or depolymerization had no re-
gional variations [Fig. 1(H)].
The only significant difference between side and
center microtubules were the fractions of time spent
in retrograde translocation and pauses [Fig. 1(I)].
Center microtubules spent 71% 6 3% of the observed
time in retrograde translocation compared with
46% 6 3% for side microtubules. Conversely, center
microtubules spent less time (18% 6 2%) in translo-
cation pauses than side microtubules (40% 6 3%).
Thus, dynamic exploratory microtubules were more
abundant in distal side regions because they spent
less time spent in retrograde translocation, most
likely due to uncoupling from actin flow.
Microtubule Dynamics in Growth Cone Guidance 1365
Developmental Neurobiology
Microtubules Explore Adhesion SitesDuring the Latency Phase
Next we analyzed microtubule dynamics during ad-
hesion-mediated growth cone steering. In the RBI
assay, microbeads coated with ligands for apCAM
are positioned onto the distal P domain of growth
cones to mimic cellular adhesive substrates (Suter et
al., 1998). The retrograde movement of beads
coupled via apCAM to the underlying actin flow is
prevented by a microneedle, resulting in a stereotypic
growth cone response towards the bead that can be
subdivided into two major phases: (1) The \latency"phase begins with bead placement and involves adhe-
Figure 1
1366 Lee and Suter
Developmental Neurobiology

sion formation and signaling but very little morpho-
logical changes. (2) The following \traction" phase
[previously named \interaction" phase (Suter et al.,
1998)] is characterized by major structural, cytoskele-
tal and biophysical changes. These changes include C
domain extension towards the bead and protrusive
growth of the leading edge in front of the bead. Actin
flow is significantly attenuated along the C domain-
bead axis and microtubules extend towards the adhe-
sion site, while tension builds up between the C do-
main and the bead substrate [Fig. 2(A–D); Movie 2]
(Suter et al., 1998). These morphological and cytos-
keletal rearrangements faithfully recapitulate the
events occurring during growth cone encounters with
favorable cellular substrates (Lin and Forscher, 1993)
and correspond to the stages in axon formation (Gold-
berg and Burmeister, 1986; Dent and Gertler, 2003).
During the latency period we previously observed
F-actin accumulation and Src activation around the
bead adhesion site, both depend on dynamic microtu-
bules (Suter et al., 2004). Since microtubules
strengthen apCAM-actin coupling by Src activation,
we speculated that dynamic microtubules could pref-
erentially explore the adhesion site during the latency
phase. Indeed, here we show by live cell imaging that
microtubule density in the distal P domain along the
C domain-bead axis (on-axis) but not in neighboring
areas (off-axis) increased up to nine-fold throughout
the latency period, whereas overall growth cone mor-
phology remained stable [Fig. 2(D,E); Movie 3].
Thus, preferential microtubule extension to the adhe-
sion site occurred clearly before the C domain (char-
acterized by large organelles) moved towards the
bead. Microtubule density then further doubled
between the late latency and the traction period [Fig.
2(E)].
Since microtubule distribution in the P domain is
affected by the actin cytoskeleton (Forscher and
Smith, 1988; Burnette et al., 2007), we analyzed
whether changes in F-actin dynamics or content could
explain the preferential microtubule exploration of
the apCAM adhesion site during the latency phase.
Consistent with our measurements of F-actin flow
rates, using marker beads (Suter et al., 1998), actin
FSM revealed that during the complete latency period
retrograde F-actin flow along the C domain-bead axis
(5.1 6 0.3 lm/min in late latency) was not different
from either the period before bead placement (4.9 6
0.3 lm/min) or off-axis areas (5.1 6 0.3 lm/min)
[Fig. 2(F,G)]. In addition, we did not observe any
decrease in F-actin content between the C domain
boundary and the bead area during the latency period.
During the traction phase however, we observed an
80% attenuation of retrograde flow as well as a
decrease in F-actin content specifically along the C
domain-bead axis [dark area below line 5 and white
arrows in Fig. 2(G)]. Furthermore, montages of on-
axis F-actin dynamics revealed brief periods of for-
ward movements of actin structures at the end of the
traction phase [arrows in Fig. 2(G)]. Upon bead
release, flow rates were increased when compared
with pre-bead control rates [Fig. 2(G), line 6: 12.7
lm/min], indicating that the beads were under strong
tension during the traction phase. In summary, micro-
tubules along the C domain-bead axis preferentially
explored apCAM adhesion sites during the early
phase of apCAM-cytoskeletal coupling even though
F-actin flow continued at similar rate.
Figure 1 Regional differences in microtubule translocation dynamics in steady state growth
cones. (A) DIC image of a live Aplysia growth cone, including P domain, transition (T) zone, and
C domain. Scale bar: 20 lm. (B) Microtubules (MT) labeled by rhodamine-tubulin explore the P
domain more in side than center segments. P domains were divided into 20 segments. Dashed line
marks 75% of the distance from C domain boundary to the leading edge. (C) F-actin structures
including filopodial bundles visualized with Alexa 488-phalloidin. (D) Quantification of microtu-
bule exploration in distal segments: average values 6 SEM of the sum of binarized microtubule
signal beyond the 75% line (n ¼ 16 growth cones). (E) Retrograde actin flow rate was similar in all
segments (mean values 6 SEM; n ¼ 10). (F–I) Microtubule polymerization and translocation dy-
namics in side quadrants (n ¼ 36 microtubules) and center quadrants (n ¼ 34 microtubules). Data
was averaged per growth cone and then mean values were determined from n ¼ 16 growth cones.
(F) Whisker plots of microtubule polymerization and depolymerization rates. The top and lower
ends of the boxes are the upper and lower quartiles; the middle line is the median value. Whiskers
are minimum and maximum values. Means 6 SEM are dots with error bars; mean values (lm/min)
are above x-axis. Paired t-test (side vs. center): p ¼ 0.15 (polymerization rate), p ¼ 0.45 (depoly-
merization rate). (G) Whisker plots of forward (p ¼ 0.24) and retrograde (p ¼ 0.01) translocation
rates. (H) Percentage of time spent in polymerization, polymerization pauses, or depolymerization
(Mean values 6 SEM; p > 0.05). (I) Percentage of time spent in forward, translocation pauses, or
retrograde translocation. *p < 0.005.
Microtubule Dynamics in Growth Cone Guidance 1367
Developmental Neurobiology

Exploratory Microtubules Spend LessTime Coupled to Actin Flowand in Depolymerization
To determine the mechanisms by which microtu-
bules explore the adhesion site during the latency pe-
riod, we analyzed and comparedplus-end polymer-
ization and translocation dynamics of individual
microtubules located on and off the C domain-bead
axis before (\pre-bead") and right after bead place-
ment (\latency") on the same growth cones. Before
Figure 2
1368 Lee and Suter
Developmental Neurobiology

bead placement on-axis microtubules were often
observed in polymerization phase, while undergoing
retrograde translocation [Fig. 3(A)]. During the la-
tency phase, however, these on-axis microtubules
spent less time in depolymerization and retrograde
translocation [Fig. 3(B)]. Quantification of plus-end
polymerization and translocation dynamics in 10
growth cones is presented in Figure 4. During the la-
tency period, polymerization (6.9 6 0.6 lm/min) and
depolymerization rates (9.2 6 1.1 lm/min) of on-axis
microtubules did not differ significantly from control
values measured in the same region before bead
placement (7.7 6 0.4 and 10.4 6 1.3 lm/min, respec-
tively) or from off-axis control microtubules [Fig.
4(B)]. Retrograde and forward translocation rates of
microtubules exploring the adhesion site during the
latency period also remained similar to pre-bead con-
trol values as well as to rates of off-axis microtubules
before and after bead placement on the same growth
cones [Fig. 4(C)].
Notably, these exploratory microtubules spent sig-
nificantly less time in retrograde translocation during
the latency period when compared with pre-bead con-
trol microtubules (53% 6 7.5% vs. 74% 6 2.1%),
while spending more time in translocation pauses
[31% 6 3.2% vs. 16% 6 1.8%; Fig. 4(E)]. In addi-
tion, these on-axis microtubules also spent less time
in depolymerization during the latency period than
before bead placement (7% 6 1.2% vs. 18% 6
3.0%), but more time in polymerization pauses
[41% 6 4.0% vs. 31% 6 4.4%; Fig. 4(D)]. Neither
polymerization nor translocation dynamics of off-
axis microtubules were affected during any phase of
the apCAM-mediated growth cone guidance. Thus,
microtubules preferentially explore apCAM adhe-
sion sites during the latency phase through two
mechanisms: (1) because they undergo less retro-
grade translocation due to partial uncoupling from
actin flow and (2) because they spend less time in
depolymerization.
Microtubule Extension During theTraction Phase in Response to F-ActinRearrangements
We next investigated the mechanism of bulk microtu-
bule extension towards the adhesion site during the
traction phase of apCAM-mediated growth cone
guidance. We have previously shown that apCAM-
actin coupling results in an acute reduction of retro-
grade actin flow at the onset of the traction phase
(Suter et al., 1998; Suter and Forscher, 2001). Here,
we confirmed these flow effects, using actin FSM
[Figs. 2(G) and 5(A) upper panel, orange and pink
speckles]. During the traction phase, retrograde actin
flow rates between the bead and the C domain were
reduced by 80% compared with before bead place-
ment (n ¼ 7). In addition, we observed a gradual
clearance of actin bundles from the on-axis corridor
during the traction period when compared with the la-
tency or pre-bead period [Fig. 2(G), dark area below
white arrows; Fig. 5(A)]. Finally, the transition (T)
zone, in which actin bundles are severed and disas-
sembled, moved forward during the traction period
[indicated by red line in Fig. 5(A)]. F-actin flow
attenuation and bundle clearance in the P domain
were accompanied by bulk extension of microtubules
towards the bead [Fig. 5(A) lower panel, red microtu-
bules], while exploratory microtubules from the la-
tency phase persisted around the bead [Fig. 5(A),
blue and green microtubules]. Observation of time-
lapse movies indicated that the polymerization dy-
namics of these on-axis microtubules during the trac-
tion period did not significantly differ from the pre-
Figure 2 Preferential microtubule exploration of apCAM sites during latency period. (A) DIC
image of growth cone directly after placement of apCAM-bead (time ¼ 0 min) restrained with a
micropipette. (B) Microtubule FSM image of (A). Dashed circle represents bead position; box
marks region used for time-lapse montage in (D). (C) Actin FSM image of (A). On-axis and off-
axis boxes were used for time-lapse montage in (G). (D) DIC and microtubule time-lapse montages
of on-axis corridor marked in (B) before bead placement, during latency and traction period. Indi-
vidual microtubules explored the adhesion site during the latency period. (E) Microtubule intensity
past the 75% boundary in the P domain increased on-axis (one bead diameter) during the latency
period and remained constant off-axis (up to two bead diameters next to the bead; mean values 6
SEM; n ¼ 10 growth cones). (F) Retrograde actin flow rates remained similar in the latency period,
but decreased significantly on-axis during the traction period (mean values 6 SEM; n ¼ 7 growth
cones). Latency period was equally divided into early, mid and late latency. (G) Montages of
F-actin bundles in on-axis and off-axis boxes indicated in (C). line 1: 5.1 lm/min; line 2: 4.9 lm/
min; line 3: 5.1 lm/min; line 4: 4.8 lm/min; line 5: 1.6 lm/min; line 6: 12.7 lm/min; line 10–70:4.9–6.1 lm/min. Scale bars: 20 lm (A), 10 lm (D).
Microtubule Dynamics in Growth Cone Guidance 1369
Developmental Neurobiology

bead or latency period, while most microtubules were
either in translocation pauses or still in retrograde
translocation, and very little forward translocation was
observed [Movies 2 and 4; Fig. 5(A) lower panel].
In addition, microtubules in the T zone and C do-
main were re-oriented in concert with adjacent actin
structures towards the apCAM-bead [Fig. 5(B);
Movie 4]. These structures include the transverse
actin arcs in the T zone as well as actin bundles in the
C domain, both of which undergo Rho-dependent ac-
tomyosin-contractility (Schaefer et al., 2002; Zhang
et al., 2003). Arcs are oriented perpendicular to the
Figure 3 Microtubule and actin dynamics before and after bead placement. Montages of individ-
ual microtubules (top) and actin bundles (bottom) in the on-axis region before bead placement (A)
and during the latency phase (B). The growth cone leading edge is facing the top edge. For translo-
cation analysis, an internal reference speckle was followed (green line: forward; yellow: transloca-
tion pause; magenta: retrograde). Internal actin speckles used for line tracing are shown in orange.
Polymerization events were determined by the addition/disappearance of microtubule plus end
speckles, and polymerization rates measured based on the distance between the tip and internal ref-
erence speckle per time interval. Microtubules are color-shaded based on polymerization event
(green: polymerization; yellow: polymerization pause; magenta: depolymerization). Arrows indi-
cate direction of retrograde flow. Time-lapse interval: 10 s. Vertical distance indicated on the right.
(A) Example of an on-axis microtubule before bead placement undergoing plus-end polymerization
and retrograde translocation (magenta lines) followed by depolymerization. (B) Example of an on-
axis microtubule during the latency period spending more time in translocation pause (yellow
lines).
1370 Lee and Suter
Developmental Neurobiology

filopodial actin bundles (Movie 4, orange and yellow
arrowhead; Fig. 6), while central actin bundles are
oriented parallel to the axis of growth (Movie 4, red
and pink arrowhead) and appear to be formed from T
zone arcs (Zhang et al., 2003). The kymographs in
Figure 5(B) show concomitant movements of actin
speckles on arcs and C domain bundles together with
microtubule speckles towards the C domain and the
apCAM-bead. These movements were confirmed by
tracking centroid positions of adjacent actin and
microtubule speckles [Fig. 5(C)]. During the traction
period the decrease of P domain actin structures
behind the bead resulted in reorientation of actin arcs
towards the adhesion site where they appeared to be
immobilized. Because they are under actomyosin-
based tension, actin arcs narrowed the C domain and
focused the microtubules towards the bead site
(Movie 4). Bulk microtubules and actin bundles in
the C domain both translocated forward towards the
apCAM-bead at an average rate of 2.69 6 0.05 lm/
min (n ¼ 6), which is similar to the rate of forward
movement of the C domain boundary and leading
edge (2.74 6 0.56 lm/min, n ¼ 14). In summary,
during the traction period, P domain microtubules
advanced towards the adhesion site because of actin
flow attenuation and actin clearance, while T zone
and C domain microtubules translocated forward
most likely through association with arcs and central
actin bundles, respectively.
DISCUSSION
There is accumulating evidence that actin–microtu-
bule interactions are critical for a number of cellular
processes, including cell migration, growth cone
pathfinding, cell division, and cortical flow (Rodri-
guez et al., 2003). In neuronal growth cones, actin–
Figure 4 Quantification of microtubule polymerization and translocation dynamics during the la-
tency period. (A) Schematic of P domain areas from which microtubules were selected for analysis:
Side quadrants before (pre-bead off-axis) and after bead placement (latency off-axis); C domain-
bead axis before (pre-bead on-axis) and after bead placement (latency on-axis). Only clearly quan-
tifiable microtubules were analyzed in 10 growth cones (42 microtubules on-axis, 33 microtubules
off-axis). (B) Polymerization rates do not change during the latency period (paired t-test for pre-
bead versus latency: p > 0.05). Data are shown as whisker plots. (C) Forward and retrograde trans-
location rates as whisker plots (p > 0.05). (D) During the latency phase, on-axis microtubules spent
less time in depolymerization and conversely more time in pause when compared with on-axis
microtubules before bead placement. (E) Exploratory on-axis microtubules spent less time in retro-
grade translocation and conversely more time in translocation pause during the latency period than
prior to bead placement. Mean values 6 SEM are shown in (D) and (E); *p < 0.05.
Microtubule Dynamics in Growth Cone Guidance 1371
Developmental Neurobiology

microtubule interactions regulate microtubule distri-
bution under steady state condition and are important
for growth cone steering and directed axonal out-
growth (Challacombe et al., 1996; Dent and Kalil,
2001; Buck and Zheng, 2002; Schaefer et al., 2002;
Zhou et al., 2002; Gordon-Weeks, 2004; Suter et al.,
2004; Zhou and Cohan, 2004). However, these previ-
ous studies have largely relied on immunocytochemi-
cal data and cytoskeletal drug treatments but not
quantitative live cell imaging. Thus, it has remained
unknown (1) whether microtubule polymerization or
translocation dynamics change during growth cone
steering, (2) whether actin–microtubule coupling
changes, or (3) whether microtubules simply follow
actin rearrangements. A detailed knowledge of which
aspect of cytoskeletal dynamics is affected in growth
Figure 5 Microtubules and F-actin rearrange in concert during the traction period. (A) Time-
lapse montage of actin (upper panel) and microtubule dynamics (lower panel) in the C domain-
bead axis during the late latency and traction period. Dashed line: growth cone leading edge; circle:
apCAM bead position. Actin speckles colored in pink and orange show that retrograde flow contin-
ued during late latency and abruptly stopped at the onset of traction phase. Red line: forward shift
of the T zone. Blue and green microtubules explored the bead since the late latency period, while
red microtubules extended to the bead during the traction period. White line: translocation pauses
of blue microtubule. Scale bar: 5 lm. (B) DIC image of a different growth cone, when the C do-
main reached the bead. Line Scans 1 and 2 through the T zone were used for actin and microtubule
kymographs on the right (green: actin, red: microtubules; see also Movie 4). Green box demarks
area used for tracking the speckle positions shown in (C). All scale bars: 10 lm. (C) Tracking of
three pairs of adjacent actin and microtubule speckles from boxed area in (B) in the traction period.
Arrows indicate direction of speckle movements.
1372 Lee and Suter
Developmental Neurobiology

cone turning is essential to understand the underlying
molecular mechanisms and guide the search for
cytoskeletal effector proteins downstream of guid-
ance receptors. To our knowledge the present study
represents the first quantitative analysis of microtu-
bules dynamics during adhesion-mediated cytoskele-
tal rearrangements involved in growth cone steering.
Here, we have demonstrated by quantitative microtu-
bule/actin FSM that microtubule extension in adhe-
sion-mediated attractive growth cone guidance is
largely regulated at the level of actin–microtubule
coupling and less by controlling microtubule plus-
end polymerization dynamics. While our findings, as
well as others, indicate that guidance cues primarily
affect the actin cytoskeleton and actin–microtubule
interactions (Dent and Gertler, 2003; Zhou and
Cohan, 2004), certain cues, such as NGF and slit,
may also signal directly to microtubule plus-end
binding proteins, such as APC and orbit/MAST/
CLASP, respectively, and affect microtubule dynam-
ics independently of the actin cytoskeleton (Lee et
al., 2004; Zhou et al., 2004).
Microtubule Dynamics in Steady StateGrowth Cones
Consistent with our previous report (Suter et al.,
2004), we found that steady state growth cones on
poly-lysine substrates have a higher density of ex-
Figure 6 Model: Mechanisms of microtubule extension during adhesion-mediated growth cone
guidance. Upper panel shows top view of growth cone in steady state, latency, and traction period
of adhesion-mediated growth cone guidance. Lower panel shows corresponding cross-sections of
the plasma membrane/cytoskeleton interface marked by the box in the top view. In steady state
growth cones on poly-lysine, apCAM is not coupled to actin (1), which moves at constant retro-
grade flow (2). Microtubule tip positions are determined by a balance of plus-end polymerization
and retrograde transport through actin flow coupling via putative linker protein(s) (blue) (3). During
the latency period, apCAM-actin coupling forces are weak (1) and therefore do not result in flow
attenuation (2). Putative signals derived from the adhesion site might uncouple microtubules from
F-actin by changing the affinity of linker protein(s) to at least one of the cytoskeletal components
(3), resulting in higher microtubule exploration of the adhesion site. Note that the additional possi-
ble mechanisms discussed, such as increased microtubule stability and capture at adhesion site, are
not depicted in this schematic. During the traction period, strong apCAM-actin coupling (1) stops
retrograde flow along the C domain-bead axis (2). Microtubules persisting at the bead since the la-
tency phase are joined by new microtubules invading the corridor due to actin flow attenuation and
F-actin clearance (3). T zone and C domain microtubules translocate towards the bead, potentially
by coupling to arcs and central actin bundles.
Microtubule Dynamics in Growth Cone Guidance 1373
Developmental Neurobiology
ploratory microtubules in the side versus center
regions (Fig. 1). The present finding of constant actin
flow rates along the growth cone periphery is in slight
contrast with our previous study, where we reported a
15% decrease in actin flow in the side versus center
regions (Suter et al., 2004). Because of the larger
sample size in the present study, we believe that the
current finding is more accurate. In addition, a rela-
tively small decrease of 15% in actin flow could not
solely explain the 67% increase in microtubule den-
sity on the side. Thus, other mechanisms must cause
the region-specific microtubule exploration of the dis-
tal P domain. We found that microtubules in the side
segments spend significantly less time in retrograde
translocation than microtubules in the center seg-
ments. Since retrograde microtubule translocation is
largely caused by coupling to retrogradely moving
actin bundles (Schaefer et al., 2002), we conclude
that microtubules on the growth cone sides have a
lower level of actin coupling than center region
microtubules. Such differences in actin coupling
could be because of potential alterations in amounts
or affinities of actin-microtubule linker proteins
between side and center regions. Although putative
linker molecules, such as microtubule associated and
motor proteins have been proposed, clearly more
work is needed to establish the role of these candidate
proteins in neuronal growth cones (Rodriguez et al.,
2003).
What could be the functional significance of these
regional differences in microtubule distribution?
Since evidence suggests that microtubules have a sig-
naling role in growth cone steering (Buck and Zheng,
2002; Suter et al., 2004), we speculate that the higher
density of microtubules in the side regions could
increase the sensing potential of the growth cone for
guidance cues that are presented more \off-path"with respect to the direction of growth. At least in the
case of the large Aplysia growth cone with a wide
and not very dynamic P domain, the probability of
adhesion receptor binding and activation on the side
could be lower than in the center region, while the
growth cone is moving straight ahead in cell culture.
Because of the Aplysia growth cone geometry, adhe-
sion molecules presented in the path of growth cone
movement will engage a higher number of receptors
in the center part of the P domain when compared
with adhesion molecules presented at similar den-
sities on the side. The growth cone might compensate
the lower probability of encountering molecular cues
on the side with an increased microtubule density,
which in turn could increase the probability of turning
responses. Whether such a mechanism plays a role
for growth cone guidance in vivo, where growth
cones tend to be smaller, more dynamic and exposed
to multiple cues, is unknown.
Microtubule Dynamics DuringAdhesion-Mediated GrowthCone Guidance
Interestingly, we also found evidence that uncoupling
from retrograde actin flow is a major cause for the
gradual increase in microtubule density at adhesion
sites during the latency period of apCAM-mediated
growth cone guidance. This finding might be in con-
trast with our previous observations of low microtu-
bule density at the bead based on tubulin immunocyto-
chemistry of growth cones fixed during the latency pe-
riod (Suter et al., 2004). Immunocytochemistry only
provides a snapshot in time, while microtubule FSM
allows monitoring the behavior of microtubules during
the complete sequence of apCAM-induced growth
cone responses. Thus, immunocytochemistry likely
underestimates actual microtubule dynamics. In addi-
tion, quantification of microtubule density was per-
formed differently in the two studies: Previously, we
determined the average number of microtubules at the
bead site and did not directly compare these values
with microtubule density at same location before bead
placement or off-axis. Here, we determined microtu-
bule density by summation of binarized microtubule
intensities in more growth cones over 10 min and
directly compared these values with microtubule den-
sities before bead placement and off-axis. Thus, we
believe that the present study describes the microtubule
behavior during the latency period more accurately.
A refined substrate-cytoskeletal model (Mitchison
and Kirschner, 1988; Jay, 2000; Suter and Forscher,
2000) explaining the underlying cytoskeletal changes
involved in adhesion-mediated growth cone guidance
is depicted in Figure 6. Similarly to our present find-
ings, previous studies reported early microtubule
rearrangements before growth cones turn away from
a repelling substrate border (Tanaka and Kirschner,
1995; Williamson et al., 1996; Challacombe et al.,
1997). We hypothesize that a signal originating from
the adhesion site traveling retrogradely with actin
flow may reduce the coupling state of putative actin-
microtubule linker protein(s), such as MAP2, tau, or
Short Stop (Rodriguez et al., 2003). Our data also
support two other potential mechanisms leading to
increased microtubule density at adhesion sites dur-
ing the early phase of adhesion-mediated growth
cone rearrangements. (1) One mechanism could
involve stabilization by plus-end tracking proteins,
since microtubules also spent less time in depolymer-
1374 Lee and Suter
Developmental Neurobiology

ization during the latency period (Gordon-Weeks,
2004; Kalil and Dent, 2005; Koester et al., 2007).
Conventionally, measures of microtubule stability are
usually the classic parameters catastrophe and rescue
frequencies, which are the frequencies of polymeriza-
tion/depolymerization transition events (Walker
et al., 1988). In this study we have not used these pa-
rameters to describe microtubule stability, because
microtubules in the growth cone periphery frequently
collapse into the crowded C domain, after which it is
difficult to determine whether the same microtubules
underwent rescue or not, resulting in an underesti-
mate of rescue events (Tanaka and Kirschner, 1991).
Instead we used the straightforward measurement of
\percentage time spent" in a given polymerization
behavior category, which is partially reflective of ca-
tastrophe and rescue frequencies. (2) The second al-
ternative mechanism could be explained by the cap-
ture of microtubules at the adhesion site, as shown
previously for non-neuronal cells (Kaverina et al.,
1998; Gundersen, 2002), since we observed an
increase in translocation pause of exploratory micro-
tubules during the latency period.
What is the purpose of attracting early microtu-
bules towards the newly formed adhesion site? Src
tyrosine kinase activation at the bead site is essential
for strong apCAM-actin coupling and depends on
microtubule dynamics (Suter and Forscher, 2001;
Suter et al., 2004). Thus, a bidirectional signal might
initiate cytoskeletal reorganization in apCAM-
induced growth cone steering. Upon apCAM-cluster-
ing near the leading edge, signals could travel with
retrograde actin flow to promote microtubule exten-
sion via partial actin–microtubule uncoupling and
microtubule stabilization (Fig. 6). These early micro-
tubules could then deliver signaling molecules, such
as Src activators to strengthen apCAM-actin cou-
pling. As a consequence, actin flow is attenuated and
actin bundles disappear, allowing bulk microtubule
extension to the adhesion site. Similar P domain inva-
sion by microtubules occurred when such actin
changes were induced globally either by application
of the myosin II inhibitor blebbistatin or the actin po-
lymerization inhibitor cytochalasin B (Forscher and
Smith, 1988; Burnette et al., 2007).
The concerted movement of T zone and C domain
microtubules and adjacent actin structures suggests
that microtubules are translocated towards the adhe-
sion site by coupling to reorienting actin arcs and
central actin bundles, respectively. The T zone actin
arcs and C domain actin bundles are likely the cytos-
keletal structures that maintain the tension built up
during adhesion-mediated neurite growth and guid-
ance (Lamoureux et al., 1989; Suter et al., 1998).
However, we can not precisely determine whether the
coupling level between microtubules and F-actin
changes during the phase of traction force generation
because of the high density of these cytoskeletal
structures in the C domain. Alternatively, the micro-
tubule motor dynein could be involved, as proposed
in laminin-stimulated growth cone turning and out-
growth (Myers et al., 2006; Grabham et al., 2007).
Finally, we can not formally exclude the possibility
that microtubule–microtubule interactions also con-
tribute to microtubule reorientation in the T zone and
C domain during the traction phase.
In summary, dynamic microtubules in the P do-
main of growth cones advance to apCAM adhesion
sites earlier than previously anticipated. Interestingly,
these microtubules do so by uncoupling from actin,
while bulk microtubule extension later occurs due to
actin rearrangements involved in growth cone guid-
ance. Since actin–microtubule interactions play a role
in cell migration in general (Waterman-Storer and
Salmon, 1997; Salmon et al., 2002; Rodriguez et al.,
2003), it will be interesting to investigate whether
similar changes in actin–microtubule coupling occur
when fibroblast-like cells migrate on different adhe-
sion substrates. These mechanistic findings will facil-
itate the search for the regulatory molecules in
charge, such as actin–microtubule linker protein(s),
which is an exciting goal for future studies.
The authors thank Dr. Gil Lee and Xiong Ying for assis-
tance with development of additional growth cone turning
assays not employed in the present study. We are grateful
to Dr. Peter Hollenbeck, Dr. Donald Ready, and Dr. Chris
Staiger as well as members of the Suter Lab for valuable
comments on the article. We also thank Dr. Laurie Iten for
help with compression of movie files.
REFERENCES
Bentley D, Toroian-Raymond A. 1986. Disoriented path-
finding by pioneer neurone growth cones deprived of
filopodia by cytochalasin treatment. Nature 323:712–
715.
Buck KB, Zheng JQ. 2002. Growth cone turning induced
by direct local modification of microtubule dynamics.
J Neurosci 22:9358–9367.
Burnette DT, Schaefer AW, Ji L, Danuser G, Forscher P.
2007. Filopodial actin bundles are not necessary for
microtubule advance into the peripheral domain of
Aplysia neuronal growth cones. Nat Cell Biol 9:1360–
1369.
Challacombe JF, Snow DM, Letourneau PC. 1996. Actin
filament bundles are required for microtubule reorienta-
tion during growth cone turning to avoid an inhibitory
guidance cue. J Cell Sci 109 (Part 8):2031–2040.
Microtubule Dynamics in Growth Cone Guidance 1375
Developmental Neurobiology

Challacombe JF, Snow DM, Letourneau PC. 1997.
Dynamic microtubule ends are required for growth cone
turning to avoid an inhibitory guidance cue. J Neurosci
17:3085–3095.
Chien CB, Rosenthal DE, Harris WA, Holt CE. 1993. Navi-
gational errors made by growth cones without filopodia
in the embryonic Xenopus brain. Neuron 11:237–251.
Dent EW, Gertler FB. 2003. Cytoskeletal dynamics and
transport in growth cone motility and axon guidance.
Neuron 40:209–227.
Dent EW, Kalil K. 2001. Axon branching requires interac-
tions between dynamic microtubules and actin filaments.
J Neurosci 21:9757–9769.
Forscher P, Smith SJ. 1988. Actions of cytochalasins on the
organization of actin filaments and microtubules in a
neuronal growth cone. J Cell Biol 107:1505–1516.
Giannone G, Dubin-Thaler BJ, Rossier O, Cai Y, Chaga O,
Jiang G, Beaver W, Dobereiner HG, Freund Y, Borisy G,
Sheetz MP. 2007. Lamellipodial actin mechanically links
myosin activity with adhesion-site formation. Cell
128:561–575.
Goldberg DJ, Burmeister DW. 1986. Stages in axon forma-
tion: Observations of growth of Aplysia axons in culture
using video-enhanced contrast-differential interference
contrast microscopy. J Cell Biol 103:1921–1931.
Gordon-Weeks PR. 2004. Microtubules and growth cone
function. J Neurobiol 58:70–83.
Grabham PW, Seale GE, Bennecib M, Goldberg DJ, Vallee
RB. 2007. Cytoplasmic dynein and LIS1 are required for
microtubule advance during growth cone remodeling and
fast axonal outgrowth. J Neurosci 27:5823–5834.
Gundersen GG. 2002. Evolutionary conservation of micro-
tubule-capture mechanisms. Nat Rev Mol Cell Biol 3:
296–304.
Gupton SL, Waterman-Storer CM. 2006. Spatiotemporal
feedback between actomyosin and focal-adhesion systems
optimizes rapid cell migration. Cell 125:1361–1374.
Jay DG. 2000. The clutch hypothesis revisited: Ascribing
the roles of actin-associated proteins in filopodial protru-
sion in the nerve growth cone. J Neurobiol 44:114–125.
Jurado C, Haserick JR, Lee J. 2005. Slipping or gripping?
Fluorescent speckle microscopy in fish keratocytes
reveals two different mechanisms for generating a retro-
grade flow of actin. Mol Biol Cell 16:507–518.
Kalil K, Dent EW. 2005. Touch and go: Guidance cues sig-
nal to the growth cone cytoskeleton. Curr Opin Neuro-
biol 15:521–526.
Kaverina I, Rottner K, Small JV. 1998. Targeting, capture,
and stabilization of microtubules at early focal adhesions.
J Cell Biol 142:181–190.
Koester MP, Muller O, Pollerberg GE. 2007. Adenomatouspolyposis coli is differentially distributed in growth cones
and modulates their steering. J Neurosci 27:12590–
12600.
Lamoureux P, Buxbaum RE, Heidemann SR. 1989. Direct
evidence that growth cones pull. Nature 340:159–162.
Lauffenburger DA, Horwitz AF. 1996. Cell migration: A
physically integrated molecular process. Cell 84:359–
369.
Lee H, Engel U, Rusch J, Scherrer S, Sheard K, Van Vactor
D. 2004. The microtubule plus end tracking protein
Orbit/MAST/CLASP acts downstream of the tyrosine ki-
nase Abl in mediating axon guidance. Neuron 42:913–
926.
Letourneau PC, Ressler AH. 1984. Inhibition of neurite ini-
tiation and growth by taxol. J Cell Biol 98:1355–1362.
Lin CH, Forscher P. 1993. Cytoskeletal remodeling during
growth cone-target interactions. J Cell Biol 121:1369–
1383.
Marsh L, Letourneau PC. 1984. Growth of neurites without
filopodial or lamellipodial activity in the presence of cy-
tochalasin B. J Cell Biol 99:2041–2047.
Mitchison T, Kirschner M. 1988. Cytoskeletal dynamics
and nerve growth. Neuron 1:761–772.
Myers KA, Tint I, Nadar CV, He Y, Black MM, Baas PW.
2006. Antagonistic forces generated by cytoplasmic
dynein and myosin-II during growth cone turning and
axonal retraction. Traffic 7:1333–1351.
O’Connor TP, Bentley D. 1993. Accumulation of actin in
subsets of pioneer growth cone filopodia in response to
neural and epithelial guidance cues in situ. J Cell Biol
123:935–948.
Rodriguez OC, Schaefer AW, Mandato CA, Forscher P,
Bement WM, Waterman-Storer CM. 2003. Conserved
microtubule-actin interactions in cell movement and
morphogenesis. Nat Cell Biol 5:599–609.
Sabry JH, O’Connor TP, Evans L, Toroian-Raymond A,
Kirschner M, Bentley D. 1991. Microtubule behavior
during guidance of pioneer neuron growth cones in situ. J
Cell Biol 115:381–395.
Salmon WC, Adams MC, Waterman-Storer CM. 2002.
Dual-wavelength fluorescent speckle microscopy reveals
coupling of microtubule and actin movements in migrat-
ing cells. J Cell Biol 158:31–37.
Schaefer AW, Kabir N, Forscher P. 2002. Filopodia and
actin arcs guide the assembly and transport of two popu-
lations of microtubules with unique dynamic parameters
in neuronal growth cones. J Cell Biol 158:139–152.
Suter DM, Errante LD, Belotserkovsky V, Forscher P.
1998. The Ig superfamily cell adhesion molecule,
apCAM, mediates growth cone steering by substrate-
cytoskeletal coupling. J Cell Biol 141:227–240.
Suter DM, Forscher P. 2000. Substrate-cytoskeletal cou-
pling as a mechanism for the regulation of growth cone
motility and guidance. J Neurobiol 44:97–113.
Suter DM, Forscher P. 2001. Transmission of growth cone
traction force through apCAM-cytoskeletal linkages is
regulated by Src family tyrosine kinase activity. J Cell
Biol 155:427–438.
Suter DM, Schaefer AW, Forscher P. 2004. Microtubule
dynamics are necessary for SRC family kinase-depend-
ent growth cone steering. Curr Biol 14:1194–1199.
Tanaka E, Kirschner MW. 1995. The role of microtubules
in growth cone turning at substrate boundaries. J Cell
Biol 128:127–137.
Tanaka E, Sabry J. 1995. Making the connection: Cytoske-
letal rearrangements during growth cone guidance. Cell
83:171–176.
1376 Lee and Suter
Developmental Neurobiology
Tanaka EM, Kirschner MW. 1991. Microtubule behavior in
the growth cones of living neurons during axon elonga-
tion. J Cell Biol 115:345–363.
Turney SG, Bridgman PC. 2005. Laminin stimulates and
guides axonal outgrowth via growth cone myosin II ac-
tivity. Nat Neurosci 8:717–719.
Walker RA, O’Brien ET, Pryer NK, Soboeiro MF, Voter
WA, Erickson HP, Salmon ED. 1988. Dynamic instabil-
ity of individual microtubules analyzed by video light
microscopy: Rate constants and transition frequencies. J
Cell Biol 107:1437–1448.
Waterman-Storer CM, Desai A, Bulinski JC, Salmon ED.
1998. Fluorescent speckle microscopy, a method to visu-
alize the dynamics of protein assemblies in living cells.
Curr Biol 8:1227–1230.
Waterman-Storer CM, Salmon ED. 1997. Actomyosin-
based retrograde flow of microtubules in the lamella of
migrating epithelial cells influences microtubule dynamic
instability and turnover and is associated with microtu-
bule breakage and treadmilling. J Cell Biol 139:417–434.
Williamson T, Gordon-Weeks PR, Schachner M, Taylor J.
1996. Microtubule reorganization is obligatory for growth
cone turning. Proc Natl Acad Sci USA 93: 15221–15226.
Yamada KM, Spooner BS, Wessells NK. 1970. Axon
growth: Roles of microfilaments and microtubules. Proc
Natl Acad Sci USA 66:1206–1212.
Zhang XF, Schaefer AW, Burnette DT, Schoonderwoert VT,
Forscher P. 2003. Rho-dependent contractile responses in
the neuronal growth cone are independent of classical pe-
ripheral retrograde actin flow. Neuron 40:931–944.
Zhou FQ, Cohan CS. 2004. How actin filaments and micro-
tubules steer growth cones to their targets. J Neurobiol
58:84–91.
Zhou FQ, Waterman-Storer CM, Cohan CS. 2002. Focal
loss of actin bundles causes microtubule redistribution
and growth cone turning. J Cell Biol 157:839–849.
Zhou FQ, Zhou J, Dedhar S, Wu YH, Snider WD. 2004.
NGF-induced axon growth is mediated by localized inac-
tivation of GSK-3b and functions of the microtubule plus
end binding protein APC. Neuron 42:897–912.
Microtubule Dynamics in Growth Cone Guidance 1377
Developmental Neurobiology