Embed Size (px)
Citation preview
This journal is c The Royal Society of Chemistry 2013 Mol. BioSyst., 2013, 9, 1627--1631 1627
Cite this: Mol. BioSyst.,2013,9, 1627
Quantifying the similarity of monotonic trajectories inrough and smooth fitness landscapes
Alexander E. Lobkovsky, Yuri I. Wolf and Eugene V. Koonin*
When selection is strong and mutations are rare, evolution can be thought of as an uphill trajectory in
a rugged fitness landscape. In this context the fitness landscape is a directed acyclic graph in which
nodes are genotypes and edges lead from lower to higher fitness genotypes that differ by a single
mutation. Because the space of genotypes is vastly multi-dimensional, classification of fitness landscapes
is challenging. Many proposed summary characteristics of fitness landscapes attempt to quantify
biologically relevant and intuitive notions such as roughness or peak accessibility in alternative ways.
Here we explore, in different types of landscapes, the behavior of the recently introduced mean path
divergence which quantifies the degree of similarity among evolutionary trajectories with the same
endpoints. We find that monotonic trajectories in empirical and model fitness landscapes are
significantly more constrained, with low median path divergence, than those in purely additive
landscapes. By contrast, transcription factor sequence specificity (aptamer binding affinity) landscapes
are markedly smoother and allow substantial variability in monotonic paths that can be greater than
that in fully additive landscapes. We propose that the smoothness of the specificity landscapes is a
consequence of the simple dependence of the transcription factor binding affinity on the aptamer
sequence in contrast to the complex sequence-fitness mapping in folding landscapes.
1 Introduction
The construct of the fitness landscape is useful in cases whenthe fitness of an organism depends only on its genotype andnot on the environment or population structure.1–4 The land-scape idea allows the separation of the population dynamiceffects such as clonal interference from the effect of geneticbackground on the fate of mutations.5–7 Even when the populationdynamics are complex, and the population contains a distributionof clones with different genotypes, evolution can still be envisionedas an ensemble of splitting and merging trajectories on the fitnesslandscape.8
Because fitness landscapes are vastly multi-dimensional,their characterization is difficult. A number of summary statisticshave been proposed to reflect the properties of landscapesrelevant to evolution.3,9–14 Here we apply the recently introducedmean path divergence metric to a number of landscapes ofradically different origins.8,15 Mean path divergence, defined indetail in the following section, quantifies the degree of similarity oftrajectories that share the starting and ending points. Computingmean path divergence requires that each trajectory have an
associated probability of occurrence within some populationdynamics on the landscape. The magnitude of path divergencereflects the expected distance between a randomly pickedtrajectory and the most probable trajectory, and can thereforebe used to assess the degree of evolutionary repeatability, or inother words, to quantify the difference in outcomes of twoevolutionary experiments performed under exactly the sameconditions.8,15
Here we employ mean path divergence to investigate thebehavior of evolutionary trajectories in several types of land-scapes where fitness is defined using substantially differentcriteria. The three classes of landscape exploit models of RNA16
or protein folding17 where fitness is defined as folding robust-ness or energy; mutational data where fitness correspondsdirectly to an organism’s growth rate18 or to enzyme specificityfor a particular substrate;19 and exhaustive data on aptamerbinding for a variety of transcription factors.20–23 We show thatwhile the folding landscapes exhibit low path divergence, or inother words, impose strong constraints on the trajectoriesavailable for evolution, binding specificity landscapes aresmooth, with substantially higher mean path divergence. Wehypothesize that the differences in path divergence reflectmajor differences in the complexity of the sequence-fitnessmapping.24–29
National Center for Biotechnology Information, National Institutes of Health,
Bethesda, MD 20894, USA. E-mail: [email protected]
Received 4th December 2012,Accepted 21st February 2013
DOI: 10.1039/c3mb25553k
www.rsc.org/molecularbiosystems
MolecularBioSystems
PAPER
Publ
ishe
d on
22
Febr
uary
201
3. D
ownl
oade
d by
Uni
vers
ity o
f C
onne
ctic
ut o
n 09
/10/
2013
21:
40:3
2.
View Article OnlineView Journal | View Issue
1628 Mol. BioSyst., 2013, 9, 1627--1631 This journal is c The Royal Society of Chemistry 2013
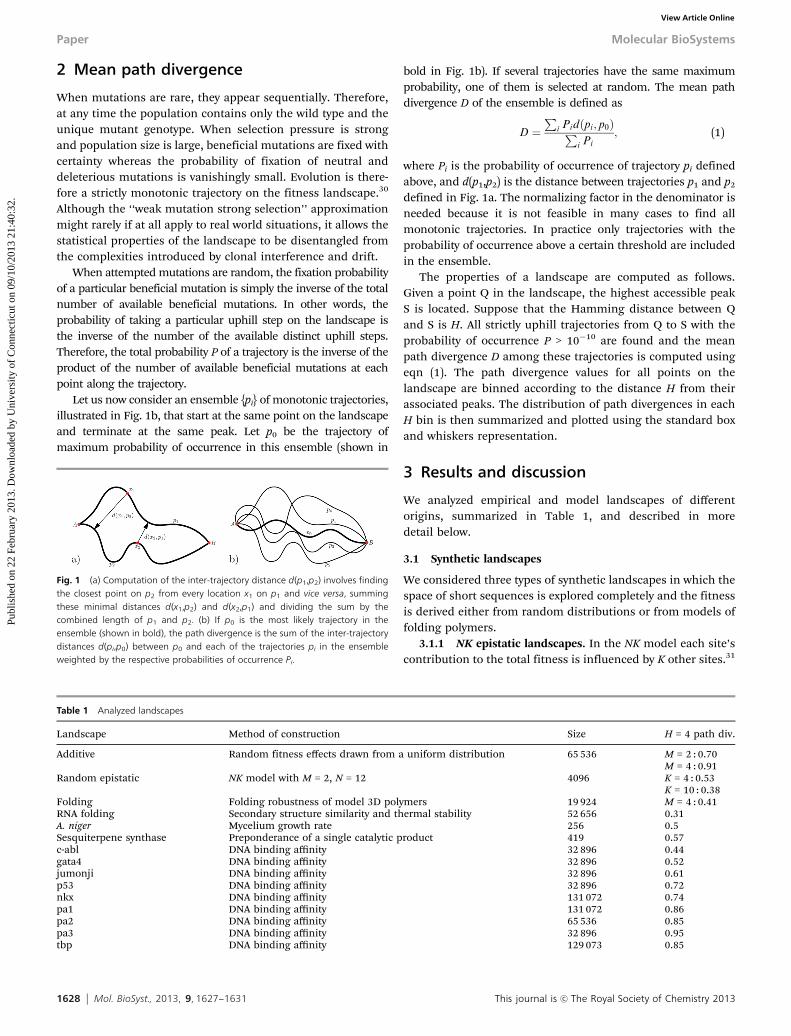
2 Mean path divergence
When mutations are rare, they appear sequentially. Therefore,at any time the population contains only the wild type and theunique mutant genotype. When selection pressure is strongand population size is large, beneficial mutations are fixed withcertainty whereas the probability of fixation of neutral anddeleterious mutations is vanishingly small. Evolution is there-fore a strictly monotonic trajectory on the fitness landscape.30
Although the ‘‘weak mutation strong selection’’ approximationmight rarely if at all apply to real world situations, it allows thestatistical properties of the landscape to be disentangled fromthe complexities introduced by clonal interference and drift.
When attempted mutations are random, the fixation probabilityof a particular beneficial mutation is simply the inverse of the totalnumber of available beneficial mutations. In other words, theprobability of taking a particular uphill step on the landscape isthe inverse of the number of the available distinct uphill steps.Therefore, the total probability P of a trajectory is the inverse of theproduct of the number of available beneficial mutations at eachpoint along the trajectory.
Let us now consider an ensemble {pi} of monotonic trajectories,illustrated in Fig. 1b, that start at the same point on the landscapeand terminate at the same peak. Let p0 be the trajectory ofmaximum probability of occurrence in this ensemble (shown in
bold in Fig. 1b). If several trajectories have the same maximumprobability, one of them is selected at random. The mean pathdivergence D of the ensemble is defined as
D ¼P
i Pid pi; p0ð ÞP
i Pi; (1)
where Pi is the probability of occurrence of trajectory pi definedabove, and d(p1,p2) is the distance between trajectories p1 and p2
defined in Fig. 1a. The normalizing factor in the denominator isneeded because it is not feasible in many cases to find allmonotonic trajectories. In practice only trajectories with theprobability of occurrence above a certain threshold are includedin the ensemble.
The properties of a landscape are computed as follows.Given a point Q in the landscape, the highest accessible peakS is located. Suppose that the Hamming distance between Qand S is H. All strictly uphill trajectories from Q to S with theprobability of occurrence P > 10�10 are found and the meanpath divergence D among these trajectories is computed usingeqn (1). The path divergence values for all points on thelandscape are binned according to the distance H from theirassociated peaks. The distribution of path divergences in eachH bin is then summarized and plotted using the standard boxand whiskers representation.
3 Results and discussion
We analyzed empirical and model landscapes of differentorigins, summarized in Table 1, and described in moredetail below.
3.1 Synthetic landscapes
We considered three types of synthetic landscapes in which thespace of short sequences is explored completely and the fitnessis derived either from random distributions or from models offolding polymers.
3.1.1 NK epistatic landscapes. In the NK model each site’scontribution to the total fitness is influenced by K other sites.31
Fig. 1 (a) Computation of the inter-trajectory distance d(p1,p2) involves findingthe closest point on p2 from every location x1 on p1 and vice versa, summingthese minimal distances d(x1,p2) and d(x2,p1) and dividing the sum by thecombined length of p1 and p2. (b) If p0 is the most likely trajectory in theensemble (shown in bold), the path divergence is the sum of the inter-trajectorydistances d(pi,p0) between p0 and each of the trajectories pi in the ensembleweighted by the respective probabilities of occurrence Pi.
Table 1 Analyzed landscapes
Landscape Method of construction Size H = 4 path div.
Additive Random fitness effects drawn from a uniform distribution 65 536 M = 2 : 0.70M = 4 : 0.91
Random epistatic NK model with M = 2, N = 12 4096 K = 4 : 0.53K = 10 : 0.38
Folding Folding robustness of model 3D polymers 19 924 M = 4 : 0.41RNA folding Secondary structure similarity and thermal stability 52 656 0.31A. niger Mycelium growth rate 256 0.5Sesquiterpene synthase Preponderance of a single catalytic product 419 0.57c-abl DNA binding affinity 32 896 0.44gata4 DNA binding affinity 32 896 0.52jumonji DNA binding affinity 32 896 0.61p53 DNA binding affinity 32 896 0.72nkx DNA binding affinity 131 072 0.74pa1 DNA binding affinity 131 072 0.86pa2 DNA binding affinity 65 536 0.85pa3 DNA binding affinity 32 896 0.95tbp DNA binding affinity 129 073 0.85
Paper Molecular BioSystems
Publ
ishe
d on
22
Febr
uary
201
3. D
ownl
oade
d by
Uni
vers
ity o
f C
onne
ctic
ut o
n 09
/10/
2013
21:
40:3
2.
View Article Online
This journal is c The Royal Society of Chemistry 2013 Mol. BioSyst., 2013, 9, 1627--1631 1629
The purely additive landscape is the K = 0 special case of the NKfamily of landscapes. An uncorrelated landscape in which thefitness of every point is drawn from the same distributionindependently is obtained when K = N � 1. We consideredbinary NK landscapes (i.e. the alphabet size of M = 2) with N =12 and a range of K. Because the properties of landscapes coulddepend on a particular realization of the random fitness effects,we averaged our findings over 100 instances of the landscapefor each value of K.
3.1.2 Additive landscapes. Additive landscapes are a specialcase of the NK landscapes in the absence of epistasis, i.e. whenthe every substitution in the most fit sequence has a fixedadditive negative fitness effect. When only a single type ofsubstitution is allowed in each site, i.e. when the alphabet sizeis M = 2, all trajectories that do not include back mutations aremonotonic in fitness. In other words, if a mutant is differentfrom the most fit sequence by substitutions at H sites, themutations which restore the most fit sequence can occur inany order and increase fitness at every step. Because for M = 2back mutations always decrease fitness, there are H uphilldirections at each point on the landscape. Thus, there are alwaysexactly H! uphill trajectories and the mean path divergence is afunction of only H. When the number of allowed substitutions isM > 2, the situation is different. The number of available uphillsteps depends on the fitness effects, and therefore the number ofuphill trajectories and the mean path divergences fluctuateamong points at the same distance from the peak. We analyzethe case of alphabet size M = 4 and sequence length N = 8numerically in the same way as the empirical and other modellandscapes.
3.1.3 RNA folding landscapes. Landscapes with fitnessvalues derived from the prediction of RNA secondary structureshave been used extensively to probe evolutionary questions.16,32,33
We follow Cowperthwaite et al.16 and use the Vienna packageversion 1.8.4 (ref. 34) to examine the secondary structures of allRNA sequences of N = 12 nucleotides. The most stable structure ischosen as the target. The fitness of any sequence is derived from theHamming distance H between the parenthesis representations of itspredicted structure and the target structure. Because the space ofRNA secondary structures is highly degenerate, we resolve thelandscape further by using the DG value and assigning higherfitness to sequences with lower DG if they share secondary structure.Roughly 20% of sequences with trivial predicted secondary structure(unfolded) were excluded from the landscape.
3.1.4 Folding robustness landscapes. We have previouslyintroduced landscapes derived from the folding robustness ofoff-lattice 3D ‘‘protein-like’’ model heteropolymers.15,17 Thefitness of a sequence was defined as the probability of foldingto a target structure. The folding polymers were modeled asflexible, length N = 25, chains of monomers of 4 types interactingvia the Lennard-Jones and screened Coulomb potentials. Foldingprobabilities were computed by considering the configurationspace overlap of the fluctuating conformation of the querysequence with that of the target structure. The landscapesincluded all sequences with non-zero folding probabilitiesthat had a neighbor with a folding probability above a certain
threshold. This analysis includes a single representative targetstructure landscape but the results of our previous work indicatethat other structures produced statistically similar landscapes.
3.2 Empirical landscapes
We consider empirical landscapes that can be abstracted fromexperimental data in which the fitness value is measured indifferent ways.
3.2.1 Sesquiterpene synthase specificity. O’Maille et al.found that the primary product of the catalytic activity of afamily of sesquiterpene synthase enzymes could be switched viaa set of 8 amino-acid substitutions.19 When a subset of the 8substitutions were present, several reaction products wereproduced in varying proportions. We computed the enzymespecificity, i.e. a measure of the dominance of one product overthe others as the fitness value.15
3.2.2 Aspergillus niger growth rate. Franke et al.18 measuredthe mycelium growth rate of a library of A. niger mutants withcombinations of up to 8 phenotypic marker mutation. Thefitness value in this landscape is the measured growth rate.
3.2.3 Aptamer binding. High-throughput microarrayexperiments can interrogate the entire sequence space of 8 to10 nucleotide aptamers that interact with a DNA-bindingmolecule.23 The resulting sequence specificity landscapes(SSL) are large and dense. The fitness value is the bindingaffinity of a transcription factor to the DNA sequence motif. Weobtained and analyzed complete SSL’s23 for a number of DNAbinding proteins: c-abl, gata4, jumonji, nkx-2.5, p53, pa-1, pa-2,pa-3, and tbp (private communication, A. Z. Ansari).
4 Mean path divergence in different classesof landscapes
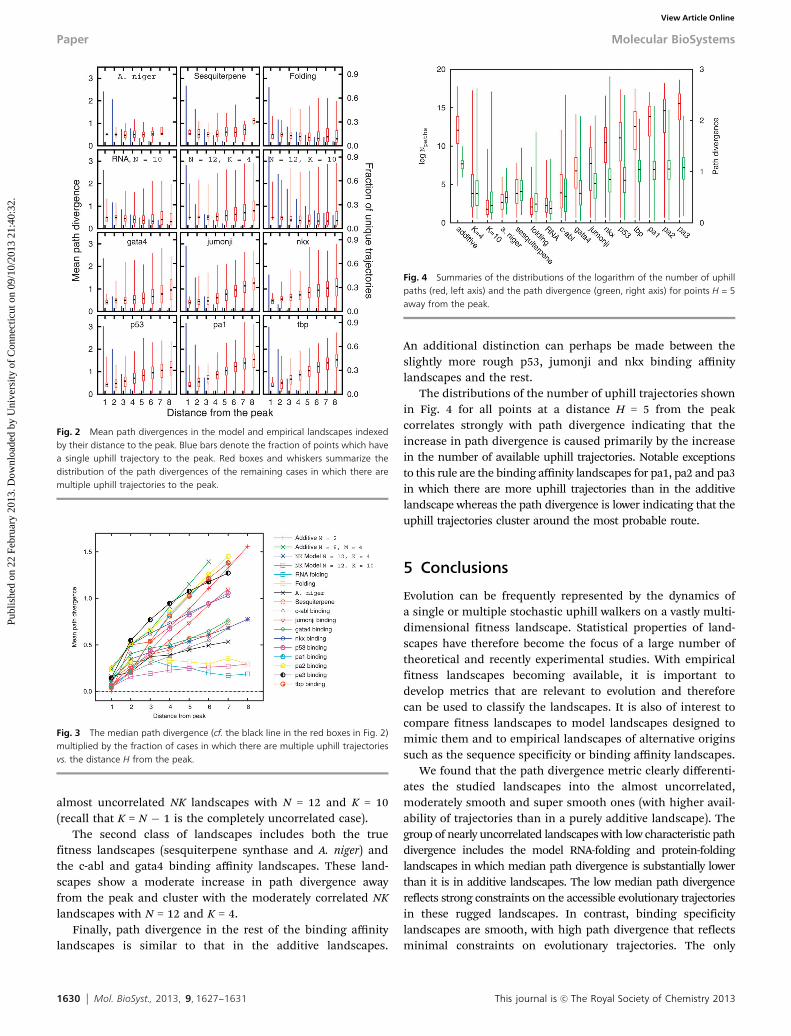
Fig. 2 shows the distributions of path divergences in mostof the analyzed landscapes as a function of the distance fromthe peak. There is a clear difference between the true fitnesslandscapes and the binding affinity landscapes, the latter beingmarkedly smoother with substantially larger path divergences.Note that there are points at a distance H = 1 from the peak withmultiple uphill trajectories to the peak. These trajectoriesnecessarily contain reverse mutations.
Fig. 3 shows the dependence of the path divergence on thedistance H from the peak. We compute the median pathdivergence among all points that are at a distance H from thepeak and have more than one trajectory to the peak. To accountfor the cases in which there is a unique trajectory to the peak wemultiply the median path divergence among the points withmore than one trajectory by the fraction of points with morethan one trajectory.
Path divergence partitions the landscapes we consideredhere into roughly three classes. Path divergence in foldinglandscapes, including the model polymer and RNA landscapes,exhibits a roughly flat dependence on the distance from thepeak. By this measure, the folding landscapes appear similar to
Molecular BioSystems Paper
Publ
ishe
d on
22
Febr
uary
201
3. D
ownl
oade
d by
Uni
vers
ity o
f C
onne
ctic
ut o
n 09
/10/
2013
21:
40:3
2.
View Article Online
1630 Mol. BioSyst., 2013, 9, 1627--1631 This journal is c The Royal Society of Chemistry 2013
almost uncorrelated NK landscapes with N = 12 and K = 10(recall that K = N � 1 is the completely uncorrelated case).
The second class of landscapes includes both the truefitness landscapes (sesquiterpene synthase and A. niger) andthe c-abl and gata4 binding affinity landscapes. These land-scapes show a moderate increase in path divergence awayfrom the peak and cluster with the moderately correlated NKlandscapes with N = 12 and K = 4.
Finally, path divergence in the rest of the binding affinitylandscapes is similar to that in the additive landscapes.
An additional distinction can perhaps be made between theslightly more rough p53, jumonji and nkx binding affinitylandscapes and the rest.
The distributions of the number of uphill trajectories shownin Fig. 4 for all points at a distance H = 5 from the peakcorrelates strongly with path divergence indicating that theincrease in path divergence is caused primarily by the increasein the number of available uphill trajectories. Notable exceptionsto this rule are the binding affinity landscapes for pa1, pa2 and pa3in which there are more uphill trajectories than in the additivelandscape whereas the path divergence is lower indicating that theuphill trajectories cluster around the most probable route.
5 Conclusions
Evolution can be frequently represented by the dynamics ofa single or multiple stochastic uphill walkers on a vastly multi-dimensional fitness landscape. Statistical properties of land-scapes have therefore become the focus of a large number oftheoretical and recently experimental studies. With empiricalfitness landscapes becoming available, it is important todevelop metrics that are relevant to evolution and thereforecan be used to classify the landscapes. It is also of interest tocompare fitness landscapes to model landscapes designed tomimic them and to empirical landscapes of alternative originssuch as the sequence specificity or binding affinity landscapes.
We found that the path divergence metric clearly differenti-ates the studied landscapes into the almost uncorrelated,moderately smooth and super smooth ones (with higher avail-ability of trajectories than in a purely additive landscape). Thegroup of nearly uncorrelated landscapes with low characteristic pathdivergence includes the model RNA-folding and protein-foldinglandscapes in which median path divergence is substantially lowerthan it is in additive landscapes. The low median path divergencereflects strong constraints on the accessible evolutionary trajectoriesin these rugged landscapes. In contrast, binding specificitylandscapes are smooth, with high path divergence that reflectsminimal constraints on evolutionary trajectories. The only
Fig. 2 Mean path divergences in the model and empirical landscapes indexedby their distance to the peak. Blue bars denote the fraction of points which havea single uphill trajectory to the peak. Red boxes and whiskers summarize thedistribution of the path divergences of the remaining cases in which there aremultiple uphill trajectories to the peak.
Fig. 3 The median path divergence (cf. the black line in the red boxes in Fig. 2)multiplied by the fraction of cases in which there are multiple uphill trajectoriesvs. the distance H from the peak.
Fig. 4 Summaries of the distributions of the logarithm of the number of uphillpaths (red, left axis) and the path divergence (green, right axis) for points H = 5away from the peak.
Paper Molecular BioSystems
Publ
ishe
d on
22
Febr
uary
201
3. D
ownl
oade
d by
Uni
vers
ity o
f C
onne
ctic
ut o
n 09
/10/
2013
21:
40:3
2.
View Article Online
This journal is c The Royal Society of Chemistry 2013 Mol. BioSyst., 2013, 9, 1627--1631 1631
‘‘true’’ fitness landscapes that we had an opportunity to study,that derived from the A. niger growth data, and the enzymecatalytic specificity, showed intermediate properties. We surmisethat the simple, effectively additive dependence of the transcrip-tion factor-binding affinity on the distance of an aptamersequence from the consensus binding sequence translates intomultiple monotonic paths toward the ‘‘fitness peak’’. In contrast,the complex processes of protein and RNA folding, even in theirmodel incarnations, allow few monotonic paths, hence low pathdivergence and in the extreme nearly deterministic evolution.Put another way, the binding affinity landscapes are simple withrespect to the sequence-fitness (phenotype) mapping whereasthe folding landscapes are complex. It is less clear why theempirical fitness landscapes yield intermediate values of pathdivergence because generally one would expect complex map-ping of sequence to phenotype in these cases as well. We suspectthat because the available data cover only a tiny fraction of theselandscapes, it is insufficient to obtain robust characteristics ofthe landscape as a whole. Comprehensive analysis of informa-tion-rich landscapes using these and other formal measurescould provide insights into the relationship between determin-ism and randomness in evolution.
Acknowledgements
The authors’ research is supported by the intramural funds ofthe DHHS (National Institutes of Health, National Library ofMedicine). The authors wish to thank Dr Devesh Bhimsaria andProf. Aseem Ansari for providing the DNA aptamer binding data.
References
1 J. M. Smith, Nature, 1970, 225, 563–564.2 M. Kogenaru, M. G. de Vos and S. J. Tans, Crit. Rev. Biochem.
Mol. Biol., 2009, 44, 169–174.3 M. Carneiro and D. L. Hartl, Proc. Natl. Acad. Sci. U. S. A.,
2010, 107(suppl 1), 1747–1751.4 P. Schuster, Theory Biosci., 2011, 130, 71–89.5 M. M. Desai, D. S. Fisher and A. W. Murray, Curr. Biol., 2007,
17, 385–394.6 K. C. Kao and G. Sherlock, Nat. Genet., 2008, 40, 1499–1504.7 C. R. Miller, P. Joyce and H. A. Wichman, Genetics, 2011,
187, 185–202.8 A. E. Lobkovsky and E. V. Koonin, Front. Genet., 2012, 3,
246.9 T. Aita, H. Uchiyama, T. Inaoka, M. Nakajima, T. Kokubo
and Y. Husimi, Biopolymers, 2000, 54, 64–79.10 T. Smith, P. Husbands, P. Layzell and M. O’Shea, Evol.
Comput., 2002, 10, 1–34.
11 D. M. Weinreich, R. A. Watson and L. Chao, Evolution, 2005,59, 1165–1174.
12 T. Aita, J. Theor. Biol., 2008, 254, 252–263.13 S. Kryazhimskiy, G. Tkacik and J. B. Plotkin, Proc. Natl. Acad.
Sci. U. S. A., 2009, 106, 18638–18643.14 W. Rowe, D. C. Wedge, M. Platt, D. B. Kell and J. Knowles,
Bioinformatics, 2010, 26, 2145–2152.15 A. E. Lobkovsky, Y. I. Wolf and E. V. Koonin, PLoS Comput.
Biol., 2011, 7, e1002302.16 M. C. Cowperthwaite, E. P. Economo, W. R. Harcombe, E. L.
Miller and L. A. Meyers, PLoS Comput. Biol., 2008, 4, e1000110.17 A. E. Lobkovsky, Y. I. Wolf and E. V. Koonin, Proc. Natl. Acad.
Sci. U. S. A., 2010, 107, 2983–2988.18 J. Franke, A. Klozer, J. A. de Visser and J. Krug, PLoS Comput.
Biol., 2011, 7, e1002134.19 P. E. O’Maille, A. Malone, N. Dellas, B. Andes Hess Jr,
L. Smentek, I. Sheehan, B. T. Greenhagen, J. Chappell,G. Manning and J. P. Noel, Nat. Chem. Biol., 2008, 4, 617–623.
20 C. L. Warren, N. C. Kratochvil, K. E. Hauschild, S. Foister,M. L. Brezinski, P. B. Dervan, G. N. Phillips Jr andA. Z. Ansari, Proc. Natl. Acad. Sci. U. S. A., 2006, 103, 867–872.
21 C. G. Knight, M. Platt, W. Rowe, D. C. Wedge, F. Khan,P. J. R. Day, A. McShea, J. Knowles and D. B. Kell, NucleicAcids Res., 2009, 37, e6.
22 W. Rowe, M. Platt, D. C. Wedge, P. J. Day, D. B. Kell andJ. Knowles, J. R. Soc., Interface, 2010, 7, 397–408.
23 C. D. Carlson, C. L. Warren, K. E. Hauschild, M. S. Ozers,N. Qadir, D. Bhimsaria, Y. Lee, F. Cerrina and A. Z. Ansari,Proc. Natl. Acad. Sci. U. S. A., 2010, 107, 4544–4549.
24 C. B. Anfinsen, Science, 1973, 181, 223–230.25 K. A. Dill, Biochemistry, 1990, 29, 7133–7155.26 J. D. Bryngelson, J. N. Onuchic, N. D. Socci and
P. G. Wolynes, Proteins, 1995, 21, 167–195.27 B. Dubertret, S. Liu, Q. Ouyang and A. Libchaber, Phys. Rev.
Lett., 2001, 86, 6022–6025.28 C. G. Kalodimos, N. Biris, A. M. Bonvin, M. M. Levandoski,
M. Guennuegues, R. Boelens and R. Kaptein, Science, 2004,305, 386–389.
29 D. U. Ferreiro, I. E. Sanchez and G. de Prat Gay, Proc. Natl.Acad. Sci. U. S. A., 2008, 105, 10797–10802.
30 D. M. Weinreich, N. F. Delaney, M. A. Depristo andD. L. Hartl, Science, 2006, 312, 111–114.
31 S. Kauffman and S. Levin, J. Theor. Biol., 1987, 128, 11–45.32 L. A. Meyers, J. F. Lee, M. Cowperthwaite and
A. D. Ellington, J. Mol. Evol., 2004, 58, 681–691.33 M. C. Cowperthwaite, J. J. Bull and L. A. Meyers, Genetics,
2005, 170, 1449–1457.34 P. Schuster, W. Fontana, P. F. Stadler and I. L. Hofacker,
Proc. Biol. Sci., 1994, 255, 279–284.
Molecular BioSystems Paper
Publ
ishe
d on
22
Febr
uary
201
3. D
ownl
oade
d by
Uni
vers
ity o
f C
onne
ctic
ut o
n 09
/10/
2013
21:
40:3
2.
View Article Online