Embed Size (px)
Citation preview
Library Progress (International) Vol.39 No.1, 2019: P.163-176 DOI: 10.5958/2320-317X.2019.00017.5
Print version ISSN 0970 1052 Online version ISSN 2320 317X
Original Article Available online at www.bpasjournals.com
*Corresponding Author: Dr. A. Bagavathi, University Assistant Librarian, The Tamil Nadu Dr Ambedkar Law University, Chennai, Tamil Nadu 600 113, India
E-mail: [email protected]
Quantifying the Research Studies of Botanical Survey of India (BSI) Since 1954
Dr. A. Bagavathi1*, Dr. M.E. Kalyani2
Author’s Affiliation: 1University Assistant Librarian, The Tamil Nadu Dr Ambedkar Law University, Chennai,
Tamil Nadu 600 113, India E-mail: [email protected] 2Assistant Librarian, Tiruvorur University, Neelakudy, Tamil Nadu 610005, India E-mail: [email protected]
Received on 11.02.2019, Accepted on 20.04.2019
1. Introduction
The Indian research works were typically under explored in the citation databases especially a period of sixty years back were indeterminate. Particularly, the research works of national importance like
history, floras, exploration of regional plant wealth etc. will have more significance in the concerned geographical region but in long run and their applications were universally acclaimed. In this regard,
documenting the research works in the form of Institutional Repositories and applying the metric on those works those were mostly scattered in the regional journals of internationally acknowledge. As
far as systematic botany of India, Botanical Survey of India (BSI) is the pioneer institution having more than 60 years of research experience in the preliminary stage of developing Institutional
Repositories. In the typical environment, where there is no predominant full text online database nor
citation indexes available for the research work, it is indeed to have a work concentrates on the development of the digital form of the research publications of Botanical Survey of India especially
Abstract
Conventional form of examining the research growth of the institution is the application of
metric analysis on their published works. This paper is the consequence of the study carried out on the research publications of Botanical Survey of India, a Research Institute on Indian
plant taxonomical works. The significance in terms of the relative growth rate, attained by the Institute was provided with graphical representation. The subject wise research production
and area need to be strengthened by the institute were emphasized. Comparative study of the
regional centers of BSI with that of their headquarters to reveal their contribution status was attained.
Keywords: Bibliometrics, Bibliographic studies, Publication analysis, Publication Growth Rate,
Metric studies etc.,
Dr. A. Bagavathi & Dr. M.E. Kalyani / Quantifying the Research Studies of Botanical Survey of India (BSI) Since 1954
164 Library Progress (International)/ Vol.39 No.1/ January-June 2019 DOI: 10.5958/2320-317X.2019.00017.5
Southern Regional Centre, BSI and extensive bibliometric analysis of the developed database with
that of entire research yield of Botanical Survey of India covering all regional centres irrespective of the limitations aroused out of the available electronic databases. To articulate the goal of assessing the
research institutions’ performance since its inception, to enunciate its contribution in the field concerned using bibliometric tools and its various parameters were performed.
Definition – Bibliometrics: Pritchard (1969) [1] had described Bibliometrics as “the application of
statistical and mathematical methods to books and other media of communication”. Bibliometric analysis is the quantitative assessment of the publications. A brief note of Botanical Survey of India
Botanical Survey of India is a research institution of Government of India working under the Ministry of Environment, Forests and Climate Change. The headquarters of the organization is in Kolkata with
a publication division of bringing out the research publications of the institute. Botanical Survey of India (BSI) is the pioneer central organization for pooling the available plant resources of India. Apart
from acting as the custodian of the country’s floral wealth it actively engaged in plant taxonomy, systematic botany and conservation of the floral wealth. It coordinates the research activities of the
country with the world research community in the field of plant taxonomy and systematic botany. The exploration of the plant wealth, detailed study of plant resources, up keeping of the documented
plant collections, evaluation of the ecological impact of changes in the landscape due to development,
creating awareness about role of plants in our life and conservation of the flora are all the important tasks of the BSI. Centers of Botanical Survey of India
BSI has 10 well established centres, each of those centre has their own jurisdiction to cover the entire territory of the country. In the Head Quarters of BSI is at Kolkata having the country’s largest
herbarium called Central National Herbarium (BSICNH-HQ), which covers West Bengal, Bihar, Orissa and Jharkhand area of India.
Andaman and Nicobar regional centre covers the Islands (BSIANRC), Arid Zone regional centre
covers the stated Rajasthan and Gujarat (BSIARID). The Arunachal Pradesh Regional Centre (BSIAPRC) covers the Arunachal Pradesh. The jurisdiction that comes under the Central Regional Centre (BSICRC) is Madhya Pradesh, Chattisgarh and Uttar Pradesh. Assam, Manipur, Meghalaya,
Mizoram, Nagaland and Tripura are covered by Eastern Regional Centre (BSIERC). The Northern Regional Centre (BSINRC) covers the Himachal Pradesh, Uttaranchal, Jammu & Kashmir, Punjab,
Haryana, Chandigarh, and Delhi. The territory of Sikkim Himalayan Regional Centre (BSISHRC) covers Sikkim, Darjeeling Gorkha Hill Council. The jurisdiction coming under the Southern Regional
Centre (BSISRC) is Tamil Nadu, Kerala, erstwhile Andhra Pradesh, Lakshadweep and Minicoy Islands. The states Maharashtra, Goa, Karnataka, Dadra, Nagar Haveli and Daman Diu were covered
by Western Regional Centre (BSIWRC).
2. Need and Scope of this Study
The Scientist of BSI expressed their opinion that the research contributions of disadvantaged subject
fields like plant taxonomy were not comprehensively covered in the international citation databases. These kinds of hot disputes paved the way to develop the institutional repository and revealed the
contribution status of different regional centres of BSI. With this intention, the following scopes were attained.
To develop a database constituting all forms of published research works say proceedings, books,
chapters of the edited book, research articles etc., of BSI.
To assess the research performance of the BSI, using the Bibliometric analysis on the database
developed. It helps to throw light on the strength and weakness of the research activity of the institution under concern. 3. Objectives
Dr. A. Bagavathi & Dr. M.E. Kalyani / Quantifying the Research Studies of Botanical Survey of India (BSI) Since 1954
165 Library Progress (International)/ Vol.39 No.1/ January-June 2019 DOI: 10.5958/2320-317X.2019.00017.5
The objectives of this study are:
1. To perform the Bibliometric analysis on the source database developed for institutional repository.
2. To examine the publication growth rate of the contribution of BSI. 3. To study the centre wise research contribution of BSI
4. To reveal the subject facet wise contribution of the BSI using trend analysis. 5. To scrutinize the bibliographic form of the research contribution. 4. Hypotheses
The research study has been conducted with the following hypotheses
1. The research publication of the BSI have attained a saturation point and now facing a decline. 2. The production during the 1980-1990 reflects the high caliber of research.
3. Journal is playing a major role in disseminating the research contribution of BSI. 5. Methodology
This research work was purely depended on manual method of collecting data for pursuing the
meticulous scientometric analysis. As the works on Indian systematic botany developed by BSI were not comprehensively covered by any of the available bibliographical databases, it necessitates relying
on the annual reports, project reports, progress reports etc developed by the institute for the data collection.
Thus produced data were stored in the MS Excel Sheet and used for the publication analyses after
making necessary data normalization. The research period covers from 1954 - 2012 (59 years). Using
pivot table module of MS Excel the analysis was conducted and charts were prepared. 6. Review of Literature
The related researches were consulted to acquire the necessary ideas for conducting the bibliometric studies. Thus, yield review of literatures on bibliometrics and scientometrics was categorized into
three broad divisions. They are Bibliometric/Scientometric studies on Individual Journals, on Subject Field, on Institutional evaluation.
The study of Bhardwaj (2016) [2] had covered a scientometric analysis of publications on Ebola Virus
worldwide. It emphasized that 157 journals produced the Ebola virus research and “Journal of Virology” has published 257 (10.5%) of the papers. In addition, the world over 160 institutions
contributed in Ebola virus research, and National Center for Infectious Diseases has recorded highest
relative citation impact.
Vieira and Lepori (2016) [3] investigated the growth of the European Higher Education Institutions (HEI), as measured by the number of academic staff, and its association with HEI and country
attributes. They analyzed using a sample of 837 HEIs from 18 countries for the year 2008 – 2012. The study enabled to understand the extent to which cumulative effects leads to a lasting concentration of
resources in the HE system and whether public policies were able to redistribute resources based on merit.
A bibliometric analysis of Life Cycle Assessment (LCA) related research literature was reported by
Hou et al. (2015) [4]. A total of 6616 records were obtained from the online databases and revealed the
following: journal articles are the most frequently used document type representing 74.33% (4918) of the records, English is the dominant language with 5914 records (97.53%), Technology University of
Denmark is the most productive institute all over the world and concluded that the climate change is one of the most outstanding environmental issues. Jung, Kim, So and Kim (2015) [5] explored the statistical relationships exists between journal use and
research output at South Korean Academic Institutions by performing comparative and diachronic
Dr. A. Bagavathi & Dr. M.E. Kalyani / Quantifying the Research Studies of Botanical Survey of India (BSI) Since 1954
166 Library Progress (International)/ Vol.39 No.1/ January-June 2019 DOI: 10.5958/2320-317X.2019.00017.5
analyses, as well as the analysis by field. It was revealed that e-journal use exhibited stronger
correlations with the number of publications and the times cited. Finally, it was confirmed that the association of e- journal use with the two quantitative research indicators was strongly positive with
that of research contributions of the institutions
Guan and Wei (2015) [6] compared the scientific research performance of two institutions namely National Center for Nanoscience and Technology (NCNST) from China and University of California
Los Angeles-California Nanosystems Institute (CNSI) from the USA. The analysis showed that NCNST has many advantages in regards to author and paper quantities, growth rate and the strength
of collaboration networks of dominance with respect to research quantity.
Stork and Astrin (2014) [7] applied bibliometric methods to evaluate research efforts in the field of biodiversity. They retrieved 69,000 records from the Web of Science database using the word
biodiversity. They inferred that the community level focus has increased in biodiversity studies, while
molecular biodiversity is still not strongly represented. Also, revealed that the Climate related topics are rapidly gaining importance in biodiversity research. Pathak and Bharati (2014) [8] reported the research performance of the Botanical Survey of India
(BSI) between 1971 and 2010 using the data drawn from Web of Science (SCI-Expanded). A total of 423 papers were published in 40 years (10.57 papers per year), which received 892 citations with an
average of 2.1 citations per paper, h-index of 12 and a p-index of 12.34. Between 1987 and 2005, a long recession was observed; again it is on rise from 2006 onwards, the citations were following almost the
same trend. A bibliometric study on second-generation antipsychotic drugs’ (SGA) publications in
Japan for a period of 1982 – 2011 was performed on the MEDLINE and EMBASE databases (Lopez-
Muñoz et al., 2013) [9]. A sum of 669 original documents was published during the period under study. The results revealed the following, that the scientific production on SGAs showing exponential
growth (correlation coefficient r = 0.9261, as against an r = 0.8709 after linear adjustment) thus, fulfilled the Price’s law. The most studied SGAs in Japan were risperidone (n = 192), aripiprazole (n =
109), and olanzapine (n = 106). Division of documents into Bradford zones yielded a nucleus occupied exclusively by the Progress in Neuro- Psychopharmacology and Biological Psychiatry (49 articles).
Those publications were in 157 different journals. Seven of the first 10 frequently used journals had an impact factor of being greater than 3. Pagel and Hudetz (2013) [10] scrutinized the Journal of Cardiothoracic and Vascular Anesthesia
(JCVA) at selected time intervals 1990 - 2011 to quantify temporal variations in geographic
publication patterns. For which, the research articles, case reports and conferences, review articles, and letters in each issue of the journal were quantified in each of 4 time intervals consisting of
consecutive 4-years period (1990-1993, 1996-1999, 2002-2005, and 2008-2011). Forty-three countries published a total of 2,587 articles (ie, 1,141 research articles, 735 case reports, 175 review articles, and
536 letters) during the 4 time periods examined. The results revealed that JCVA has evolved into a truly international journal since its inception in 1987. Regolini and Jannes-Ober (2013) [11] have performed a bibliometric study of first generation
citations from the journal Informing Science (IS). The study demonstrated the high degree of trans disciplinarity of Informing Science. It was also confirmed that after more than a decade the Informing
Science Institute continues to bring together researchers working in IS from many disciplines and
nations.
Sethi and Panda (2012) [12] explored the publication trends of scholarly journal articles in two core Library and Information Science (LIS) journals indexed under Science Direct Database for the period
2000-2010. It examined and presented an analysis of 1000 research papers in the area of LIS published in two journals: The International Information & Library Review (IILR) and Library & Information Science Research (LISR). Some of the key findings of the study that deserved as follows: corpus under study showed collaborative work (0.57) amongst articles published in LISR, more so than articles
published in IILR (0.41).
Dr. A. Bagavathi & Dr. M.E. Kalyani / Quantifying the Research Studies of Botanical Survey of India (BSI) Since 1954
167 Library Progress (International)/ Vol.39 No.1/ January-June 2019 DOI: 10.5958/2320-317X.2019.00017.5
The bibliometric study of Journal of Intellectual Property Rights was conducted by Swain and Panda (2012) [13] with a total of 332 articles carrying 1,541 journal citations during the study period 2002 –
2010. The number of articles published in JIPR on an average per year had consistently witnessed an up and down trend during the period of 2002-2010. The top five countries that contributed maximum
articles to JIPR were India, USA, UK, China, and Switzerland. Maximum Indian contributions to JIPR were hailed from Delhi, followed by West Bengal and Karnataka. The estimated half-life of journals
was found to be 8 years. Further, the average number of citations against all published articles was found to be 0.66 per article.
Inferences on the Literature Review The review of literature helped to identify the possible variables like the coverage of the subject in
terms of the facet distribution, country wise production, and productive authors, journals, institutions etc. The earlier metric studies were concentrated on the research related to publication production,
but in recent times it involved in the impact evaluation centered Scientometric studies which results in rigorous citation analysis. Further the review reveals that no research has been carried out on the
entire literature output of Botanical Survey of India since its inception. Hence, this study bridges the gap.
7. Data Analysis
The publication growth the research contribution of BSI was discussed in block year, centre wise
impact on the research publications, subject wise distribution, source wise distribution and the
ranking of the journal were analysed in the Data analysis section. The collected data were analyzed to find out meaningful findings of the study by using the following statistical methods:
Relative Growth Rate (RGR) prevailed among the corpus.
Trend Analysis on the subject facets prevailed among the research contribution of BSI. 1. Publication Growth over the Research Period
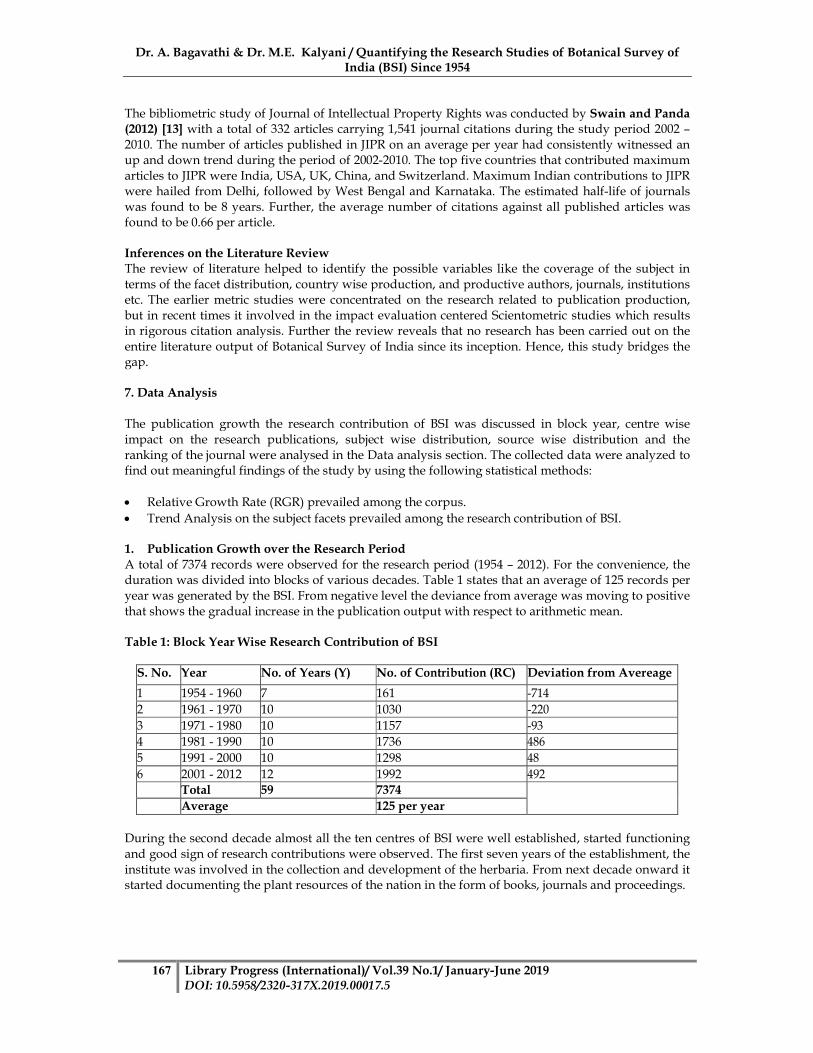
A total of 7374 records were observed for the research period (1954 – 2012). For the convenience, the duration was divided into blocks of various decades. Table 1 states that an average of 125 records per
year was generated by the BSI. From negative level the deviance from average was moving to positive
that shows the gradual increase in the publication output with respect to arithmetic mean. Table 1: Block Year Wise Research Contribution of BSI
S. No. Year No. of Years (Y) No. of Contribution (RC) Deviation from Avereage
1 1954 - 1960 7 161 -714
2 1961 - 1970 10 1030 -220
3 1971 - 1980 10 1157 -93
4 1981 - 1990 10 1736 486
5 1991 - 2000 10 1298 48
6 2001 - 2012 12 1992 492
Total 59 7374
Average 125 per year
During the second decade almost all the ten centres of BSI were well established, started functioning
and good sign of research contributions were observed. The first seven years of the establishment, the
institute was involved in the collection and development of the herbaria. From next decade onward it started documenting the plant resources of the nation in the form of books, journals and proceedings.
Dr. A. Bagavathi & Dr. M.E. Kalyani / Quantifying the Research Studies of Botanical Survey of India (BSI) Since 1954
168 Library Progress (International)/ Vol.39 No.1/ January-June 2019 DOI: 10.5958/2320-317X.2019.00017.5
Figure 1: Block Year Wise Research Contribution of BSI.
The institute had obtained recognition from the Universities to conduct research leading to doctoral
awards at the end of third block. Since then, a positive sign was seen from 1981 to till recent; it shows that the contribution of the Botanical Survey of India is ever increasing but the block period 1991 –
2000 shows that the research publication was in average margin (Figure 1). 2. Relative Growth Rate (RGR)
The Relative Growth rate of BSI Publications over the time period of 59 was calculated using the
calculation formula formulized by Mahapatra (1985)14 for the analysis of publication growth
��� =������� −�������
�� −��
Where Loge2W2 is the natural log of the final (cumulative) value of the publication during the time 2t. Loge1W1 is the natural log of the initial value of the publication during the time period 1t
The Table 2 shows the research contribution (RC), Cumulative of research contribution, natural log of
the initial and final cumulative of research contribution (W2 & W1), relative growth rate in columns
Table 2: Relative Growth Rate (RGR) of BSI
S. No.
Year No. of Years (Y) RC Cum. Of RC W1 W2 RGR
1 1954 - 1960 7 161 161 5.0814
2 1961 - 1970 10 1030 1191 5.0814 7.0825 0.2
3 1971 - 1980 10 1157 2348 7.0825 7.7613 0.068
4 1981 - 1990 10 1736 4084 7.7613 8.315 0.055
5 1991 - 2000 10 1298 5382 8.315 8.5908 0.028
6 2001 - 2012 12 1992 7374 8.5908 8.9057 0.026
Total 59 7374
Dr. A. Bagavathi & Dr. M.E. Kalyani / Quantifying the Research Studies of Botanical Survey of India (BSI) Since 1954
169 Library Progress (International)/ Vol.39 No.1/ January-June 2019 DOI: 10.5958/2320-317X.2019.00017.5
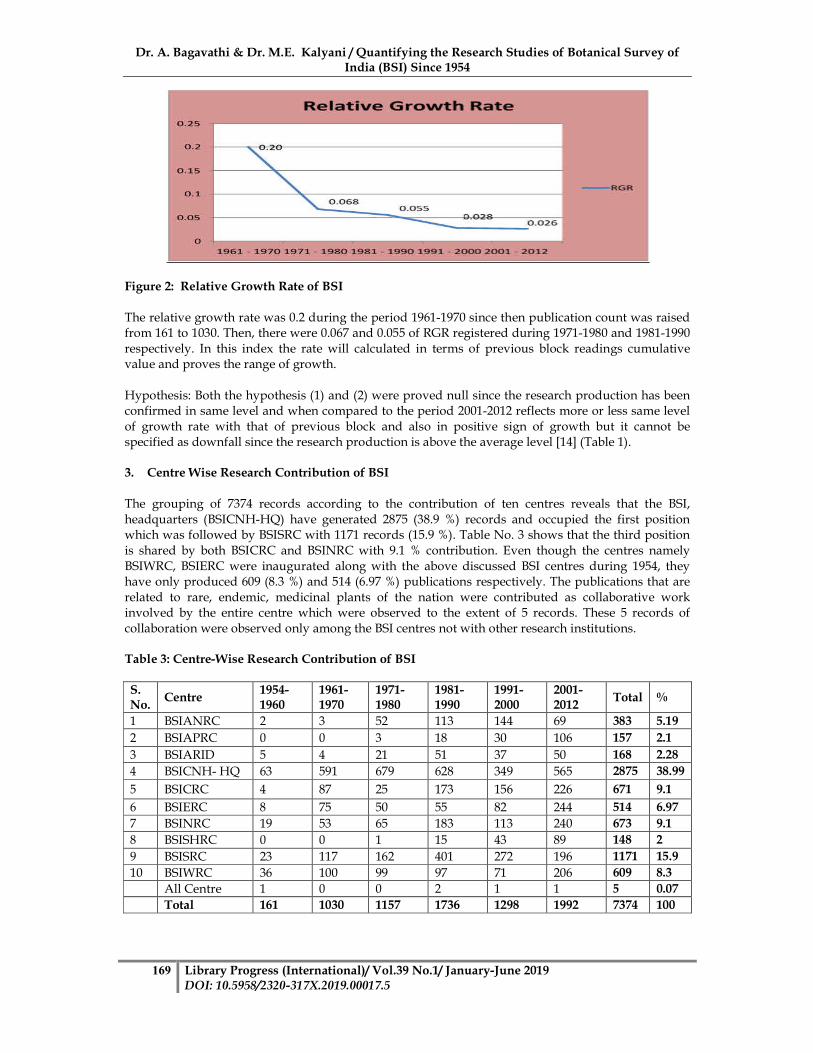
Figure 2: Relative Growth Rate of BSI
The relative growth rate was 0.2 during the period 1961-1970 since then publication count was raised from 161 to 1030. Then, there were 0.067 and 0.055 of RGR registered during 1971-1980 and 1981-1990
respectively. In this index the rate will calculated in terms of previous block readings cumulative value and proves the range of growth.
Hypothesis: Both the hypothesis (1) and (2) were proved null since the research production has been confirmed in same level and when compared to the period 2001-2012 reflects more or less same level
of growth rate with that of previous block and also in positive sign of growth but it cannot be specified as downfall since the research production is above the average level [14] (Table 1).
3. Centre Wise Research Contribution of BSI
The grouping of 7374 records according to the contribution of ten centres reveals that the BSI,
headquarters (BSICNH-HQ) have generated 2875 (38.9 %) records and occupied the first position which was followed by BSISRC with 1171 records (15.9 %). Table No. 3 shows that the third position
is shared by both BSICRC and BSINRC with 9.1 % contribution. Even though the centres namely
BSIWRC, BSIERC were inaugurated along with the above discussed BSI centres during 1954, they have only produced 609 (8.3 %) and 514 (6.97 %) publications respectively. The publications that are
related to rare, endemic, medicinal plants of the nation were contributed as collaborative work involved by the entire centre which were observed to the extent of 5 records. These 5 records of
collaboration were observed only among the BSI centres not with other research institutions. Table 3: Centre-Wise Research Contribution of BSI
S. No.
Centre 1954-1960
1961-1970
1971-1980
1981-1990
1991-2000
2001-2012
Total %
1 BSIANRC 2 3 52 113 144 69 383 5.19
2 BSIAPRC 0 0 3 18 30 106 157 2.1
3 BSIARID 5 4 21 51 37 50 168 2.28
4 BSICNH- HQ 63 591 679 628 349 565 2875 38.99
5 BSICRC 4 87 25 173 156 226 671 9.1
6 BSIERC 8 75 50 55 82 244 514 6.97
7 BSINRC 19 53 65 183 113 240 673 9.1
8 BSISHRC 0 0 1 15 43 89 148 2
9 BSISRC 23 117 162 401 272 196 1171 15.9
10 BSIWRC 36 100 99 97 71 206 609 8.3
All Centre 1 0 0 2 1 1 5 0.07
Total 161 1030 1157 1736 1298 1992 7374 100
Dr. A. Bagavathi & Dr. M.E. Kalyani / Quantifying the Research Studies of Botanical Survey of India (BSI) Since 1954
170 Library Progress (International)/ Vol.39 No.1/ January-June 2019 DOI: 10.5958/2320-317X.2019.00017.5
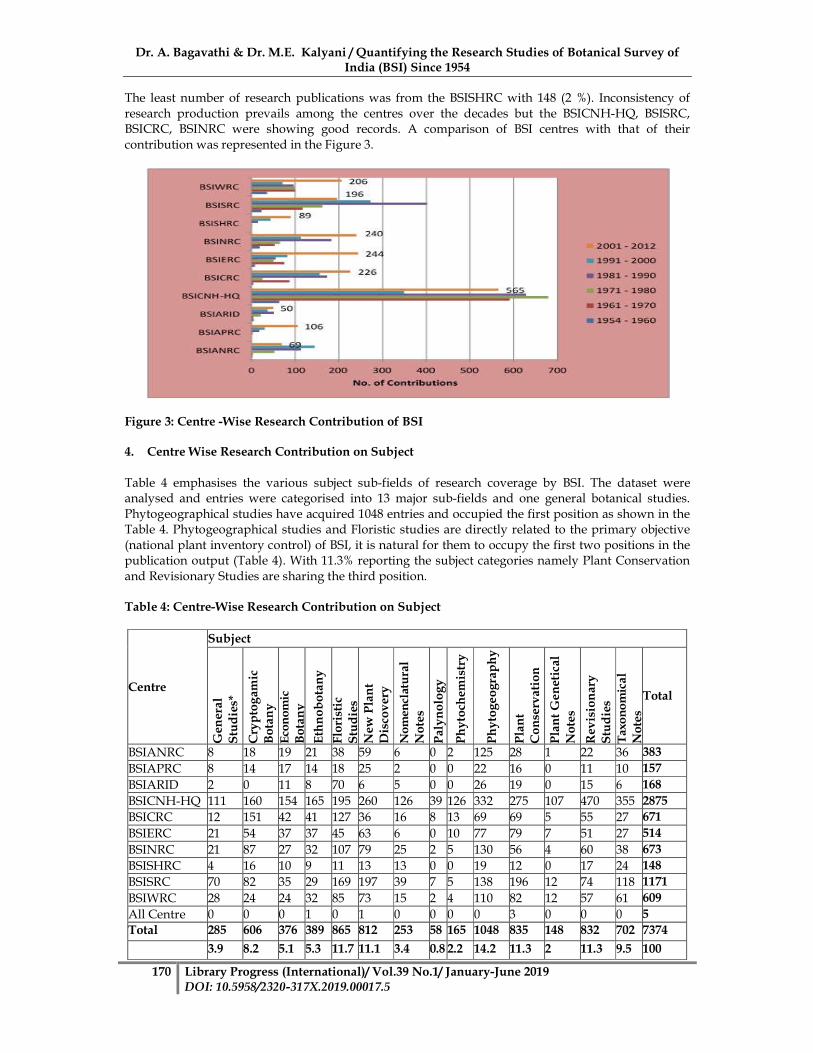
The least number of research publications was from the BSISHRC with 148 (2 %). Inconsistency of
research production prevails among the centres over the decades but the BSICNH-HQ, BSISRC, BSICRC, BSINRC were showing good records. A comparison of BSI centres with that of their
contribution was represented in the Figure 3.
Figure 3: Centre -Wise Research Contribution of BSI 4. Centre Wise Research Contribution on Subject
Table 4 emphasises the various subject sub-fields of research coverage by BSI. The dataset were analysed and entries were categorised into 13 major sub-fields and one general botanical studies.
Phytogeographical studies have acquired 1048 entries and occupied the first position as shown in the Table 4. Phytogeographical studies and Floristic studies are directly related to the primary objective
(national plant inventory control) of BSI, it is natural for them to occupy the first two positions in the publication output (Table 4). With 11.3% reporting the subject categories namely Plant Conservation
and Revisionary Studies are sharing the third position.
Table 4: Centre-Wise Research Contribution on Subject
Centre
Subject
Gen
eral
S
tud
ies*
Cry
pto
gam
ic
Bo
tan
y
Eco
no
mic
Bo
tan
y
Eth
no
bo
tan
y
Flo
rist
ic
Stu
die
s
New
Pla
nt
Dis
cov
ery
No
men
clat
ura
l N
ote
s
Pal
yn
olo
gy
Ph
yto
chem
istr
y
Ph
yto
ge
og
rap
hy
Pla
nt
Co
nse
rvat
ion
Pla
nt
Gen
etic
al
No
tes
Rev
isio
nar
y
Stu
die
s T
axo
no
mi c
al
No
tes
Total
BSIANRC 8 18 19 21 38 59 6 0 2 125 28 1 22 36 383
BSIAPRC 8 14 17 14 18 25 2 0 0 22 16 0 11 10 157
BSIARID 2 0 11 8 70 6 5 0 0 26 19 0 15 6 168
BSICNH-HQ 111 160 154 165 195 260 126 39 126 332 275 107 470 355 2875
BSICRC 12 151 42 41 127 36 16 8 13 69 69 5 55 27 671
BSIERC 21 54 37 37 45 63 6 0 10 77 79 7 51 27 514
BSINRC 21 87 27 32 107 79 25 2 5 130 56 4 60 38 673
BSISHRC 4 16 10 9 11 13 13 0 0 19 12 0 17 24 148
BSISRC 70 82 35 29 169 197 39 7 5 138 196 12 74 118 1171
BSIWRC 28 24 24 32 85 73 15 2 4 110 82 12 57 61 609
All Centre 0 0 0 1 0 1 0 0 0 0 3 0 0 0 5
Total 285 606 376 389 865 812 253 58 165 1048 835 148 832 702 7374
3.9 8.2 5.1 5.3 11.7 11.1 3.4 0.8 2.2 14.2 11.3 2 11.3 9.5 100
Dr. A. Bagavathi & Dr. M.E. Kalyani / Quantifying the Research Studies of Botanical Survey of India (BSI) Since 1954
171 Library Progress (International)/ Vol.39 No.1/ January-June 2019 DOI: 10.5958/2320-317X.2019.00017.5
*General Studies include bibliography, biography of eminent botanists, general botanical aspects, case
study of the herbaria.
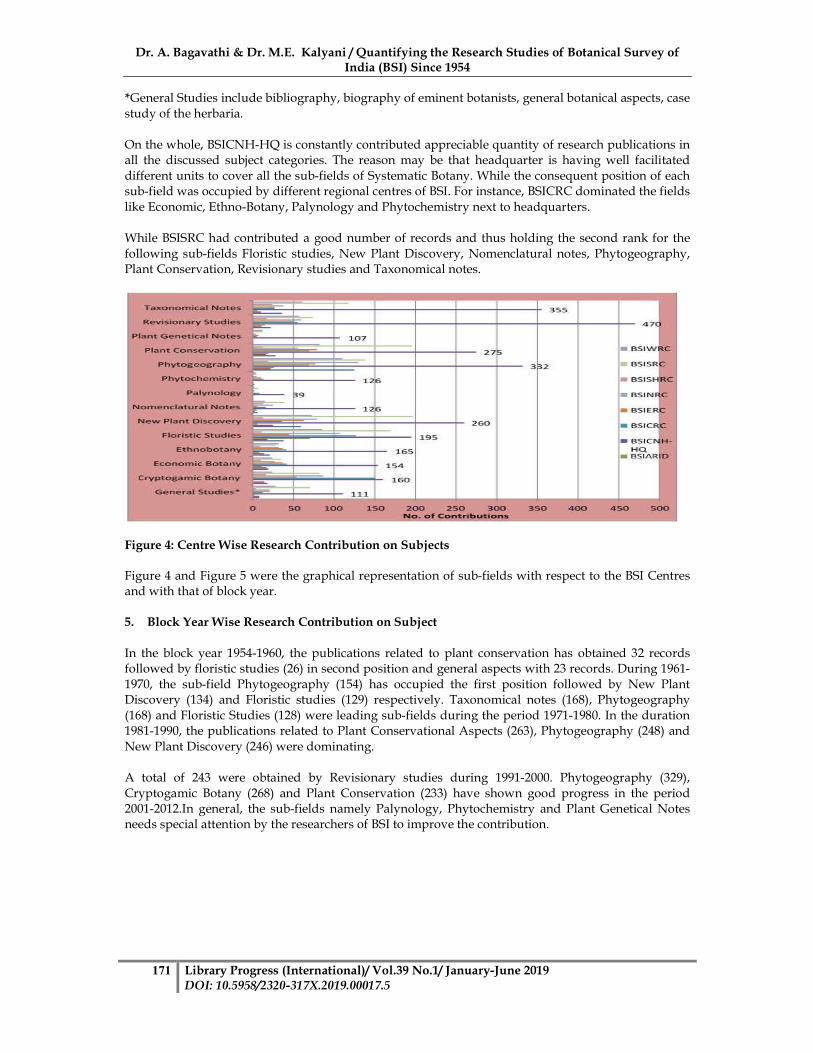
On the whole, BSICNH-HQ is constantly contributed appreciable quantity of research publications in all the discussed subject categories. The reason may be that headquarter is having well facilitated
different units to cover all the sub-fields of Systematic Botany. While the consequent position of each sub-field was occupied by different regional centres of BSI. For instance, BSICRC dominated the fields
like Economic, Ethno-Botany, Palynology and Phytochemistry next to headquarters.
While BSISRC had contributed a good number of records and thus holding the second rank for the
following sub-fields Floristic studies, New Plant Discovery, Nomenclatural notes, Phytogeography, Plant Conservation, Revisionary studies and Taxonomical notes.
Figure 4: Centre Wise Research Contribution on Subjects
Figure 4 and Figure 5 were the graphical representation of sub-fields with respect to the BSI Centres and with that of block year.
5. Block Year Wise Research Contribution on Subject
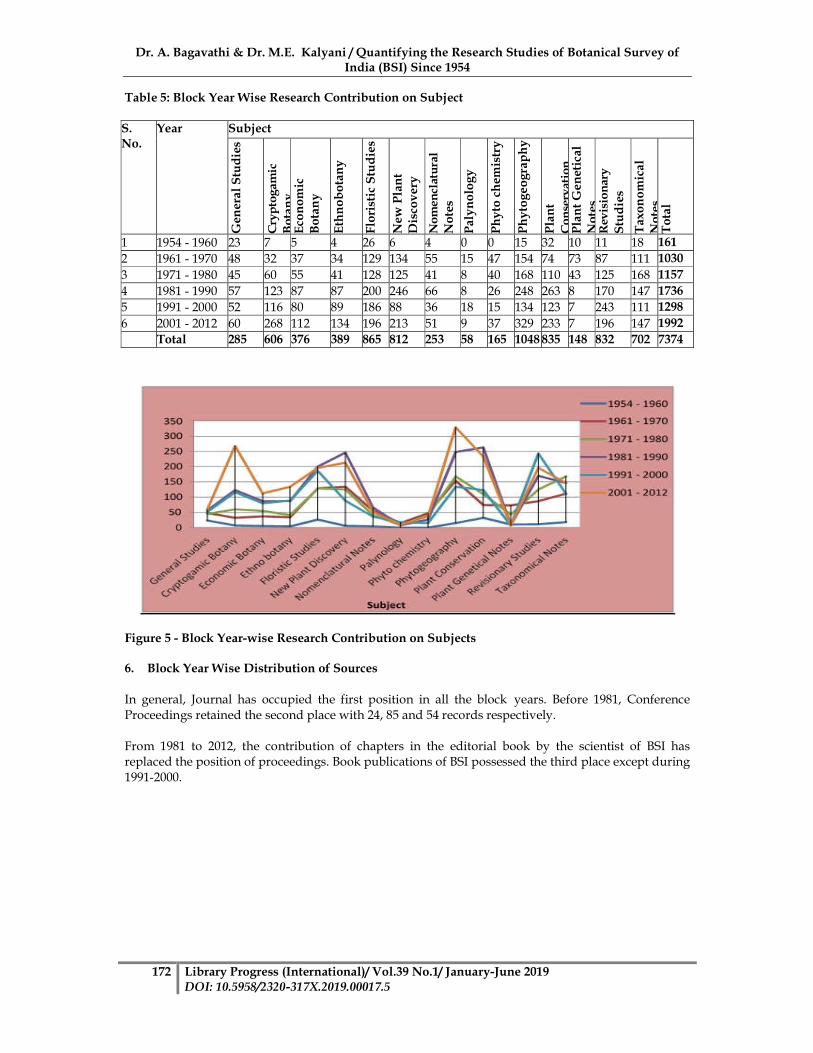
In the block year 1954-1960, the publications related to plant conservation has obtained 32 records followed by floristic studies (26) in second position and general aspects with 23 records. During 1961-
1970, the sub-field Phytogeography (154) has occupied the first position followed by New Plant Discovery (134) and Floristic studies (129) respectively. Taxonomical notes (168), Phytogeography
(168) and Floristic Studies (128) were leading sub-fields during the period 1971-1980. In the duration 1981-1990, the publications related to Plant Conservational Aspects (263), Phytogeography (248) and
New Plant Discovery (246) were dominating.
A total of 243 were obtained by Revisionary studies during 1991-2000. Phytogeography (329),
Cryptogamic Botany (268) and Plant Conservation (233) have shown good progress in the period 2001-2012.In general, the sub-fields namely Palynology, Phytochemistry and Plant Genetical Notes needs special attention by the researchers of BSI to improve the contribution.
Dr. A. Bagavathi & Dr. M.E. Kalyani / Quantifying the Research Studies of Botanical Survey of India (BSI) Since 1954
172 Library Progress (International)/ Vol.39 No.1/ January-June 2019 DOI: 10.5958/2320-317X.2019.00017.5
Table 5: Block Year Wise Research Contribution on Subject
S. No.
Year Subject
Gen
eral
Stu
die
s
Cry
pto
gam
ic
Bo
tan
y
Eco
no
mic
B
ota
ny
Eth
no
bo
tan
y
Flo
rist
ic S
tud
ies
New
Pla
nt
Dis
cov
ery
No
men
clat
ura
l
No
tes
Pal
yn
olo
gy
Ph
yto
ch
emis
try
Ph
yto
ge
og
rap
hy
Pla
nt
Co
nse
rvati
on
P
lan
t G
enet
ical
N
ote
s R
evis
ion
ary
Stu
die
s
Tax
on
om
ical
N
ote
s T
ota
l
1 1954 - 1960 23 7 5 4 26 6 4 0 0 15 32 10 11 18 161
2 1961 - 1970 48 32 37 34 129 134 55 15 47 154 74 73 87 111 1030
3 1971 - 1980 45 60 55 41 128 125 41 8 40 168 110 43 125 168 1157
4 1981 - 1990 57 123 87 87 200 246 66 8 26 248 263 8 170 147 1736
5 1991 - 2000 52 116 80 89 186 88 36 18 15 134 123 7 243 111 1298
6 2001 - 2012 60 268 112 134 196 213 51 9 37 329 233 7 196 147 1992
Total 285 606 376 389 865 812 253 58 165 1048 835 148 832 702 7374
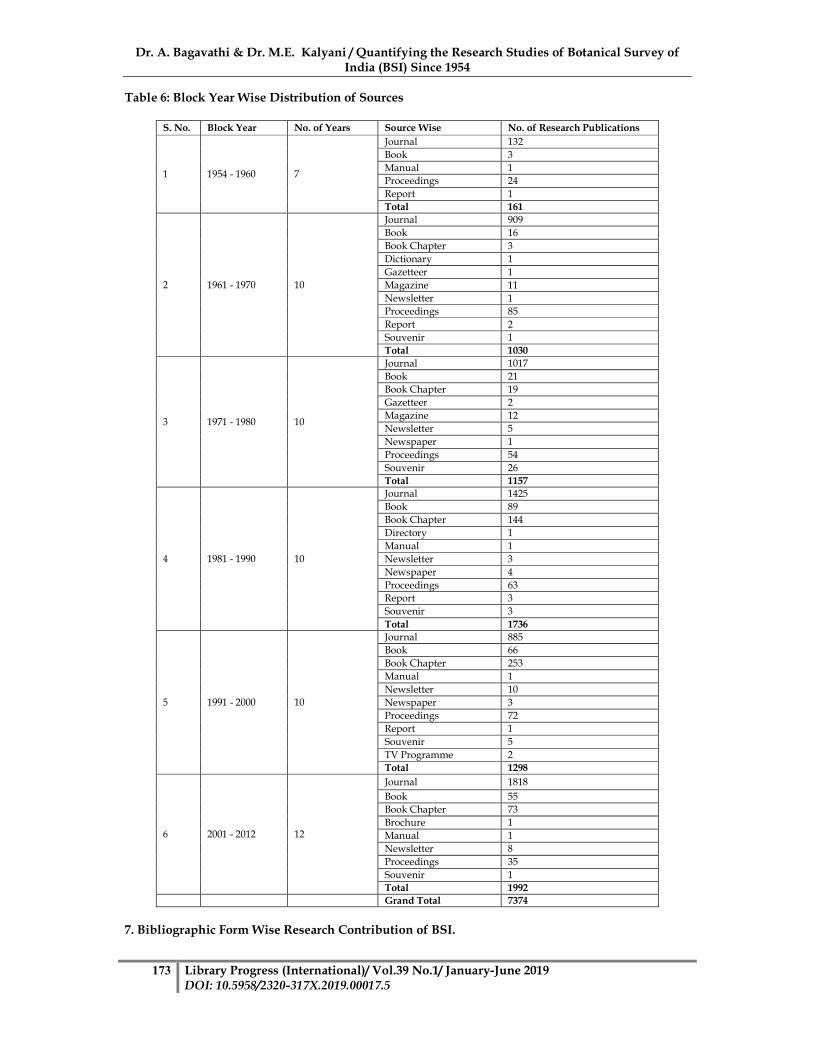
Figure 5 - Block Year-wise Research Contribution on Subjects 6. Block Year Wise Distribution of Sources
In general, Journal has occupied the first position in all the block years. Before 1981, Conference
Proceedings retained the second place with 24, 85 and 54 records respectively.
From 1981 to 2012, the contribution of chapters in the editorial book by the scientist of BSI has replaced the position of proceedings. Book publications of BSI possessed the third place except during
1991-2000.
Dr. A. Bagavathi & Dr. M.E. Kalyani / Quantifying the Research Studies of Botanical Survey of India (BSI) Since 1954
173 Library Progress (International)/ Vol.39 No.1/ January-June 2019 DOI: 10.5958/2320-317X.2019.00017.5
Table 6: Block Year Wise Distribution of Sources
S. No. Block Year No. of Years Source Wise No. of Research Publications
1 1954 - 1960 7
Journal 132
Book 3
Manual 1
Proceedings 24
Report 1
Total 161
2 1961 - 1970 10
Journal 909
Book 16
Book Chapter 3
Dictionary 1
Gazetteer 1
Magazine 11
Newsletter 1
Proceedings 85
Report 2
Souvenir 1
Total 1030
3 1971 - 1980 10
Journal 1017
Book 21
Book Chapter 19
Gazetteer 2
Magazine 12
Newsletter 5
Newspaper 1
Proceedings 54
Souvenir 26
Total 1157
4 1981 - 1990 10
Journal 1425
Book 89
Book Chapter 144
Directory 1
Manual 1
Newsletter 3
Newspaper 4
Proceedings 63
Report 3
Souvenir 3
Total 1736
5 1991 - 2000 10
Journal 885
Book 66
Book Chapter 253
Manual 1
Newsletter 10
Newspaper 3
Proceedings 72
Report 1
Souvenir 5
TV Programme 2
Total 1298
6 2001 - 2012 12
Journal 1818
Book 55
Book Chapter 73
Brochure 1
Manual 1
Newsletter 8
Proceedings 35
Souvenir 1
Total 1992
Grand Total 7374
7. Bibliographic Form Wise Research Contribution of BSI.
Dr. A. Bagavathi & Dr. M.E. Kalyani / Quantifying the Research Studies of Botanical Survey of India (BSI) Since 1954
174 Library Progress (International)/ Vol.39 No.1/ January-June 2019 DOI: 10.5958/2320-317X.2019.00017.5
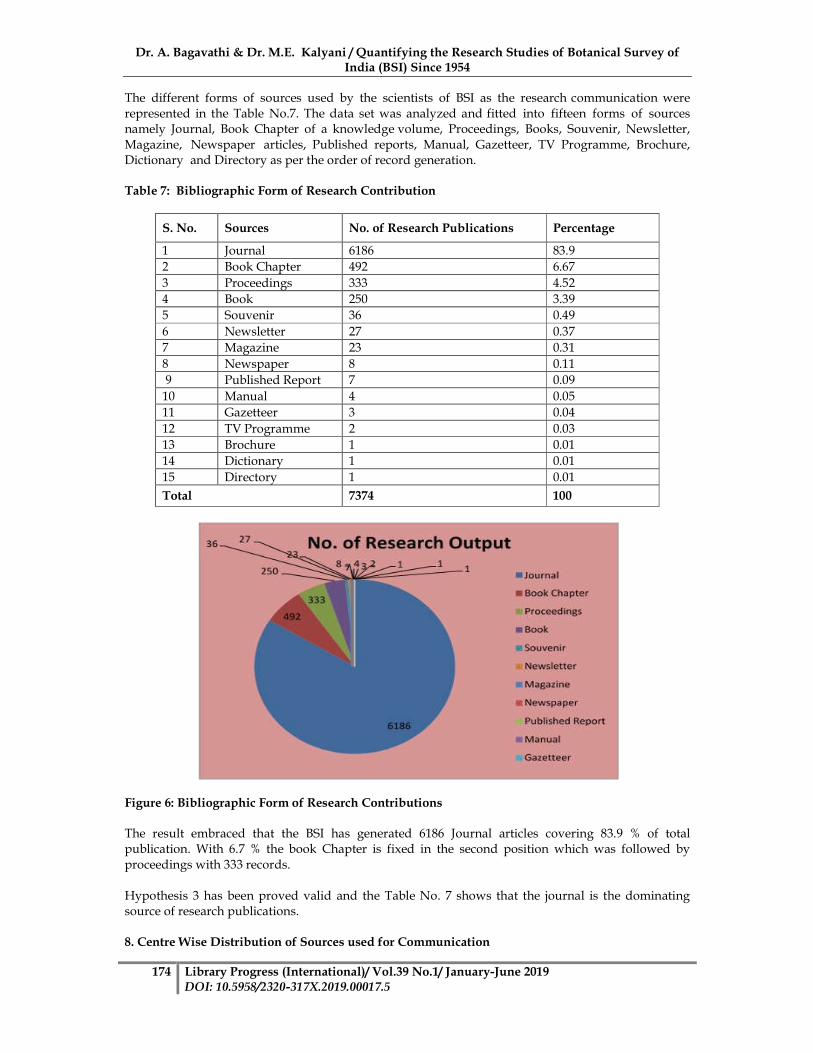
The different forms of sources used by the scientists of BSI as the research communication were
represented in the Table No.7. The data set was analyzed and fitted into fifteen forms of sources namely Journal, Book Chapter of a knowledge volume, Proceedings, Books, Souvenir, Newsletter,
Magazine, Newspaper articles, Published reports, Manual, Gazetteer, TV Programme, Brochure, Dictionary and Directory as per the order of record generation.
Table 7: Bibliographic Form of Research Contribution
S. No. Sources No. of Research Publications Percentage
1 Journal 6186 83.9
2 Book Chapter 492 6.67
3 Proceedings 333 4.52
4 Book 250 3.39
5 Souvenir 36 0.49
6 Newsletter 27 0.37
7 Magazine 23 0.31
8 Newspaper 8 0.11
9 Published Report 7 0.09
10 Manual 4 0.05
11 Gazetteer 3 0.04
12 TV Programme 2 0.03
13 Brochure 1 0.01
14 Dictionary 1 0.01
15 Directory 1 0.01
Total 7374 100
Figure 6: Bibliographic Form of Research Contributions
The result embraced that the BSI has generated 6186 Journal articles covering 83.9 % of total publication. With 6.7 % the book Chapter is fixed in the second position which was followed by
proceedings with 333 records.
Hypothesis 3 has been proved valid and the Table No. 7 shows that the journal is the dominating source of research publications.
8. Centre Wise Distribution of Sources used for Communication
Dr. A. Bagavathi & Dr. M.E. Kalyani / Quantifying the Research Studies of Botanical Survey of India (BSI) Since 1954
175 Library Progress (International)/ Vol.39 No.1/ January-June 2019 DOI: 10.5958/2320-317X.2019.00017.5
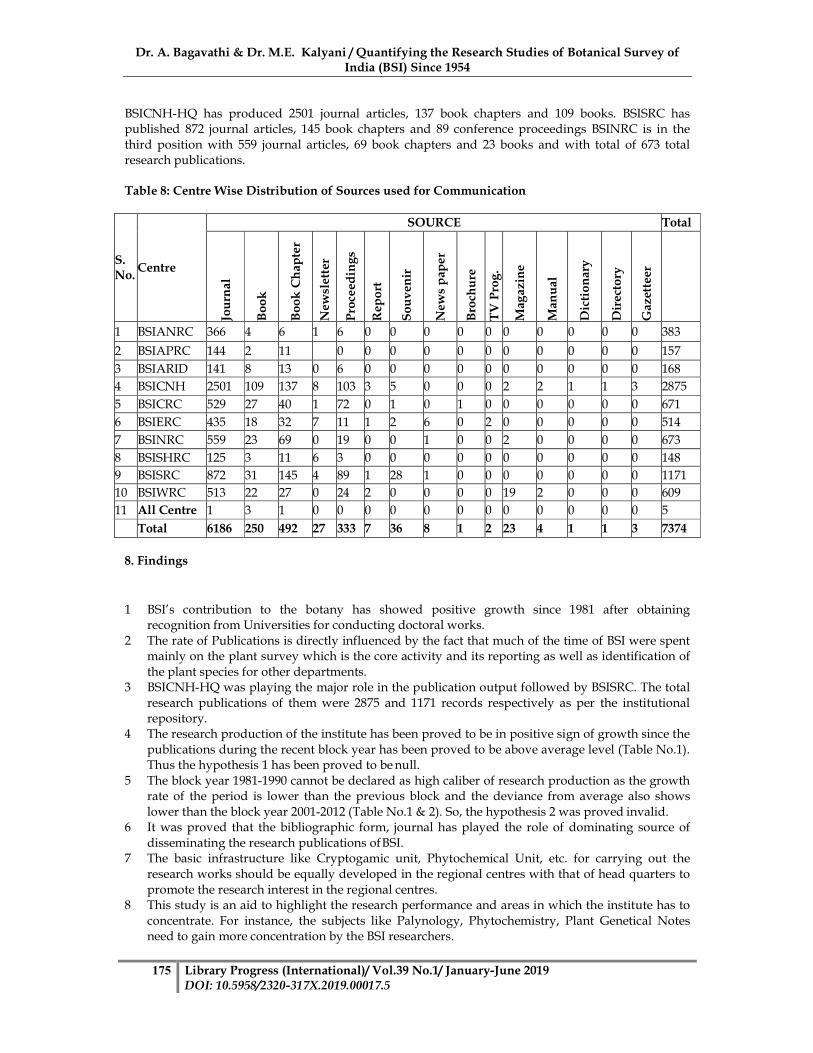
BSICNH-HQ has produced 2501 journal articles, 137 book chapters and 109 books. BSISRC has published 872 journal articles, 145 book chapters and 89 conference proceedings BSINRC is in the
third position with 559 journal articles, 69 book chapters and 23 books and with total of 673 total research publications.
Table 8: Centre Wise Distribution of Sources used for Communication
S. No.
Centre
SOURCE Total Jo
urn
al
Bo
ok
Bo
ok
Ch
apte
r
New
slet
ter
Pro
ceed
ing
s
Rep
ort
So
uv
enir
New
s p
ape
r
Bro
chu
re
TV
Pro
g.
Mag
azin
e
Man
ual
Dic
tio
nar
y
Dir
ecto
ry
Gaz
ette
er
1 BSIANRC 366 4 6 1 6 0 0 0 0 0 0 0 0 0 0 383
2 BSIAPRC 144 2 11 0 0 0 0 0 0 0 0 0 0 0 157
3 BSIARID 141 8 13 0 6 0 0 0 0 0 0 0 0 0 0 168
4 BSICNH 2501 109 137 8 103 3 5 0 0 0 2 2 1 1 3 2875
5 BSICRC 529 27 40 1 72 0 1 0 1 0 0 0 0 0 0 671
6 BSIERC 435 18 32 7 11 1 2 6 0 2 0 0 0 0 0 514
7 BSINRC 559 23 69 0 19 0 0 1 0 0 2 0 0 0 0 673
8 BSISHRC 125 3 11 6 3 0 0 0 0 0 0 0 0 0 0 148
9 BSISRC 872 31 145 4 89 1 28 1 0 0 0 0 0 0 0 1171
10 BSIWRC 513 22 27 0 24 2 0 0 0 0 19 2 0 0 0 609
11 All Centre 1 3 1 0 0 0 0 0 0 0 0 0 0 0 0 5
Total 6186 250 492 27 333 7 36 8 1 2 23 4 1 1 3 7374
8. Findings
1 BSI’s contribution to the botany has showed positive growth since 1981 after obtaining recognition from Universities for conducting doctoral works.
2 The rate of Publications is directly influenced by the fact that much of the time of BSI were spent mainly on the plant survey which is the core activity and its reporting as well as identification of
the plant species for other departments. 3 BSICNH-HQ was playing the major role in the publication output followed by BSISRC. The total
research publications of them were 2875 and 1171 records respectively as per the institutional repository.
4 The research production of the institute has been proved to be in positive sign of growth since the
publications during the recent block year has been proved to be above average level (Table No.1). Thus the hypothesis 1 has been proved to be null.
5 The block year 1981-1990 cannot be declared as high caliber of research production as the growth rate of the period is lower than the previous block and the deviance from average also shows
lower than the block year 2001-2012 (Table No.1 & 2). So, the hypothesis 2 was proved invalid. 6 It was proved that the bibliographic form, journal has played the role of dominating source of
disseminating the research publications of BSI. 7 The basic infrastructure like Cryptogamic unit, Phytochemical Unit, etc. for carrying out the
research works should be equally developed in the regional centres with that of head quarters to
promote the research interest in the regional centres. 8 This study is an aid to highlight the research performance and areas in which the institute has to
concentrate. For instance, the subjects like Palynology, Phytochemistry, Plant Genetical Notes need to gain more concentration by the BSI researchers.
Dr. A. Bagavathi & Dr. M.E. Kalyani / Quantifying the Research Studies of Botanical Survey of India (BSI) Since 1954
176 Library Progress (International)/ Vol.39 No.1/ January-June 2019 DOI: 10.5958/2320-317X.2019.00017.5
9. Suggestion
This value can be compared with the citation databases like Scopus and Web of Science for further
critical studies. 10. Conclusion
This study has projected the growth of BSI is in positive side which was proved using relative growth
rate. The development of certain research units were emphasized using the subject growth trend analysis. The research production of the institute on various sub-fields, bbibliographic form of
research contribution and regional centre wise production of BSI were discussed in this study. This research is a small way to probe the spheres of scientific communication in the field of Indian plant
taxonomy carried out by the BSI.
11. References
1. Pritchard, A. (1969). Statistical Bibliography or Bibliometrics?. Journal of Documentation, 25(4), 348-349.
2. Bhardwaj, Rajkumar (2016). Ebola Virus: A scientometric study of World research publications. Journal of Scientometric Research, 5(1), 34-42.
3. Vieira, E. S., & Lepori, B. (2016). The growth process of higher education institutions and public policies. Journal of informetrics, 10(1), 286-298.
4. Hou, Q., Mao, G., Zhao, L., Du, H., & Zuo, J. (2015). Mapping the scientific research on life cycle
assessment: A bibliometric analysis. The International Journal of Life Cycle Assessment, 20, 541-555.
5. Jung, Y., Kim, J., So, M., & Kim, H. (2015). Statistical relationship between journal use and research output at academic institutions in South Korea. Scientometrics, 103, 751-777.
6. Guan, J., & Wei, He. (2015). A bilateral comparison of research performance at an institutional level. Scientometrics, 104(1), 147-173.
7. Stork, H., & Astrin, J. J. (2014). Trends in Biodiversity Research: A bibliometric assessment. Open Journal of Ecology, 4, 354-370. Retrieved from http://dx.doi.org/10.4236/oje.2014.47033.
8. Pathak, M., & Bharati, K. A. (2014). Botanical Survey of India (1971 – 2010): A scientometric
analysis. Current Science, 106(7), 964–971. 9. López-muñoz, F., Shinfuku, N., Shen, W. W., Moreno, R., Molina, J. D., Rubio, G., Huelves, L., et
al. (2013). Thirty years of scientific research on second- generation antipsychotic drugs in Japan: A bibliometric analysis. Open Journal of Psychiatry, 3, 18–25.
10. Pagel, P. S., & Hudetz, J. A. (2013). A bibliometric analysis of geographic publication variations in the Journal of Cardiothoracic and Vascular Anesthesia, 27(2), 208-212.
11. Regolini, A., & Jannes-Ober, E. (2013). A bibliometric study of Informing Science: The international journal of an emerging transdiscipline. Informing Science, 16, 117-130.
12. Sethi, B. B., & Panda, K. C. (2012). Growth and nature of international LIS research: An analysis of
two journals. The International Information & Library Review, 44(2), 86–99. 13. Swain, D. K., & Panda, K. C. (2012). Journal of Intellectual Property Rights, 2002-2010: A
bibliometric study. Chinese Librarianship: an International elecrtronic Journal, 33, 1–12. Retrieved from www.iclc.us/cliej/c133SP.pdf
14. Mahapatra, M. (1985). On the validity of the theory of exponential growth of scientific literature. Proceedings of the 15th IASLIC conference, Bangalore.


![Quantifying Anderson's fault types · 2019-11-12 · Quantifying Anderson's fault types Robert W. Simpson U.S. Geological Survey, Memo Park, California Abstract. Anderson [1905] explained](https://img.pdfslide.us/doc/110x75/5f1215d6e26dc925fc4b7c78/quantifying-andersons-fault-types-2019-11-12-quantifying-andersons-fault-types.jpg)