Embed Size (px)
Citation preview

QUANTIFYING THE RELATIONSHIP BETWEEN THE POWER DELIVERY NETWORK AND ARCHITECTURAL
POLICIES IN A 3D-STACKED MEMORY DEVICE
Manjunath Shevgoor, Niladrish Chatterjee, Rajeev Balasubramonian, Al DavisUniversity of Utah
Aniruddha N. UdipiARM R&D
1
Jung-Sik KimDRAM Design Team, Samsung Electronics
2
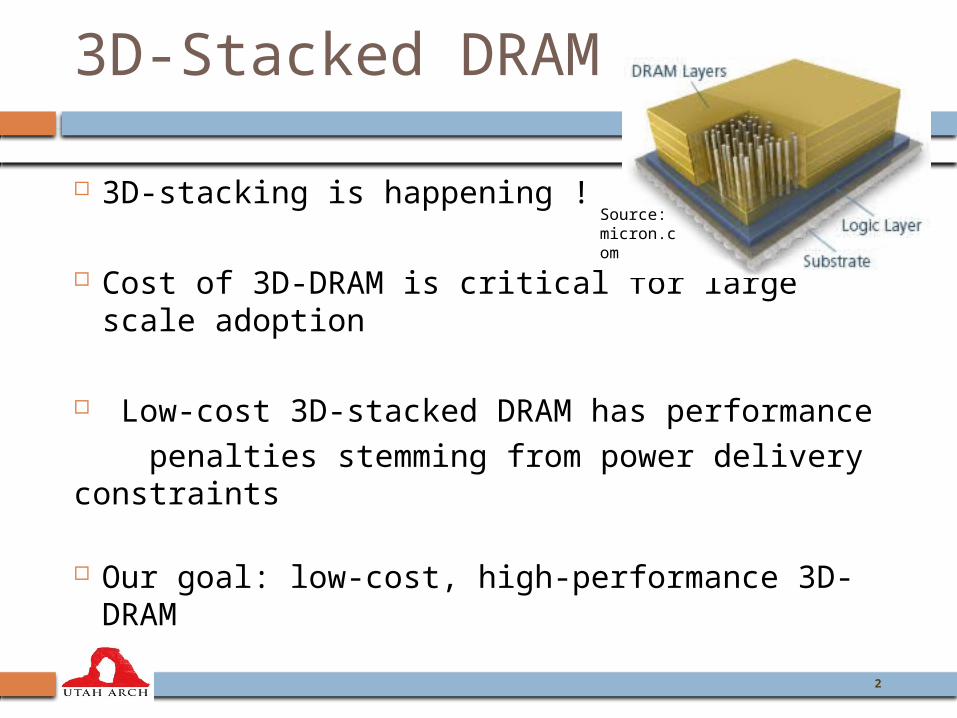
3D-Stacked DRAM
3D-stacking is happening !
Cost of 3D-DRAM is critical for large scale adoption
Low-cost 3D-stacked DRAM has performance penalties stemming from power delivery constraints
Our goal: low-cost, high-performance 3D-DRAM
Source: micron.com
3
Outline
IR-drop background Quantify the effect of IR-Drop IR-drop aware memory controller IR-drop aware scheduling and data
placement Evaluation

Background
4
1.5V
GND
A BWire Resistance
1.5V 1.2V
Circuit Element
Voltage along Wire A-B
• Only part of the supply voltage reaches the circuit elements
• This loss of Voltage over the Power Delivery Network (PDN) is called IR -Drop
IR Drop can lead to correctness issues

5
The Power Delivery Network
Grid of wires which connect power sources to the circuits
Source: Sani R. Nassif, Power Grid Analysis Benchmarks
VDD VSS

• 3D stacking increases current density – Increased ‘I’
• TSVs add resistance to the PDN – increased ‘R’
• Navigate 8 TSV layers to reach the top die
IR Drop in 3D DRAM
6
DIE 2
DIE 3
DIE 1
High IR DropLow IR Drop

7
Static and Dynamic IR Drop
Static IR-Drop Static current loads PDN is reduced to a network of resistances
Dynamic IR-Drop Considers circuit switching Capacitive and inductive effects are considered
Total noise of 75mV can be tolerated As a first step, this paper focuses on Static IR-
Drop Pessimistically assume a 75mV margin for static IR-
drop

8
Reducing IR Drop
Reduce “I” Control Activity on chip Decreases Performance
Current limiting constraints already exist DDR3 uses tFAW and tRRD
Recent work on PCM (Hay et al.) using Power Tokens to limit PCM current draw
These solutions use Temporal Constraints … more is required to handle IR drop in 3D DRAM
9
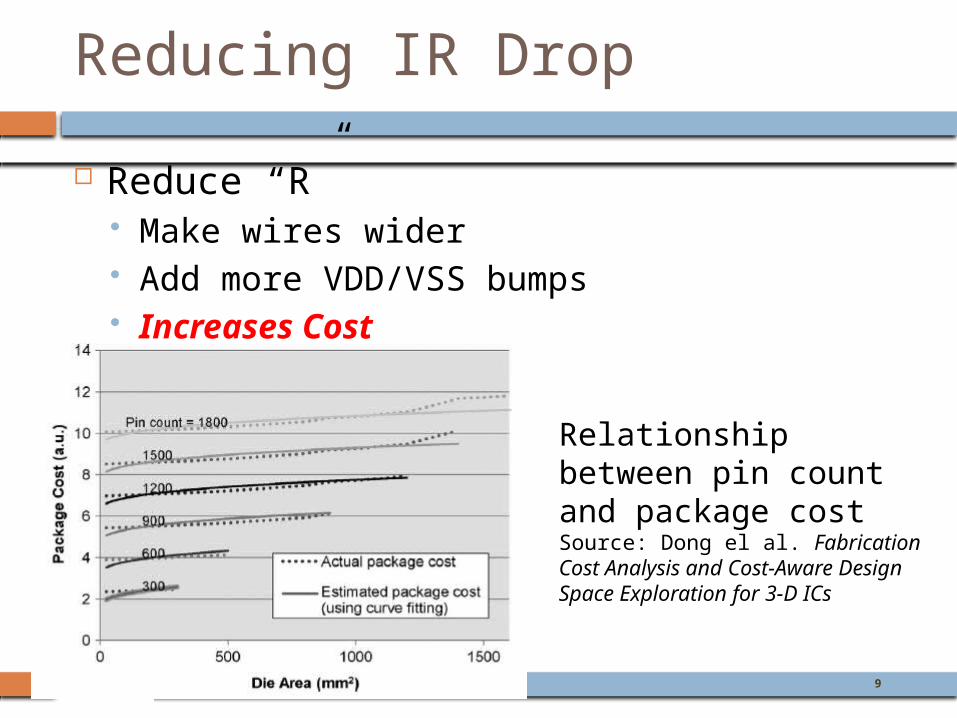
Reducing IR Drop
Reduce “R” Make wires wider Add more VDD/VSS bumps Increases Cost
Relationship between pin count and package costSource: Dong el al. Fabrication Cost Analysis and Cost-Aware Design Space Exploration for 3-D ICs

10
Background Summary
Voltage drops across every PDN 3D DRAM has I and R Reducing I and R has cost and
performance penalties
Explore architectural policies to manage IR Drop Can provide high performance and low
cost

11
Overview
IR Drop is not uniform across the stack Different regions can support different
activities Avoid being constrained by worst case IR
Drop
IR-Drop aware architectural policies Memory Scheduling Data Placement
12
Outline
IR-drop background Quantify the effect of IR-Drop IR-drop aware memory controller IR-drop aware scheduling and data
placement Evaluation
13
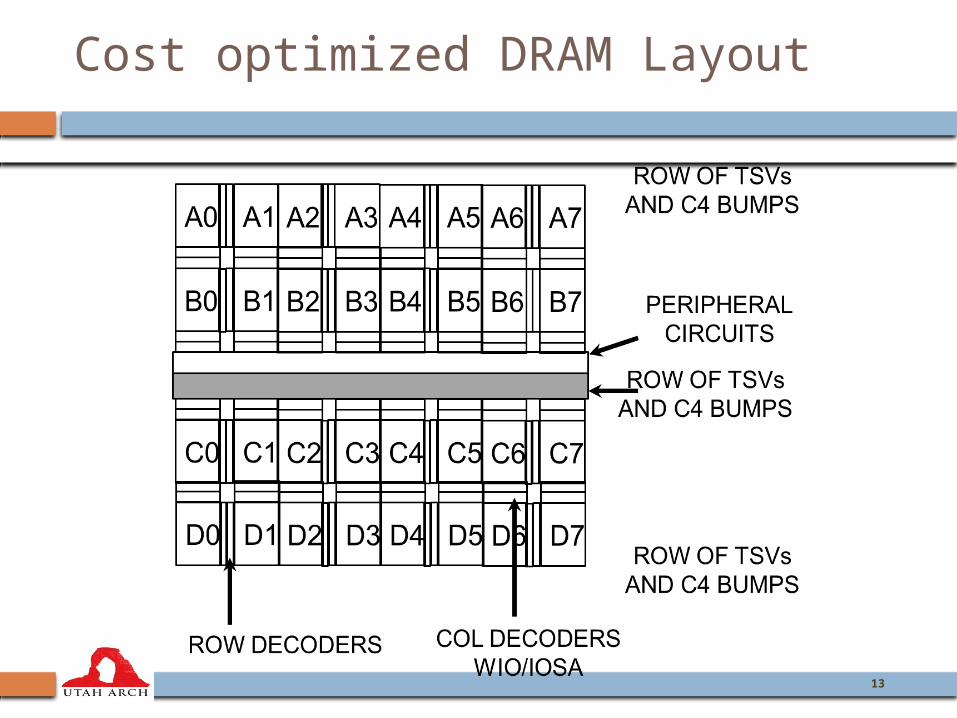
Cost optimized DRAM Layout

14
DRAM Layout – Spatial Dependence
VDD on M1 on Layer 9
X Coordinate
VD
D
Y C
oord
inate
• The TSV count is high enough to provide the necessary current and not suffer Electro-Migration
15
IR Drop Profile
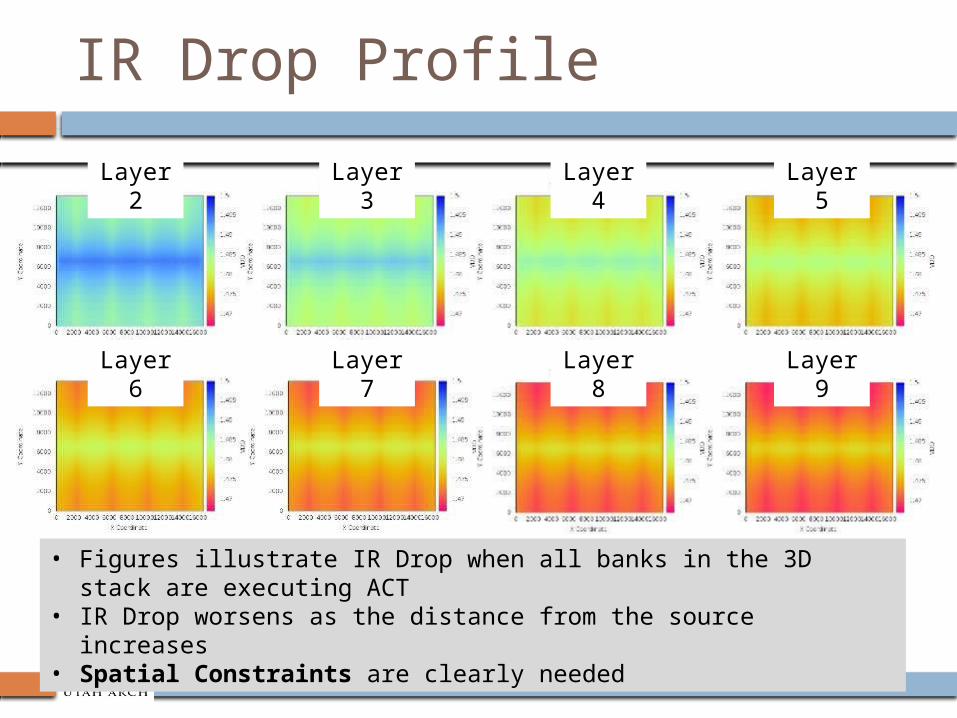
• Figures illustrate IR Drop when all banks in the 3D stack are executing ACT
• IR Drop worsens as the distance from the source increases• Spatial Constraints are clearly needed
Layer 2
Layer 3
Layer 4
Layer 5
Layer 6
Layer 7
Layer 8
Layer 9

16
IR Drop Aware Constraints
Quality of power delivery depends on location
Existing constraints are Temporal
Hence, augment with Spatial Constraints
17
Outline
IR-drop background Quantify the effect of IR-Drop IR-drop aware memory controller IR-drop aware scheduling and data
placement Evaluation
18
Iso-IR Drop Regions
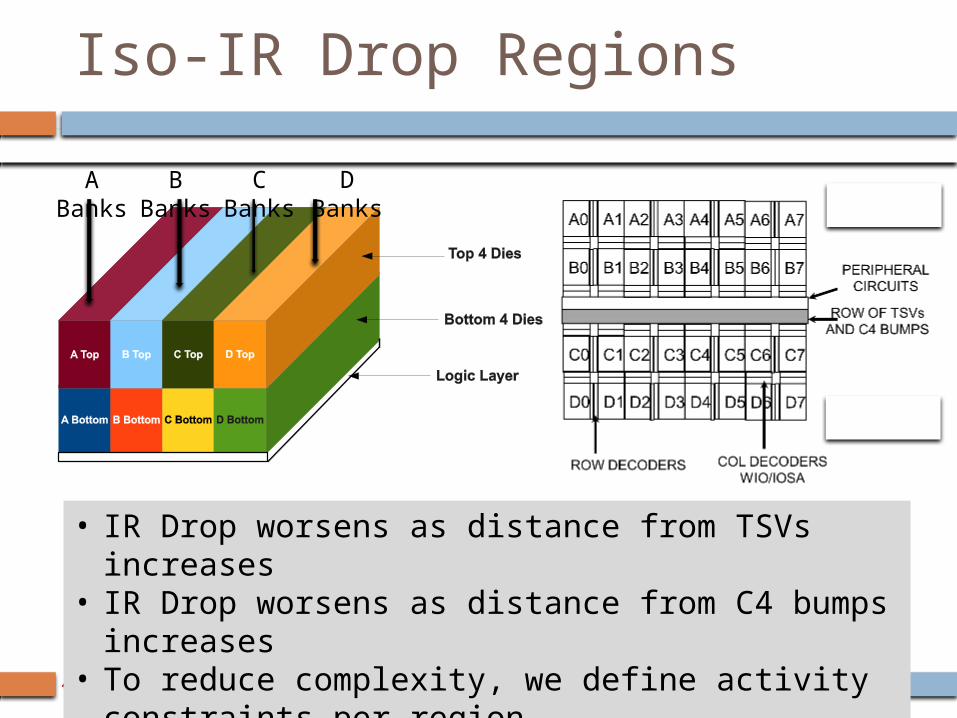
• IR Drop worsens as distance from TSVs increases• IR Drop worsens as distance from C4 bumps
increases• To reduce complexity, we define activity
constraints per region
A Banks
B Banks
C Banks
D Banks

19
Region Based Constraints
RD
No Violations
RD

20
Region Based Constraints
RD
Violation !
RD
21
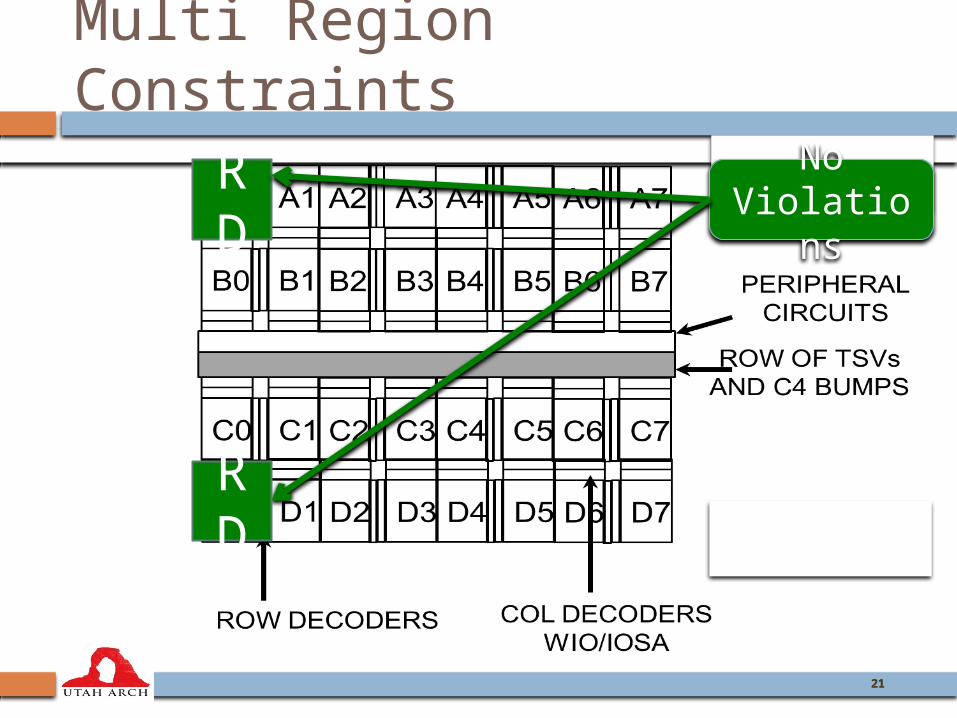
Multi Region Constraints
21
RD
No Violations
RD

22
Multi Region Constraints
RD
Violation !R
D

23
Region based Read constraints
At least one Rd in Top Regions
8 Reads allowed
No Top Region Reads 16 Reads allowed
Top Region Reads 1-2 Reads allowedBottom Region Reads 4 Reads allowed

24
DRAM Currents
Symbol
Value (mA)
Description
Consumed By
IDD0 66 One bank Activate to Precharge
Local Sense Amps, Row Decoders, and I/O Sense Amps
IDD4R 235 Burst Read Current
Peripherals, Local Sense Amps, IO Sense Amps, Column Decoders
IDD4W 171 Burst Write Current
Peripherals, IO Sense Amps, Column DecodersSource: Micron Data Sheet for 4Gb
x16 part

25
Read Based constraints
To limit controller complexity, we define ACT, PRE and Write constraints in terms of Read
The Read-Equivalent is the min. number of ACT/PRE/WR that cause the same IR-Drop as the Read
Command Read Equivalent
ACT 2PRE 6WR 1

26
Outline
IR-drop background Quantify the effect of IR-Drop IR-drop aware memory controller IR-drop aware scheduling and data
placement Evaluation

27
Controlling Starvation
As long as Bottom Regions are serving more than 8 Reads, Top Regions can never service a Read
Requests mapped to Top regions suffer Prioritize Requests that are older than
N* Avg. Read Latency(N is empirically determined to be 1.2 in our simulations)
Die Stack Wide
Constraint
At least one Rd in Top Regions
8 Reads allowed
No Top Region Reads
16 Reads allowed

28
Page Placement (Profiled)
Profile applications to find highly accessed pages
Map most accessed pages to the most IR Drop resistant regions (Bottom Regions)
The profile is divided into 8 sections. The 4 most accessed sections are mapped to Bottom regions
The rest are mapped to C_TOP, B_TOP, D_TOP, A_TOP, in that order

29
Page Placement (Dynamic)
Recent page activity determines migration candidates
Pages with highest total queuing delay are moved to bottom regions
Using page access count to promote pages can starve threads
Page access count is used to demote pages to top regions
Page migration is limited by Migration Penalty (10k/15M cycles)
30
Outline
IR-drop background Quantify the effect of IR-Drop IR-drop aware memory controller IR-drop aware scheduling and data
placement Evaluation

31
Modeling Static IR Drop
• Current consumed by each block is assumed to be distributed evenly over the block
• Current sources are used to model the current consumptionSource: Sani R. Nassif, Power Grid Analysis Benchmarks
32
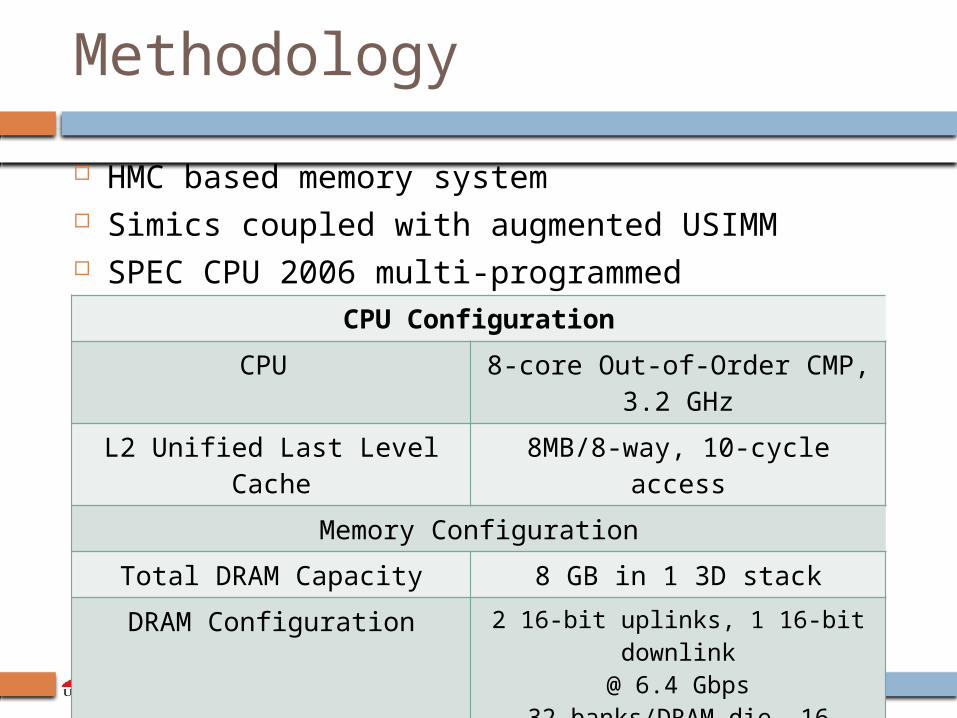
Methodology
HMC based memory system Simics coupled with augmented USIMM SPEC CPU 2006 multi-programmed
CPU Configuration
CPU 8-core Out-of-Order CMP, 3.2 GHz
L2 Unified Last Level Cache 8MB/8-way, 10-cycle access
Memory Configuration
Total DRAM Capacity 8 GB in 1 3D stack
DRAM Configuration 2 16-bit uplinks, 1 16-bit downlink
@ 6.4 Gbps32 banks/DRAM die, 16 vaults
8 DRAM dies/3D-stacktFAW honored on each die
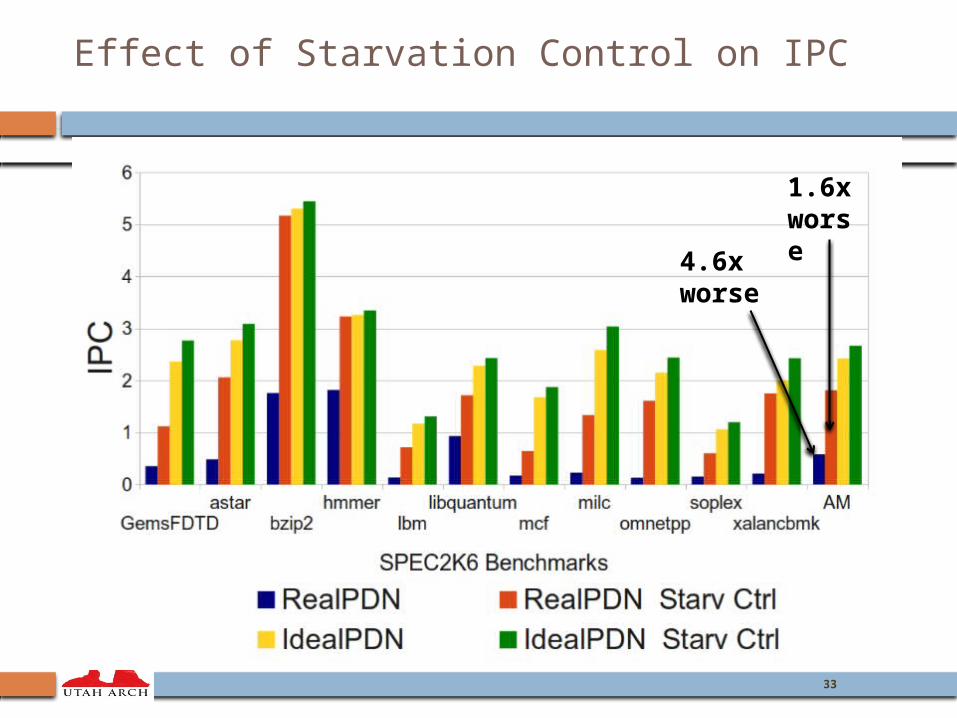
Effect of Starvation Control on IPC
33
4.6x worse
1.6x worse

34
Effect of EPP on IPC
Within 1.2x of ideal

35
Impact on DRAM Latency
PPP 55%reduction
EPP 38%reduction

36
Conclusions
Multiple voltage noise sources – we focus on static IR Drop in 3D DRAM
Multiple ways to cope with IR Drop – we focus on architectural policies – reduce cost and improve performance
We construct simple region based constraints for the memory controller
We introduce starvation and page placement policies The memory controller manages both spatial and
temporal aspects – our low-cost PDN achieves performance that is very close to that of the Ideal PDN
37
Thank You

Manjunath Shevgoor, Niladrish Chatterjee, Rajeev Balasubramonian, Al DavisUniversity of Utah
Aniruddha N. UdipiARM R&D
38
Jung-Sik KimDRAM Design Team, Samsung Electronics
QUANTIFYING THE RELATIONSHIP BETWEEN THE POWER DELIVERY NETWORK AND ARCHITECTURAL
POLICIES IN A 3D-STACKED MEMORY DEVICE


![[IJET V2I3P4] Authors: Manjunath Aski, Prathibha P](https://img.pdfslide.us/doc/110x75/588035781a28ab9f0f8b7319/ijet-v2i3p4-authors-manjunath-aski-prathibha-p.jpg)