Embed Size (px)
Citation preview
Quantifying the Economic Impact of Removing Non-Tariff Measures: Tariff Equivalent Approach
Takamune FUJII and Mitsuyo ANDO
Abstract
Our study quantifies the economic impact of eliminating non-tariff measures in 13 APEC countries within the framework of GTAP simulation model, using the very preliminary estimates of tariff equivalents of NTMs. The three types of simulations are conducted for each APEC economy: a case with eliminating tariffs, a case with eliminating core NTMs, and a case with removing overall NTMs (core NTMs plus non-core NTMs). The results suggest that the removal of NTMs has a significant impact on the involved economies while the magnitude of the effect is smaller than that of removing tariffs. The results also suggest that the elimination of core NTMs has a larger effect on the welfare than that of removing non-core NTMs does.
KEYWORDS: Non-Tariff Measures (Core/Non-Core NTM), Tariff Equivalents of NTMs, Trade Liberalization, and APEC
1. Introduction
Tariffs are recognized to be an economically preferred form of protection and have been
successfully reduced as a result of periodic rounds of multilateral trade negotiations. In contrast, non-tariff measures (NTMs) are in general not transparent to their price and other protective effects while they highly distort the behavior of producers and consumers, and thus trade patterns. In addition, there is no consensus on the range of NTMs since they cover all trade-distorting measures except tariffs, regardless of whether border type or internal type. These non-transparent and obscure features of NTMs make them difficult to control and monitor and thus have attracted governments and domestic industries that lobby for protection.
This paper is prepared for The 5th Conference on Global Economic Analysis “Sustainable Development and the General Equilibrium Approach” in Taipei, 5-7 June 2002. Takamune Fujii is assistant professor in the Faculty of Business Administration at Aichi University. Mitsuyo Ando is research associate in the Faculty of Economics at Keio University. The authors thank to Professor Fukunari Kimura for his advice and suggestion. We also thank to Professor Hiroshi Mori, Yoshihisa Godo, and all participants at TEA 2001 fall meeting for their helpful comments on the earlier version of the article.
1
As for the range of NTMs, there are several ways of NTM classifications proposed by UNCTAD, Deardorff and Stern (1998), and Baldwin (1970). While the classification of UNCTAD consists only of import distorting measures, those of Deardorff and Stern (1998) and Baldwin (1970) include, in addition to import related measures, export related and production related measures, and domestic regulations that can restrict trade. Table 1.1 shows the NTM classification of UNCTAD. This classification categorizes NTMs into seven types, that is, price control measures, financial control measures, auto-licensing measures, quantity control measures, monopolistic measures, technical measures, and miscellaneous measures. Among them, UNCTAD defines price control measures, financial control measures, and quantity control measures as core NTMs. Thus, we call other measures non core-NTMs.
With the growing interests in regionalism, many studies have analyzed the economic impact of trade liberalization through free trade agreements (FTAs) or regional integration within the framework of GTAP simulation model. In general, measuring NTMs is very difficult compared with tariffs, partly because of their wide diversity and vagueness as well as paucity of data (PECC, 2000). The support and protection data (SPD) in GTAP database also do not reflect enough information on the protection that NTMs provide for domestic producers.1 Due to the lack of NTM data for the SPD, most studies have conducted the simulation of trade liberalization without considering the effects of eliminating NTMs.
However, to analyze the economic impact of trade liberalization, NTMs should be explicitly introduced, in addition to tariffs, in the simulation model. There are several reasons why the economic impact of NTMs has to be focused on and also be analyzed separately from those of tariffs. First of all, the protection induced by NTMs is not negligible at all or rather will be a growing problem for international trade in contrast with successful tariff reductions. Ando (2001), which studied the pervasiveness of NTMs in APEC countries by the type of measures and industry, claims that compared to developing countries, developed countries depend more heavily on NTMs, inclusive non-core NTMs, so as to compensate for lowering protection by tariffs. She also revealed that agriculture and food industry is commonly and effectively protected by NTMs in APEC countries. These facts indicate that NTMs are and continue to be certainly serious issues.2
Second, it is hard to imagine that an economy would practically reduce both tariffs and NTMs at the same time to realize the overall trade liberalization. As tariffs are visible and relatively easy to negotiate, they have been and will be reduced more easily. In contrast, as mentioned above, NTMs are not transparent to their protective effects despite of the serious distortion, and thus it 1 As for the SPD, Gehlhar, et al. (1997) explain that despite their importance, data used in disaggregated multi-country general equilibrium models have not accurately and comprehensively incorporated most NTMs. 2 She also found that some countries use various types of NTMs together in their protecting industries while others apply a few types to almost all items in their protecting industries. For instance, Japan applies all types of NTMs together though the frequency ratio of each measure is not so high. In contrast, countries such as Australia and Chile depend on a few types of NTMs but
2
would take more time to negotiate and reduce them. Moreover, because of such undesirable features of NTMs, governments and domestic industries lobbying for protection have shown an inclination toward them. Considering the practical process of trade liberalization, it must be helpful to recognize to what extent the removal of NTMs itself would have an impact on economies, compared to tariff elimination.
Third, the effects of removal of non-core NTMs as well as core NTMs should be analyzed. Core NTMs have been reduced particularly because the rules on the NTM use were strengthened by the Uruguay Round (Bosworth, 1999). However, their declining trend seems to give rise to greater attention to non-core NTMs, particularly technical measures such as technical regulations, sanitary and phytosanitary (SPS) regulations, and customs and administrative procedures. As mentioned above, developed countries tend to rely on non-core NTMs, in addition to core NTMs, to protect their protecting industries. Thus, it is critical to introduce both core NTMs and non-core NTMs explicitly into a simulation model to analyze the economic impact of trade liberalization.
Our study attempts to quantify the economic impact of eliminating NTMs within the framework of GTAP simulation model, using very tentative estimates of tariff equivalents of NTMs obtained by Ando and Fujii (2001). To understand the economic impact of removing NTMs, we conduct three types of simulation: a case with eliminating tariffs, a case with eliminating core NTMs, and a case with removing overall (core and non-core) NTMs. By comparing one result with the others, we identify not only the relative magnitude of economic impact between the case with removing NTMs and that with eliminating tariffs but also the relative magnitude of economic impact between the case with and without eliminating non-core NTMs.
The remaining sections are organized as follows: section 2 describes how the data of NTMs applicable to the simulation model can be constructed. Section 3 presents aggregation and experiment design to conduct three types of simulation. Then, the simulation results are described in section 4, and the conclusion is in section 5.
2. Data Construction of NTMs
As for NTM data, the UNCTAD database, Trade Analysis and Information System
(TRAINS), is the only source of comprehensive information on NTMs. TRAINS provides the information on types of NTMs each country implement by Harmonized System (HS) commodity product categories (tariff lines). While such information is of use in identifying the incidence of NTMs, it is not applicable directly to the simulation model. Several steps are required to construct the data of NTMs comparable to tariffs, using the information available from TRAINS. This section, first, explains some drawbacks with this database and then briefly describes how the data of NTMs applicable to the simulation model can be constructed.
As is well known, there are some drawbacks with this database to be noted in employing
apply to almost all items in their protecting industries.
3
the data. First, the reliance on data may be doubtful since the underlying information is reported by the government of each country and is not sent back to confirm its accuracy. In some cases, the information on NTMs that have already removed is still included (PECC, 2000). Second, because of no consensus on NTMs to be reported, the types of measures reported are inconsistent across countries. While some countries provide detailed information on NTMs, others understand almost nothing about or do not properly report NTM use. In the case of a country with only a few NTMs reported, the small number of incidence can not necessarily be interpreted as low protection by NTMs. Third, the database does not have enough information on the types of technical measures (except technical regulations). Thus, it is more difficult to identify the pervasiveness of such much less transparent measures.
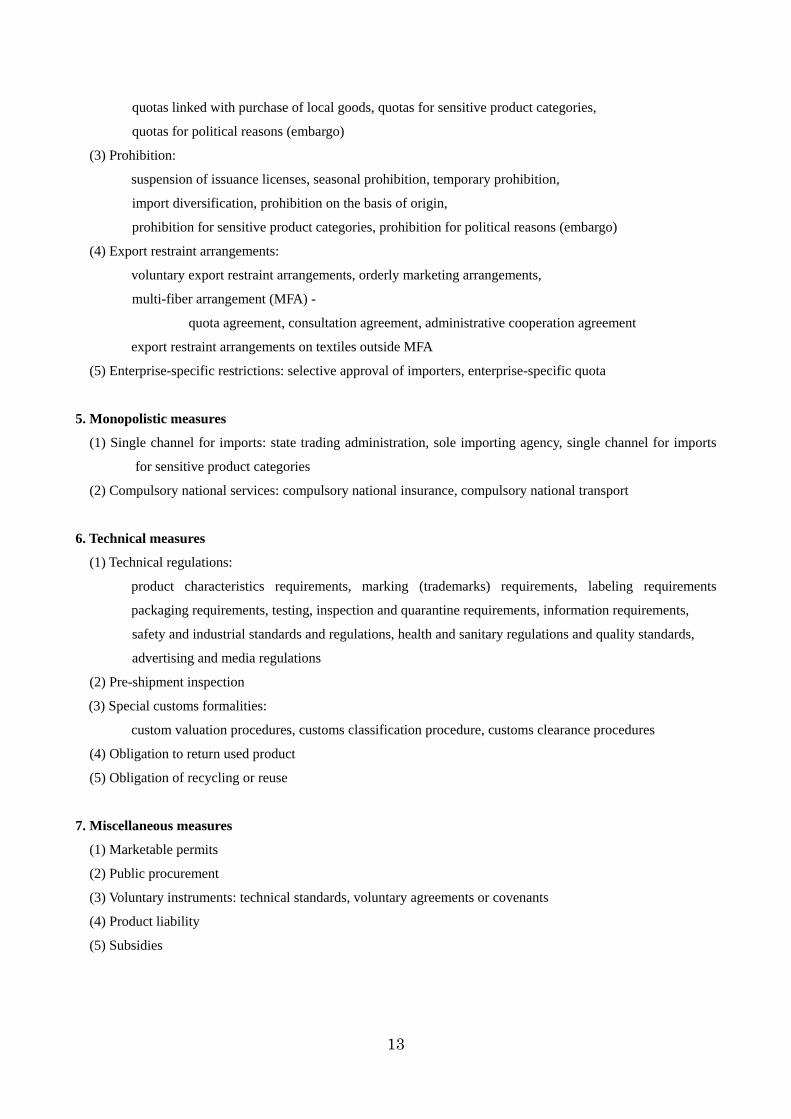
To quantify the economic impact of the removal of NTMs, our study uses preliminary estimates of tariff equivalents of NTMs by type and industry, which were tentatively estimated by Ando and Fujii (2001). Table 2.1. presents the preliminary estimates of tariff equivalents in 13 APEC economies. To obtain them, the following three steps are required. The first step is to calculate the magnitude of price differential due to NTMs, focusing on the price differential between the c.i.f. price of the import and the domestic producer price of the domestic substitute. Let
piM and be the price of the import and the domestic producer price of the domestic substitute
in industry ( ), respectively.
piD
i i = 1,L,21 PDiT stands for the magnitude of price differential due
to both tariffs and NTMs in industry. i PDiT can be calculated as follows:
PDiT = 100 × ( pD − pi i
M ) / piM .
Notice that critical assumption for this procedure is the homogeneity of imported goods and the
domestic substitutes. PDiN stands for the magnitude of price differential due to only NTMs in
industry. Let be the import tariff rate of industry. Then,
i
ti i PDiN can be obtained by subtracting
from ti iPDT .
PDiN = PDi
T − ti
i
.
The second step is to estimate price-distorting effect of each type of NTMs, using both
PDN obtained in the first step and frequency ratios of NTMs. The frequency ratio is the number of
HS commodity product categories subject to NTMs, expressed as a percentage of the total number of product categories in each HS group. The types of NTMs are 1:price control measures, 3:
4
auto-licensing measures, 4:quantity control measures, 5:monopolistic measures, and 6:technical measures.3 Denote by Fji the frequency ratio of j type of NTMs in industry ( i j =1,3,L,6 ). The base-case regression equation to obtain the parameters for transforming frequency measures into tariff equivalents is as follows:
PDiN = α + ˆ β jFjij∑
where α stands for intercept and the estimated coefficient of price-distorting effect of ˆ β j j
type of NTMs. Notice that the price-distorting effect of j type of NTMs, β j , is assumed to be common across industries. The preliminary estimates in Table 2.1. are calculated by using the estimated coefficients obtained from the regression analysis with additional control variable, income levels (GDP per capita).
The final step is to obtain tariff equivalents by type and industry, using and ˆ β j Fji . Denote
by TE ji tariff equivalent of j type of NTMs in industry. By multiplying by i ˆ β j Fji , TE ji
can be finally estimated.
TEji = ˆ β jFji .
Date descriptions for this process are as follows: the frequency ratios used in Ando and Fujii (2001) are from the Ando (2001), which calculated the ratios at HS 9-digit level.4 The years of NTM data in the analysis are the latest when each country has reported information on NTMs. Notice that the latest years available from UNCTAD database vary from country to country. For example, the years are 2000 for Canada, 1994 for Singapore and Thailand, and 1996-1999 for other APEC economies.
Unit prices of goods and price differentials are obtained as follows: domestic producer unit prices in local currency are calculated by dividing values by quantities. Values of domestic production are available from United Nations (various years), International Yearbook of Industrial Statistics at ISIC 4-digit level. Quantities of domestic production are from the United Nations (1998), Industrial Commodity Statistical Yearbook at ISIC 6-digit level. As quantity data are based on more detailed classification, they are aggregated to be matched with production value data.5 Notice that some quantity data are unable to be aggregated when their units are different from 3 Figures of the type follow the UNCTAD classification. 4 Ando (2001) calculated frequency ratios by type and industry as follows: first of all, measures reported by each country are classified into five types of NTMs as the above NTM classification since measures reported by each country are inconsistent among countries. Then, based on this typology, the number of HS tariff lines subject to NTMs is counted at HS 9-digit level. Finally, this number is divided by the total number of HS tariff lines. 5 For Australia, Canada, Indonesia, Japan, Korea, and Singapore, the data are based on ISIC rev.3,
5
others. Similarly, c.i.f. import unit prices in US dollars are calculated by dividing values by
quantities. Values and quantities of imports are from United Nations (1998), International Trade Statistics Yearbook at SITC 4-digit level. As for Australia, Canada, and United States, unit values of imported goods in local currency are directly taken from JETRO (various years), World Trade Atlas (compiled national statistics of each country) at HS 4-digit level.
To calculate the price differentials between c.i.f. import prices and domestic producer prices, the sectors of SITC 4-digit code/HS 4-digit code are matched with those of ISIC 4-digit code. In the case of countries with import prices in US dollars, domestic producer prices in local currency are converted into US dollars by exchange rates (period average), which are from the World Bank (2001).
Import tariff rates at HS 2-digit level are simple average of HS 9-digit tariff lines, which are available from UNCTAD (1999), TRAINS 1999 Winter Version (CD-ROM) and UNCTAD (2001), TRAINS 2001 Spring Version (CD-ROM).
In obtaining the magnitude of price differentials due to NTMs by subtracting tariff rates from that of price differentials due to both tariffs and NTMs, the sectors of ISIC 4-digit code are matched with HS 2-digit (97) commodity groups. Then, the price differentials due to NTMs at HS 2-digit level are simply averaged for the regression according to industry classification of frequency ratios of NTMs.
Due to the availability of NTM data, the years of unit values and those of import tariff rates are around those of NTM data.
3. Aggregation and Experiment Design
This section describes how our study aggregates the GTAP data (version 5) and conducts three
types of experiments to estimate the economic impact of removing NTMs in APEC countries within the framework of GTAP model. Table 3.1. displays our aggregation of regions and commodities. To focus on APEC economies, regions are aggregated as follows: 1.Australia (AUS), 2.New Zealand (NZL), 3.China (CHN), 4.Japan (JPN), 5.Korea (KOR), 6.Indonesia (IND), 7.Malaysia (MYS), 8.Singapore (SGP), 9.Thaliand (THA), 10.Canada (CAN), 11.United States (USA), 12.Mexico (MEX), 13.Chile (CHL), 14.Other Asian Countries (OAS), 15.Europe (EUR), and 16.Rest of the World (ROW). Since the focus of our research is on analyzing the effects of eliminating NTMs in APEC economies, all regions except 13 APEC countries, other Asian countries and Europe are lumped together in the rest of the world.
As for commodities, the following aggregation is employed in order to incorporate tariff equivalent rates of NTMs into the GTAP simulation models: 1.live animal and animal products, 2.vegetables, 3.other agriculture, 4.wood products, 5.minerals, 6.vegetable and animal oil and fats,
and for others the data are on ISIC rev.2.
6
7.food products, 8.textile, 9.leather, 10.pulp and paper products, 11.chemical products, 12.metal products, 13.transport equipment, 14.machinery products, 15.other manufacturing, and 16.services industry. Table 3.1. presents which commodities in the GTAP database are matched with product categories used in constructing NTM data.
With respect to factors, land and natural resources are lumped together as land, and skilled labor and unskilled labor as labor. Thus, there are three factors in our models, capital, land and labor.
Three types of experiments implemented with the GTAP data and the tentative tariff equivalent rates of NTMs are as follows: Experiment 1 (E1) presumes a case that each APEC country eliminates its tariffs, and Experiment 2 (E2) and Experiment 3 (E3) alternatively assume a case that each APEC country removes its NTMs. While E2 focuses on only core NTMs, E3 considers overall NTMs, that is, core NTMs plus non-core NTMs. For these experiments, we use the basic GTAP general equilibrium closure and default parameters. To compare with the results of E2 and E3, E1 removes ad valorem import tariffs (parameter tms) of each APEC country in only 13 industries with NTM data. Other parameters are not altered. Similarly, E2 and E3 remove core NTMs and overall NTMs of each APEC country in 13 industries, respectively. As NTM data are the rates of tariff equivalents, the removal of NTMs is operated as that of tariffs in the simulation.
By conducting these three types of experiments for each of 13 APEC countries, we will first observe how significantly the removal of NTMs influences the involved economies compared with that of tariffs. We will also see the relative magnitude of economic impact between the cases with and without eliminating non-core NTMs. Moreover, since three types of experiments are implemented for each APEC economy, we will find differences in the magnitude of economic impact of the trade liberalization in these countries.
4. Simulation Results
Table 4.1- Table 4.13 display the estimated changes in the economic welfare. Table 4.1 presents the results of three simulations on trade liberalization in Australia. Both cases of eliminating tariffs and NTMs in this country have a positive effect on the world welfare as a whole while there is a difference in the magnitude. The magnitude of the effect of removing NTMs is one-fifth times as large as that of tariffs. As for the two cases of NTMs with and without non-core NTMs, there is only a small difference between them. It implies that non-core NTMs do not have significant impact in this case.
Table 4.2 shows the results of simulations for New Zealand. Our simulation results indicate that elimination of trade barriers in this country has only a limited positive impact on its own welfare while a negative and relatively larger impact on Australian welfare. As for elimination of NTMs, the welfare effect on world economy is half as large as that of removing tariffs.
Table 4.3 shows the results for China. The removal of trade barrier in China has a significant positive impact on the world welfare. As for the magnitude, the effect of NTM
7
elimination on the world welfare is half as large as that of tariff elimination. The difference between the results with and without non-core NTMs is quite small.
The results for Japan are shown in Table 4.4. The tariff reduction in Japan is greatly beneficial to the welfare of world economy. In particular, China and two Oceanic countries enjoy considerable welfare gains through Japanese removal of tariffs. As for NTMs, while the removal of core NTMs decreases the world welfare as a whole, the total NTM reduction increases the world welfare. In both cases, surprisingly, the welfare in Japan deteriorates.
Table 4.5 displays the results for Korean cases. As Korean government reports only a little information on its NTM use and no information on non-core NTMs, we can not conduct the experiment regarding NTMs with non-core NTMs. The results of NTMs and tariffs indicate that the NTM reduction in Korea has a smaller impact on the world welfare than the tariff reduction does.
In the cases of Indonesia, Malaysia, and Thailand, whose results are shown in Tables 4.6, 4.7, and 4.9, respectively, the elimination of tariffs is quite beneficial to the own economy and to world economy as well. The elimination of NTMs also significantly improves the welfare not only in their economies but also in world economy as a whole. However, there are differences in the magnitude of the effect among them. In the case of Indonesia, the magnitude of the impact on its economy is quite small, and that on the world welfare is also relatively small. In contrast, the magnitude of the effect of removing NTMs in Malaysia and Thailand is large on the world welfare as well as on their own economies. Trade liberalization, that is, elimination of either tariffs or NTMs, in these two economies are very beneficial to the rest of Asian countries, especially to Japan. Japan can enjoy most of the welfare gain in the world from their trade liberalization.
The results for Singapore are presented in Table 4.8. As the level of trade protection in Singapore is low, the impact of trade liberalization on the world welfare is small in either case, whether tariffs or NTMs.
Table 4.10 shows the results for Canada. These results must be interpreted cautiously since the simulation accuracy is relatively low. They imply that world economy as well as Canada can enjoy the welfare increase through the removal of tariffs in Canada. In contrast, eliminating NTMs in this country brings a large welfare loss to both its own economy and world economy as a whole. This implies that NTM reduction in Canada is harmful to both Canadian welfare itself and world economic welfare.
The results for United States are displayed in Table 4.11. They suggest that trade liberalization in United States brings about serious welfare loss in its economy. However, more interestingly, the welfare in world economy as a whole significantly increases through either the removal of tariffs or NTMs in United States.
Table 4.12 shows the results for Mexico. Mexico’s tariff reduction has a beneficial effect on the welfare in Mexico itself and all other regions except United States. The removing core NTMs in this country has a positive welfare effect on United States and world economy as a whole. When non-core NTMs are considered in addition to core NTMs, United States and world economy as a
8
whole significantly enjoy the welfare increase while other members of NAFTA (including Mexico itself) experience the small welfare loss.
The results for Chile are shown in Table 4.13. They imply that elimination of tariffs in Chile is harmful to its own welfare while beneficial to the world welfare. As for NTMs, the results of both cases (core NTMs and total NTMs) show the similar results of the case of tariffs though the magnitude of the effects are small.
In summary, the effect of eliminating NTMs is smaller than that of removing tariffs but is not negligible at all. In particular, the removal of core NTMs brings a larger welfare improvement. This suggests that policymakers should make effort to remove not only tariffs but also NTMs, particular core NTMs to promote trade liberalization in the world and to increase in the world welfare. 5. Conclusion
In this paper, we have quantified the economic impact of eliminating NTMs in 13 APEC economies within the framework of GTAP simulation model by using the very preliminary estimates of tariff equivalents of NTMs. Most of the previous studies analyzing the effects of trade liberalization did not introduce NTMs explicitly into the model due to the deficiency of NTM data in the GTAP database. Considering their pervasiveness and growing interests in them as a means of protecting domestic producers, however, the issues of NTMs should be focused on in the analysis of the economic impact of trade liberalization.
To recognize to what extent the removal of NTMs has an impact on the economies, we have conducted three types of experiments: each experiment assumes that each APEC country removes tariffs, or core NTMs, or both core and non-core NTMs. By comparing one result with the others, we have identified not only the relative magnitude of economic impact between the case of removing NTMs and that of tariffs but also the relative magnitude of economic impact between the case with and without non-core NTMs.
Our results suggest that eliminating NTMs in each APEC economy has a significant impact on the involved economies while the magnitude is smaller than that of the case with removing tariffs. We should make an effort to remove not only tariffs but also NTMs to promote trade liberalization and to improve the world welfare. They also suggest that the economic impact of eliminating core NTMs is larger than that of removing non-core NTMs. If the removal of non-core NTMs is difficult because of the high political costs, it would be a good option that we remove at least core NTMs to achieve welfare improvement sufficiently.
Our challenge to estimate the impact of removing NTMs is very preliminary and incomplete. Further analysis will be needed to improve our analysis. First of all, the tentative estimates of tariff equivalents of NTMs could be improved with a better matching process of calculating unit values and the price differentials. As Ando and Fujii (2001) discussed, several steps
9
are considered to improve the matching process. The first step is the process of matching value data of domestic production/imports with their quantity data to calculate unit values. The second step is the process of matching unit values of imports with those of the domestic substitutes to obtain price differentials. Due to the differences in unit between them, lots of information on unit values is omitted in the estimation. Moreover, because of the differences in statistical code between them, the quality of some price differentials may be doubtful. With the data of better quality and of more disaggregated, the matching process and the quality of both unit values and the price differentials would be improved.
The estimates could be also improved with more recent data. Due to the availability of NTM data, the years in the analysis are inconsistent across 13 APEC countries and are very old in some countries. Moreover, as for a few countries, the years of price differentials are inconsistent with (older than) those of NTMs due to the data deficiency of domestic production/international trade. Thus, if more recent data of them are available, these problems would be solved.
Another possibility to improve the estimates is to calculate, first, the price distorting effect of each type of NTMs by focusing on a specific country with well disaggregated data, for instance, Japan. And then, tariff equivalents of NTMs in other countries are also estimated with the estimated coefficients in that country.
As a further extension, the analysis of trade liberalization including NTMs in non-member countries of APEC would be very interesting.
10
Reference Ando, M. “The Pervasiveness of Non Tariff Measures in APEC Countries.” Mimeo, Keio
University, 2001 Ando, M. and T. Fujii. “The Costs of Trade Protection: Estimationg Tariff Equivalents of Non Tariff
Measures in APEC Economies.“ Mimeo, Keio University, 2001 Baldwin, R. E. Nontariff Distortions of International Trade. Washington D.C.: Brookings Institution,
1970. Bosworth, M. “Non-Tariff Measures as Trade Barriers-Yesterday's Problem or What?” paper
presented at The OECD Workshop with Non-Member Economies on Barriers to Trade in Goods and Services in the Post-Uruguay Round Context, 1999.
Deardorff, A. V. and R. M. Stern. Measurement of Nontariff Barriers. Ann Arbor: U. Michigan Press, 1998.
Francois, J. F., and K. A. Reinert. Applied Methods for Trade Policy Analysis. Cambridge: Cambridge University Press, 1997.
Gehlhar, M. et al. “Overview of the GTAP Data Base.” Global Trade Analysis: Modeling and Applications. T. Hartel, ed. New York: Cambridge University Press, 1997.
Hartel, T. W. Global Trade Analysis: Modeling and Applications. New York: Cambridge University Press, 1997.
Ministry of International Trade and Investment. 1999 Report on the WTO Consistency of Trade Policies by Major Trading Partners. Tokyo: Ministry of International Trade and Industry, 1999.
Ministry of Economy, Trade and Investment. White Paper on International Trade 2001. Tokyo: Gyosei, 2001.
Organization for Economic Cooperation and Development. Indicators of Tariff and Non-tariff Trade Barriers. Paris: Organization for Economic Cooperation and Development, 1997.
Pacific Economic Cooperation Council. Non-tariff measures in goods and services trade. Singapore: Pacific Economic Cooperation Council, 2000.
Sazanami, Y., S. Urata and H. Kawai. Measuring the Costs of Protection in Japan. Washington, DC: Institute for International Economics, 1995.
United Nations Conference on Trade and Development. Trade Analysis and Information System (CD-ROM). Geneva: United Nations Conference on Trade and Development, 2001.
Young, L. M. and K. M. Huff. “Free Trade in the Pacific Rim: On What Basis?” Global Trade Analysis: Modeling and Applications. T. Hartel, ed. New York: Cambridge University Press, 1997.
11
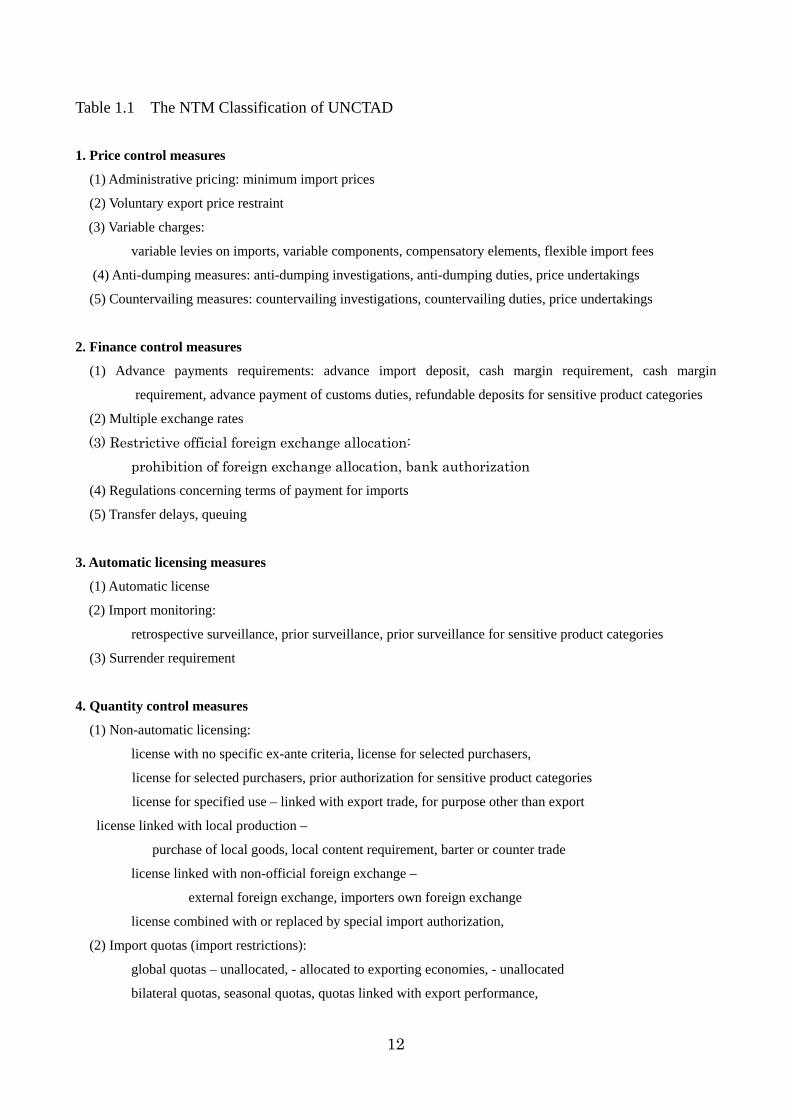
Table 1.1 The NTM Classification of UNCTAD
1. Price control measures
(1) Administrative pricing: minimum import prices
(2) Voluntary export price restraint
(3) Variable charges:
variable levies on imports, variable components, compensatory elements, flexible import fees
(4) Anti-dumping measures: anti-dumping investigations, anti-dumping duties, price undertakings
(5) Countervailing measures: countervailing investigations, countervailing duties, price undertakings
2. Finance control measures
(1) Advance payments requirements: advance import deposit, cash margin requirement, cash margin
requirement, advance payment of customs duties, refundable deposits for sensitive product categories
(2) Multiple exchange rates
(3) Restrictive official foreign exchange allocation: prohibition of foreign exchange allocation, bank authorization
(4) Regulations concerning terms of payment for imports
(5) Transfer delays, queuing
3. Automatic licensing measures
(1) Automatic license
(2) Import monitoring:
retrospective surveillance, prior surveillance, prior surveillance for sensitive product categories
(3) Surrender requirement
4. Quantity control measures
(1) Non-automatic licensing:
license with no specific ex-ante criteria, license for selected purchasers,
license for selected purchasers, prior authorization for sensitive product categories
license for specified use – linked with export trade, for purpose other than export
license linked with local production –
purchase of local goods, local content requirement, barter or counter trade
license linked with non-official foreign exchange –
external foreign exchange, importers own foreign exchange
license combined with or replaced by special import authorization,
(2) Import quotas (import restrictions):
global quotas – unallocated, - allocated to exporting economies, - unallocated
bilateral quotas, seasonal quotas, quotas linked with export performance,
12
quotas linked with purchase of local goods, quotas for sensitive product categories,
quotas for political reasons (embargo)
(3) Prohibition:
suspension of issuance licenses, seasonal prohibition, temporary prohibition,
import diversification, prohibition on the basis of origin,
prohibition for sensitive product categories, prohibition for political reasons (embargo)
(4) Export restraint arrangements:
voluntary export restraint arrangements, orderly marketing arrangements,
multi-fiber arrangement (MFA) -
quota agreement, consultation agreement, administrative cooperation agreement
export restraint arrangements on textiles outside MFA
(5) Enterprise-specific restrictions: selective approval of importers, enterprise-specific quota
5. Monopolistic measures
(1) Single channel for imports: state trading administration, sole importing agency, single channel for imports
for sensitive product categories
(2) Compulsory national services: compulsory national insurance, compulsory national transport
6. Technical measures
(1) Technical regulations:
product characteristics requirements, marking (trademarks) requirements, labeling requirements
packaging requirements, testing, inspection and quarantine requirements, information requirements,
safety and industrial standards and regulations, health and sanitary regulations and quality standards,
advertising and media regulations
(2) Pre-shipment inspection
(3) Special customs formalities:
custom valuation procedures, customs classification procedure, customs clearance procedures
(4) Obligation to return used product
(5) Obligation of recycling or reuse
7. Miscellaneous measures
(1) Marketable permits
(2) Public procurement
(3) Voluntary instruments: technical standards, voluntary agreements or covenants
(4) Product liability
(5) Subsidies
13
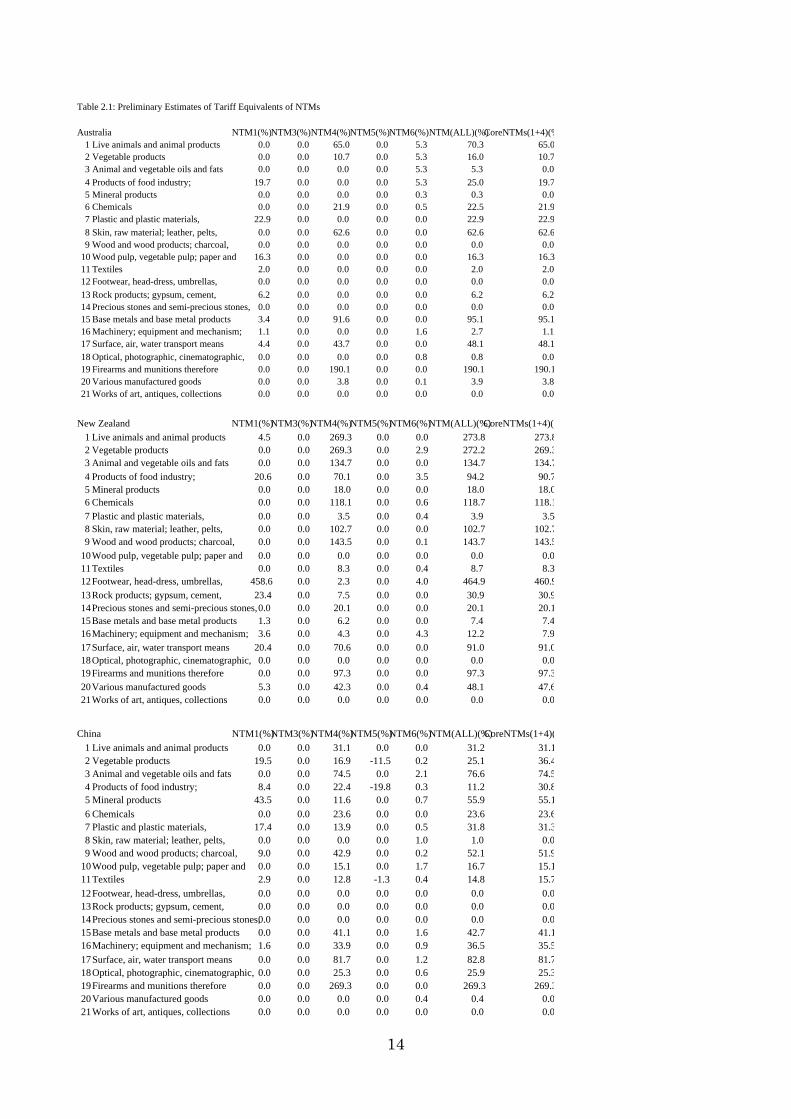
Table 2.1: Preliminary Estimates of Tariff Equivalents of NTMs
Australia NTM1(%)NTM3(%)NTM4(%)NTM5(%)NTM6(%)NTM(ALL)(%)CoreNTMs(1+4)(%1 Live animals and animal products 0.0 0.0 65.0 0.0 5.3 70.3 65.02 Vegetable products 0.0 0.0 10.7 0.0 5.3 16.0 10.73 Animal and vegetable oils and fats 0.0 0.0 0.0 0.0 5.3 5.3 0.04 Products of food industry; 19.7 0.0 0.0 0.0 5.3 25.0 19.75 Mineral products 0.0 0.0 0.0 0.0 0.3 0.3 0.06 Chemicals 0.0 0.0 21.9 0.0 0.5 22.5 21.97 Plastic and plastic materials, 22.9 0.0 0.0 0.0 0.0 22.9 22.98 Skin, raw material; leather, pelts, 0.0 0.0 62.6 0.0 0.0 62.6 62.69 Wood and wood products; charcoal, 0.0 0.0 0.0 0.0 0.0 0.0 0.0
10 Wood pulp, vegetable pulp; paper and 16.3 0.0 0.0 0.0 0.0 16.3 16.311 Textiles 2.0 0.0 0.0 0.0 0.0 2.0 2.012 Footwear, head-dress, umbrellas, 0.0 0.0 0.0 0.0 0.0 0.0 0.013 Rock products; gypsum, cement, 6.2 0.0 0.0 0.0 0.0 6.2 6.214 Precious stones and semi-precious stones, 0.0 0.0 0.0 0.0 0.0 0.0 0.015 Base metals and base metal products 3.4 0.0 91.6 0.0 0.0 95.1 95.116 Machinery; equipment and mechanism; 1.1 0.0 0.0 0.0 1.6 2.7 1.117 Surface, air, water transport means 4.4 0.0 43.7 0.0 0.0 48.1 48.118 Optical, photographic, cinematographic, 0.0 0.0 0.0 0.0 0.8 0.8 0.019 Firearms and munitions therefore 0.0 0.0 190.1 0.0 0.0 190.1 190.120 Various manufactured goods 0.0 0.0 3.8 0.0 0.1 3.9 3.821 Works of art, antiques, collections 0.0 0.0 0.0 0.0 0.0 0.0 0.0
New Zealand NTM1(%)NTM3(%)NTM4(%)NTM5(%)NTM6(%)NTM(ALL)(%)CoreNTMs(1+4)(%1 Live animals and animal products 4.5 0.0 269.3 0.0 0.0 273.8 273.82 Vegetable products 0.0 0.0 269.3 0.0 2.9 272.2 269.33 Animal and vegetable oils and fats 0.0 0.0 134.7 0.0 0.0 134.7 134.74 Products of food industry; 20.6 0.0 70.1 0.0 3.5 94.2 90.75 Mineral products 0.0 0.0 18.0 0.0 0.0 18.0 18.06 Chemicals 0.0 0.0 118.1 0.0 0.6 118.7 118.17 Plastic and plastic materials, 0.0 0.0 3.5 0.0 0.4 3.9 3.58 Skin, raw material; leather, pelts, 0.0 0.0 102.7 0.0 0.0 102.7 102.79 Wood and wood products; charcoal, 0.0 0.0 143.5 0.0 0.1 143.7 143.5
10Wood pulp, vegetable pulp; paper and 0.0 0.0 0.0 0.0 0.0 0.0 0.011Textiles 0.0 0.0 8.3 0.0 0.4 8.7 8.312Footwear, head-dress, umbrellas, 458.6 0.0 2.3 0.0 4.0 464.9 460.913Rock products; gypsum, cement, 23.4 0.0 7.5 0.0 0.0 30.9 30.914Precious stones and semi-precious stones,0.0 0.0 20.1 0.0 0.0 20.1 20.115Base metals and base metal products 1.3 0.0 6.2 0.0 0.0 7.4 7.416Machinery; equipment and mechanism; 3.6 0.0 4.3 0.0 4.3 12.2 7.917Surface, air, water transport means 20.4 0.0 70.6 0.0 0.0 91.0 91.018Optical, photographic, cinematographic, 0.0 0.0 0.0 0.0 0.0 0.0 0.019Firearms and munitions therefore 0.0 0.0 97.3 0.0 0.0 97.3 97.320Various manufactured goods 5.3 0.0 42.3 0.0 0.4 48.1 47.621Works of art, antiques, collections 0.0 0.0 0.0 0.0 0.0 0.0 0.0
China NTM1(%)NTM3(%)NTM4(%)NTM5(%)NTM6(%)NTM(ALL)(%)CoreNTMs(1+4)(1 Live animals and animal products 0.0 0.0 31.1 0.0 0.0 31.2 31.12 Vegetable products 19.5 0.0 16.9 -11.5 0.2 25.1 36.43 Animal and vegetable oils and fats 0.0 0.0 74.5 0.0 2.1 76.6 74.54 Products of food industry; 8.4 0.0 22.4 -19.8 0.3 11.2 30.85 Mineral products 43.5 0.0 11.6 0.0 0.7 55.9 55.16 Chemicals 0.0 0.0 23.6 0.0 0.0 23.6 23.67 Plastic and plastic materials, 17.4 0.0 13.9 0.0 0.5 31.8 31.38 Skin, raw material; leather, pelts, 0.0 0.0 0.0 0.0 1.0 1.0 0.09 Wood and wood products; charcoal, 9.0 0.0 42.9 0.0 0.2 52.1 51.9
10Wood pulp, vegetable pulp; paper and 0.0 0.0 15.1 0.0 1.7 16.7 15.111Textiles 2.9 0.0 12.8 -1.3 0.4 14.8 15.712Footwear, head-dress, umbrellas, 0.0 0.0 0.0 0.0 0.0 0.0 0.013Rock products; gypsum, cement, 0.0 0.0 0.0 0.0 0.0 0.0 0.014Precious stones and semi-precious stones,0.0 0.0 0.0 0.0 0.0 0.0 0.015Base metals and base metal products 0.0 0.0 41.1 0.0 1.6 42.7 41.116Machinery; equipment and mechanism; 1.6 0.0 33.9 0.0 0.9 36.5 35.517Surface, air, water transport means 0.0 0.0 81.7 0.0 1.2 82.8 81.718Optical, photographic, cinematographic, 0.0 0.0 25.3 0.0 0.6 25.9 25.319Firearms and munitions therefore 0.0 0.0 269.3 0.0 0.0 269.3 269.320Various manufactured goods 0.0 0.0 0.0 0.0 0.4 0.4 0.021Works of art, antiques, collections 0.0 0.0 0.0 0.0 0.0 0.0 0.0
14
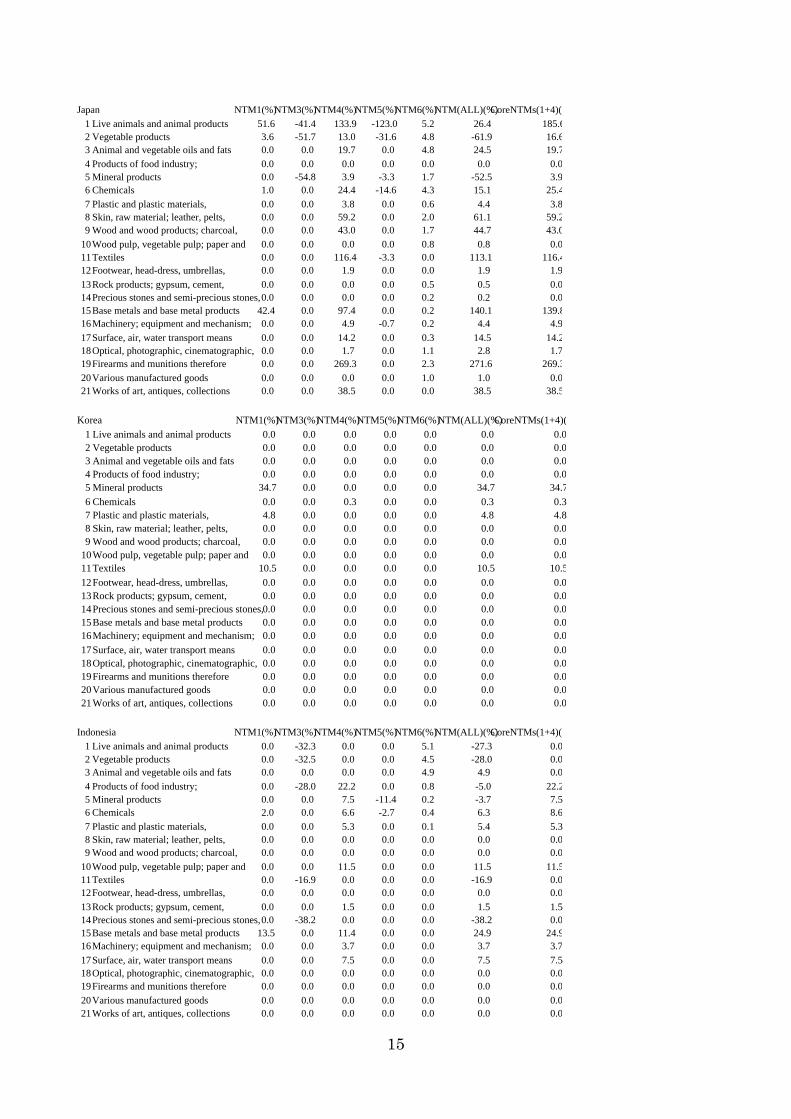
Japan NTM1(%)NTM3(%)NTM4(%)NTM5(%)NTM6(%)NTM(ALL)(%)CoreNTMs(1+4)(1 Live animals and animal products 51.6 -41.4 133.9 -123.0 5.2 26.4 185.62 Vegetable products 3.6 -51.7 13.0 -31.6 4.8 -61.9 16.63 Animal and vegetable oils and fats 0.0 0.0 19.7 0.0 4.8 24.5 19.74 Products of food industry; 0.0 0.0 0.0 0.0 0.0 0.0 0.05 Mineral products 0.0 -54.8 3.9 -3.3 1.7 -52.5 3.96 Chemicals 1.0 0.0 24.4 -14.6 4.3 15.1 25.47 Plastic and plastic materials, 0.0 0.0 3.8 0.0 0.6 4.4 3.88 Skin, raw material; leather, pelts, 0.0 0.0 59.2 0.0 2.0 61.1 59.29 Wood and wood products; charcoal, 0.0 0.0 43.0 0.0 1.7 44.7 43.0
10Wood pulp, vegetable pulp; paper and 0.0 0.0 0.0 0.0 0.8 0.8 0.011Textiles 0.0 0.0 116.4 -3.3 0.0 113.1 116.412Footwear, head-dress, umbrellas, 0.0 0.0 1.9 0.0 0.0 1.9 1.913Rock products; gypsum, cement, 0.0 0.0 0.0 0.0 0.5 0.5 0.014Precious stones and semi-precious stones,0.0 0.0 0.0 0.0 0.2 0.2 0.015Base metals and base metal products 42.4 0.0 97.4 0.0 0.2 140.1 139.816Machinery; equipment and mechanism; 0.0 0.0 4.9 -0.7 0.2 4.4 4.917Surface, air, water transport means 0.0 0.0 14.2 0.0 0.3 14.5 14.218Optical, photographic, cinematographic, 0.0 0.0 1.7 0.0 1.1 2.8 1.719Firearms and munitions therefore 0.0 0.0 269.3 0.0 2.3 271.6 269.320Various manufactured goods 0.0 0.0 0.0 0.0 1.0 1.0 0.021Works of art, antiques, collections 0.0 0.0 38.5 0.0 0.0 38.5 38.5
Korea NTM1(%)NTM3(%)NTM4(%)NTM5(%)NTM6(%)NTM(ALL)(%)CoreNTMs(1+4)(1 Live animals and animal products 0.0 0.0 0.0 0.0 0.0 0.0 0.02 Vegetable products 0.0 0.0 0.0 0.0 0.0 0.0 0.03 Animal and vegetable oils and fats 0.0 0.0 0.0 0.0 0.0 0.0 0.04 Products of food industry; 0.0 0.0 0.0 0.0 0.0 0.0 0.05 Mineral products 34.7 0.0 0.0 0.0 0.0 34.7 34.76 Chemicals 0.0 0.0 0.3 0.0 0.0 0.3 0.37 Plastic and plastic materials, 4.8 0.0 0.0 0.0 0.0 4.8 4.88 Skin, raw material; leather, pelts, 0.0 0.0 0.0 0.0 0.0 0.0 0.09 Wood and wood products; charcoal, 0.0 0.0 0.0 0.0 0.0 0.0 0.0
10Wood pulp, vegetable pulp; paper and 0.0 0.0 0.0 0.0 0.0 0.0 0.011Textiles 10.5 0.0 0.0 0.0 0.0 10.5 10.512Footwear, head-dress, umbrellas, 0.0 0.0 0.0 0.0 0.0 0.0 0.013Rock products; gypsum, cement, 0.0 0.0 0.0 0.0 0.0 0.0 0.014Precious stones and semi-precious stones,0.0 0.0 0.0 0.0 0.0 0.0 0.015Base metals and base metal products 0.0 0.0 0.0 0.0 0.0 0.0 0.016Machinery; equipment and mechanism; 0.0 0.0 0.0 0.0 0.0 0.0 0.017Surface, air, water transport means 0.0 0.0 0.0 0.0 0.0 0.0 0.018Optical, photographic, cinematographic, 0.0 0.0 0.0 0.0 0.0 0.0 0.019Firearms and munitions therefore 0.0 0.0 0.0 0.0 0.0 0.0 0.020Various manufactured goods 0.0 0.0 0.0 0.0 0.0 0.0 0.021Works of art, antiques, collections 0.0 0.0 0.0 0.0 0.0 0.0 0.0
Indonesia NTM1(%)NTM3(%)NTM4(%)NTM5(%)NTM6(%)NTM(ALL)(%)CoreNTMs(1+4)(1 Live animals and animal products 0.0 -32.3 0.0 0.0 5.1 -27.3 0.02 Vegetable products 0.0 -32.5 0.0 0.0 4.5 -28.0 0.03 Animal and vegetable oils and fats 0.0 0.0 0.0 0.0 4.9 4.9 0.04 Products of food industry; 0.0 -28.0 22.2 0.0 0.8 -5.0 22.25 Mineral products 0.0 0.0 7.5 -11.4 0.2 -3.7 7.56 Chemicals 2.0 0.0 6.6 -2.7 0.4 6.3 8.67 Plastic and plastic materials, 0.0 0.0 5.3 0.0 0.1 5.4 5.38 Skin, raw material; leather, pelts, 0.0 0.0 0.0 0.0 0.0 0.0 0.09 Wood and wood products; charcoal, 0.0 0.0 0.0 0.0 0.0 0.0 0.0
10Wood pulp, vegetable pulp; paper and 0.0 0.0 11.5 0.0 0.0 11.5 11.511Textiles 0.0 -16.9 0.0 0.0 0.0 -16.9 0.012Footwear, head-dress, umbrellas, 0.0 0.0 0.0 0.0 0.0 0.0 0.013Rock products; gypsum, cement, 0.0 0.0 1.5 0.0 0.0 1.5 1.514Precious stones and semi-precious stones,0.0 -38.2 0.0 0.0 0.0 -38.2 0.015Base metals and base metal products 13.5 0.0 11.4 0.0 0.0 24.9 24.916Machinery; equipment and mechanism; 0.0 0.0 3.7 0.0 0.0 3.7 3.717Surface, air, water transport means 0.0 0.0 7.5 0.0 0.0 7.5 7.518Optical, photographic, cinematographic, 0.0 0.0 0.0 0.0 0.0 0.0 0.019Firearms and munitions therefore 0.0 0.0 0.0 0.0 0.0 0.0 0.020Various manufactured goods 0.0 0.0 0.0 0.0 0.0 0.0 0.021Works of art, antiques, collections 0.0 0.0 0.0 0.0 0.0 0.0 0.0
15
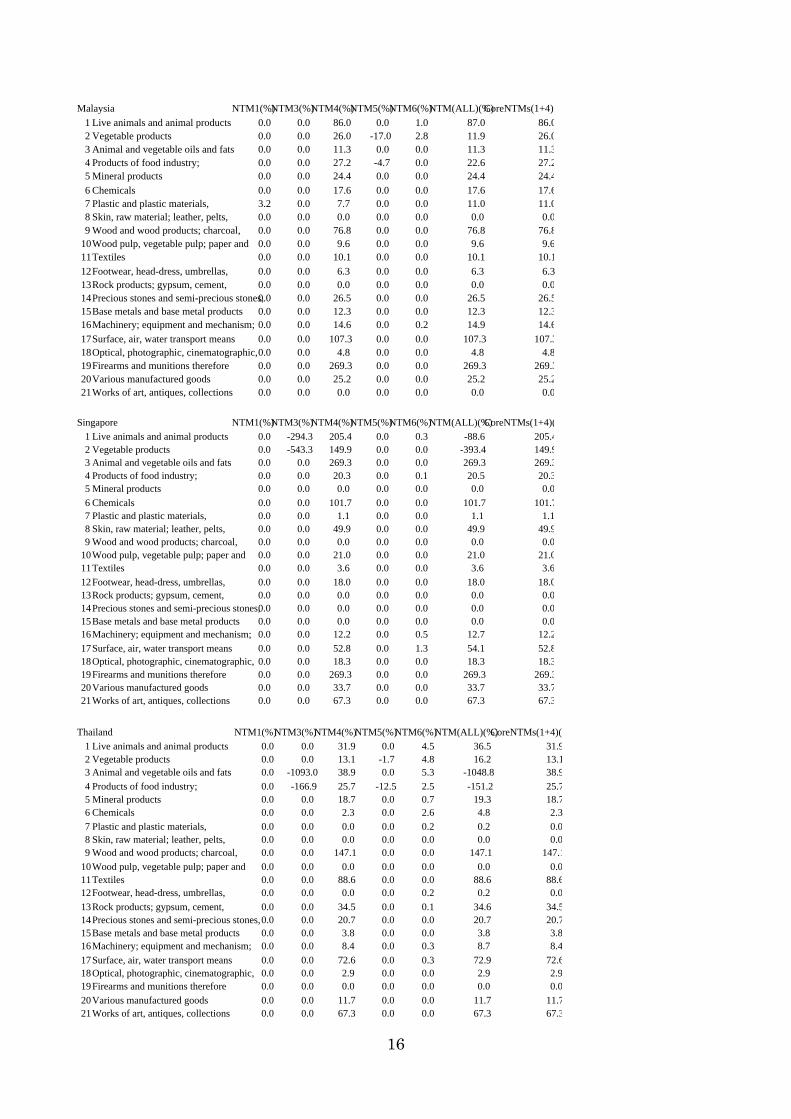
Malaysia NTM1(%)NTM3(%)NTM4(%)NTM5(%)NTM6(%)NTM(ALL)(%)CoreNTMs(1+4)(1 Live animals and animal products 0.0 0.0 86.0 0.0 1.0 87.0 86.02 Vegetable products 0.0 0.0 26.0 -17.0 2.8 11.9 26.03 Animal and vegetable oils and fats 0.0 0.0 11.3 0.0 0.0 11.3 11.34 Products of food industry; 0.0 0.0 27.2 -4.7 0.0 22.6 27.25 Mineral products 0.0 0.0 24.4 0.0 0.0 24.4 24.46 Chemicals 0.0 0.0 17.6 0.0 0.0 17.6 17.67 Plastic and plastic materials, 3.2 0.0 7.7 0.0 0.0 11.0 11.08 Skin, raw material; leather, pelts, 0.0 0.0 0.0 0.0 0.0 0.0 0.09 Wood and wood products; charcoal, 0.0 0.0 76.8 0.0 0.0 76.8 76.8
10Wood pulp, vegetable pulp; paper and 0.0 0.0 9.6 0.0 0.0 9.6 9.611Textiles 0.0 0.0 10.1 0.0 0.0 10.1 10.112Footwear, head-dress, umbrellas, 0.0 0.0 6.3 0.0 0.0 6.3 6.313Rock products; gypsum, cement, 0.0 0.0 0.0 0.0 0.0 0.0 0.014Precious stones and semi-precious stones,0.0 0.0 26.5 0.0 0.0 26.5 26.515Base metals and base metal products 0.0 0.0 12.3 0.0 0.0 12.3 12.316Machinery; equipment and mechanism; 0.0 0.0 14.6 0.0 0.2 14.9 14.617Surface, air, water transport means 0.0 0.0 107.3 0.0 0.0 107.3 107.318Optical, photographic, cinematographic, 0.0 0.0 4.8 0.0 0.0 4.8 4.819Firearms and munitions therefore 0.0 0.0 269.3 0.0 0.0 269.3 269.320Various manufactured goods 0.0 0.0 25.2 0.0 0.0 25.2 25.221Works of art, antiques, collections 0.0 0.0 0.0 0.0 0.0 0.0 0.0
Singapore NTM1(%)NTM3(%)NTM4(%)NTM5(%)NTM6(%)NTM(ALL)(%)CoreNTMs(1+4)(1 Live animals and animal products 0.0 -294.3 205.4 0.0 0.3 -88.6 205.42 Vegetable products 0.0 -543.3 149.9 0.0 0.0 -393.4 149.93 Animal and vegetable oils and fats 0.0 0.0 269.3 0.0 0.0 269.3 269.34 Products of food industry; 0.0 0.0 20.3 0.0 0.1 20.5 20.35 Mineral products 0.0 0.0 0.0 0.0 0.0 0.0 0.06 Chemicals 0.0 0.0 101.7 0.0 0.0 101.7 101.77 Plastic and plastic materials, 0.0 0.0 1.1 0.0 0.0 1.1 1.18 Skin, raw material; leather, pelts, 0.0 0.0 49.9 0.0 0.0 49.9 49.99 Wood and wood products; charcoal, 0.0 0.0 0.0 0.0 0.0 0.0 0.0
10Wood pulp, vegetable pulp; paper and 0.0 0.0 21.0 0.0 0.0 21.0 21.011Textiles 0.0 0.0 3.6 0.0 0.0 3.6 3.612Footwear, head-dress, umbrellas, 0.0 0.0 18.0 0.0 0.0 18.0 18.013Rock products; gypsum, cement, 0.0 0.0 0.0 0.0 0.0 0.0 0.014Precious stones and semi-precious stones,0.0 0.0 0.0 0.0 0.0 0.0 0.015Base metals and base metal products 0.0 0.0 0.0 0.0 0.0 0.0 0.016Machinery; equipment and mechanism; 0.0 0.0 12.2 0.0 0.5 12.7 12.217Surface, air, water transport means 0.0 0.0 52.8 0.0 1.3 54.1 52.818Optical, photographic, cinematographic, 0.0 0.0 18.3 0.0 0.0 18.3 18.319Firearms and munitions therefore 0.0 0.0 269.3 0.0 0.0 269.3 269.320Various manufactured goods 0.0 0.0 33.7 0.0 0.0 33.7 33.721Works of art, antiques, collections 0.0 0.0 67.3 0.0 0.0 67.3 67.3
Thailand NTM1(%)NTM3(%)NTM4(%)NTM5(%)NTM6(%)NTM(ALL)(%)CoreNTMs(1+4)(1 Live animals and animal products 0.0 0.0 31.9 0.0 4.5 36.5 31.92 Vegetable products 0.0 0.0 13.1 -1.7 4.8 16.2 13.13 Animal and vegetable oils and fats 0.0 -1093.0 38.9 0.0 5.3 -1048.8 38.94 Products of food industry; 0.0 -166.9 25.7 -12.5 2.5 -151.2 25.75 Mineral products 0.0 0.0 18.7 0.0 0.7 19.3 18.76 Chemicals 0.0 0.0 2.3 0.0 2.6 4.8 2.37 Plastic and plastic materials, 0.0 0.0 0.0 0.0 0.2 0.2 0.08 Skin, raw material; leather, pelts, 0.0 0.0 0.0 0.0 0.0 0.0 0.09 Wood and wood products; charcoal, 0.0 0.0 147.1 0.0 0.0 147.1 147.1
10Wood pulp, vegetable pulp; paper and 0.0 0.0 0.0 0.0 0.0 0.0 0.011Textiles 0.0 0.0 88.6 0.0 0.0 88.6 88.612Footwear, head-dress, umbrellas, 0.0 0.0 0.0 0.0 0.2 0.2 0.013Rock products; gypsum, cement, 0.0 0.0 34.5 0.0 0.1 34.6 34.514Precious stones and semi-precious stones,0.0 0.0 20.7 0.0 0.0 20.7 20.715Base metals and base metal products 0.0 0.0 3.8 0.0 0.0 3.8 3.816Machinery; equipment and mechanism; 0.0 0.0 8.4 0.0 0.3 8.7 8.417Surface, air, water transport means 0.0 0.0 72.6 0.0 0.3 72.9 72.618Optical, photographic, cinematographic, 0.0 0.0 2.9 0.0 0.0 2.9 2.919Firearms and munitions therefore 0.0 0.0 0.0 0.0 0.0 0.0 0.020Various manufactured goods 0.0 0.0 11.7 0.0 0.0 11.7 11.721Works of art, antiques, collections 0.0 0.0 67.3 0.0 0.0 67.3 67.3
16
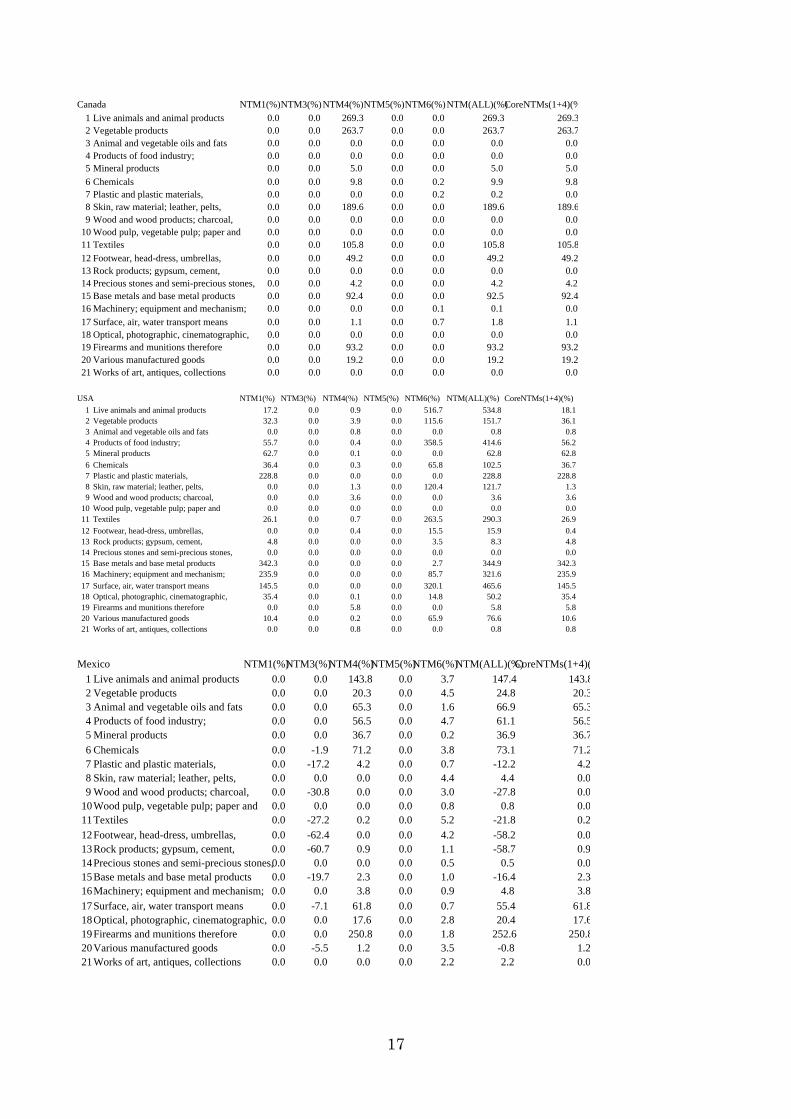
Canada NTM1(%)NTM3(%)NTM4(%)NTM5(%)NTM6(%)NTM(ALL)(%)CoreNTMs(1+4)(%1 Live animals and animal products 0.0 0.0 269.3 0.0 0.0 269.3 269.32 Vegetable products 0.0 0.0 263.7 0.0 0.0 263.7 263.73 Animal and vegetable oils and fats 0.0 0.0 0.0 0.0 0.0 0.0 0.04 Products of food industry; 0.0 0.0 0.0 0.0 0.0 0.0 0.05 Mineral products 0.0 0.0 5.0 0.0 0.0 5.0 5.06 Chemicals 0.0 0.0 9.8 0.0 0.2 9.9 9.87 Plastic and plastic materials, 0.0 0.0 0.0 0.0 0.2 0.2 0.08 Skin, raw material; leather, pelts, 0.0 0.0 189.6 0.0 0.0 189.6 189.69 Wood and wood products; charcoal, 0.0 0.0 0.0 0.0 0.0 0.0 0.0
10 Wood pulp, vegetable pulp; paper and 0.0 0.0 0.0 0.0 0.0 0.0 0.011 Textiles 0.0 0.0 105.8 0.0 0.0 105.8 105.812 Footwear, head-dress, umbrellas, 0.0 0.0 49.2 0.0 0.0 49.2 49.213 Rock products; gypsum, cement, 0.0 0.0 0.0 0.0 0.0 0.0 0.014 Precious stones and semi-precious stones, 0.0 0.0 4.2 0.0 0.0 4.2 4.215 Base metals and base metal products 0.0 0.0 92.4 0.0 0.0 92.5 92.416 Machinery; equipment and mechanism; 0.0 0.0 0.0 0.0 0.1 0.1 0.017 Surface, air, water transport means 0.0 0.0 1.1 0.0 0.7 1.8 1.118 Optical, photographic, cinematographic, 0.0 0.0 0.0 0.0 0.0 0.0 0.019 Firearms and munitions therefore 0.0 0.0 93.2 0.0 0.0 93.2 93.220 Various manufactured goods 0.0 0.0 19.2 0.0 0.0 19.2 19.221 Works of art, antiques, collections 0.0 0.0 0.0 0.0 0.0 0.0 0.0
USA NTM1(%) NTM3(%) NTM4(%) NTM5(%) NTM6(%) NTM(ALL)(%) CoreNTMs(1+4)(%)1 Live animals and animal products 17.2 0.0 0.9 0.0 516.7 534.8 18.12 Vegetable products 32.3 0.0 3.9 0.0 115.6 151.7 36.13 Animal and vegetable oils and fats 0.0 0.0 0.8 0.0 0.0 0.8 0.84 Products of food industry; 55.7 0.0 0.4 0.0 358.5 414.6 56.25 Mineral products 62.7 0.0 0.1 0.0 0.0 62.8 62.86 Chemicals 36.4 0.0 0.3 0.0 65.8 102.5 36.77 Plastic and plastic materials, 228.8 0.0 0.0 0.0 0.0 228.8 228.88 Skin, raw material; leather, pelts, 0.0 0.0 1.3 0.0 120.4 121.7 1.39 Wood and wood products; charcoal, 0.0 0.0 3.6 0.0 0.0 3.6 3.6
10 Wood pulp, vegetable pulp; paper and 0.0 0.0 0.0 0.0 0.0 0.0 0.011 Textiles 26.1 0.0 0.7 0.0 263.5 290.3 26.912 Footwear, head-dress, umbrellas, 0.0 0.0 0.4 0.0 15.5 15.9 0.413 Rock products; gypsum, cement, 4.8 0.0 0.0 0.0 3.5 8.3 4.814 Precious stones and semi-precious stones, 0.0 0.0 0.0 0.0 0.0 0.0 0.015 Base metals and base metal products 342.3 0.0 0.0 0.0 2.7 344.9 342.316 Machinery; equipment and mechanism; 235.9 0.0 0.0 0.0 85.7 321.6 235.917 Surface, air, water transport means 145.5 0.0 0.0 0.0 320.1 465.6 145.518 Optical, photographic, cinematographic, 35.4 0.0 0.1 0.0 14.8 50.2 35.419 Firearms and munitions therefore 0.0 0.0 5.8 0.0 0.0 5.8 5.820 Various manufactured goods 10.4 0.0 0.2 0.0 65.9 76.6 10.621 Works of art, antiques, collections 0.0 0.0 0.8 0.0 0.0 0.8 0.8
Mexico NTM1(%)NTM3(%)NTM4(%)NTM5(%)NTM6(%)NTM(ALL)(%)CoreNTMs(1+4)(1 Live animals and animal products 0.0 0.0 143.8 0.0 3.7 147.4 143.82 Vegetable products 0.0 0.0 20.3 0.0 4.5 24.8 20.33 Animal and vegetable oils and fats 0.0 0.0 65.3 0.0 1.6 66.9 65.34 Products of food industry; 0.0 0.0 56.5 0.0 4.7 61.1 56.55 Mineral products 0.0 0.0 36.7 0.0 0.2 36.9 36.76 Chemicals 0.0 -1.9 71.2 0.0 3.8 73.1 71.27 Plastic and plastic materials, 0.0 -17.2 4.2 0.0 0.7 -12.2 4.28 Skin, raw material; leather, pelts, 0.0 0.0 0.0 0.0 4.4 4.4 0.09 Wood and wood products; charcoal, 0.0 -30.8 0.0 0.0 3.0 -27.8 0.0
10Wood pulp, vegetable pulp; paper and 0.0 0.0 0.0 0.0 0.8 0.8 0.011Textiles 0.0 -27.2 0.2 0.0 5.2 -21.8 0.212Footwear, head-dress, umbrellas, 0.0 -62.4 0.0 0.0 4.2 -58.2 0.013Rock products; gypsum, cement, 0.0 -60.7 0.9 0.0 1.1 -58.7 0.914Precious stones and semi-precious stones,0.0 0.0 0.0 0.0 0.5 0.5 0.015Base metals and base metal products 0.0 -19.7 2.3 0.0 1.0 -16.416Machinery; equipment and mechanism; 0.0 0.0 3.8 0.0 0.9 4.817Surface, air, water transport means 0.0 -7.1 61.8 0.0 0.7 55.4
2.33.8
61.818Optical, photographic, cinematographic, 0.0 0.0 17.6 0.0 2.8 20.4 17.619Firearms and munitions therefore 0.0 0.0 250.8 0.0 1.8 252.6 250.820Various manufactured goods 0.0 -5.5 1.2 0.0 3.5 -0.8 1.221Works of art, antiques, collections 0.0 0.0 0.0 0.0 2.2 2.2 0.0
17
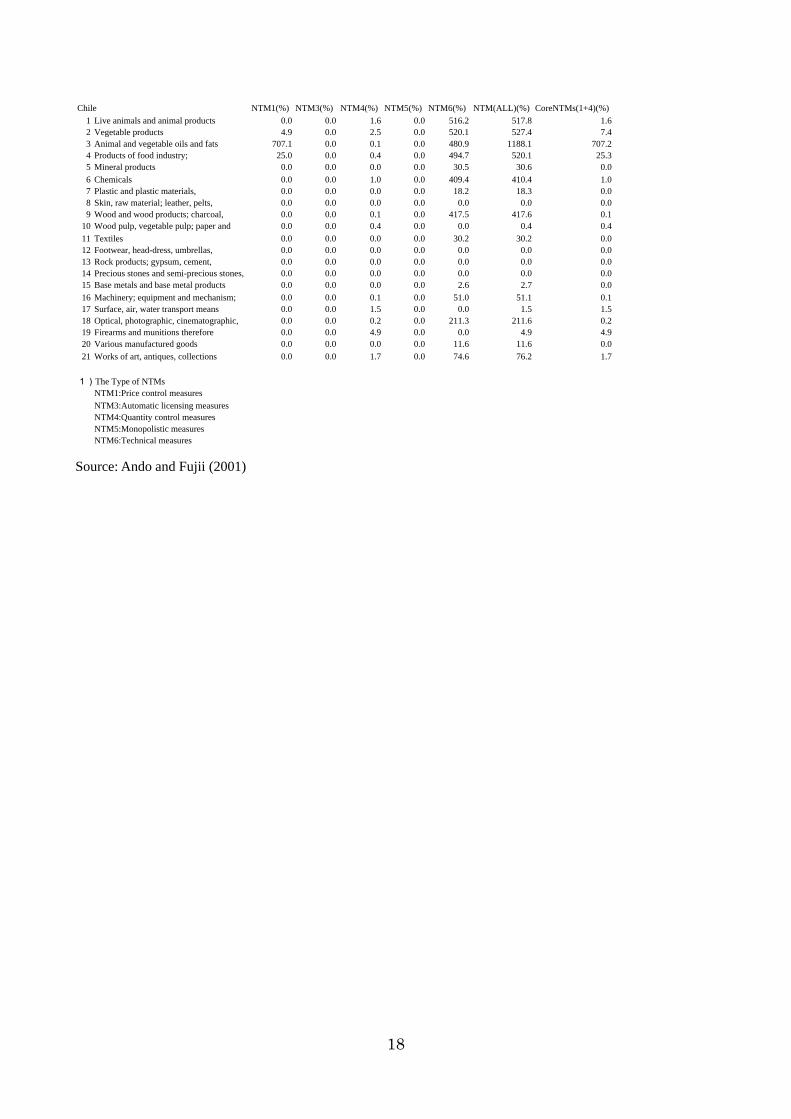
Chile NTM1(%) NTM3(%) NTM4(%) NTM5(%) NTM6(%) NTM(ALL)(%) CoreNTMs(1+4)(%)1 Live animals and animal products 0.0 0.0 1.6 0.0 516.2 517.8 1.62 Vegetable products 4.9 0.0 2.5 0.0 520.1 527.4 7.43 Animal and vegetable oils and fats 707.1 0.0 0.1 0.0 480.9 1188.1 707.24 Products of food industry; 25.0 0.0 0.4 0.0 494.7 520.1 25.35 Mineral products 0.0 0.0 0.0 0.0 30.5 30.6 0.06 Chemicals 0.0 0.0 1.0 0.0 409.4 410.4 1.07 Plastic and plastic materials, 0.0 0.0 0.0 0.0 18.2 18.3 0.08 Skin, raw material; leather, pelts, 0.0 0.0 0.0 0.0 0.0 0.0 0.09 Wood and wood products; charcoal, 0.0 0.0 0.1 0.0 417.5 417.6 0.1
10 Wood pulp, vegetable pulp; paper and 0.0 0.0 0.4 0.0 0.0 0.4 0.411 Textiles 0.0 0.0 0.0 0.0 30.2 30.2 0.012 Footwear, head-dress, umbrellas, 0.0 0.0 0.0 0.0 0.0 0.0 0.013 Rock products; gypsum, cement, 0.0 0.0 0.0 0.0 0.0 0.0 0.014 Precious stones and semi-precious stones, 0.0 0.0 0.0 0.0 0.0 0.0 0.015 Base metals and base metal products 0.0 0.0 0.0 0.0 2.6 2.7 0.016 Machinery; equipment and mechanism; 0.0 0.0 0.1 0.0 51.0 51.1 0.117 Surface, air, water transport means 0.0 0.0 1.5 0.0 0.0 1.5 1.518 Optical, photographic, cinematographic, 0.0 0.0 0.2 0.0 211.3 211.6 0.219 Firearms and munitions therefore 0.0 0.0 4.9 0.0 0.0 4.9 4.920 Various manufactured goods 0.0 0.0 0.0 0.0 11.6 11.6 0.021 Works of art, antiques, collections 0.0 0.0 1.7 0.0 74.6 76.2 1.7
1)The Type of NTMsNTM1:Price control measuresNTM3:Automatic licensing measuresNTM4:Quantity control measuresNTM5:Monopolistic measuresNTM6:Technical measures
Source: Ando and Fujii (2001)
18
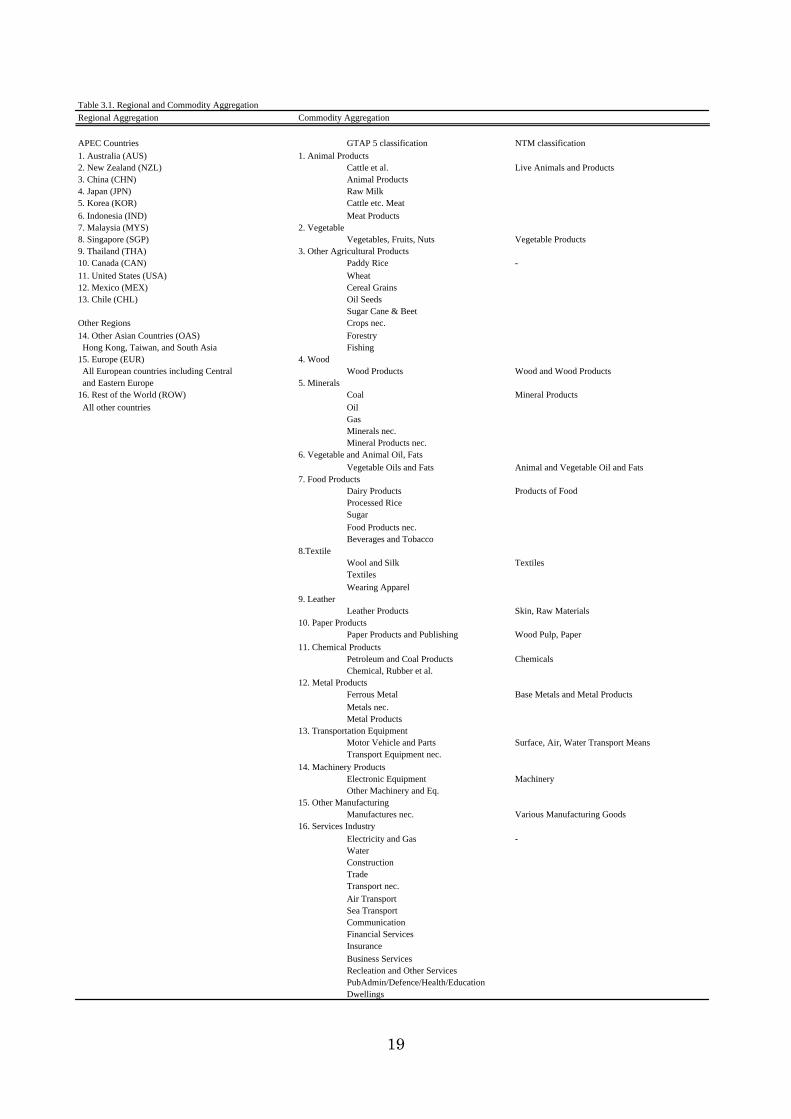
Table 3.1. Regional and Commodity AggregationRegional Aggregation Commodity Aggregation
APEC Countries GTAP 5 classification NTM classification1. Australia (AUS) 1. Animal Products2. New Zealand (NZL) Cattle et al. Live Animals and Products3. China (CHN) Animal Products4. Japan (JPN) Raw Milk5. Korea (KOR) Cattle etc. Meat6. Indonesia (IND) Meat Products7. Malaysia (MYS) 2. Vegetable8. Singapore (SGP) Vegetables, Fruits, Nuts Vegetable Products9. Thailand (THA) 3. Other Agricultural Products10. Canada (CAN) Paddy Rice -11. United States (USA) Wheat12. Mexico (MEX) Cereal Grains13. Chile (CHL) Oil Seeds
Sugar Cane & BeetOther Regions Crops nec.14. Other Asian Countries (OAS) Forestry Hong Kong, Taiwan, and South Asia Fishing15. Europe (EUR) 4. Wood All European countries including Central Wood Products Wood and Wood Products and Eastern Europe 5. Minerals16. Rest of the World (ROW) Coal Mineral Products All other countries Oil
GasMinerals nec.Mineral Products nec.
6. Vegetable and Animal Oil, FatsVegetable Oils and Fats Animal and Vegetable Oil and Fats
7. Food ProductsDairy Products Products of FoodProcessed RiceSugarFood Products nec.Beverages and Tobacco
8.TextileWool and Silk TextilesTextilesWearing Apparel
9. LeatherLeather Products Skin, Raw Materials
10. Paper ProductsPaper Products and Publishing Wood Pulp, Paper
11. Chemical ProductsPetroleum and Coal Products ChemicalsChemical, Rubber et al.
12. Metal ProductsFerrous Metal Base Metals and Metal ProductsMetals nec.Metal Products
13. Transportation EquipmentMotor Vehicle and Parts Surface, Air, Water Transport MeansTransport Equipment nec.
14. Machinery ProductsElectronic Equipment MachineryOther Machinery and Eq.
15. Other ManufacturingManufactures nec. Various Manufacturing Goods
16. Services IndustryElectricity and Gas -WaterConstructionTradeTransport nec.Air TransportSea TransportCommunicationFinancial ServicesInsuranceBusiness ServicesRecleation and Other ServicesPubAdmin/Defence/Health/EducationDwellings
19
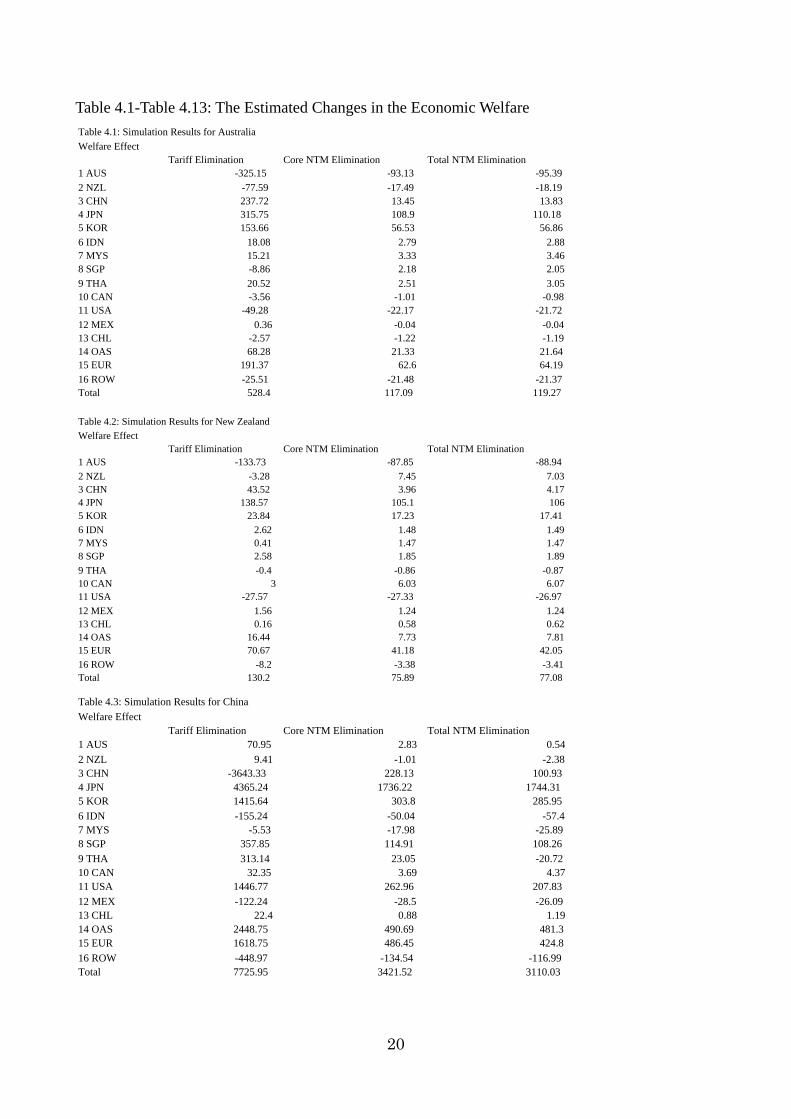
Table 4.1-Table 4.13: The Estimated Changes in the Economic Welfare Table 4.1: Simulation Results for AustraliaWelfare Effect Tariff Elimination Core NTM Elimination Total NTM Elimination1 AUS -325.15 -93.13 -95.392 NZL -77.59 -17.49 -18.193 CHN 237.72 13.45 13.834 JPN 315.75 108.9 110.185 KOR 153.66 56.53 56.866 IDN 18.08 2.79 2.887 MYS 15.21 3.33 3.468 SGP -8.86 2.18 2.059 THA 20.52 2.51 3.0510 CAN -3.56 -1.01 -0.9811 USA -49.28 -22.17 -21.7212 MEX 0.36 -0.04 -0.0413 CHL -2.57 -1.22 -1.1914 OAS 68.28 21.33 21.6415 EUR 191.37 62.6 64.1916 ROW -25.51 -21.48 -21.37Total 528.4 117.09 119.27 Table 4.2: Simulation Results for New ZealandWelfare Effect Tariff Elimination Core NTM Elimination Total NTM Elimination1 AUS -133.73 -87.85 -88.942 NZL -3.28 7.45 7.033 CHN 43.52 3.96 4.174 JPN 138.57 105.1 1065 KOR 23.84 17.23 17.416 IDN 2.62 1.48 1.497 MYS 0.41 1.47 1.478 SGP 2.58 1.85 1.899 THA -0.4 -0.86 -0.8710 CAN 3 6.03 6.0711 USA -27.57 -27.33 -26.9712 MEX 1.56 1.24 1.2413 CHL 0.16 0.58 0.6214 OAS 16.44 7.73 7.8115 EUR 70.67 41.18 42.0516 ROW -8.2 -3.38 -3.41Total 130.2 75.89 77.08 Table 4.3: Simulation Results for ChinaWelfare Effect
Tariff Elimination Core NTM Elimination Total NTM Elimination1 AUS 70.95 2.83 0.542 NZL 9.41 -1.01 -2.383 CHN -3643.33 228.13 100.934 JPN 4365.24 1736.22 1744.315 KOR 1415.64 303.8 285.956 IDN -155.24 -50.04 -57.47 MYS -5.53 -17.98 -25.898 SGP 357.85 114.91 108.269 THA 313.14 23.05 -20.7210 CAN 32.35 3.69 4.3711 USA 1446.77 262.96 207.8312 MEX -122.24 -28.5 -26.0913 CHL 22.4 0.88 1.1914 OAS 2448.75 490.69 481.315 EUR 1618.75 486.45 424.816 ROW -448.97 -134.54 -116.99Total 7725.95 3421.52 3110.03
20
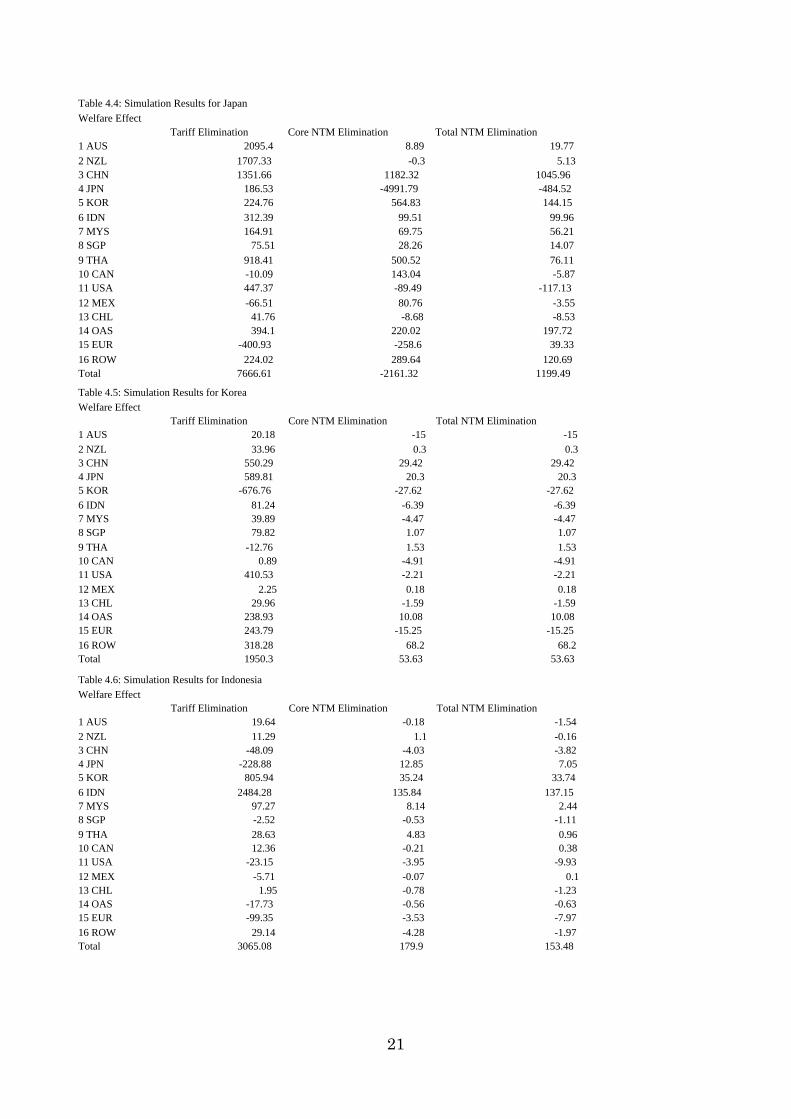
Table 4.4: Simulation Results for JapanWelfare Effect Tariff Elimination Core NTM Elimination Total NTM Elimination1 AUS 2095.4 8.89 19.772 NZL 1707.33 -0.3 5.133 CHN 1351.66 1182.32 1045.964 JPN 186.53 -4991.79 -484.525 KOR 224.76 564.83 144.156 IDN 312.39 99.51 99.967 MYS 164.91 69.75 56.218 SGP 75.51 28.26 14.079 THA 918.41 500.52 76.1110 CAN -10.09 143.04 -5.8711 USA 447.37 -89.49 -117.1312 MEX -66.51 80.76 -3.5513 CHL 41.76 -8.68 -8.5314 OAS 394.1 220.02 197.7215 EUR -400.93 -258.6 39.3316 ROW 224.02 289.64 120.69Total 7666.61 -2161.32 1199.49 Table 4.5: Simulation Results for KoreaWelfare Effect Tariff Elimination Core NTM Elimination Total NTM Elimination1 AUS 20.18 -15 -152 NZL 33.96 0.3 0.33 CHN 550.29 29.42 29.424 JPN 589.81 20.3 20.35 KOR -676.76 -27.62 -27.626 IDN 81.24 -6.39 -6.397 MYS 39.89 -4.47 -4.478 SGP 79.82 1.07 1.079 THA -12.76 1.53 1.5310 CAN 0.89 -4.91 -4.9111 USA 410.53 -2.21 -2.2112 MEX 2.25 0.18 0.1813 CHL 29.96 -1.59 -1.5914 OAS 238.93 10.08 10.0815 EUR 243.79 -15.25 -15.2516 ROW 318.28 68.2 68.2Total 1950.3 53.63 53.63 Table 4.6: Simulation Results for IndonesiaWelfare Effect Tariff Elimination Core NTM Elimination Total NTM Elimination1 AUS 19.64 -0.18 -1.542 NZL 11.29 1.1 -0.163 CHN -48.09 -4.03 -3.824 JPN -228.88 12.85 7.055 KOR 805.94 35.24 33.746 IDN 2484.28 135.84 137.157 MYS 97.27 8.14 2.448 SGP -2.52 -0.53 -1.119 THA 28.63 4.83 0.9610 CAN 12.36 -0.21 0.3811 USA -23.15 -3.95 -9.9312 MEX -5.71 -0.07 0.113 CHL 1.95 -0.78 -1.2314 OAS -17.73 -0.56 -0.6315 EUR -99.35 -3.53 -7.9716 ROW 29.14 -4.28 -1.97Total 3065.08 179.9 153.48
21
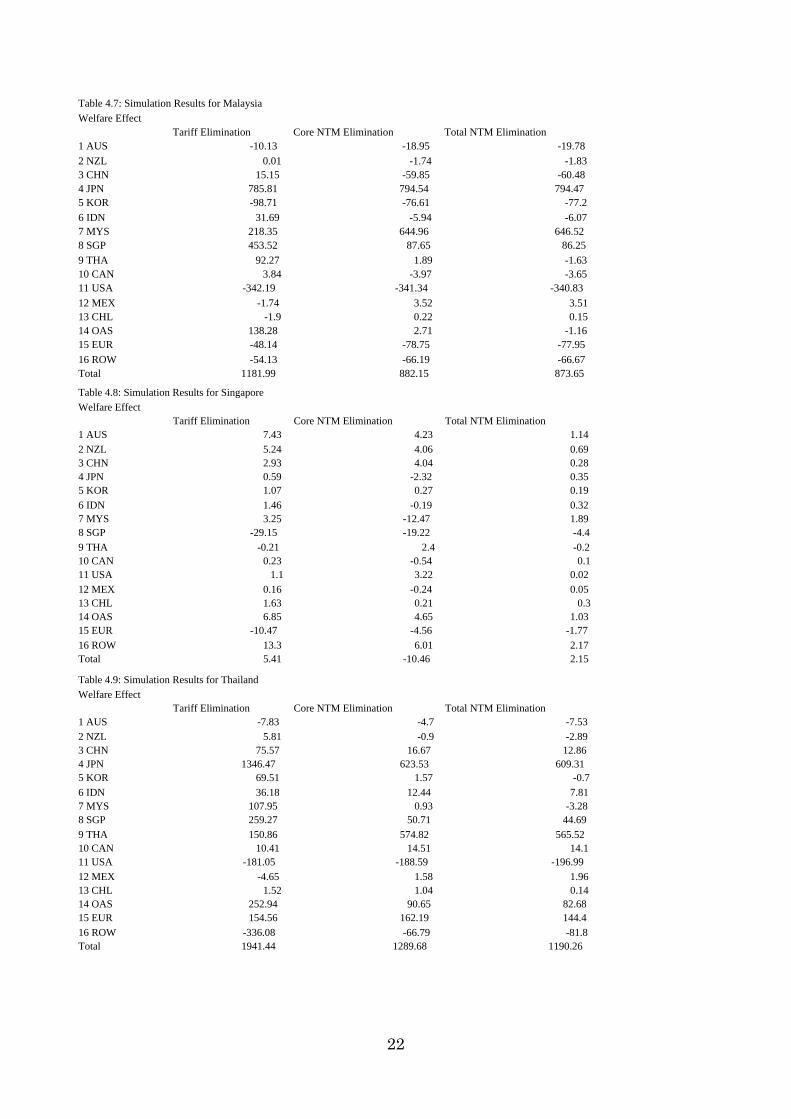
Table 4.7: Simulation Results for MalaysiaWelfare Effect Tariff Elimination Core NTM Elimination Total NTM Elimination1 AUS -10.13 -18.95 -19.782 NZL 0.01 -1.74 -1.833 CHN 15.15 -59.85 -60.484 JPN 785.81 794.54 794.475 KOR -98.71 -76.61 -77.26 IDN 31.69 -5.94 -6.077 MYS 218.35 644.96 646.528 SGP 453.52 87.65 86.259 THA 92.27 1.89 -1.6310 CAN 3.84 -3.97 -3.6511 USA -342.19 -341.34 -340.8312 MEX -1.74 3.52 3.5113 CHL -1.9 0.22 0.1514 OAS 138.28 2.71 -1.1615 EUR -48.14 -78.75 -77.9516 ROW -54.13 -66.19 -66.67Total 1181.99 882.15 873.65 Table 4.8: Simulation Results for SingaporeWelfare Effect Tariff Elimination Core NTM Elimination Total NTM Elimination1 AUS 7.43 4.23 1.142 NZL 5.24 4.06 0.693 CHN 2.93 4.04 0.284 JPN 0.59 -2.32 0.355 KOR 1.07 0.27 0.196 IDN 1.46 -0.19 0.327 MYS 3.25 -12.47 1.898 SGP -29.15 -19.22 -4.49 THA -0.21 2.4 -0.210 CAN 0.23 -0.54 0.111 USA 1.1 3.22 0.0212 MEX 0.16 -0.24 0.0513 CHL 1.63 0.21 0.314 OAS 6.85 4.65 1.0315 EUR -10.47 -4.56 -1.7716 ROW 13.3 6.01 2.17Total 5.41 -10.46 2.15 Table 4.9: Simulation Results for ThailandWelfare Effect Tariff Elimination Core NTM Elimination Total NTM Elimination1 AUS -7.83 -4.7 -7.532 NZL 5.81 -0.9 -2.893 CHN 75.57 16.67 12.864 JPN 1346.47 623.53 609.315 KOR 69.51 1.57 -0.76 IDN 36.18 12.44 7.817 MYS 107.95 0.93 -3.288 SGP 259.27 50.71 44.699 THA 150.86 574.82 565.5210 CAN 10.41 14.51 14.111 USA -181.05 -188.59 -196.9912 MEX -4.65 1.58 1.9613 CHL 1.52 1.04 0.1414 OAS 252.94 90.65 82.6815 EUR 154.56 162.19 144.416 ROW -336.08 -66.79 -81.8Total 1941.44 1289.68 1190.26
22
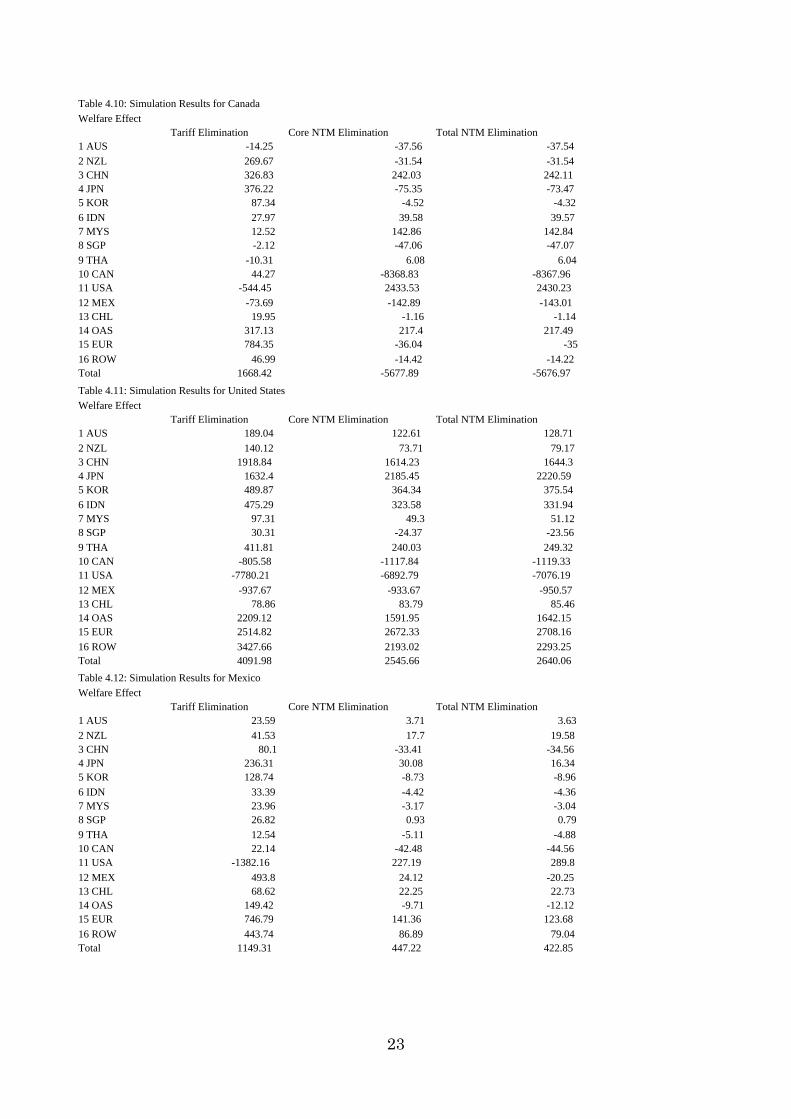
Table 4.10: Simulation Results for CanadaWelfare Effect Tariff Elimination Core NTM Elimination Total NTM Elimination1 AUS -14.25 -37.56 -37.542 NZL 269.67 -31.54 -31.543 CHN 326.83 242.03 242.114 JPN 376.22 -75.35 -73.475 KOR 87.34 -4.52 -4.326 IDN 27.97 39.58 39.577 MYS 12.52 142.86 142.848 SGP -2.12 -47.06 -47.079 THA -10.31 6.08 6.0410 CAN 44.27 -8368.83 -8367.9611 USA -544.45 2433.53 2430.2312 MEX -73.69 -142.89 -143.0113 CHL 19.95 -1.16 -1.1414 OAS 317.13 217.4 217.4915 EUR 784.35 -36.04 -3516 ROW 46.99 -14.42 -14.22Total 1668.42 -5677.89 -5676.97 Table 4.11: Simulation Results for United StatesWelfare Effect Tariff Elimination Core NTM Elimination Total NTM Elimination1 AUS 189.04 122.61 128.712 NZL 140.12 73.71 79.173 CHN 1918.84 1614.23 1644.34 JPN 1632.4 2185.45 2220.595 KOR 489.87 364.34 375.546 IDN 475.29 323.58 331.947 MYS 97.31 49.3 51.128 SGP 30.31 -24.37 -23.569 THA 411.81 240.03 249.3210 CAN -805.58 -1117.84 -1119.3311 USA -7780.21 -6892.79 -7076.1912 MEX -937.67 -933.67 -950.5713 CHL 78.86 83.79 85.4614 OAS 2209.12 1591.95 1642.1515 EUR 2514.82 2672.33 2708.1616 ROW 3427.66 2193.02 2293.25Total 4091.98 2545.66 2640.06 Table 4.12: Simulation Results for MexicoWelfare Effect Tariff Elimination Core NTM Elimination Total NTM Elimination1 AUS 23.59 3.71 3.632 NZL 41.53 17.7 19.583 CHN 80.1 -33.41 -34.564 JPN 236.31 30.08 16.345 KOR 128.74 -8.73 -8.966 IDN 33.39 -4.42 -4.367 MYS 23.96 -3.17 -3.048 SGP 26.82 0.93 0.799 THA 12.54 -5.11 -4.8810 CAN 22.14 -42.48 -44.5611 USA -1382.16 227.19 289.812 MEX 493.8 24.12 -20.2513 CHL 68.62 22.25 22.7314 OAS 149.42 -9.71 -12.1215 EUR 746.79 141.36 123.6816 ROW 443.74 86.89 79.04Total 1149.31 447.22 422.85
23
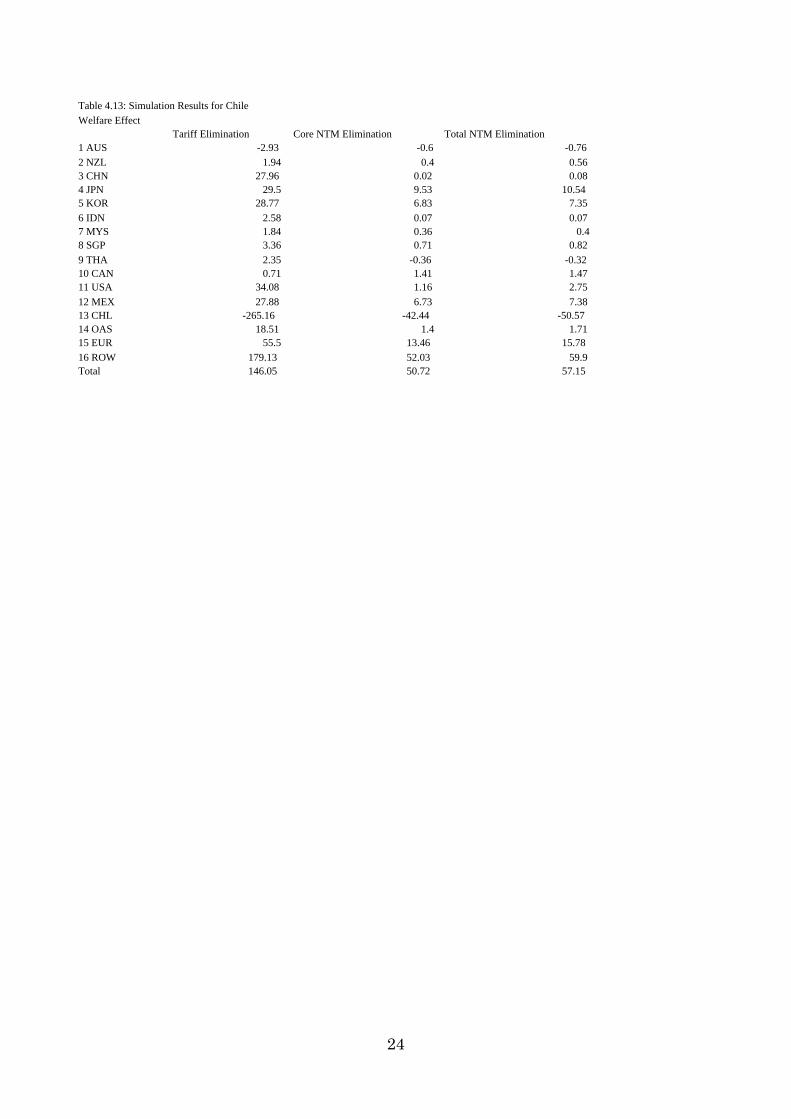
Table 4.13: Simulation Results for ChileWelfare Effect Tariff Elimination Core NTM Elimination Total NTM Elimination1 AUS -2.93 -0.6 -0.762 NZL 1.94 0.4 0.563 CHN 27.96 0.02 0.084 JPN 29.5 9.53 10.545 KOR 28.77 6.83 7.356 IDN 2.58 0.07 0.077 MYS 1.84 0.36 0.48 SGP 3.36 0.71 0.829 THA 2.35 -0.36 -0.3210 CAN 0.71 1.41 1.4711 USA 34.08 1.16 2.7512 MEX 27.88 6.73 7.3813 CHL -265.16 -42.44 -50.5714 OAS 18.51 1.4 1.7115 EUR 55.5 13.46 15.7816 ROW 179.13 52.03 59.9Total 146.05 50.72 57.15
24