Embed Size (px)
Citation preview

W O R K I N G PA P E R S E R I E S
MIT-IPC-Energy Innovation Working Paper 09-006*
292 Main Street, E38-104, Cambridge, MA 02139-4307617-253-7522web.mit.edu/ipc/www
Quantifying the Impact of Proposed Carbon Emission
Reductions on the U.S. Energy Infrastructure
Richard K. Lester and Ashley Finan
October 2009
INDUSTR IAL PERFORMANCE CENTER
MASSACHUSETTS INST ITUTE OF TECHNOLOGY
*This working paper supersedes MIT IPC Working Paper 09-004 (July 2009)

Quantifying the Impact of Proposed Carbon Emission Reductions on the U.S. Energy Infrastructure
Richard Lester and Ashley Finan
Industrial Performance Center Massachusetts Institute of Technology
October 21, 20091
Abstract The U.S. is actively considering the adoption of ambitious targets for greenhouse gas emissions that would require a reduction in energy-related carbon dioxide releases of 80% or more by the year 2050. Achieving such a goal will entail a rapid transition away from reliance on petroleum for transportation and high carbon fuels for electricity generation towards alternative transportation fuels and low-carbon electrical generating technologies, including solar, wind, geothermal, nuclear, and coal-fired generation with carbon capture and storage. Even with adoption rates for these technologies that are all near or even beyond the limits of plausibility, it will be impossible to achieve the desired emission reductions while simultaneously maintaining reasonable economic growth unless, in addition, the energy efficiency of the economy improves at a rate significantly above the historical trend.
1 The authors are grateful for the support for this research provided by the Doris Duke Charitable Foundation.
Lester and Finan, “The Impact of Carbon Emission Reduction Targets” October 2009
2
Introduction This paper examines the implications for the U.S. energy infrastructure of the targets
for greenhouse gas emission reductions now being actively considered by the U.S.
government. The Waxman-Markey legislation recently passed by the U.S. House of
Representatives calls for U.S. carbon emissions to decline 83% from their level in
2005 by 2050.2 At various times President Obama has similarly called for emission
reductions of over 80% by mid-century, and in July the President agreed with the other
G8 leaders that the developed countries, including the U.S., should reduce their
emissions 80% by 2050. These targets are loosely derived from integrated scientific
and economic assessments of the consequences for the earth’s climate of elevated
atmospheric concentrations of greenhouse gases. The problem of mitigating
greenhouse gas emissions will affect all countries. Here we examine what would be
required for the U.S. to achieve reductions in this general range.
It is widely recognized that an effective strategy for reducing greenhouse gas
emissions must focus on the energy sector, whose releases of carbon dioxide account
for 80% of all U.S. anthropogenic greenhouse gas emissions.3 There are two
essential elements of a strategy for reducing energy-related carbon emissions: first,
improving the efficiency of energy use (energy productivity) or, equivalently, reducing
the ‘energy intensity’ of the economy; and second, ‘decarbonizing’ the nation’s energy
supply infrastructure – that is, reducing the carbon intensity of the energy system by
moving away from primary reliance on petroleum for transportation and high carbon
fuels for electricity generation towards alternative transportation fuels and low or zero-
carbon electrical generating technologies. It is evident that these two elements of an
overall strategy are interdependent. The more rapid the transition to low carbon
energy supplies, the less we will need to rely on energy end-use efficiency gains to
achieve a given emission reduction target, and vice versa.
2 H.R. 2454: American Clean Energy and Security Act of 2009, Section 702 3 Climate change avoidance strategies must also reduce emissions of potent non-carbon greenhouse gases such as methane and nitrous oxide.

Lester and Finan, “The Impact of Carbon Emission Reduction Targets” October 2009
3
There is in fact a fixed relationship between the two if a target for economic output is
specified together with the carbon reduction goal. The relationship between these four
factors – carbon emissions, carbon intensity of the energy system, energy intensity of
the economy, and economic output – is given by the simple identity4
!
C= CE"
# $
%
& ' (
EY"
# $
%
& ' (
YP"
# $
%
& ' (P (1)
where C = carbon emitted in a given time period, E = energy consumed in that time
period, Y = economic output, and P = population, and where, for convenience,
economic output is expressed as output per capita. This ratio, Y/P, is the broadest
measure of productivity in an economy, and in the long run is the single most
important determinant of national prosperity. Equation (1) applies to any specified
geographical unit, from a small region to a country to the world as a whole. The
differential form of the identity relates the rate of change of carbon emissions to the
rate of change of each of the four factors, i.e., carbon intensity, energy efficiency,
economic productivity, and population:
!
"CC
="(C /E)(C /E)
+"(E /Y)(E /Y)
+"(Y /P)(Y /P)
+"PP (2)
Alternative and even simpler differential forms are
!
"CC
="(C /Y)(C /Y)
+"(Y /P)(Y /P)
+"PP (2a)
4 The relationship between these factors was first pointed out by the Japanese engineer Yoichi Kaya (Kaya, Y., “Impact of Carbon Dioxide Emission Control on GNP Growth: Interpretation of Proposed Scenarios”, Paper presented to the IPCC Energy and Industry Subgroup, Response Strategies Working Group, Paris, 1990 (mimeo).)

Lester and Finan, “The Impact of Carbon Emission Reduction Targets” October 2009
4
!
"CC
="(C /E)(C /E)
+"(E /P)(E /P)
+"PP (2b)
where (C/Y) indicates the carbon use per unit of economic output, and (E/P) is the
energy use per capita.
As equation (2) indicates, it is a straightforward exercise in carbon, energy, and
economic growth accounting to identify energy efficiency and decarbonization
scenarios that could, in combination, meet specified targets for carbon emission
reduction and economic growth. In this paper we present a simple model for
investigating these scenarios for the U.S. economy over the period from 2008 to 2050.
Details of the model are provided in the Appendix and the results are discussed
below. These results come with an important proviso. Whether any scenario
satisfying the basic identity could actually be realized in practice cannot be determined
from this kind of exercise, since this depends upon interactions between the energy
sector and the rest of the economy that require much more complex modeling to
describe. But the identity is nonetheless useful in indicating possible pathways
towards achieving the various emission reduction goals and in suggesting the scale of
the change needed to reach them. Equally important, it shows what is not possible,
and as such is useful in revealing plans and strategies that are incapable of achieving
their intended result.
Scenarios In this paper we take as the target for aggregate U.S. energy-related carbon
emissions in 2050 an 85% reduction relative to the 2005 level. This is slightly above
the Waxman-Markey goal and is equivalent to an 80% reduction relative to U.S.
emissions in 1990 – a goal that has been advocated by President Obama and others
in the past. It corresponds to an average rate of reduction in carbon emissions of
4.18% per year.
Lester and Finan, “The Impact of Carbon Emission Reduction Targets” October 2009
5
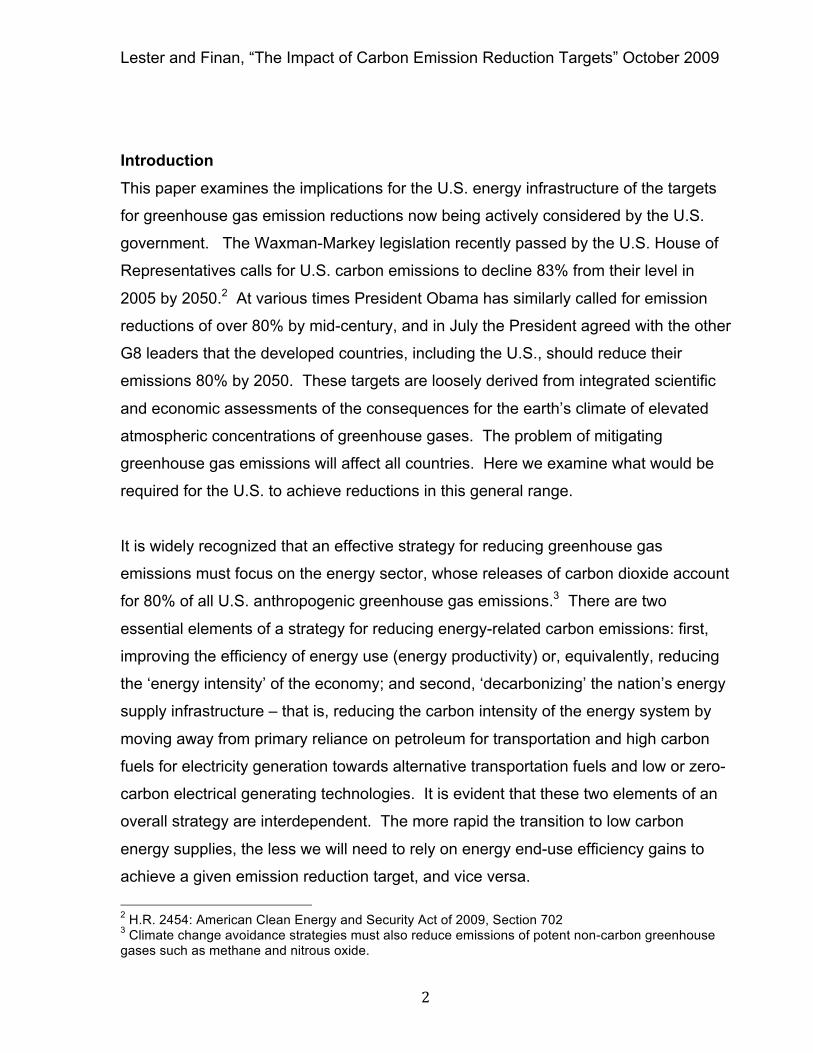
We next consider three alternative decarbonization scenarios, described below. The
scenarios cover the entire economy, but the short descriptions focus on the electric
power sector.
Scenario 1 (“All Hands on Deck”): In this scenario, the electricity sector in 2050
relies to a much greater extent than today on low carbon sources of supply. Solar
and wind expand rapidly, and by 2050 each is providing 20% of total electricity supply.
The obstacles that would today stand in the way of such a scenario are assumed to be
overcome; reliability problems associated with heavy dependence on these
intermittent sources are resolved with economic electricity storage and other
advanced grid technologies that are not available today. Nuclear is also assumed to
provide 20% of total electricity supply (the same percentage as today, but with many
more reactors producing much more electricity in absolute terms). The technology for
coal plant carbon capture and sequestration (CCS) is assumed to be available without
constraint. Geothermal provides 100 GWe (compared with about 2 GWe today).
Hydroelectric plants continue to contribute at their current, relatively modest level.
These are generally very ambitious goals. Some observers would likely regard them
as being at or even beyond the bounds of plausibility.
Scenario 2 (“No Nuclear/No Coal”): In this scenario, the path to decarbonization is
diverted by obstacles to nuclear and coal use. No new nuclear plants are built, and all
currently operating plants are phased out. Carbon capture and sequestration
technology is assumed not to become available, and no new coal plants are built
either. Existing coal plants are phased out. Solar and wind expand rapidly, however;
by 2050 each are providing 20% of total electricity supply. The balance of electricity
supply is provided by a combination of hydroelectricity (unchanged from today),
geothermal (100 GWe), and biofuel. Scenario 3 (“Additionally Constrained”): In this scenario, the constraints on low-
carbon sources multiply. As in Scenario 2 nuclear and coal are phased out
completely, while wind and solar are more restricted than in the two previous

Lester and Finan, “The Impact of Carbon Emission Reduction Targets” October 2009
6
scenarios. Wind accounts for 15% of total electricity supply in 2050, and solar another
5% – both many times larger than their current contributions, but below today’s most
optimistic projections. Hydro, geothermal, and biofuel provide the balance of
electricity supply.
The three scenarios are summarized in Table 1.
Table 1: Decarbonization Scenario Assumptions
SCENARIO 1
“All Hands on Deck” SCENARIO 2
“No Nuclear/No Coal”
SCENARIO 3 “Additionally Constrained”
Population growth 0.9%/yr 0.9%/yr 0.9%/yr Intermittent renewables as a share of total electricity generation in 2050 (wind/solar)
40% (20%/20%) 40% (20%/20%) 20% (15%/5%)
Carbon capture and sequestration in 2050
Limited only by C emission constraint
None None
Nuclear as a share of total electricity generation in 2050
20% None None
Geothermal in 2050 100 GWe 100 GWe 100 GWe Hydroelectric Same as today Same as today Same as today
‘Business-as-usual’ in energy efficiency means severely constrained economic growth
To see what these different decarbonization scenarios would mean, we first consider
the case in which the energy intensity of the economy continues to decline at the
same rate, 2.16%/year, that it has averaged over the past 25 years.5 From equation
5 This is the emission-weighted average performance for the economy as a whole. Our model disaggregates this economy-wide average into the average trend for each of the energy-using sectors: transportation (-1.53%), residential (-2.66%), commercial (-1.76%), and industrial (-3.03%).

Lester and Finan, “The Impact of Carbon Emission Reduction Targets” October 2009
7
(2), the combined rate of decarbonization (C/E) and economic growth (Y/P) required to
achieve the targeted reduction in carbon emissions in this case is:6
!
"(C/E)(C/E)
+"(Y/P)(Y/P)
= #4.18 + 2.16 # 0.90 = #2.89%/yr
Table 2 shows the economic growth trajectories associated with each of the three
decarbonization scenarios. Even in the “All Hands on Deck” scenario, with its very
optimistic assumptions about the future availability of renewables, nuclear, and CCS,
the mid-century carbon emission reduction goal could only be achieved if the annual
rate of growth in GDP per capita between now and 2050 were to decline to 1% per
year. It is worth noting that in no decade since the 1930s has this broad measure of
the nation’s economic growth performance been as low. For the less optimistic “No
Nuclear/No Coal” and “Severely Constrained” scenarios, per capita economic output
would actually have to contract in order to achieve the mid-century carbon emission
reduction goal.
Table 2: Economic Growth with 'Business-as-Usual' Energy Efficiency Trend
Supply-Side Scenario Growth rate in GDP/capita, 2008-2050
“All Hands on Deck” +1.0%/yr
“No Nuclear/No Coal” -0.67%/yr
“Severely Constrained” -0.85%/yr
Uncompromising environmental advocates assert that the risks of climate change are
so great that carbon emission reductions must be achieved regardless of what this
would mean for economic growth. But that view is not widely shared and as a
practical matter national policy is unlikely to privilege the emission reduction goal in
6 The U.S. population is assumed to grow at an annual rate of 0.9% between now and 2050, following the estimate of J.S. Passel and D’Vera Cohn, “U.S. Population Projections: 2005-2050”, Pew Research Center Report, February 2008. The U.S. Census Bureau recently projected a growth rate of 0.8% per year over this period (http://www.census.gov/population/www/projections/usinterimproj/).

Lester and Finan, “The Impact of Carbon Emission Reduction Targets” October 2009
8
this way. Certainly many people would regard the prospect of weak or even negative
economic growth in the service of avoiding global climate change as unacceptable.
But it is an inescapable fact that even with extraordinary measures to adopt low-
carbon energy supply technologies on a large scale it will be mathematically
impossible for the country to enjoy even moderate economic growth in the absence of
much stronger energy efficiency gains than in the past. Equally, strong economic
growth will be impossible even with rapid gains in energy efficiency if these are not
accompanied by much more aggressive rates of decarbonization.
We next explore the implications for the energy system of setting a requirement for
more vigorous economic growth simultaneously with the desired carbon emission
reductions.
‘Business-as-usual’ in economic growth means ‘NOT-business-as-usual’ in energy supply and demand We specify a performance goal for the U.S. economy of 2% annual growth in GDP per
capita through 2050. In historical terms, this is a fairly modest target. It is
approximately equal to the per capita growth performance achieved by the U.S.
economy between 1973 and 2000, and falls well below the 2.5% growth rate achieved
between 1950 and 1973 (and again during the strong expansion years of 1992-2000).7
As before, we impose the 85% carbon emission reduction target in 2050, and again
consider the three decarbonization scenarios described above.
The results are summarized in Table 3. An important result is the required rate of
reduction in energy intensity, i.e., energy use per unit of economic output (E/Y). In
Scenario 1 (“All Hands on Deck”), with its highly optimistic assumptions about the rate
of decarbonization, energy use per unit of economic output would need to decline by
3.05%/year on average between now and mid-century in order to achieve the carbon
mitigation and economic growth goals. As already noted, energy use per unit of GDP
7 Between 2000 and 2007, a period of weak growth that preceded the current economic recession, the per capita U.S. growth rate was 1.35%/year.

Lester and Finan, “The Impact of Carbon Emission Reduction Targets” October 2009
9
declined by 2.16%/year on average between 1980 and 2006; from 1996-2006 the
average rate was 2.52%/year. In Scenario 2 (“No Nuclear/No Coal”), with its less
optimistic assumptions about the availability of low-carbon technologies, energy use
per unit of economic output would need to decline by 4.50%/year. In Scenario 3
(“Additionally Constrained”), with its even less optimistic assumptions, the implied
requirement is for energy efficiency to improve by 4.75%/year on average. In each
scenario total energy use in 2050 would be lower than it is today – by 6.1% in the “All
Hands on Deck” scenario, and by more than 50% in the “Additionally Constrained”
scenario.
In the “All Hands on Deck” scenario, the reduction in carbon emissions is achieved
primarily through very rapid electrification of the economy, which by 2050 relies on
electricity for 54.3% of final energy use compared with 18.3% today. In the “No
Nuclear/No Coal” and “Additionally Constrained” scenarios electrification is much less
important, and the main contributor to carbon emission reductions is a dramatic
reduction in energy use. In all three scenarios, however, rapid electrification of the
automobile fleet is essential, even assuming the early availability of advanced biofuel
with a much lower carbon footprint than corn ethanol.8
Table 3: Scenario Results
SCENARIO 1 “All Hands on
Deck”
SCENARIO 2 “No Nuclear/No
Coal”
SCENARIO 3 “Additionally Constrained”
Rate of change of CO2 emissions per unit of GDP, 2008-2050
-7.08 %/yr -7.08 %/yr -7.08 %/yr
Rate of change in energy consumption per capita, 2008-2050
-1.05 %/yr -2.50%/yr -2.75 %/yr
Rate of change in energy consumption per dollar of GDP, 2008-2050
-3.05 %/yr -4.50%/yr -4.75 %/yr
8 In our model, biofuels are assumed to have a carbon emissions rate in 2050 equal to 50% that of traditional petroleum fuels.

Lester and Finan, “The Impact of Carbon Emission Reduction Targets” October 2009
10
Change in total U.S. final energy use between 2008 and 2050
-6.1% -48.3% -53.5%
Change in total U.S. electricity consumption between 2008 and 2050
+178% -25.0% -43.6%
Share of electricity in final energy use (cf. 18.3% in 2008)
54.3% 26.6% 22.2%
Transportation sector end use energy consumption in 2050
33% biofuel 67% electric
0% petroleum
54% biofuel 46% electric
0% petroleum
60% biofuel 40% electric
0% petroleum
The implication of these results is clear: the past performance of the U.S. energy
sector with respect to both energy efficiency gains and decarbonization falls far short
of what will be required in the future. It will be impossible to achieve the mid-century
carbon emission reduction goal while at the same time maintaining a decent rate of
economic growth without major advances in both dimensions of performance relative
to past trends (see Figure 1).

Lester and Finan, “The Impact of Carbon Emission Reduction Targets” October 2009
11
Figure 1: Rates of decarbonization and energy efficiency improvements required by
each scenario
How difficult will it be to meet these requirements? We can gain insight into the
energy efficiency requirement by estimating the needs within individual energy end-
use sectors and comparing these with recent performance. Figure 2 shows the
recent historical trend in energy efficiency in each of the four main end-use sectors of
the economy, i.e., transportation, residential buildings, commercial buildings, and
industry. 9
9 In our model we estimate the energy efficiency requirement in each sector using the predictions of the Energy Information Administration’s 2009 Annual Energy Outlook (AEO2009). For each sector, we compute the ratio of sector-specific to economy-wide energy intensity trends in AEO2009 for the period from 2008 to 2030, and these same sector-to-average ratios are used in our model. They are: residential: 1.17; commercial: 0.87; industrial: 1.03; transportation: 0.94.
-0.20%
-2.16%
-4.03%
-3.05%
-2.58%
-4.50%
-2.33%
-4.75% -5.00%
-4.50%
-4.00%
-3.50%
-3.00%
-2.50%
-2.00%
-1.50%
-1.00%
-0.50%
0.00%
Rate of change of carbon content of energy supply
Rate of change of energy intensity of the economy
perc
ent c
hang
e pe
r yea
r Historical Trend, 1980-2009
"All Hands on Deck," 2008-2050
"No Nuclear/No Coal," 2008-2050
"Additionally Constrained," 2008-2050
Lester and Finan, “The Impact of Carbon Emission Reduction Targets” October 2009
12
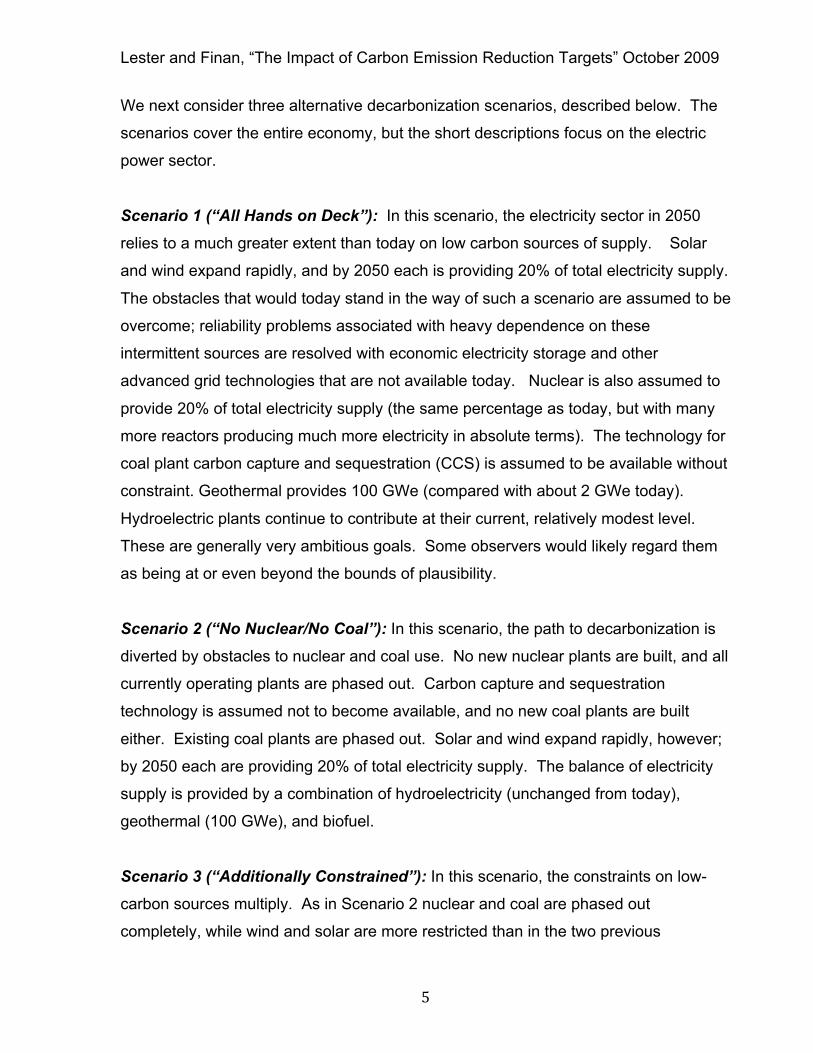
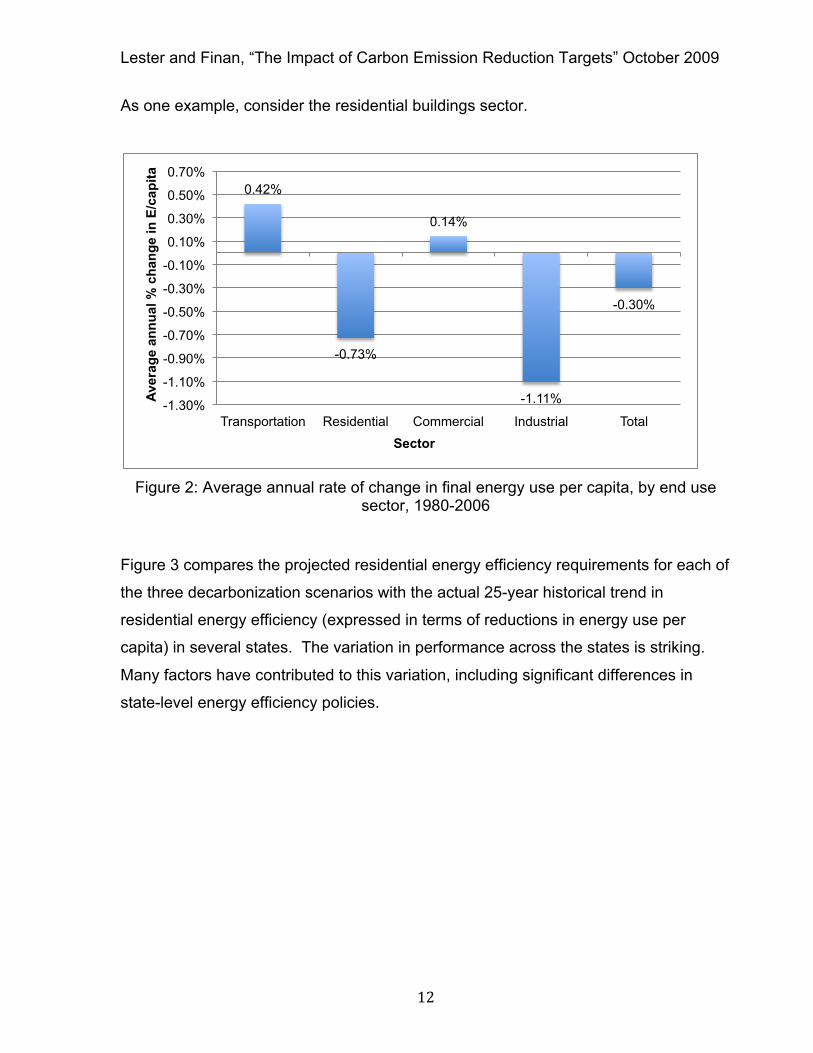
As one example, consider the residential buildings sector.
Figure 2: Average annual rate of change in final energy use per capita, by end use
sector, 1980-2006
Figure 3 compares the projected residential energy efficiency requirements for each of
the three decarbonization scenarios with the actual 25-year historical trend in
residential energy efficiency (expressed in terms of reductions in energy use per
capita) in several states. The variation in performance across the states is striking.
Many factors have contributed to this variation, including significant differences in
state-level energy efficiency policies.
0.42%
-0.73%
0.14%
-1.11%
-0.30%
-1.30%
-1.10%
-0.90%
-0.70%
-0.50%
-0.30%
-0.10%
0.10%
0.30%
0.50%
0.70%
Transportation Residential Commercial Industrial Total
Aver
age
annu
al %
cha
nge
in E
/cap
ita
Sector

Lester and Finan, “The Impact of Carbon Emission Reduction Targets” October 2009
13
Figure 3: Average annual change in residential energy use per capita (%/yr),
1980-2006
For the “All Hands on Deck” scenario, one way to achieve the required gains in
residential energy efficiency at the national level would be for every state to raise its
performance above the level of the best recent performers (i.e., California and Iowa.)
For the “No Nuclear/No Coal” and “Additionally Constrained” scenarios, however,
even this would fall far short of the need; in those cases, every state would have to
raise its performance to a level nearly three times that of California’s recent record.
The decarbonization requirements on the supply side of the energy infrastructure are
no less formidable. Focusing again on the implications for the electric power sector, in
the “All Hands on Deck” scenario we estimate that the average rate of installation of all
new generating capacity would be about 120,000 MWe per year. (This is almost
certainly an underestimate since our simple model makes no allowance for the need
for an adequate capacity reserve margin to maintain adequate grid reliability levels.)
-1.23% -1.10% -0.91% -0.74% -0.74% -0.64%
-0.41% -0.26% -0.03%
0.50%
1.18%
"All Hands on Deck" -1.58%
"No Nuclear/No Coal" -3.28%
"Additionally Constrained"
-3.58% -4.00%
-3.00%
-2.00%
-1.00%
0.00%
1.00%
2.00%
Cal
iforn
ia
Iow
a
Pen
nsyl
vani
a
Nat
iona
l Avg
Mas
sach
uset
ts
Texa
s
Illin
ois
New
Ham
pshi
re
Mis
siss
ippi
Wyo
min
g
Ala
ska
Res
iden
tial E
nerg
y pe
r cap
ita: %
cha
nge
p.a.
Lester and Finan, “The Impact of Carbon Emission Reduction Targets” October 2009
14
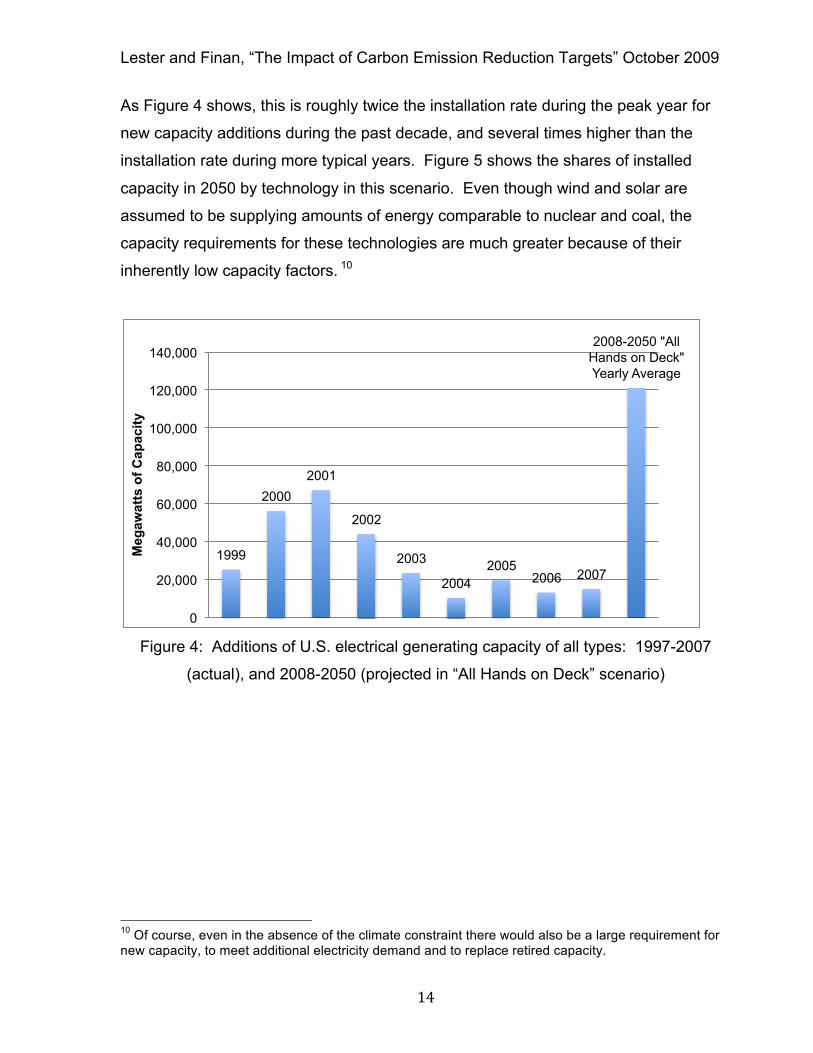
As Figure 4 shows, this is roughly twice the installation rate during the peak year for
new capacity additions during the past decade, and several times higher than the
installation rate during more typical years. Figure 5 shows the shares of installed
capacity in 2050 by technology in this scenario. Even though wind and solar are
assumed to be supplying amounts of energy comparable to nuclear and coal, the
capacity requirements for these technologies are much greater because of their
inherently low capacity factors. 10
Figure 4: Additions of U.S. electrical generating capacity of all types: 1997-2007
(actual), and 2008-2050 (projected in “All Hands on Deck” scenario)
10 Of course, even in the absence of the climate constraint there would also be a large requirement for new capacity, to meet additional electricity demand and to replace retired capacity.
1999
2000 2001
2002
2003
2004 2005
2006 2007
2008-2050 "All Hands on Deck" Yearly Average
0
20,000
40,000
60,000
80,000
100,000
120,000
140,000
Meg
awat
ts o
f Cap
acity

Lester and Finan, “The Impact of Carbon Emission Reduction Targets” October 2009
15
Figure 5: Total Installed Electrical Generating Capacity in 2050 for the “All Hands on
Deck” scenario (% share of electricity generation in parentheses)
Demand-response programs enabled by new ‘smart-grid’ technologies could
potentially reduce this capacity requirement. The main purpose of these programs is
to shave and shift in time the peak power demand that must be met by regional
electricity networks. Such measures are expected to be less expensive than installing
low-carbon capacity sufficient to meet daily and seasonal demand peaks. One
recent study found that demand-response programs could conceivably bring about a
reduction of 20% in peak demand by the year 2019. Here we make a simple estimate
of the potential impact of such programs on the requirements for new capacity through
2050. In the “All Hands on Deck” scenario, a demand-response strategy that lowered
the peak-to-average demand ratio from its current value of 1.75 for the U.S. as a
whole to, say, 1.25 by the year 2050 (i.e., a 28% reduction in peak demand) would
avoid the need to build 288 GWe of coal with CCS, 140 GWe of nuclear, 28 GWe of
1010 GWe
490 GWe
100 GWe
100 GWe
1464 GWe
1255 GWe
Coal w/CCS
Nuclear
Hydroelectric
Geothermal
Solar/PV
Wind
(20%)
(32%)
(20%)
(20%)
(3%)
(5%)

Lester and Finan, “The Impact of Carbon Emission Reduction Targets” October 2009
16
geothermal, 416 GWe of solar, and 356 GWe of wind between 2008 and 2050.11
Taken together this represents more than the total installed nameplate electricity
generating capacity in the U.S. today.
The role of natural gas: Natural gas plays only a modest role in our scenarios. In
most applications it is displaced by advanced biofuels, which emit less CO2 per unit of
energy output. Recent advances in drilling technology promise to increase greatly the
amount of gas that is economically recoverable from shale.12 This has led to
suggestions that natural gas may hold the key to the energy transition, either as a
bridge fuel or in the longer-term as a complement to intermittent renewables.13 Of
course, from the perspective of carbon emissions natural gas is not a ‘clean’ fuel,
although it emits significantly less carbon dioxide per unit of energy than, say, coal. If
combined with carbon capture and storage, natural gas could be an alternative to the
large scale use of coal in the electric power sector, though many of the economic and
other obstacles that stand in the way of implementing CCS with coal-fired power
would apply in this case too.14 In the absence of CCS, natural gas could only serve as
a transitional fuel, and from a carbon emissions perspective it would be less attractive
than advanced biofuels, for which it might otherwise substitute.
11 For this simple calculation we assume that each type of generation contributes to meeting the peak demand in the same proportion that it contributes to meeting energy requirements. 12 The Potential Gas Committee’s 2008 year-end assessment estimates that the U.S. has a total available future supply of 2,074 Tcf. 13 For example, see John E. Podesta and Timothy E. Wirth “Natural Gas: A Bridge Fuel for the 21st Century” The Center for American Progress, August 10, 2009. 14 Even with the additional resource estimates, natural gas suffers from a resource limitation relative to coal. Give the numbers for the “All Hands on Deck” scenario, if natural gas with CCS were to replace coal with CCS in 2050, and its generation were to remain flat at that level, the estimated future US supply of 2,074.1 trillion cubic feet would be exhausted within 50 years. Since some would be consumed leading up to 2050, and since demand would continue to increase after 2050, the timeframe for resource exhaustion would be even shorter without a further increase in supply.

Lester and Finan, “The Impact of Carbon Emission Reduction Targets” October 2009
17
Conclusions Officials in both the executive and legislative branches of the U.S. government have
declared their support for the goal of reducing U.S. carbon emissions by 80% or more
by 2050. At the upcoming U.N. Climate Change Conference in Copenhagen in
December the U.S. may commit to such a goal as part of what is expected to be the
follow-on to the first phase of the Kyoto Protocol, which expires in 2012. This analysis
has examined some of the implications of achieving a goal of this magnitude for the
U.S. energy sector and for the economy more generally.
In essence, the recent energy efficiency and decarbonization performance of the U.S.
economy falls far short of what would be required to achieve the goal. One indication
of the size of the task ahead is that if the energy intensity of the economy were to
continue to decline at the same rate as during the last 25 years, the economy could
not grow faster than roughly 1% per year per capita between now and mid-century,
even with extraordinarily high rates of installation of solar, wind, geothermal, nuclear
and coal-fired generating capacity with carbon capture and storage. And if the
economy were to grow instead at a more acceptable (but still relatively modest) rate of
2% per year per capita, even heroic decarbonization measures would fail to yield the
desired emission reductions unless, in addition, the country were to move onto a path
of rapidly declining energy intensity and remain on that path for decades. Since most
of the low carbon energy supply technologies are more expensive than the incumbent
high-carbon energy sources, this analysis also draws attention to the need for a
sustained flow of innovations in many different fields of application in order to bring
down the costs of these low-carbon alternatives.

Lester and Finan, “The Impact of Carbon Emission Reduction Targets” October 2009
18
Appendix
To investigate the implications of adhering to alternative carbon emission reduction
goals, a simple model based on the differential form of the basic identity
!
C= CE"
# $
%
& ' (
EY"
# $
%
& ' (
YP"
# $
%
& ' (P
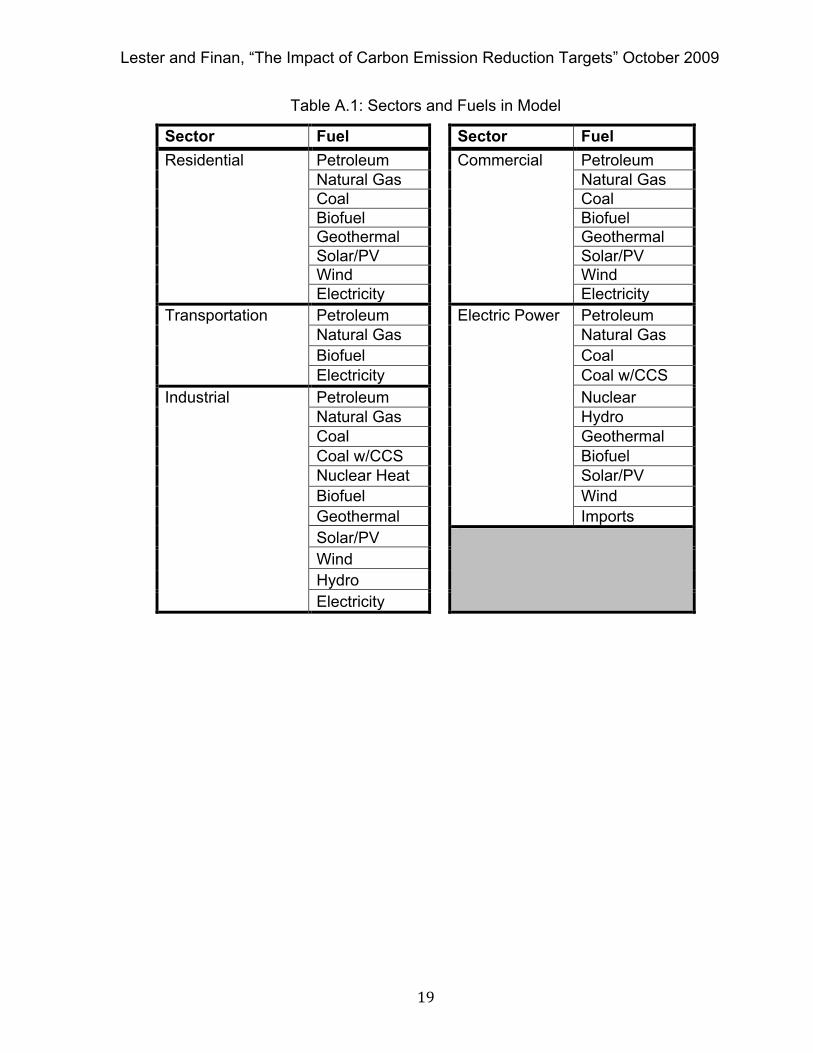
is applied to the energy use of the U.S. economy between 2008 and 2050. Actual
U.S. energy use in the base year of 2007 is broken down by sector and by fuel, as
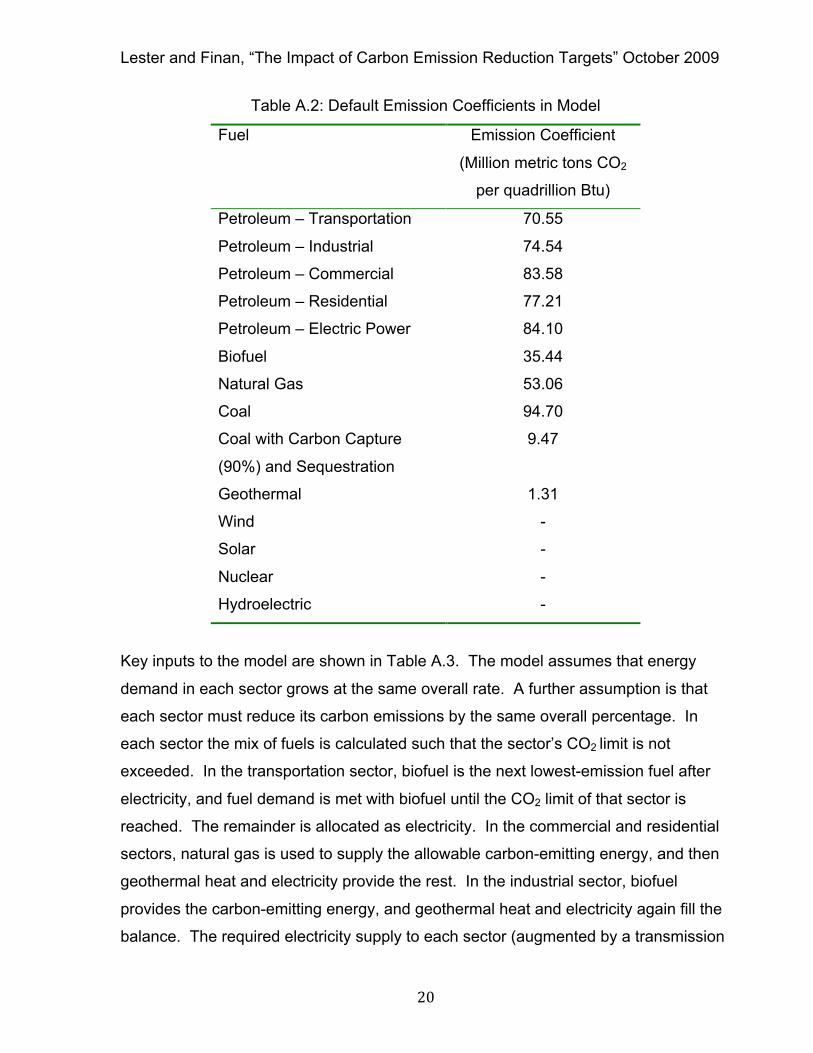
shown schematically in Table A.1. Carbon emissions are calculated based on the
2006 CO2 emission factors for each fuel/sector combination reported by the Energy
Information Administration, with the exception of biofuels, which are assumed to have
emissions 50% below those of transportation petroleum fuels.15 The emission factors
for biofuels are a subject of considerable debate, with published estimates ranging
from twice the rate of emissions from gasoline to net negative emissions. 16 The
biofuels emissions factor assumed here is meant to serve as a conservative estimate
of what might be achievable in the near term. “Electricity” in the residential,
commercial, industrial, and transportation sectors does not contribute to those sectors’
CO2 emissions, as electricity-related emissions are accounted for separately in the
electric power sector. The emission factors used in the model are shown in Table A.2.
15 “Carbon Dioxide Emission Factors (1980-2006)” Energy Information Administration. http://www.eia.doe.gov/oiaf/1605/ggrpt/excel/CO2_coeff.xls 16 For example: Timothy Searchinger, Ralph Heimlich, R.A. Houghton, Fengxia Dong, Amani Elobeid, Jacinto Fabiosa, Simla Tokgoz, Dermot Hayes, Tun-Hsiang Yu “Use of U.S. Croplands for Biofuels Increases Greenhouse Gases Through Emissions from Land-Use Change” Science Vol. 319 February 29, 2008; Environmental Protection Agency “EPA Lifecycle Analysis of Greenhouse Gas Emissions from Renewable Fuels” EPA-420-F-09-024, May 2009 http://www.epa.gov/oms/renewablefuels/420f09024.pdf; Delucchi, Mark A. “Lifecycle Analysis of CO2-Equivalent Greenhouse-Gas Emissions from Biofuels” Presentation June 4-5, 2007, Copenhagen, Denmark.
Lester and Finan, “The Impact of Carbon Emission Reduction Targets” October 2009
19
Table A.1: Sectors and Fuels in Model
Sector Fuel Sector Fuel Residential Petroleum Commercial Petroleum
Natural Gas Natural Gas Coal Coal Biofuel Biofuel Geothermal Geothermal Solar/PV Solar/PV Wind Wind Electricity Electricity
Transportation Petroleum Electric Power Petroleum Natural Gas Natural Gas Biofuel Coal Electricity Coal w/CCS
Industrial Petroleum Nuclear Natural Gas Hydro Coal Geothermal Coal w/CCS Biofuel Nuclear Heat Solar/PV Biofuel Wind Geothermal Imports Solar/PV Wind Hydro Electricity
Lester and Finan, “The Impact of Carbon Emission Reduction Targets” October 2009
20
Table A.2: Default Emission Coefficients in Model
Fuel Emission Coefficient
(Million metric tons CO2
per quadrillion Btu)
Petroleum – Transportation 70.55
Petroleum – Industrial 74.54
Petroleum – Commercial 83.58
Petroleum – Residential 77.21
Petroleum – Electric Power 84.10
Biofuel 35.44
Natural Gas 53.06
Coal 94.70
Coal with Carbon Capture
(90%) and Sequestration
9.47
Geothermal 1.31
Wind -
Solar -
Nuclear -
Hydroelectric -
Key inputs to the model are shown in Table A.3. The model assumes that energy
demand in each sector grows at the same overall rate. A further assumption is that
each sector must reduce its carbon emissions by the same overall percentage. In
each sector the mix of fuels is calculated such that the sector’s CO2 limit is not
exceeded. In the transportation sector, biofuel is the next lowest-emission fuel after
electricity, and fuel demand is met with biofuel until the CO2 limit of that sector is
reached. The remainder is allocated as electricity. In the commercial and residential
sectors, natural gas is used to supply the allowable carbon-emitting energy, and then
geothermal heat and electricity provide the rest. In the industrial sector, biofuel
provides the carbon-emitting energy, and geothermal heat and electricity again fill the
balance. The required electricity supply to each sector (augmented by a transmission

Lester and Finan, “The Impact of Carbon Emission Reduction Targets” October 2009
21
and distribution loss factor) is summed over all sectors and this determines the total
electricity supply. The mix of fuels to the electric power sector is then determined
consistent with the scenario assumptions such that its permitted CO2 emissions are
not exceeded.
Table A.3: Key Inputs for Model
Rates of Change (% per year)
CO2 Reduction Goal Emissions Factors Other
• Population • % Reduction of CO2 emissions
• CCS capture efficiency (%)
• Peak to average power demand ratio
• GDP per Capita
• Base year for CO2 comparison (1990, 2000, 2008)
• CO2 reduction for biofuels versus petroleum
• Contribution of each fuel to the energy generation for each sector • Energy
Intensity of GDP
• End year (2050 considered here)
Once the fuel mix has been determined for the electric power sector, the model
calculates the equivalent installed capacity required to meet the electricity demand in
that year, based on realistic or historical capacity factors and thermal-to-electric
conversion factors, as well as an assumed peak-to-average power demand ratio. The
capacity factors used for this analysis are given in Table A.4. The peak power
demand is set at 175% of the average demand in the base case, which implies that
installed capacity must be enough to supply 175% of the average demand. This
requirement is spread among technologies proportional to their contribution to total
electricity generation. This distribution would almost certainly not be the optimal way of
meeting peak demand, but further study on the use of renewables and energy storage
to satisfy peak power demand is needed to assess this situation more fully. The model
subsequently calculates the required installation rate for the intervening years for a
number of the technologies, where the starting years for installing nuclear and coal
with carbon capture and sequestration are adjustable.

Lester and Finan, “The Impact of Carbon Emission Reduction Targets” October 2009
22
Table A.4: Default Capacity Factors in Model
Electric Power Source Capacity Factor
Coal 73%
Coal with Carbon Capture
and Sequestration 70%
Nuclear 90%
Hydroelectric 42%
Geothermal 90%
Solar/PV 30%
Wind 35%
This model is a simple representation of energy-related CO2 emissions, and does not
model interactions between policies, the energy system, and the economy as a whole.
As such, it is not appropriate for predicting how a policy will affect the U.S. economy
and energy system in practice, but rather is a useful tool for exploring possible energy
pathways for meeting emission goals, and for revealing pathways that cannot meet
those goals.