Embed Size (px)
Citation preview
Quantifying Source Contributions to O3 and PM2.5 Pollution Episodes
across the Eastern US Tracey Holloway
Professor, University of Wisconsin—Madison
Deputy Leader, NASA Air Quality Applied Sciences Team
April 22, 2014

satellites
suborbital platforms
models
AQAST
Pollution monitoring
Exposure assessment
AQ forecasting
Source attribution
Quantifying emissions
Natural & foreign
influences
AQ processes
Climate-AQ
interactions AQAST
Why is AQAST Unique?
All AQAST projects connect Earth Science and air quality management:
Pursue science to support air quality management
Collaborate with partners in air quality management
Expand relationships through meetings, online tools, newsletters
AQAST has flexibility in how it allocates its resources
Members can adjust work plans to meet evolving air quality needs
Multi-member “Tiger Teams” compete for funding to address strategic
problems requiring coordinated activity
AQAST is self-organizing and can respond quickly to demands
AQAST supports two types of projects:
Investigator Projects – core funding to individual members
Tiger Team Projects – collaborations between AQAST members with
supplementary funding to address urgent air quality management needs
Quick, collaborative, flexible, responsive to the needs of the AQ community
www.aqast.org & www.aqast-media.org

AQAST members
• Daniel Jacob (leader), Loretta Mickley (Harvard)
• Tracey Holloway (deputy leader), Steve Ackerman (U.
Wisconsin); Bart Sponseller (Wisconsin DNR)
• Greg Carmichael (U. Iowa)
• Dan Cohan (Rice U.)
• Russ Dickerson (U. Maryland)
• Bryan Duncan, Yasuko Yoshida, Melanie Follette-Cook
(NASA/GSFC); Jennifer Olson (NASA/LaRC)
• David Edwards (NCAR)
• Arlene Fiore (Columbia Univ.); Meiyun Lin (Princeton)
• Jack Fishman, Ben de Foy (Saint Louis U.)
• Daven Henze, Jana Milford (U. Colorado)
• Edward Hyer, Jeff Reid, Doug Westphal, Kim Richardson (NRL)
• Pius Lee, Tianfeng Chai (NOAA/NESDIS)
• Yang Liu, Matthew Strickland (Emory U.), Bin Yu (UC Berkeley)
• Richard McNider, Arastoo Biazar (U. Alabama – Huntsville)
• Brad Pierce (NOAA/NESDIS)
• Ted Russell, Yongtao Hu, Talat Odman (Georgia Tech); Lorraine
Remer (NASA/GSFC)
• David Streets (Argonne)
• Jim Szykman (EPA/ORD/NERL)
• Anne Thompson, William Ryan, Suellen Haupt (Penn State U.)

Scope of current AQAST projects
AQ Management
• Local: RAQC, BAAQD
• State: TCEQ, MDE,
Wisconsin DNR, CARB,
Iowa DNR, GAEPD, GFC
• Regional: LADCO, EPA
Region 8
• National: EPA, NOAA,
NPS
Theme
Earth Science resource
Satellites: MODIS, MISR, MOPITT, AIRS, OMI, TES, GOES
Suborbital: ARCTAS, DISCOVER-AQ, ozonesondes, PANDORA
Models: MOZART, CAM AM-3, GEOS-Chem, RAQMS, STEM, GISS,
IPCC, CMAQ, CAMx, WRF-Chem

2013 Tiger Team Process
1. Merit. Is the work proposed sound, creative, interesting, important?
2. Responsiveness. Does it address a pressing AQ management need?
3. Uniqueness. Does it use Earth Science assets that go beyond standard AQ tools?
4. Team. Will team members effectively work together?
6
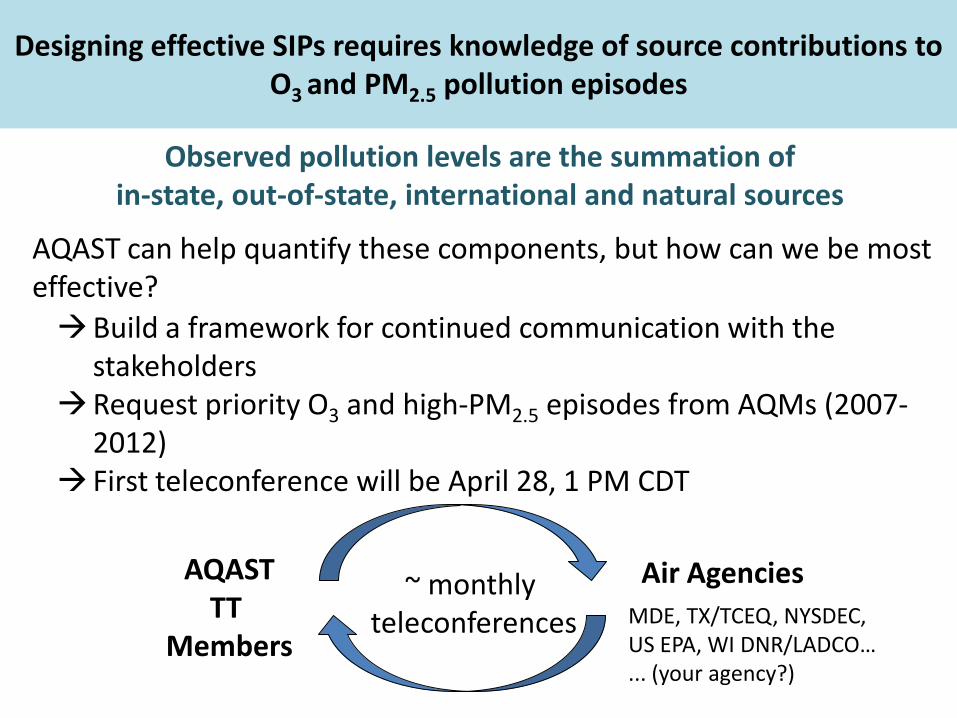
Designing effective SIPs requires knowledge of source contributions to O3 and PM2.5 pollution episodes
Observed pollution levels are the summation of in-state, out-of-state, international and natural sources
AQAST can help quantify these components, but how can we be most effective?
Build a framework for continued communication with the stakeholders
Request priority O3 and high-PM2.5 episodes from AQMs (2007-2012)
First teleconference will be April 28, 1 PM CDT
AQAST TT
Members
Air Agencies ~ monthly teleconferences MDE, TX/TCEQ, NYSDEC,
US EPA, WI DNR/LADCO… ... (your agency?)
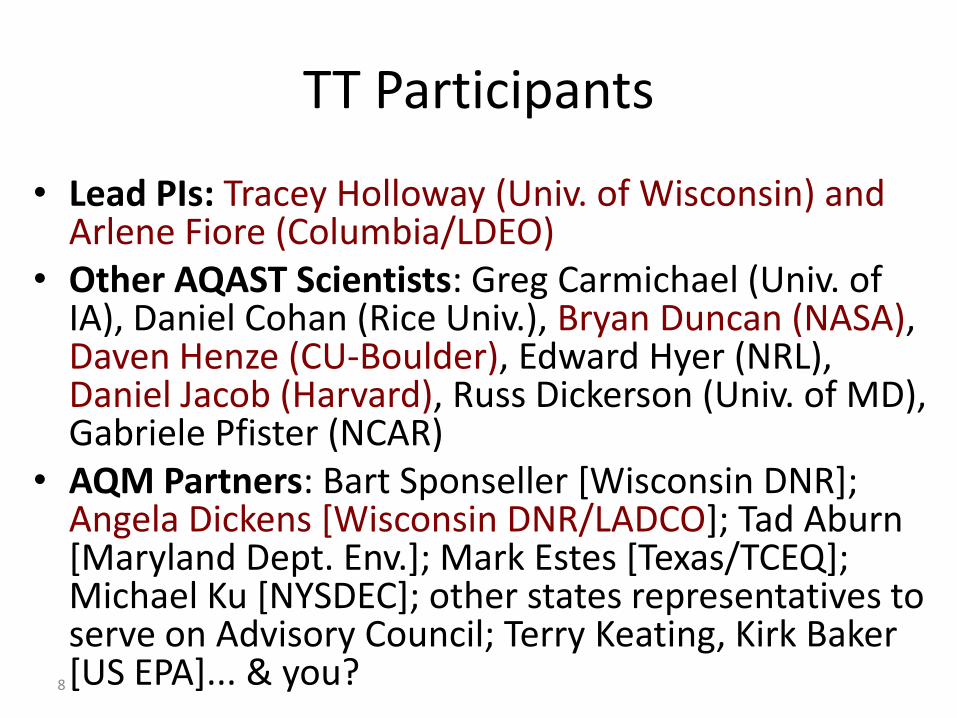
TT Participants
• Lead PIs: Tracey Holloway (Univ. of Wisconsin) and Arlene Fiore (Columbia/LDEO)
• Other AQAST Scientists: Greg Carmichael (Univ. of IA), Daniel Cohan (Rice Univ.), Bryan Duncan (NASA), Daven Henze (CU-Boulder), Edward Hyer (NRL), Daniel Jacob (Harvard), Russ Dickerson (Univ. of MD), Gabriele Pfister (NCAR)
• AQM Partners: Bart Sponseller [Wisconsin DNR]; Angela Dickens [Wisconsin DNR/LADCO]; Tad Aburn [Maryland Dept. Env.]; Mark Estes [Texas/TCEQ]; Michael Ku [NYSDEC]; other states representatives to serve on Advisory Council; Terry Keating, Kirk Baker [US EPA]... & you?
8
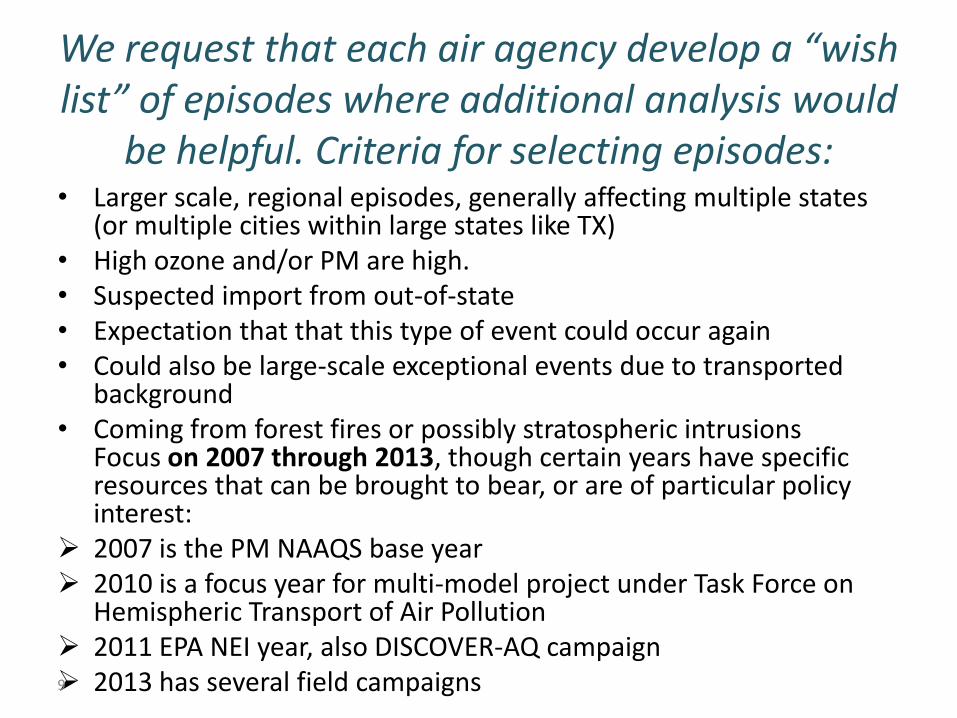
We request that each air agency develop a “wish list” of episodes where additional analysis would
be helpful. Criteria for selecting episodes: • Larger scale, regional episodes, generally affecting multiple states
(or multiple cities within large states like TX) • High ozone and/or PM are high. • Suspected import from out-of-state • Expectation that that this type of event could occur again • Could also be large-scale exceptional events due to transported
background • Coming from forest fires or possibly stratospheric intrusions
Focus on 2007 through 2013, though certain years have specific resources that can be brought to bear, or are of particular policy interest:
2007 is the PM NAAQS base year 2010 is a focus year for multi-model project under Task Force on
Hemispheric Transport of Air Pollution 2011 EPA NEI year, also DISCOVER-AQ campaign 2013 has several field campaigns 9
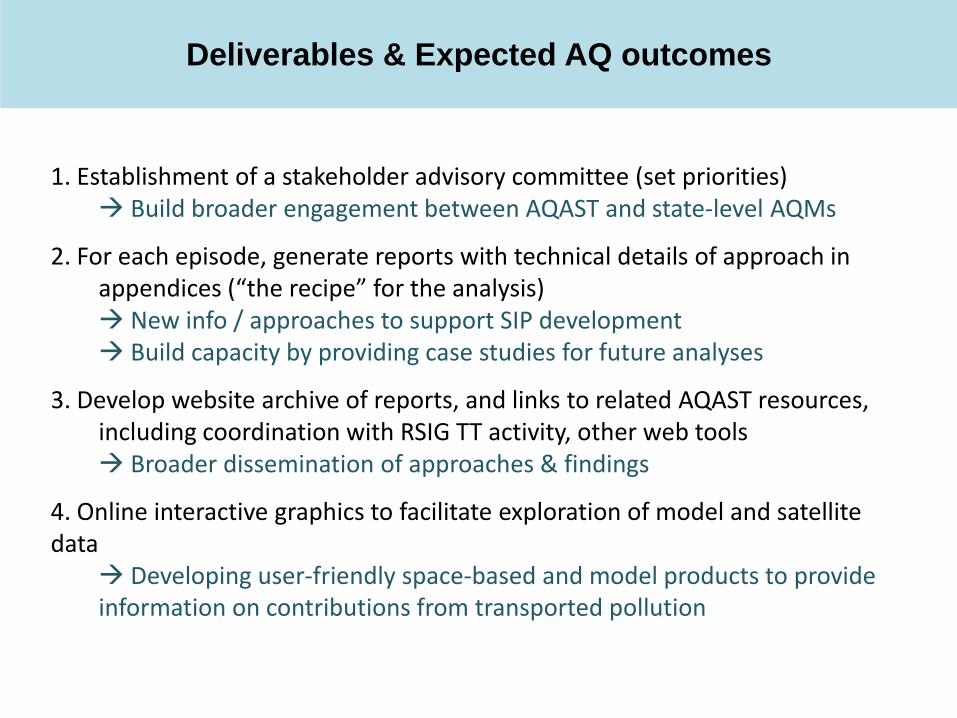
Deliverables & Expected AQ outcomes
1. Establishment of a stakeholder advisory committee (set priorities) Build broader engagement between AQAST and state-level AQMs
2. For each episode, generate reports with technical details of approach in appendices (“the recipe” for the analysis) New info / approaches to support SIP development Build capacity by providing case studies for future analyses
3. Develop website archive of reports, and links to related AQAST resources, including coordination with RSIG TT activity, other web tools Broader dissemination of approaches & findings
4. Online interactive graphics to facilitate exploration of model and satellite data Developing user-friendly space-based and model products to provide information on contributions from transported pollution
11
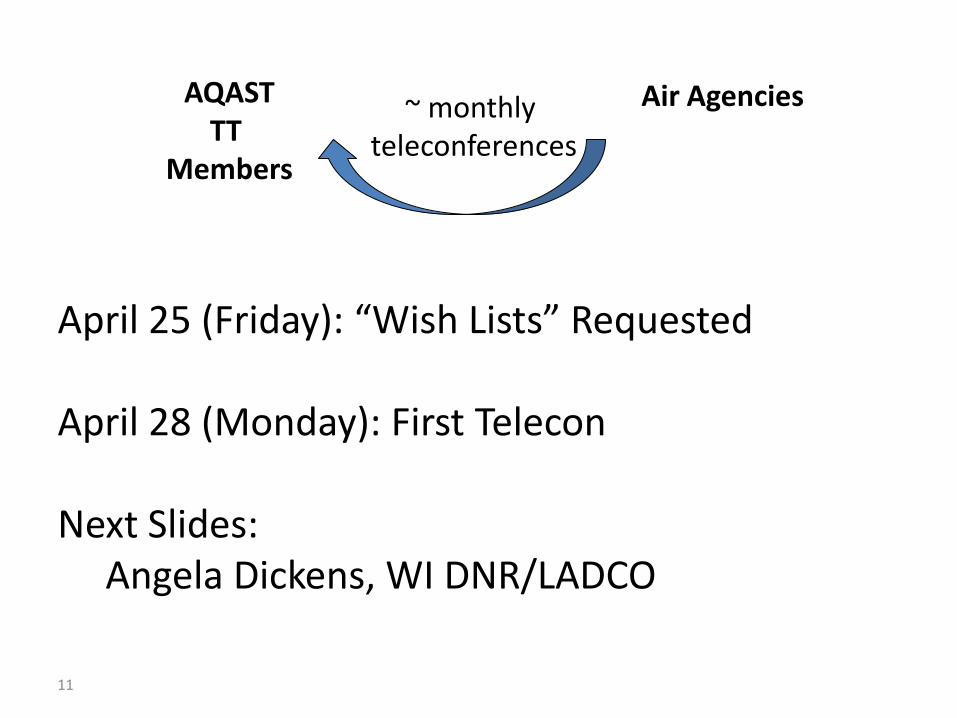
AQAST TT
Members
Air Agencies ~ monthly teleconferences
April 25 (Friday): “Wish Lists” Requested April 28 (Monday): First Telecon Next Slides: Angela Dickens, WI DNR/LADCO

12
60
65
70
75
80
85
90
95
100 4
/7
4/1
4
4/2
1
4/2
8
5/5
5
/12
5
/19
5
/26
6
/2
6/9
6
/16
6
/23
6
/30
7
/7
7/1
4
7/2
1
7/2
8
8/4
8
/11
8
/18
8
/25
9
/1
9/8
9
/15
9
/22
9
/29
1
0/6
1
0/1
3
10
/20
Ozo
ne
Co
nce
ntr
atio
n (
pp
b)
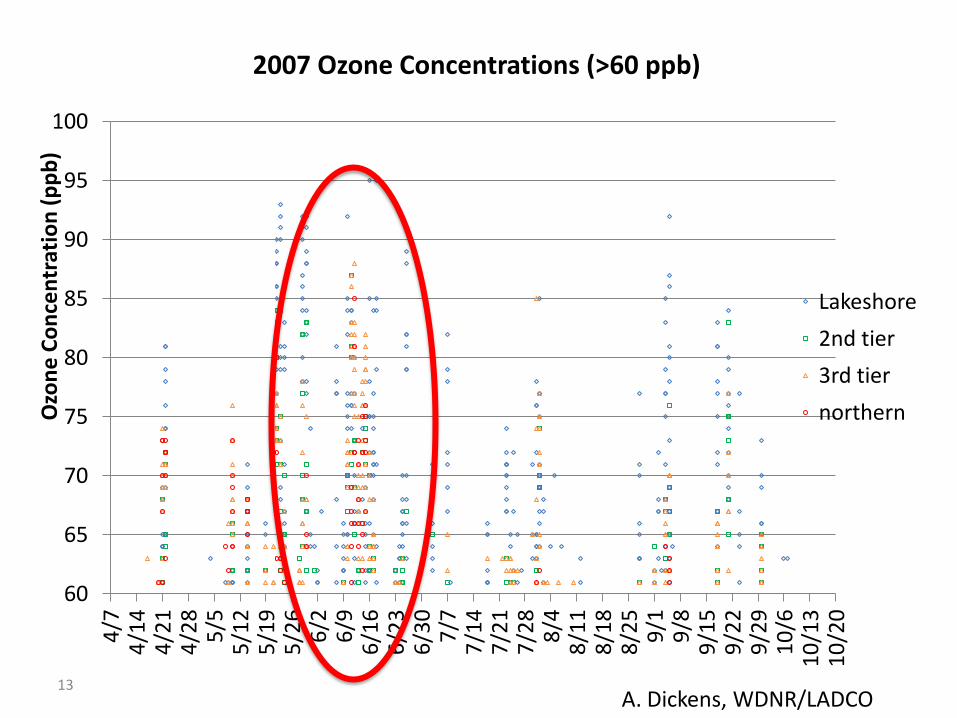
2007 Ozone Concentrations (>60 ppb)
Lakeshore
2nd tier
3rd tier
northern
A. Dickens, WDNR/LADCO
13
60
65
70
75
80
85
90
95
100 4
/7
4/1
4
4/2
1
4/2
8
5/5
5
/12
5
/19
5
/26
6
/2
6/9
6
/16
6
/23
6
/30
7
/7
7/1
4
7/2
1
7/2
8
8/4
8
/11
8
/18
8
/25
9
/1
9/8
9
/15
9
/22
9
/29
1
0/6
1
0/1
3
10
/20
Ozo
ne
Co
nce
ntr
atio
n (
pp
b)
2007 Ozone Concentrations (>60 ppb)
Lakeshore
2nd tier
3rd tier
northern
A. Dickens, WDNR/LADCO
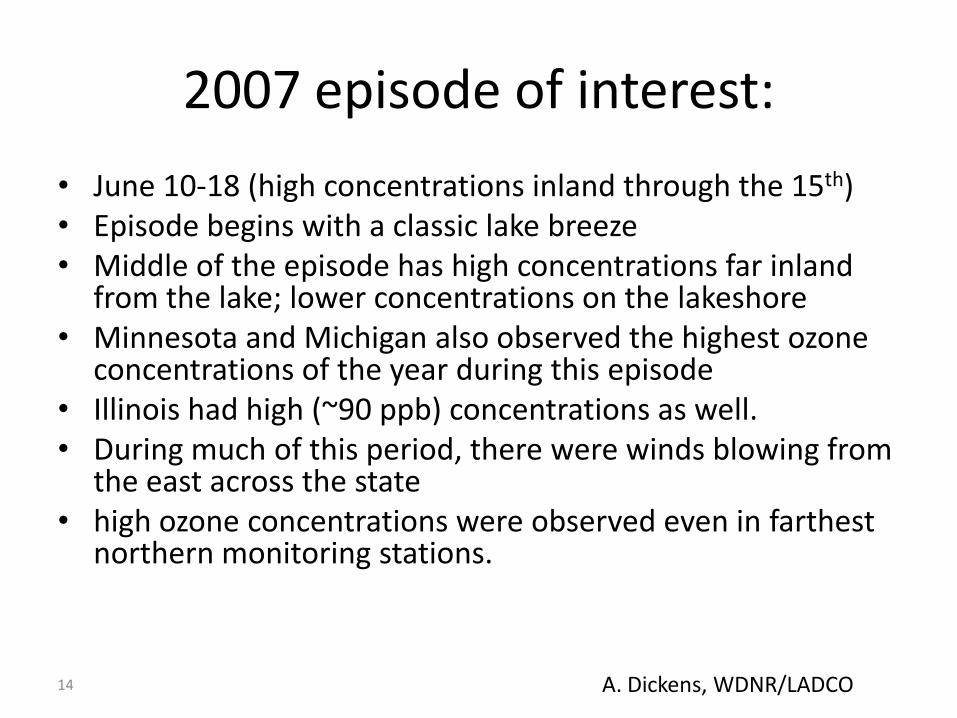
2007 episode of interest:
• June 10-18 (high concentrations inland through the 15th) • Episode begins with a classic lake breeze • Middle of the episode has high concentrations far inland
from the lake; lower concentrations on the lakeshore • Minnesota and Michigan also observed the highest ozone
concentrations of the year during this episode • Illinois had high (~90 ppb) concentrations as well. • During much of this period, there were winds blowing from
the east across the state • high ozone concentrations were observed even in farthest
northern monitoring stations.
14 A. Dickens, WDNR/LADCO
What tools and data can support analysis of this episode?
15

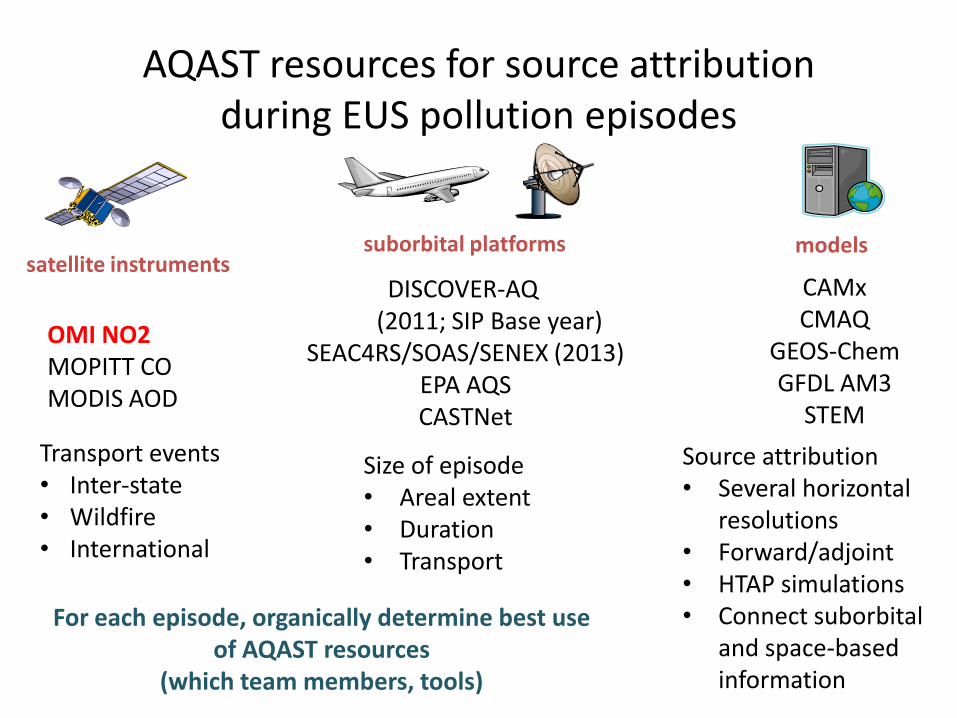
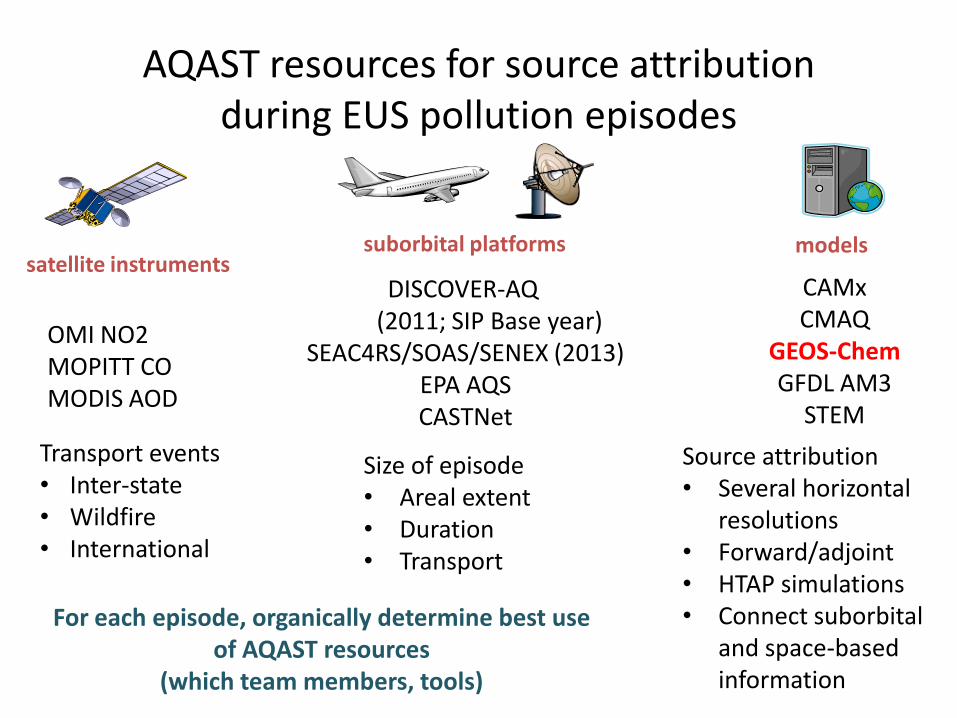
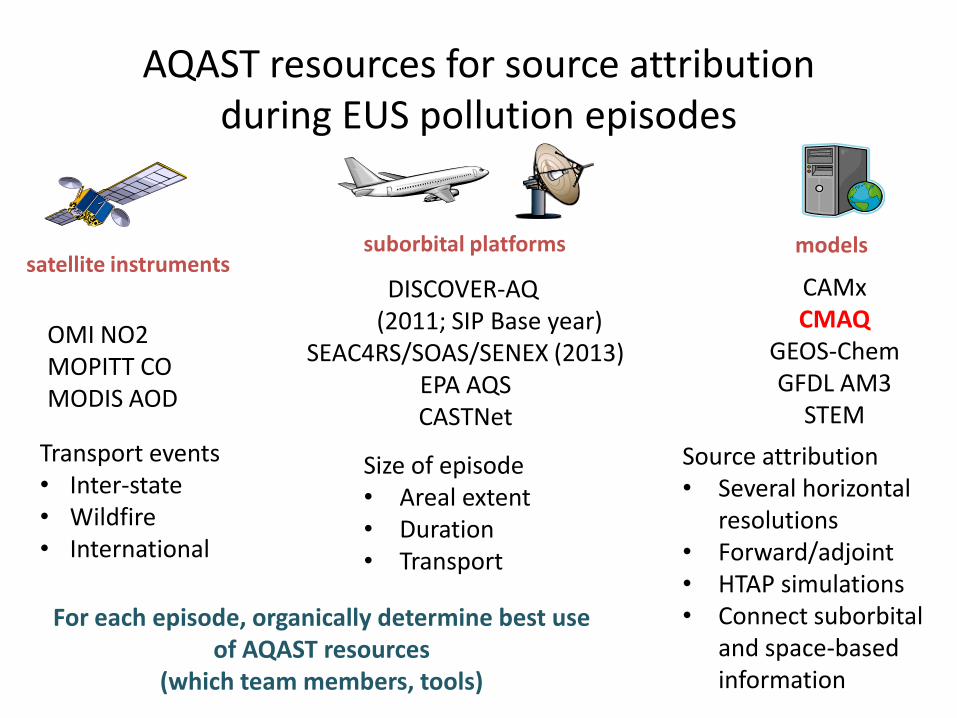
AQAST resources for source attribution during EUS pollution episodes
satellite instruments suborbital platforms models
DISCOVER-AQ (2011; SIP Base year)
SEAC4RS/SOAS/SENEX (2013) EPA AQS CASTNet
OMI NO2 MOPITT CO MODIS AOD
CAMx CMAQ
GEOS-Chem GFDL AM3
STEM
Transport events • Inter-state • Wildfire • International
Size of episode • Areal extent • Duration • Transport
Source attribution • Several horizontal
resolutions • Forward/adjoint • HTAP simulations • Connect suborbital
and space-based information
For each episode, organically determine best use of AQAST resources
(which team members, tools)
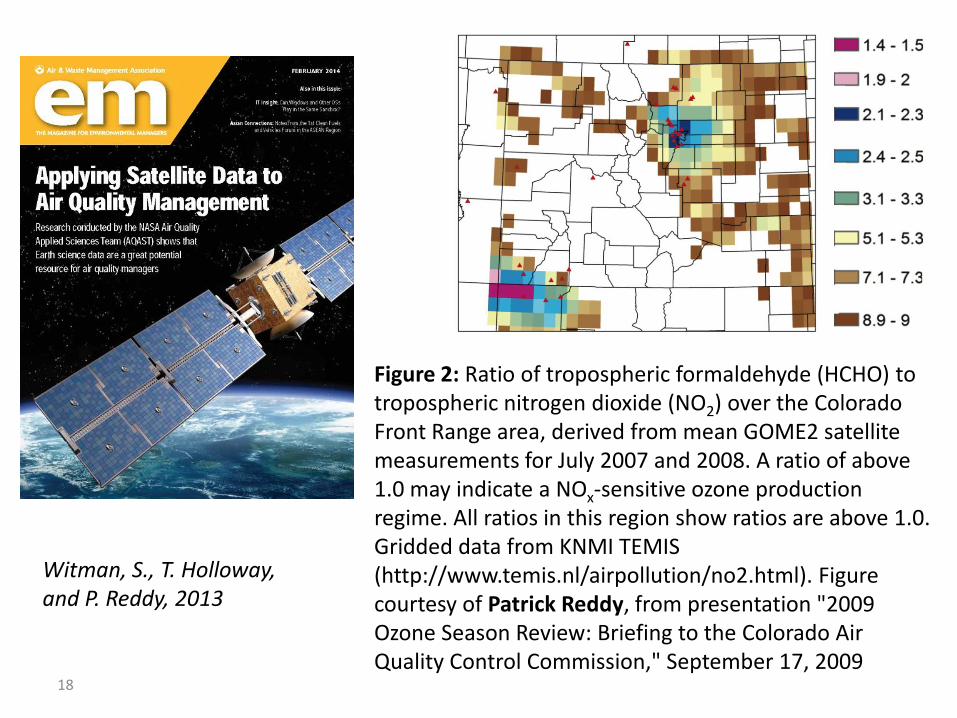
18
Figure 2: Ratio of tropospheric formaldehyde (HCHO) to tropospheric nitrogen dioxide (NO2) over the Colorado Front Range area, derived from mean GOME2 satellite measurements for July 2007 and 2008. A ratio of above 1.0 may indicate a NOx-sensitive ozone production regime. All ratios in this region show ratios are above 1.0. Gridded data from KNMI TEMIS (http://www.temis.nl/airpollution/no2.html). Figure courtesy of Patrick Reddy, from presentation "2009 Ozone Season Review: Briefing to the Colorado Air Quality Control Commission," September 17, 2009
Witman, S., T. Holloway, and P. Reddy, 2013
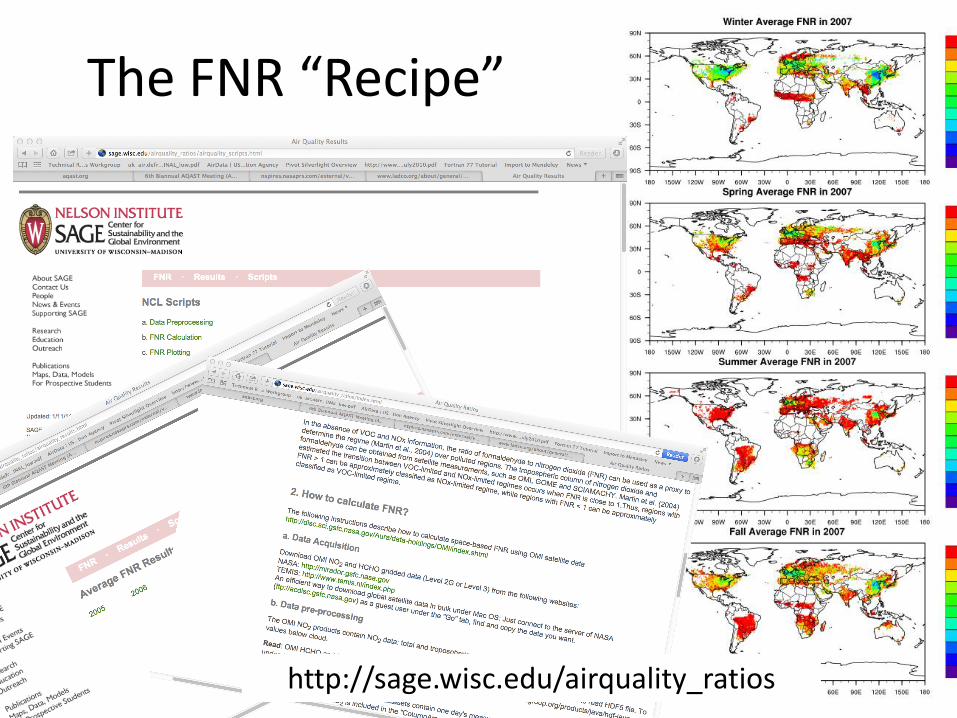
The FNR “Recipe”
19 http://sage.wisc.edu/airquality_ratios

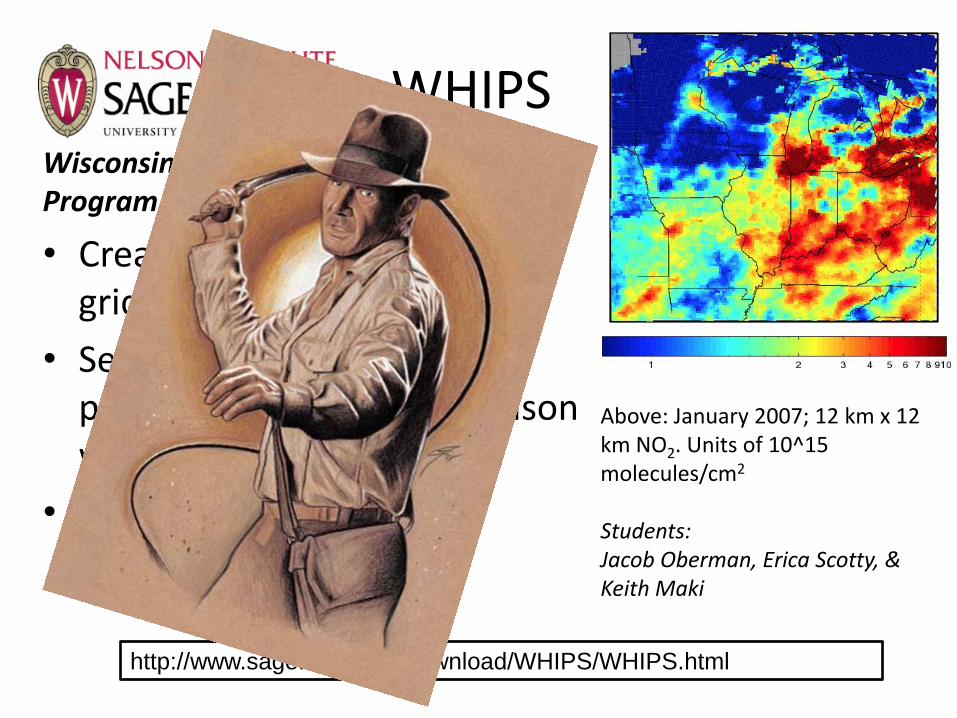
WHIPS Wisconsin Horizontal Interpolation Program for Satellites
• Create custom “Level-3” gridded satellite data
• Select grid resolution and projection – easier comparison with regional models
• NO2 (KNMI & NASA), CO (MOPITT), MODIS AOD
Above: January 2007; 12 km x 12 km NO2. Units of 10^15 molecules/cm2 Students: Jacob Oberman, Erica Scotty, & Keith Maki
http://www.sage.wisc.edu/download/WHIPS/WHIPS.html

Allows comparison across satellites, from satellite to model, satellite to ground-based measurements, etc.
Satellite Fixed grid
Aligning Satellite & Model Data
Jacob Oberman
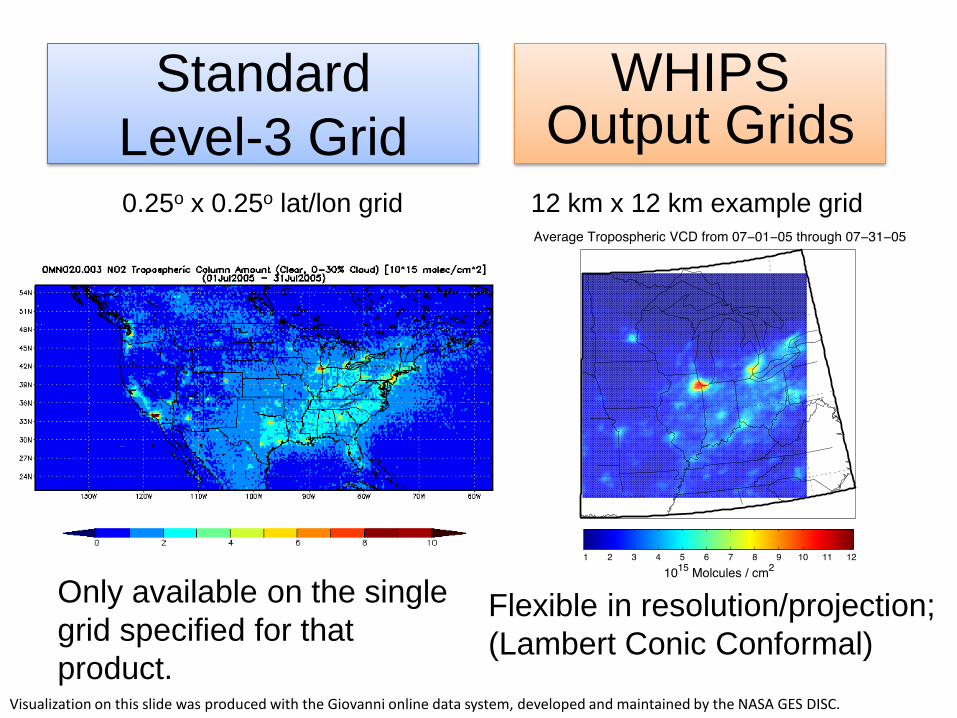
Standard
Level-3 Grid
Only available on the single
grid specified for that
product.
0.25o x 0.25o lat/lon grid
Visualization on this slide was produced with the Giovanni online data system, developed and maintained by the NASA GES DISC.
WHIPS Output Grids
Flexible in resolution/projection;
(Lambert Conic Conformal)
12 km x 12 km example grid
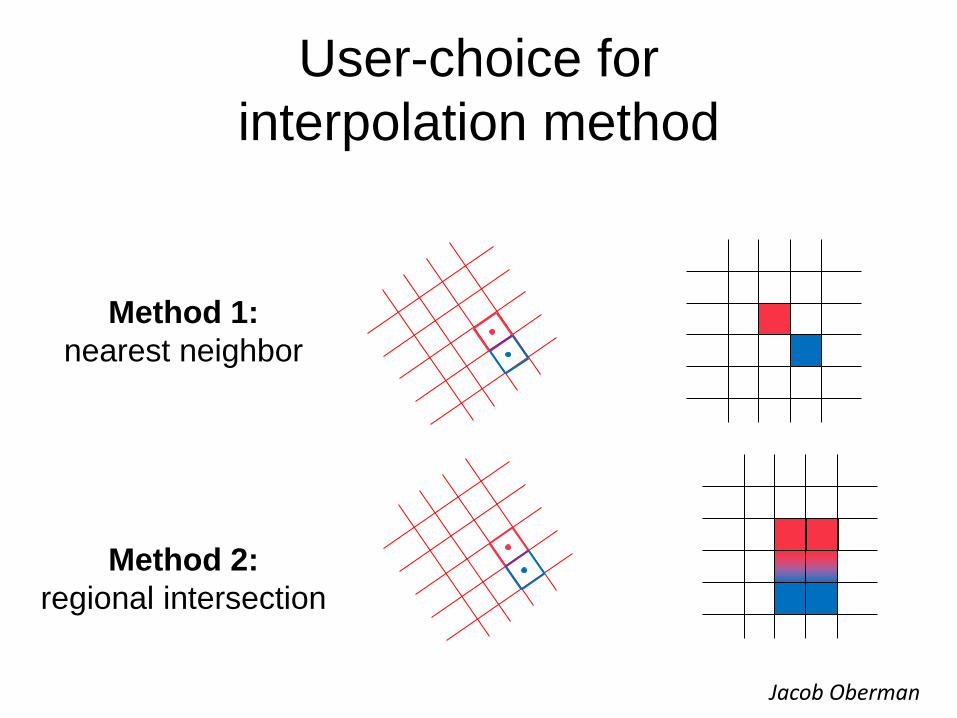
User-choice for
interpolation method
Method 1:
nearest neighbor
Method 2:
regional intersection
Jacob Oberman
25
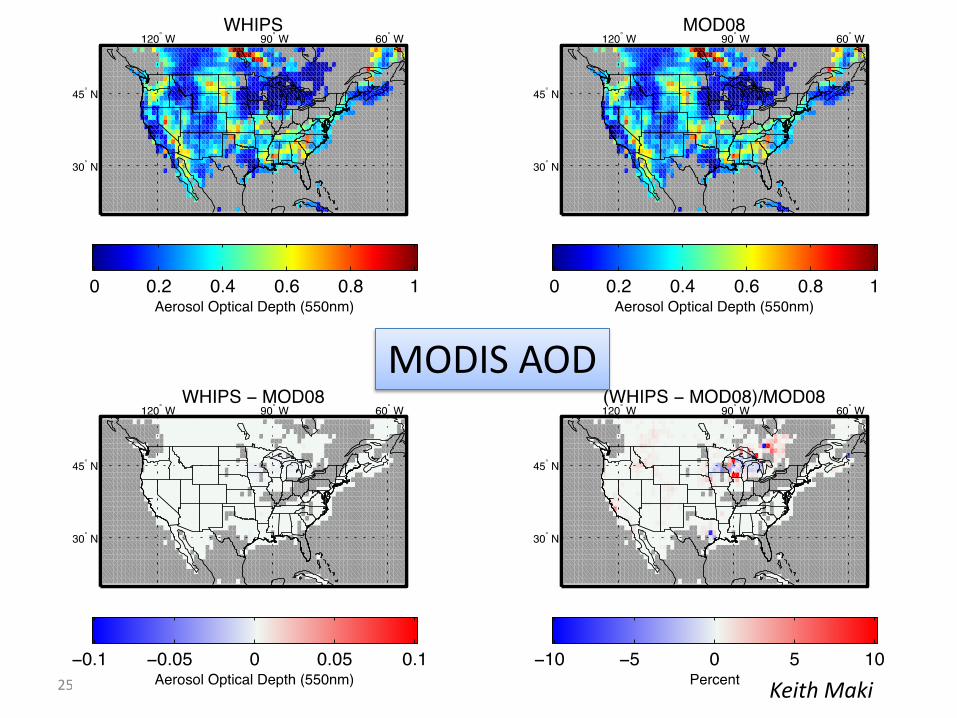
MODIS AOD
Keith Maki
AQAST resources for source attribution during EUS pollution episodes
satellite instruments suborbital platforms models
DISCOVER-AQ (2011; SIP Base year)
SEAC4RS/SOAS/SENEX (2013) EPA AQS CASTNet
OMI NO2 MOPITT CO MODIS AOD
CAMx CMAQ
GEOS-Chem GFDL AM3
STEM
Transport events • Inter-state • Wildfire • International
Size of episode • Areal extent • Duration • Transport
Source attribution • Several horizontal
resolutions • Forward/adjoint • HTAP simulations • Connect suborbital
and space-based information
For each episode, organically determine best use of AQAST resources
(which team members, tools)

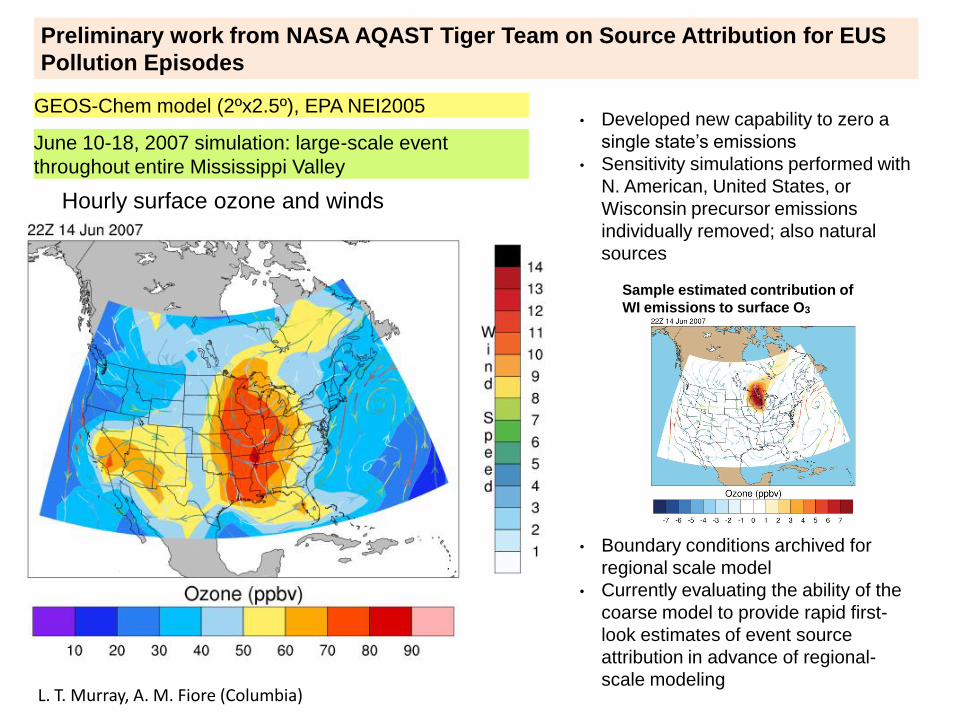
• Boundary conditions archived for
regional scale model
• Currently evaluating the ability of the
coarse model to provide rapid first-
look estimates of event source
attribution in advance of regional-
scale modeling
GEOS-Chem model (2ºx2.5º), EPA NEI2005
June 10-18, 2007 simulation: large-scale event
throughout entire Mississippi Valley
L. T. Murray, A. M. Fiore (Columbia)
Hourly surface ozone and winds
Sample estimated contribution of
WI emissions to surface O3
• Developed new capability to zero a
single state’s emissions
• Sensitivity simulations performed with
N. American, United States, or
Wisconsin precursor emissions
individually removed; also natural
sources
Preliminary work from NASA AQAST Tiger Team on Source Attribution for EUS
Pollution Episodes
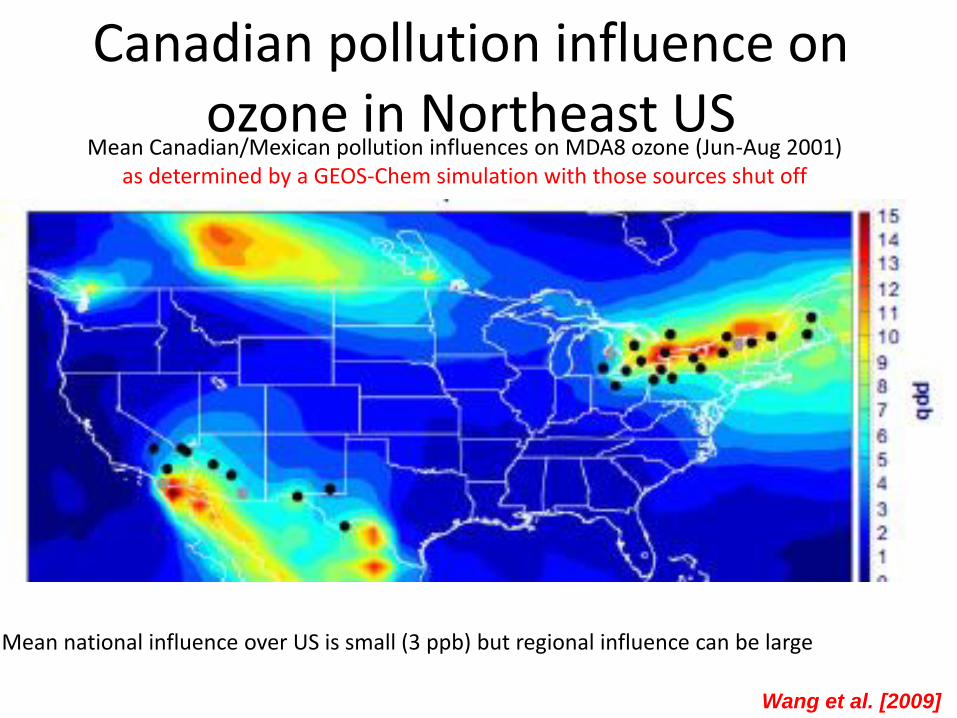
Canadian pollution influence on ozone in Northeast US
Mean Canadian/Mexican pollution influences on MDA8 ozone (Jun-Aug 2001) as determined by a GEOS-Chem simulation with those sources shut off
Wang et al. [2009]
Mean national influence over US is small (3 ppb) but regional influence can be large
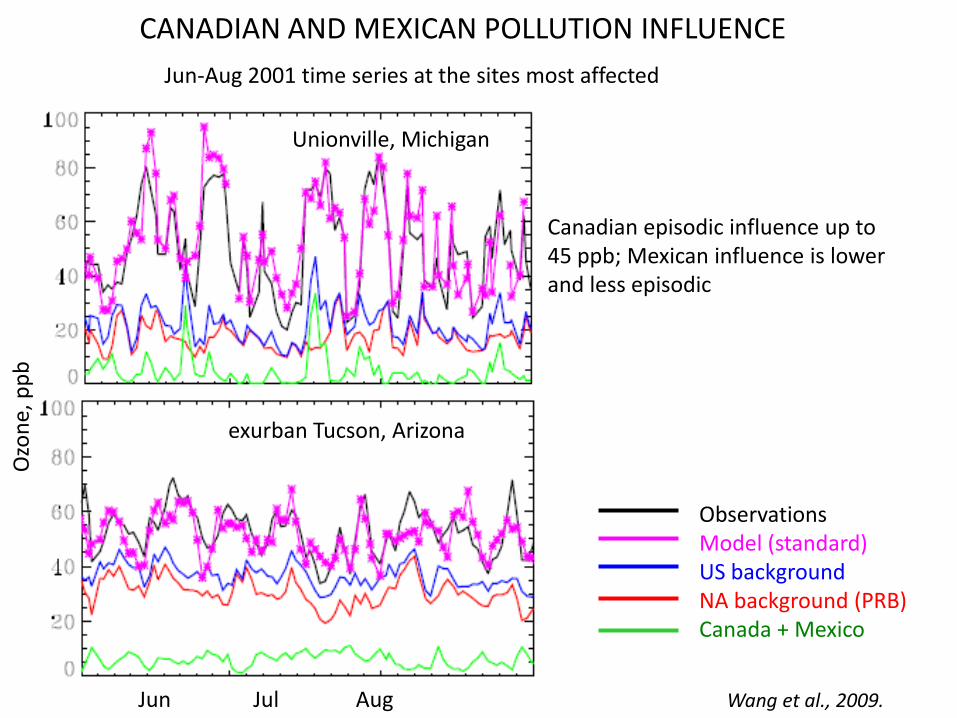
CANADIAN AND MEXICAN POLLUTION INFLUENCE
Jun-Aug 2001 time series at the sites most affected
Observations Model (standard) US background NA background (PRB) Canada + Mexico
Wang et al., 2009.
Canadian episodic influence up to 45 ppb; Mexican influence is lower and less episodic
Ozo
ne,
pp
b
Jun Jul Aug
Unionville, Michigan
exurban Tucson, Arizona

AQAST resources for source attribution during EUS pollution episodes
satellite instruments suborbital platforms models
DISCOVER-AQ (2011; SIP Base year)
SEAC4RS/SOAS/SENEX (2013) EPA AQS CASTNet
OMI NO2 MOPITT CO MODIS AOD
CAMx CMAQ
GEOS-Chem GFDL AM3
STEM
Transport events • Inter-state • Wildfire • International
Size of episode • Areal extent • Duration • Transport
Source attribution • Several horizontal
resolutions • Forward/adjoint • HTAP simulations • Connect suborbital
and space-based information
For each episode, organically determine best use of AQAST resources
(which team members, tools)
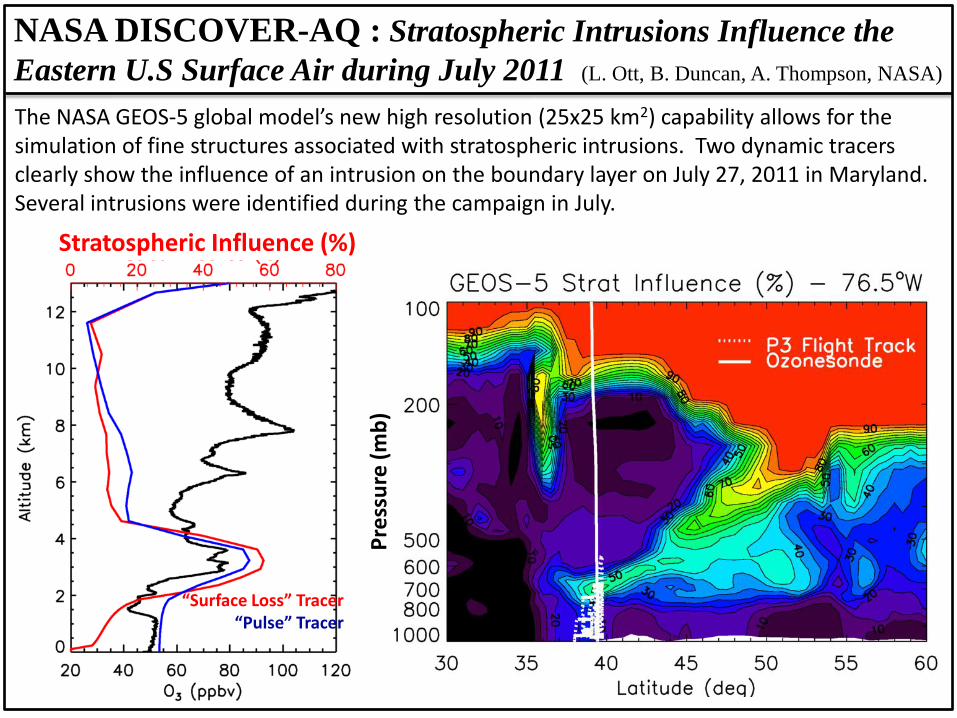
NASA DISCOVER-AQ : Stratospheric Intrusions Influence the
Eastern U.S Surface Air during July 2011 (L. Ott, B. Duncan, A. Thompson, NASA)
Stratospheric Influence (%)
Pre
ssu
re (
mb
)
“Surface Loss” Tracer “Pulse” Tracer
The NASA GEOS-5 global model’s new high resolution (25x25 km2) capability allows for the simulation of fine structures associated with stratospheric intrusions. Two dynamic tracers clearly show the influence of an intrusion on the boundary layer on July 27, 2011 in Maryland. Several intrusions were identified during the campaign in July.
AQAST resources for source attribution during EUS pollution episodes
satellite instruments suborbital platforms models
DISCOVER-AQ (2011; SIP Base year)
SEAC4RS/SOAS/SENEX (2013) EPA AQS CASTNet
OMI NO2 MOPITT CO MODIS AOD
CAMx CMAQ
GEOS-Chem GFDL AM3
STEM
Transport events • Inter-state • Wildfire • International
Size of episode • Areal extent • Duration • Transport
Source attribution • Several horizontal
resolutions • Forward/adjoint • HTAP simulations • Connect suborbital
and space-based information
For each episode, organically determine best use of AQAST resources
(which team members, tools)

33

Designing effective SIPs requires knowledge of source contributions to O3 and PM2.5 pollution episodes
Observed pollution levels are the summation of in-state, out-of-state, international and natural sources
AQAST can help quantify these components, but how can we be most effective?
Build a framework for continued communication with the stakeholders
Request priority O3 and high-PM2.5 episodes from AQMs (2007-2012)
First teleconference will be April 28, 1 PM CDT
AQAST TT
Members
Air Agencies ~ monthly teleconferences MDE, TX/TCEQ, NYSDEC,
US EPA, WI DNR/LADCO… ... (your agency?)

Thank you!
www.aqast.org www.aqast-media.org
Twitter @NASA_AQAST
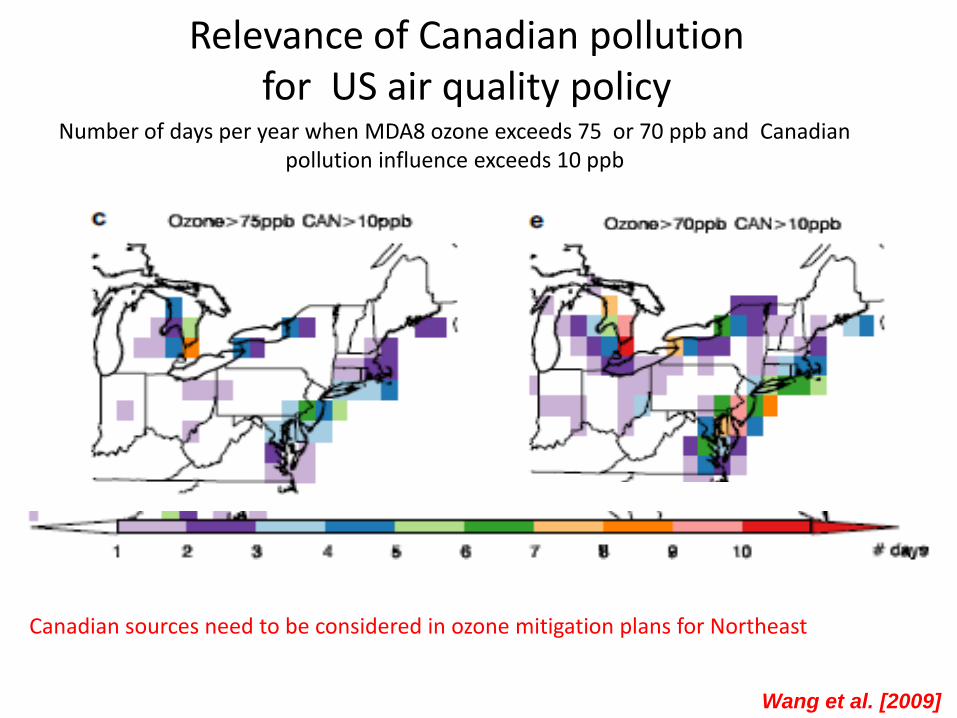
Relevance of Canadian pollution for US air quality policy
Number of days per year when MDA8 ozone exceeds 75 or 70 ppb and Canadian pollution influence exceeds 10 ppb
Wang et al. [2009]
Canadian sources need to be considered in ozone mitigation plans for Northeast
37
60
65
70
75
80
85
90
95
100
105
4/2
8
5/5
5/1
2
5/1
9
5/2
6
6/2
6/9
6/1
6
6/2
3
6/3
0
7/7
7/1
4
7/2
1
7/2
8
8/4
8/1
1
8/1
8
8/2
5
9/1
9/8
9/1
5
9/2
2
9/2
9
Ozo
ne
Co
nce
ntr
atio
n (
pp
b)
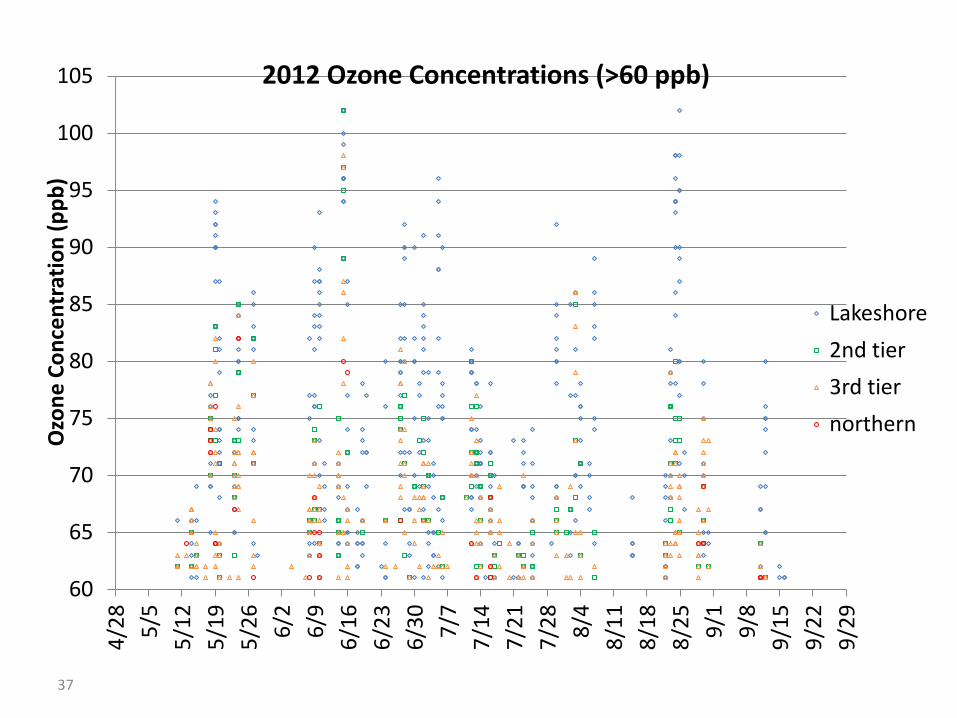
2012 Ozone Concentrations (>60 ppb)
Lakeshore
2nd tier
3rd tier
northern
• Boundary conditions archived for
regional scale model
• Currently evaluating the ability of the
coarse model to provide rapid first-
look estimates of event source
attribution in advance of regional-
scale modeling
GEOS-Chem model (2ºx2.5º), EPA NEI2005
June 10-18, 2007 simulation: large-scale event
throughout entire Mississippi Valley
L. T. Murray, A. M. Fiore (Columbia)
Hourly surface ozone and winds
Sample estimated contribution of
WI emissions to surface O3
• Developed new capability to zero a
single state’s emissions
• Sensitivity simulations performed with
N. American, United States, or
Wisconsin precursor emissions
individually removed; also natural
sources
Preliminary work from NASA AQAST Tiger Team on Source Attribution for EUS
Pollution Episodes