Embed Size (px)
Citation preview
Quantifying replicability in systematic reviews: ther-value
May 12, 2015
Liat ShenhavDepartment of Statistics and Operations Research, Tel-Aviv university, Tel-Aviv,
Israel. E-mail: [email protected] Heller
Department of Statistics and Operations Research, Tel-Aviv university, Tel-Aviv,Israel. E-mail: [email protected]
Yoav BenjaminiDepartment of Statistics and Operations Research, Tel-Aviv university, Tel-Aviv,
Israel. E-mail: [email protected]
Abstract
In order to assess the effect of a health care intervention, it is useful to lookat an ensemble of relevant studies. The Cochrane Collaboration’s admirablegoal is to provide systematic reviews of all relevant clinical studies, in order toestablish whether or not there is a conclusive evidence about a specific interven-tion. This is done mainly by conducting a meta-analysis: a statistical synthesisof results from a series of systematically collected studies. Health practition-ers often interpret a significant meta-analysis summary effect as a statementthat the treatment effect is consistent across a series of studies. However, themeta-analysis significance may be driven by an effect in only one of the studies.Indeed, in an analysis of two domains of Cochrane reviews we show that in anon-negligible fraction of reviews, the removal of a single study from the meta-analysis of primary endpoints makes the conclusion non-significant. Therefore,reporting the evidence towards replicability of the effect across studies in addi-tion to the significant meta-analysis summary effect will provide credibility tothe interpretation that the effect was replicated across studies. We suggest anobjective, easily computed quantity, we term the r-value, that quantifies theextent of this reliance on single studies. We suggest adding the r-values to themain results and to the forest plots of systematic reviews.
1
arX
iv:1
502.
0008
8v2
[st
at.A
P] 1
0 M
ay 2
015
1 Introduction
In systematic reviews, several studies that examine the same questions are analyzedtogether. Viewing all the information is extremely valuable for practitioners in thehealth sciences. A notable example is the Cochrane systematic reviews on the effectsof healthcare interventions. The process of preparing and maintaining Cochranesystematic reviews is described in detail in their manual [Higgins et al., 2011]. Thereviews attempt to assemble all the evidence that is relevant to a specific healthcareintervention.
Deriving conclusions about the overall health benefits or harms from an ensembleof studies can be difficult, since the studies are never exactly the same and thereis danger that these differences affect the inference. For example, factors that areparticular to the study, such as the specific cohorts in the study that are from specificpopulations exposed to specific environments, the specific experimental protocol usedin the study, the specific care givers in the study, etc., may have an impact on thetreatment effect.
A desired property of a systematic review is that the effect has been observed inmore than one study, i.e., the overall conclusion is not entirely driven by a singlestudy. If a significant meta-analysis finding becomes non-significant by leaving outone of the studies, this is worrisome for two reasons: first, the finding may be tooparticular to the single study (e.g., the specific age group in the study); second, thereis greater danger that the significant meta-analysis finding is due to bias in the singlestudy (e.g., due to improper randomization or blindness). We view this problem as areplicability problem: the conclusion about the significance of the effect is completelydriven by a single study, and thus we cannot rule out the possibility that the effectis particular to the single study, i.e., that the effect was not replicated across studies.
A replicability claim is not merely a vague description. A precise computation of theextent of replicability is possible. An objective way to quantify the evidence that themeta-analytic findings do not rely on single studies is as follows. For a meta-analysis ofseveral studies (N studies), the minimal replicability claim is that results have beenreplicated in at least two studies. This claim can be asserted if the meta-analysisresults remains significant after dropping (leaving-out) any single study. We suggestaccompanying the review with a quantity we term the r-value, which quantifies theevidence towards replicability of the effects across studies. The r-value is the largestof these N meta-analysis p-values. Like a p-value, which quantifies the evidenceagainst the null hypothesis of no effect, the r-value quantifies the evidence againstno replicability of effects. The smaller the r-value, the greater the evidence that theconclusion about a primary outcome is not driven by a single study.
The report of the r-value is valuable for meta-analyses of narrow scope as well as ofbroad scope. In Section 5.6 of the manual [Higgins et al., 2011] the scope of the reviewquestion is addressed. If the scope is broad, then a review that produced a single meta-
2
analytic conclusion may be criticized for ‘mixing apples and oranges’, particularlywhen good biologic or sociological evidence suggests that various formulations ofan intervention behave very differently or that various definitions of the conditionof interest are associated with markedly different effects of the intervention. Theadvantage of a broad scope is that it can give a comprehensive summary of evidence.The narrow scope is more manageable, but the evidence may be sparse, and findingsmay not be generalizable to other settings or populations. If the r-value is large(say above 0.05) for a meta-analyses with a narrow scope, this is worrisome sincethe scope has already been selected, and the large r-value indicates that an evenstricter selection that removes one single additional study can change the significantconclusion. If the r-value is large for a meta-analyses with a broad scope, this isworrisome since the reason for the significant finding may be the single “orange”among the several (null) “apples”.
We examined the extent of the replicability problem in systematic reviews. We foundthat there may be lack of replicability in a large proportion of studies. In Section 2,we show that out of the 21 reviews with a significant meta-analysis result on the mostimportant outcomes of interest published on breast cancer, 13 reviews were sensitiveto leaving one study out of the meta-analysis. The problem was less pronouncedin the reviews published on influenza, where 2 reviews were sensitive to leaving onestudy out of the meta-analysis, out of 6 updated reviews with significant primaryoutcomes.
[Anzures-Carbera and Higgins, 2010] write that a useful sensitivity analysis is onein which the meta-analysis is repeated, each time omitting one of the studies. Aplot of the results of these meta-analysis, called an ‘exclusion sensitivity plot’ by[Bax et al, 2006], will reveal any studies that have a particularly large influence on theresults of the meta-analysis. In this work, we concur with this view, but recommendthe most relevant single number of summary information of such a sensitivity analysisbe added to the report of the main results, and to the forest plot, of the meta-analysis.The code for the computation of the r-values and sensitivity intervals is available fromthe first author upon request.
2 The lack of replicability in systematic reviews
We took all the updated reviews in two domains: breast cancer and influenza. Oureligibility criteria were as follows: (a) the review included forest plots; (b) at leastone primary outcome was reported as significant at the .05 level, which is the defaultsignificant level used in Cochrane Reviews; (c) the meta-analysis of at least one ofthe primary outcomes was based on at least three studies and (d) there was noreporting in the review of unreliable/biased primary outcomes or poor quality ofavailable evidence. We consider as primary outcomes the outcomes that were definedas primary by the review authors, and if none were defined we selected the most
3
important findings from the review summaries and treated the outcomes for thesefindings as primary. We limit ourselves to meta-analyses that include at least threestudies , since this is the minimum number of studies for which even if the singlestudies are not significant the meta-analysis may still be non-sensitive (i.e., that ameta analysis based on every subset of two studies can have a significant finding).
In Cochrane reviews, the meta-analyses are of two types: fixed effect and randomeffects. Under the fixed effect model all studies in the meta-analysis are assumed toshare a common (unknown) effect θ. Since all studies share the same effect, it followsthat the observed effect varies from one study to the next only because of the randomerror inherent in each study. The summary effect is the estimate of this common effectθ. Under the random effects model the effects in the studies, θi , i = 1, 2, ..., N , areassumed to have been sampled from a distribution with mean θ̃. Therefore, there aretwo sources of variance: the within-study error in estimating the effect in each studyand the variance in the true effects across studies. The summary effect is the estimateof the effects distribution mean θ̃. For details on estimation of these effects and theirconfidence intervals, see [Higgins et al., 2011]. In this Section our results are based onthe computations of the meta-analysis p-values as suggested in [Higgins et al., 2011],for both fixed and random effects meta-analyses.
In the breast cancer domain 48 updated reviews were published by the CochraneBreast Cancer Group in the Cochrane library, out of which we analyzed 21 updatedreviews that met our eligibility criteria (14, 8 , 4 and 1 reviews was excluded duereasons a, b, c and d respectively). Out of the 21 eligible reviews, 13 reviews weresensitive to leaving one study out in at least one primary outcome. Moreover, in 8out of 13 reviews all the significant primary outcomes were sensitive. The prevalenceof sensitive meta-analyses was similar among the fixed effect and random effect meta-analyses, see Table 1. Among the 15 fixed effect meta-analyses, 6 reviews wheresensitive in all their primary outcomes, 2 reviews were sensitive in 66% of the primaryoutcomes, 1 review was sensitive in 50% of the primary outcomes, and 6 reviewswere not sensitive in any of their primary outcomes. Among the 7 Random effectmeta-analyses, 3 reviews were sensitive in all their primary outcomes, 2 review weresensitive in 50% of their primary outcomes, and 2 reviews were not sensitive in anyof their primary outcomes.
In the influenza domain 25 reviews were published by different groups (e.g., CochraneAcute Respiratory Infections Group, Cochrane Childhood Cancer Group etc.) in theCochrane library, out of which we analyzed 6 updated reviews that met our eligibilitycriteria (9, 2 , 7 and 1 review was excluded due reasons a, b, c and d respectively).Our results are summarized in Table 2. Out of the 6 eligible reviews, 2 reviews weresensitive to leaving 1 study out. Among the two fixed effect meta-analyses reviews,one review was sensitive in all primary outcomes and one review was not sensitivein all primary outcomes. Among the five reviews with random effect meta-analyses,1 review was sensitive in 40% of the primary outcomes, and four reviews were notsensitive in any of their outcomes.
4
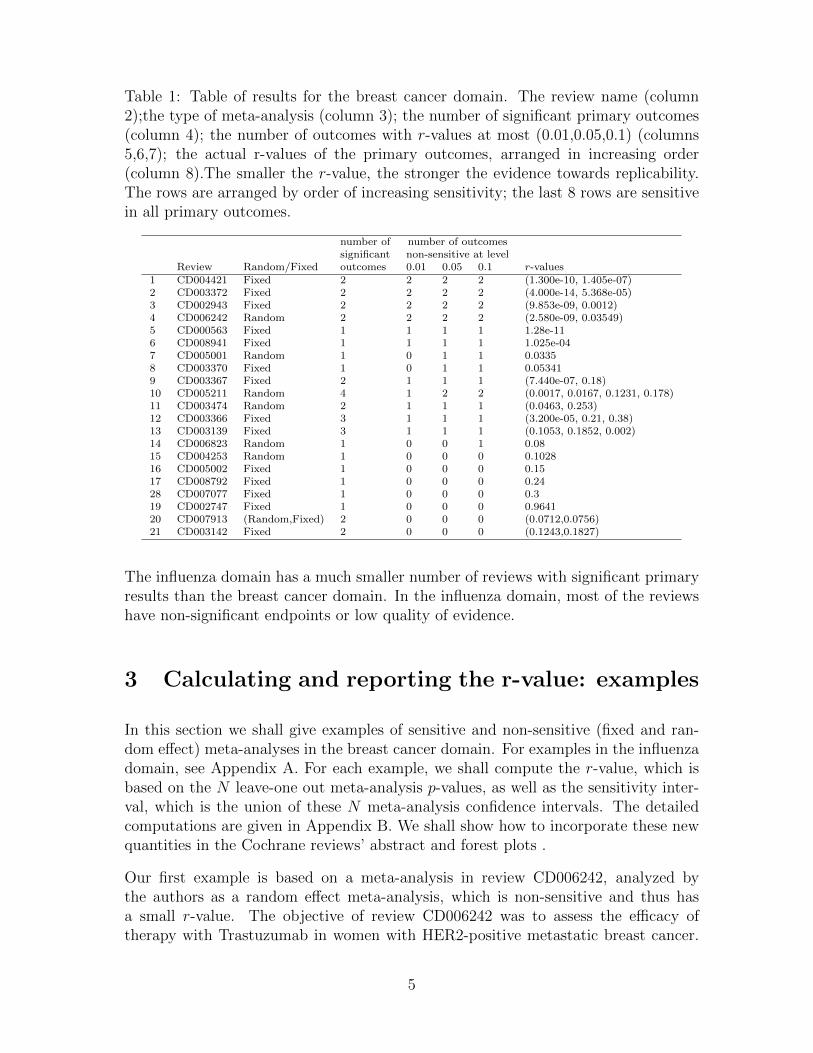
Table 1: Table of results for the breast cancer domain. The review name (column2);the type of meta-analysis (column 3); the number of significant primary outcomes(column 4); the number of outcomes with r-values at most (0.01,0.05,0.1) (columns5,6,7); the actual r-values of the primary outcomes, arranged in increasing order(column 8).The smaller the r-value, the stronger the evidence towards replicability.The rows are arranged by order of increasing sensitivity; the last 8 rows are sensitivein all primary outcomes.
number of number of outcomessignificant non-sensitive at level
Review Random/Fixed outcomes 0.01 0.05 0.1 r-values1 CD004421 Fixed 2 2 2 2 (1.300e-10, 1.405e-07)2 CD003372 Fixed 2 2 2 2 (4.000e-14, 5.368e-05)3 CD002943 Fixed 2 2 2 2 (9.853e-09, 0.0012)4 CD006242 Random 2 2 2 2 (2.580e-09, 0.03549)5 CD000563 Fixed 1 1 1 1 1.28e-116 CD008941 Fixed 1 1 1 1 1.025e-047 CD005001 Random 1 0 1 1 0.03358 CD003370 Fixed 1 0 1 1 0.053419 CD003367 Fixed 2 1 1 1 (7.440e-07, 0.18)10 CD005211 Random 4 1 2 2 (0.0017, 0.0167, 0.1231, 0.178)11 CD003474 Random 2 1 1 1 (0.0463, 0.253)12 CD003366 Fixed 3 1 1 1 (3.200e-05, 0.21, 0.38)13 CD003139 Fixed 3 1 1 1 (0.1053, 0.1852, 0.002)14 CD006823 Random 1 0 0 1 0.0815 CD004253 Random 1 0 0 0 0.102816 CD005002 Fixed 1 0 0 0 0.1517 CD008792 Fixed 1 0 0 0 0.2428 CD007077 Fixed 1 0 0 0 0.319 CD002747 Fixed 1 0 0 0 0.964120 CD007913 (Random,Fixed) 2 0 0 0 (0.0712,0.0756)21 CD003142 Fixed 2 0 0 0 (0.1243,0.1827)
The influenza domain has a much smaller number of reviews with significant primaryresults than the breast cancer domain. In the influenza domain, most of the reviewshave non-significant endpoints or low quality of evidence.
3 Calculating and reporting the r-value: examples
In this section we shall give examples of sensitive and non-sensitive (fixed and ran-dom effect) meta-analyses in the breast cancer domain. For examples in the influenzadomain, see Appendix A. For each example, we shall compute the r-value, which isbased on the N leave-one out meta-analysis p-values, as well as the sensitivity inter-val, which is the union of these N meta-analysis confidence intervals. The detailedcomputations are given in Appendix B. We shall show how to incorporate these newquantities in the Cochrane reviews’ abstract and forest plots .
Our first example is based on a meta-analysis in review CD006242, analyzed bythe authors as a random effect meta-analysis, which is non-sensitive and thus hasa small r-value. The objective of review CD006242 was to assess the efficacy oftherapy with Trastuzumab in women with HER2-positive metastatic breast cancer.
5
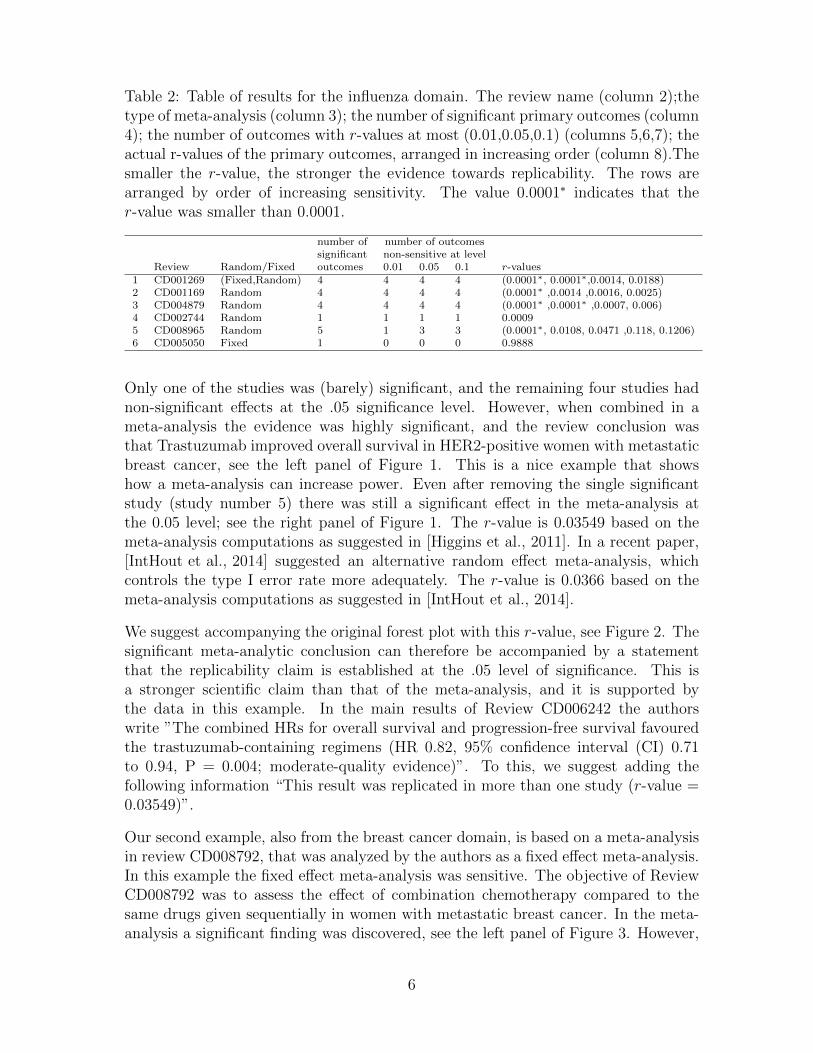
Table 2: Table of results for the influenza domain. The review name (column 2);thetype of meta-analysis (column 3); the number of significant primary outcomes (column4); the number of outcomes with r-values at most (0.01,0.05,0.1) (columns 5,6,7); theactual r-values of the primary outcomes, arranged in increasing order (column 8).Thesmaller the r-value, the stronger the evidence towards replicability. The rows arearranged by order of increasing sensitivity. The value 0.0001∗ indicates that ther-value was smaller than 0.0001.
number of number of outcomessignificant non-sensitive at level
Review Random/Fixed outcomes 0.01 0.05 0.1 r-values1 CD001269 (Fixed,Random) 4 4 4 4 (0.0001∗, 0.0001∗,0.0014, 0.0188)2 CD001169 Random 4 4 4 4 (0.0001∗ ,0.0014 ,0.0016, 0.0025)3 CD004879 Random 4 4 4 4 (0.0001∗ ,0.0001∗ ,0.0007, 0.006)4 CD002744 Random 1 1 1 1 0.00095 CD008965 Random 5 1 3 3 (0.0001∗, 0.0108, 0.0471 ,0.118, 0.1206)6 CD005050 Fixed 1 0 0 0 0.9888
Only one of the studies was (barely) significant, and the remaining four studies hadnon-significant effects at the .05 significance level. However, when combined in ameta-analysis the evidence was highly significant, and the review conclusion wasthat Trastuzumab improved overall survival in HER2-positive women with metastaticbreast cancer, see the left panel of Figure 1. This is a nice example that showshow a meta-analysis can increase power. Even after removing the single significantstudy (study number 5) there was still a significant effect in the meta-analysis atthe 0.05 level; see the right panel of Figure 1. The r-value is 0.03549 based on themeta-analysis computations as suggested in [Higgins et al., 2011]. In a recent paper,[IntHout et al., 2014] suggested an alternative random effect meta-analysis, whichcontrols the type I error rate more adequately. The r-value is 0.0366 based on themeta-analysis computations as suggested in [IntHout et al., 2014].
We suggest accompanying the original forest plot with this r-value, see Figure 2. Thesignificant meta-analytic conclusion can therefore be accompanied by a statementthat the replicability claim is established at the .05 level of significance. This isa stronger scientific claim than that of the meta-analysis, and it is supported bythe data in this example. In the main results of Review CD006242 the authorswrite ”The combined HRs for overall survival and progression-free survival favouredthe trastuzumab-containing regimens (HR 0.82, 95% confidence interval (CI) 0.71to 0.94, P = 0.004; moderate-quality evidence)”. To this, we suggest adding thefollowing information “This result was replicated in more than one study (r-value =0.03549)”.
Our second example, also from the breast cancer domain, is based on a meta-analysisin review CD008792, that was analyzed by the authors as a fixed effect meta-analysis.In this example the fixed effect meta-analysis was sensitive. The objective of ReviewCD008792 was to assess the effect of combination chemotherapy compared to thesame drugs given sequentially in women with metastatic breast cancer. In the meta-analysis a significant finding was discovered, see the left panel of Figure 3. However,
6
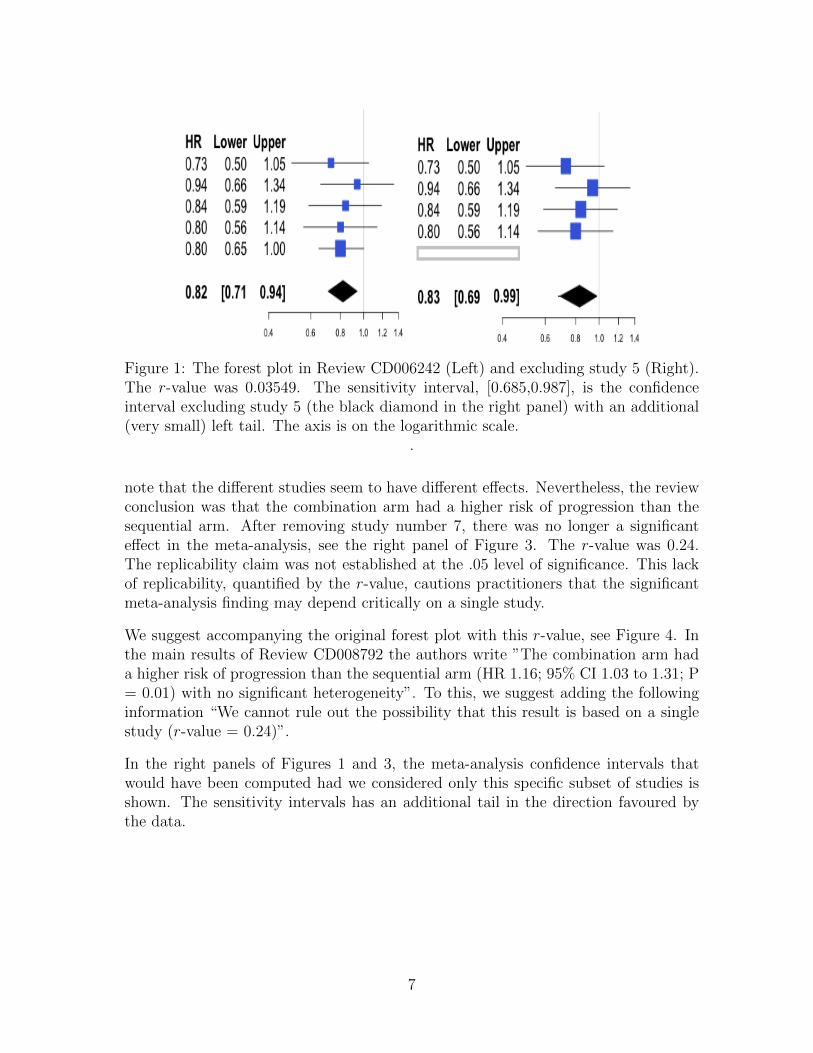
Figure 1: The forest plot in Review CD006242 (Left) and excluding study 5 (Right).The r-value was 0.03549. The sensitivity interval, [0.685,0.987], is the confidenceinterval excluding study 5 (the black diamond in the right panel) with an additional(very small) left tail. The axis is on the logarithmic scale.
.
note that the different studies seem to have different effects. Nevertheless, the reviewconclusion was that the combination arm had a higher risk of progression than thesequential arm. After removing study number 7, there was no longer a significanteffect in the meta-analysis, see the right panel of Figure 3. The r-value was 0.24.The replicability claim was not established at the .05 level of significance. This lackof replicability, quantified by the r-value, cautions practitioners that the significantmeta-analysis finding may depend critically on a single study.
We suggest accompanying the original forest plot with this r-value, see Figure 4. Inthe main results of Review CD008792 the authors write ”The combination arm hada higher risk of progression than the sequential arm (HR 1.16; 95% CI 1.03 to 1.31; P= 0.01) with no significant heterogeneity”. To this, we suggest adding the followinginformation “We cannot rule out the possibility that this result is based on a singlestudy (r-value = 0.24)”.
In the right panels of Figures 1 and 3, the meta-analysis confidence intervals thatwould have been computed had we considered only this specific subset of studies isshown. The sensitivity intervals has an additional tail in the direction favoured bythe data.
7
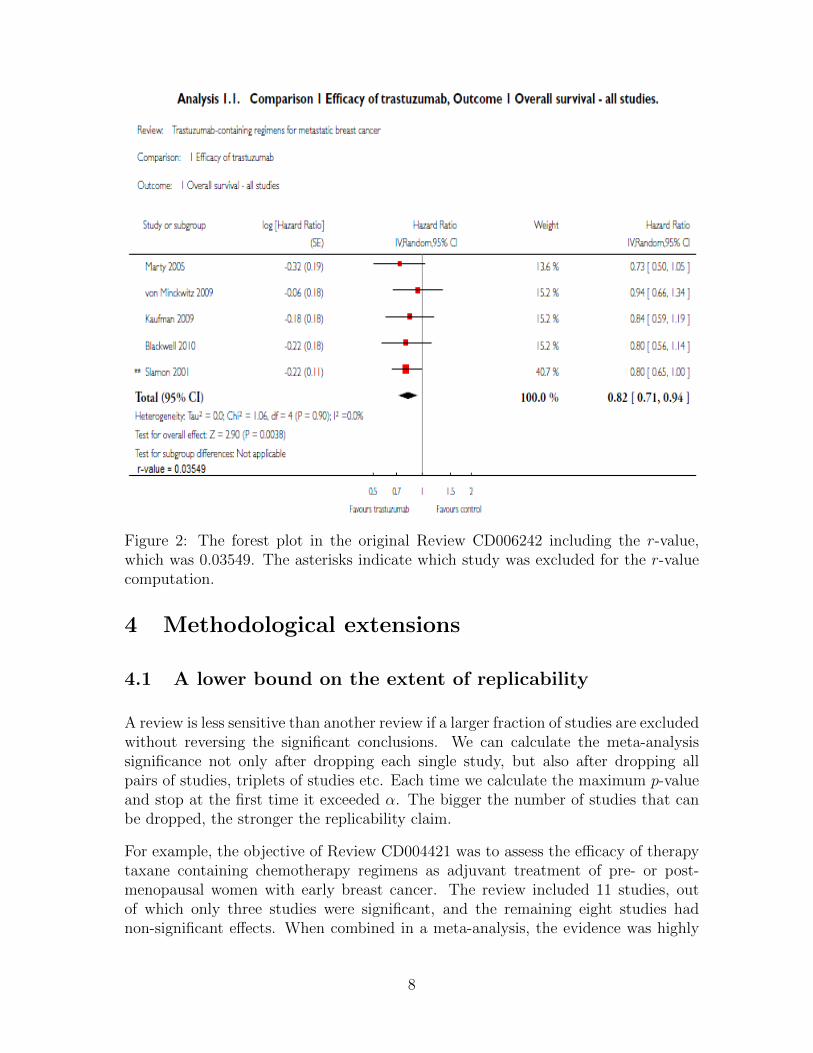
Figure 2: The forest plot in the original Review CD006242 including the r-value,which was 0.03549. The asterisks indicate which study was excluded for the r-valuecomputation.
4 Methodological extensions
4.1 A lower bound on the extent of replicability
A review is less sensitive than another review if a larger fraction of studies are excludedwithout reversing the significant conclusions. We can calculate the meta-analysissignificance not only after dropping each single study, but also after dropping allpairs of studies, triplets of studies etc. Each time we calculate the maximum p-valueand stop at the first time it exceeded α. The bigger the number of studies that canbe dropped, the stronger the replicability claim.
For example, the objective of Review CD004421 was to assess the efficacy of therapytaxane containing chemotherapy regimens as adjuvant treatment of pre- or post-menopausal women with early breast cancer. The review included 11 studies, outof which only three studies were significant, and the remaining eight studies hadnon-significant effects. When combined in a meta-analysis, the evidence was highly
8
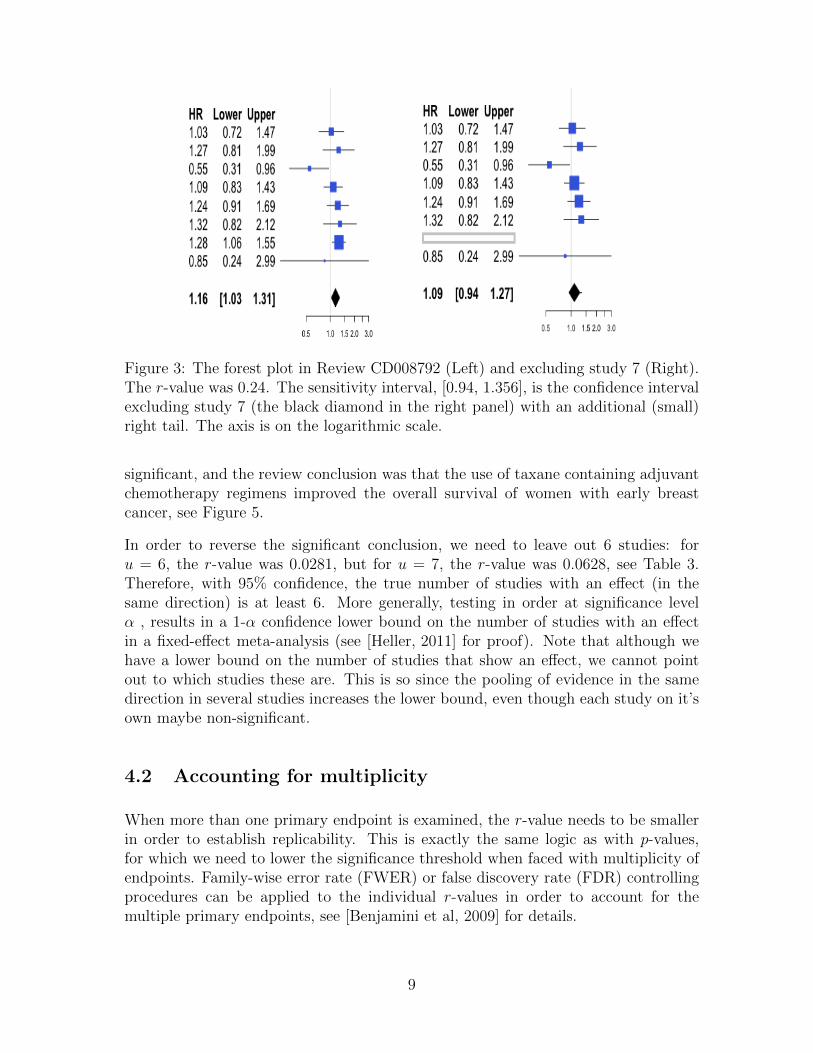
Figure 3: The forest plot in Review CD008792 (Left) and excluding study 7 (Right).The r-value was 0.24. The sensitivity interval, [0.94, 1.356], is the confidence intervalexcluding study 7 (the black diamond in the right panel) with an additional (small)right tail. The axis is on the logarithmic scale.
significant, and the review conclusion was that the use of taxane containing adjuvantchemotherapy regimens improved the overall survival of women with early breastcancer, see Figure 5.
In order to reverse the significant conclusion, we need to leave out 6 studies: foru = 6, the r-value was 0.0281, but for u = 7, the r-value was 0.0628, see Table 3.Therefore, with 95% confidence, the true number of studies with an effect (in thesame direction) is at least 6. More generally, testing in order at significance levelα , results in a 1-α confidence lower bound on the number of studies with an effectin a fixed-effect meta-analysis (see [Heller, 2011] for proof). Note that although wehave a lower bound on the number of studies that show an effect, we cannot pointout to which studies these are. This is so since the pooling of evidence in the samedirection in several studies increases the lower bound, even though each study on it’sown maybe non-significant.
4.2 Accounting for multiplicity
When more than one primary endpoint is examined, the r-value needs to be smallerin order to establish replicability. This is exactly the same logic as with p-values,for which we need to lower the significance threshold when faced with multiplicity ofendpoints. Family-wise error rate (FWER) or false discovery rate (FDR) controllingprocedures can be applied to the individual r-values in order to account for themultiple primary endpoints, see [Benjamini et al, 2009] for details.
9
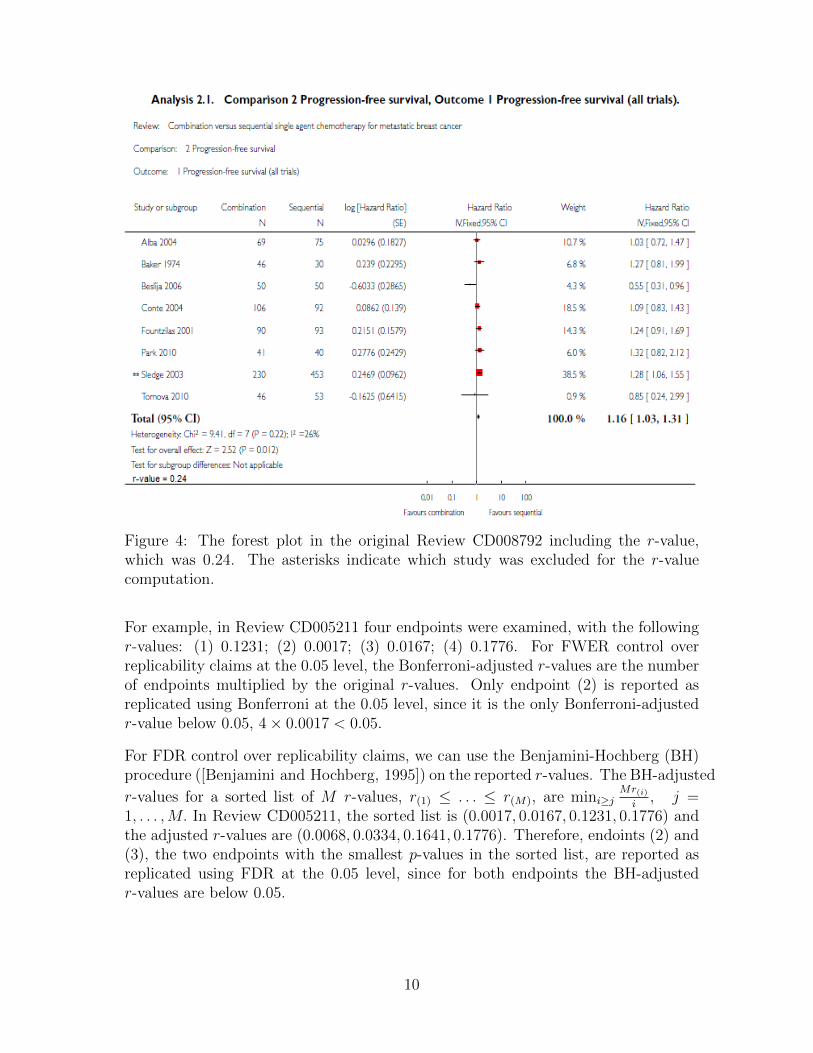
Figure 4: The forest plot in the original Review CD008792 including the r-value,which was 0.24. The asterisks indicate which study was excluded for the r-valuecomputation.
For example, in Review CD005211 four endpoints were examined, with the followingr-values: (1) 0.1231; (2) 0.0017; (3) 0.0167; (4) 0.1776. For FWER control overreplicability claims at the 0.05 level, the Bonferroni-adjusted r-values are the numberof endpoints multiplied by the original r-values. Only endpoint (2) is reported asreplicated using Bonferroni at the 0.05 level, since it is the only Bonferroni-adjustedr-value below 0.05, 4× 0.0017 < 0.05.
For FDR control over replicability claims, we can use the Benjamini-Hochberg (BH)procedure ([Benjamini and Hochberg, 1995]) on the reported r-values. The BH-adjusted
r-values for a sorted list of M r-values, r(1) ≤ . . . ≤ r(M), are mini≥jMr(i)
i, j =
1, . . . ,M. In Review CD005211, the sorted list is (0.0017, 0.0167, 0.1231, 0.1776) andthe adjusted r-values are (0.0068, 0.0334, 0.1641, 0.1776). Therefore, endoints (2) and(3), the two endpoints with the smallest p-values in the sorted list, are reported asreplicated using FDR at the 0.05 level, since for both endpoints the BH-adjustedr-values are below 0.05.
10
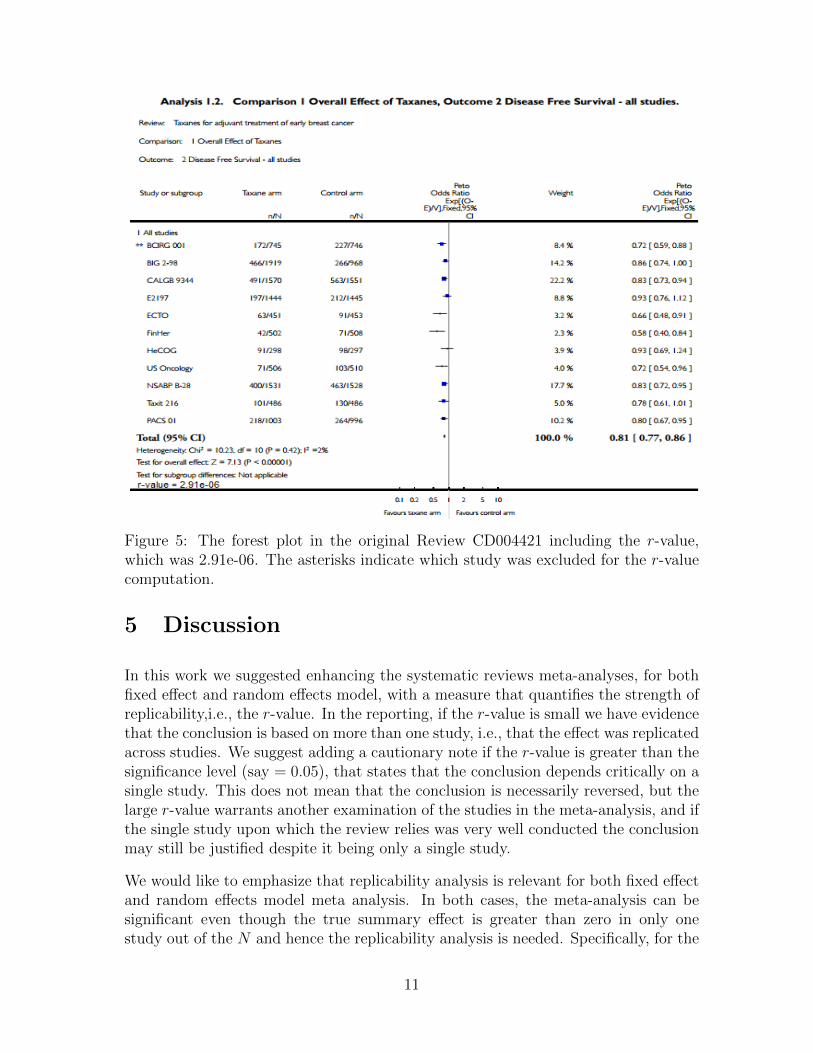
Figure 5: The forest plot in the original Review CD004421 including the r-value,which was 2.91e-06. The asterisks indicate which study was excluded for the r-valuecomputation.
5 Discussion
In this work we suggested enhancing the systematic reviews meta-analyses, for bothfixed effect and random effects model, with a measure that quantifies the strength ofreplicability,i.e., the r-value. In the reporting, if the r-value is small we have evidencethat the conclusion is based on more than one study, i.e., that the effect was replicatedacross studies. We suggest adding a cautionary note if the r-value is greater than thesignificance level (say = 0.05), that states that the conclusion depends critically on asingle study. This does not mean that the conclusion is necessarily reversed, but thelarge r-value warrants another examination of the studies in the meta-analysis, and ifthe single study upon which the review relies was very well conducted the conclusionmay still be justified despite it being only a single study.
We would like to emphasize that replicability analysis is relevant for both fixed effectand random effects model meta analysis. In both cases, the meta-analysis can besignificant even though the true summary effect is greater than zero in only onestudy out of the N and hence the replicability analysis is needed. Specifically, for the
11
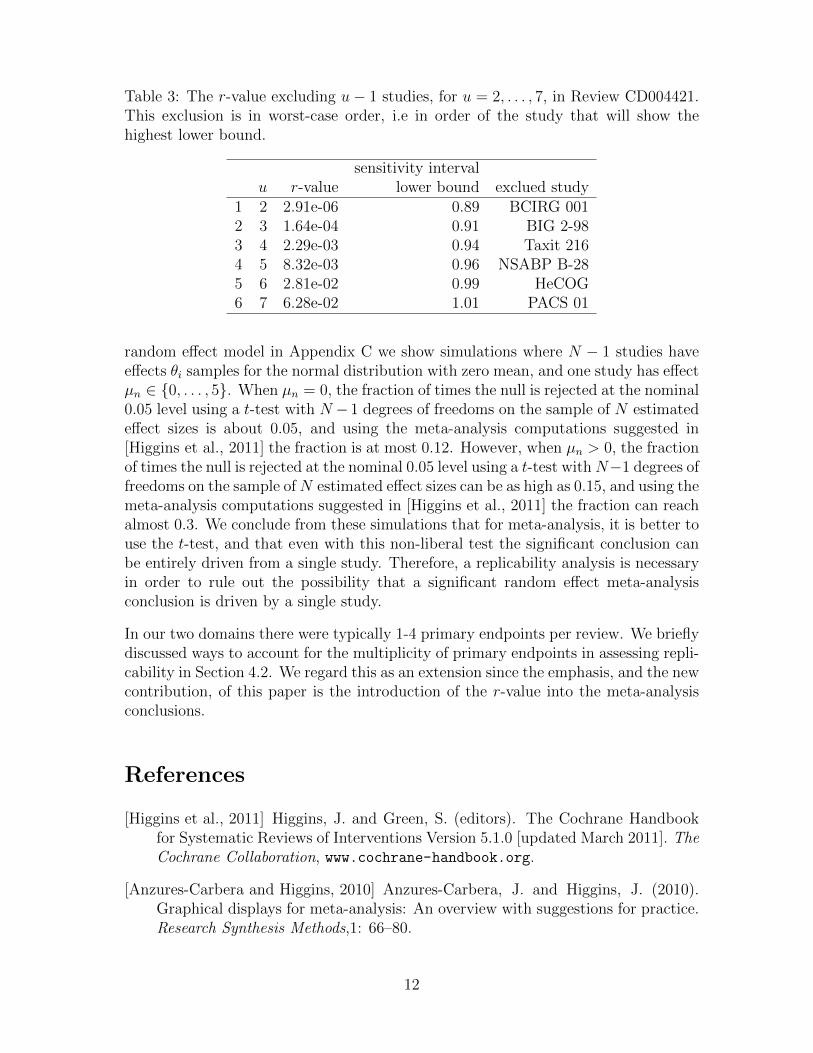
Table 3: The r-value excluding u− 1 studies, for u = 2, . . . , 7, in Review CD004421.This exclusion is in worst-case order, i.e in order of the study that will show thehighest lower bound.
sensitivity intervalu r-value lower bound exclued study
1 2 2.91e-06 0.89 BCIRG 0012 3 1.64e-04 0.91 BIG 2-983 4 2.29e-03 0.94 Taxit 2164 5 8.32e-03 0.96 NSABP B-285 6 2.81e-02 0.99 HeCOG6 7 6.28e-02 1.01 PACS 01
random effect model in Appendix C we show simulations where N − 1 studies haveeffects θi samples for the normal distribution with zero mean, and one study has effectµn ∈ {0, . . . , 5}. When µn = 0, the fraction of times the null is rejected at the nominal0.05 level using a t-test with N −1 degrees of freedoms on the sample of N estimatedeffect sizes is about 0.05, and using the meta-analysis computations suggested in[Higgins et al., 2011] the fraction is at most 0.12. However, when µn > 0, the fractionof times the null is rejected at the nominal 0.05 level using a t-test withN−1 degrees offreedoms on the sample ofN estimated effect sizes can be as high as 0.15, and using themeta-analysis computations suggested in [Higgins et al., 2011] the fraction can reachalmost 0.3. We conclude from these simulations that for meta-analysis, it is better touse the t-test, and that even with this non-liberal test the significant conclusion canbe entirely driven from a single study. Therefore, a replicability analysis is necessaryin order to rule out the possibility that a significant random effect meta-analysisconclusion is driven by a single study.
In our two domains there were typically 1-4 primary endpoints per review. We brieflydiscussed ways to account for the multiplicity of primary endpoints in assessing repli-cability in Section 4.2. We regard this as an extension since the emphasis, and the newcontribution, of this paper is the introduction of the r-value into the meta-analysisconclusions.
References
[Higgins et al., 2011] Higgins, J. and Green, S. (editors). The Cochrane Handbookfor Systematic Reviews of Interventions Version 5.1.0 [updated March 2011]. TheCochrane Collaboration, www.cochrane-handbook.org.
[Anzures-Carbera and Higgins, 2010] Anzures-Carbera, J. and Higgins, J. (2010).Graphical displays for meta-analysis: An overview with suggestions for practice.Research Synthesis Methods,1: 66–80.
12
[Bax et al, 2006] Bax, L. and Yu, L. and Ikeda, N. and Tsuruta, H. and Moons, K.(2006). Development and validation of Mix: comprehensive free software formeta-analysis of causal research data. BMC Medical Research Methodology,6(50).
[Benjamini and Hochberg, 1995] Benjamini, Y. and Hochberg, Y. (1995). Control-ling the False Discovery Rate: A Practical and Powerful Approach to MultipleTesting. Journal of the Royal Statistical Society, Series B (Methodological), 57(1): 289–300.
[Benjamini et al, 2009] Benjamini, Y. and Heller, R. and Yekutieli, D. (2009). Selec-tive inference in complex research. Phil. Trans. R. Soc. A, 367: 4255–4271.
[Benjamini and Heller, 2008] Benjamini, Y. and Heller, R. (2008). Screening for par-tial conjunction hypotheses. Biometrics, 64:1215–1222.
[Bogomolov and Heller, 2013] Bogomolov, M. and Heller, R. (2013). Discovering find-ings that replicate from a primary study of high dimension to a follow-up study.Journal of the American Statistical Association, 108(504):1480–1492.
[Heller et al., 2014] Heller, R., Bogomolov, M., and Benjamini, Y. (2014). Decidingwhether follow-up studies have replicated findings in a preliminary large-scale’omics’ study. Proceedings of the National Academy of Sciences.
[Heller, 2011] Heller, R. (2011). Discussion of Multiple Testing for Exploratory Re-search by J. J. Goeman and A. Solari Statistical Science, 26 (4): 598–600.
[IntHout et al., 2014] IntHout, J. and Ioannidis, J. and Borm, G. (2014). TheHartung-Knapp-Sidik-Jonkman method for random effects meta-analysis isstraightforward and considerably outperforms the standard DerSimonian-Lairdmethod. BMC Medical Research Methodology, 14(25).
A Examples for the influenza domain
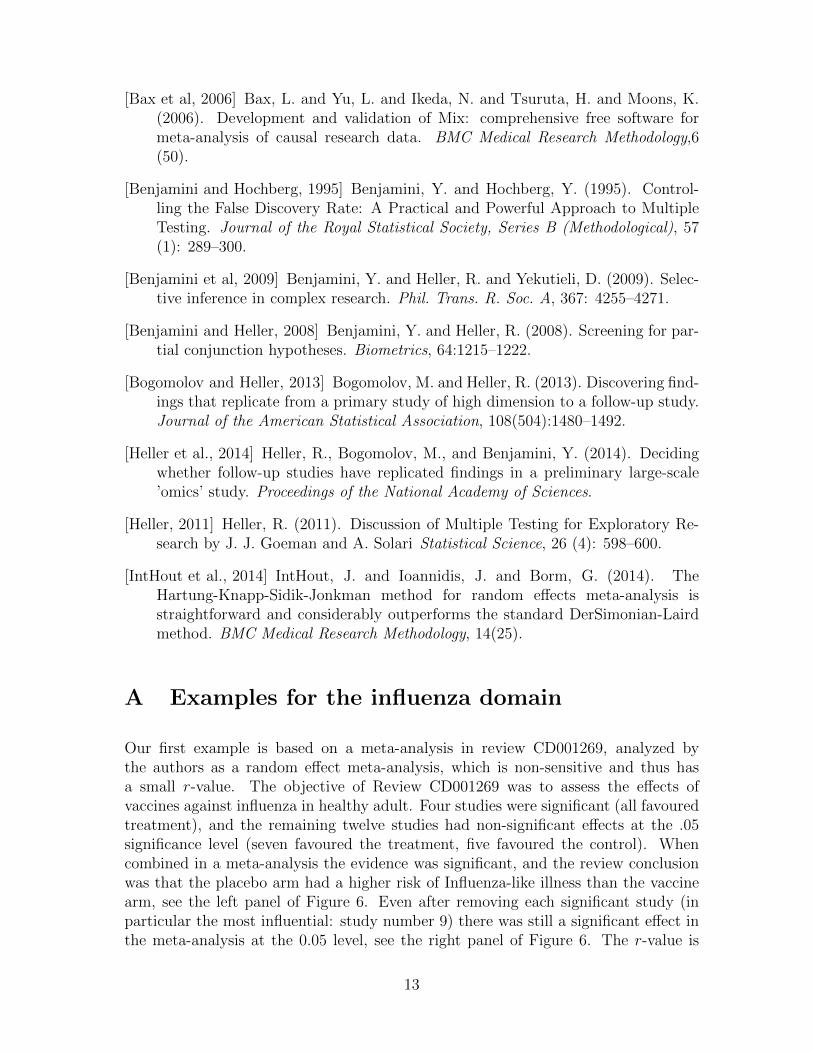
Our first example is based on a meta-analysis in review CD001269, analyzed bythe authors as a random effect meta-analysis, which is non-sensitive and thus hasa small r-value. The objective of Review CD001269 was to assess the effects ofvaccines against influenza in healthy adult. Four studies were significant (all favouredtreatment), and the remaining twelve studies had non-significant effects at the .05significance level (seven favoured the treatment, five favoured the control). Whencombined in a meta-analysis the evidence was significant, and the review conclusionwas that the placebo arm had a higher risk of Influenza-like illness than the vaccinearm, see the left panel of Figure 6. Even after removing each significant study (inparticular the most influential: study number 9) there was still a significant effect inthe meta-analysis at the 0.05 level, see the right panel of Figure 6. The r-value is
13
0.0014. The significant meta-analytic conclusion can therefore be accompanied by astatement that the replicability claim is established at the .05 level of significance.This is a stronger scientific claim than that of the meta-analysis, and it is supportedby the data in this example.
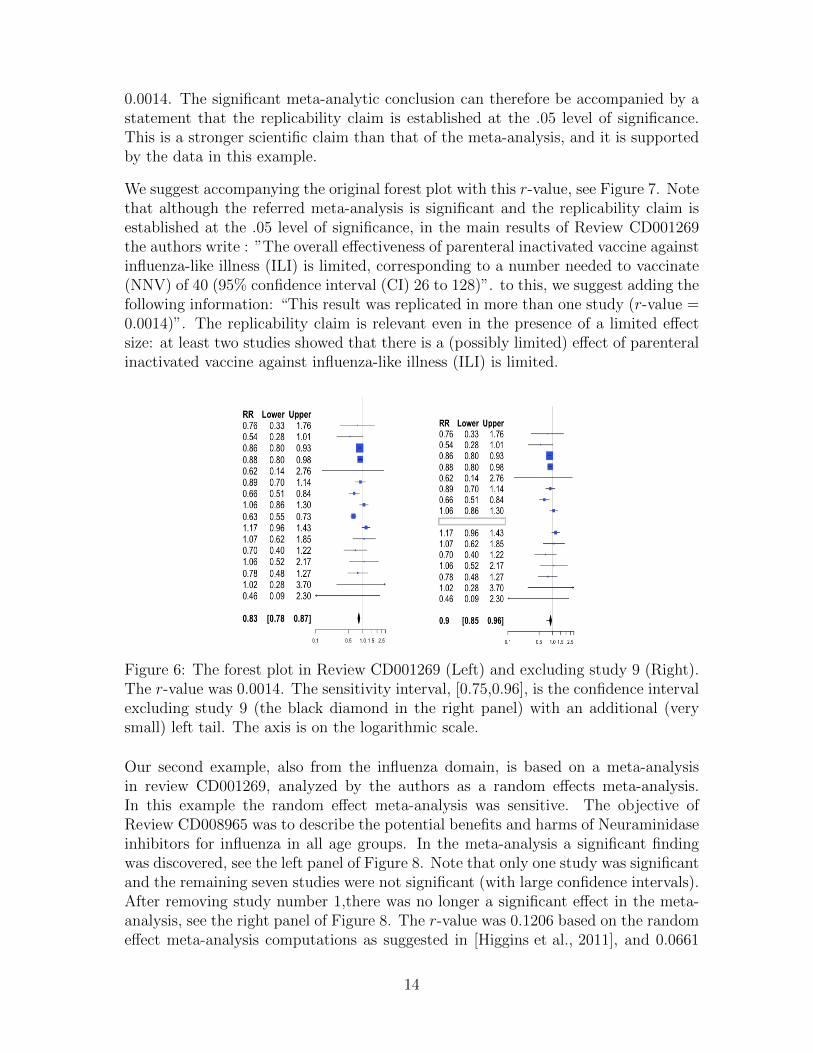
We suggest accompanying the original forest plot with this r-value, see Figure 7. Notethat although the referred meta-analysis is significant and the replicability claim isestablished at the .05 level of significance, in the main results of Review CD001269the authors write : ”The overall effectiveness of parenteral inactivated vaccine againstinfluenza-like illness (ILI) is limited, corresponding to a number needed to vaccinate(NNV) of 40 (95% confidence interval (CI) 26 to 128)”. to this, we suggest adding thefollowing information: “This result was replicated in more than one study (r-value =0.0014)”. The replicability claim is relevant even in the presence of a limited effectsize: at least two studies showed that there is a (possibly limited) effect of parenteralinactivated vaccine against influenza-like illness (ILI) is limited.
Figure 6: The forest plot in Review CD001269 (Left) and excluding study 9 (Right).The r-value was 0.0014. The sensitivity interval, [0.75,0.96], is the confidence intervalexcluding study 9 (the black diamond in the right panel) with an additional (verysmall) left tail. The axis is on the logarithmic scale.
Our second example, also from the influenza domain, is based on a meta-analysisin review CD001269, analyzed by the authors as a random effects meta-analysis.In this example the random effect meta-analysis was sensitive. The objective ofReview CD008965 was to describe the potential benefits and harms of Neuraminidaseinhibitors for influenza in all age groups. In the meta-analysis a significant findingwas discovered, see the left panel of Figure 8. Note that only one study was significantand the remaining seven studies were not significant (with large confidence intervals).After removing study number 1,there was no longer a significant effect in the meta-analysis, see the right panel of Figure 8. The r-value was 0.1206 based on the randomeffect meta-analysis computations as suggested in [Higgins et al., 2011], and 0.0661
14
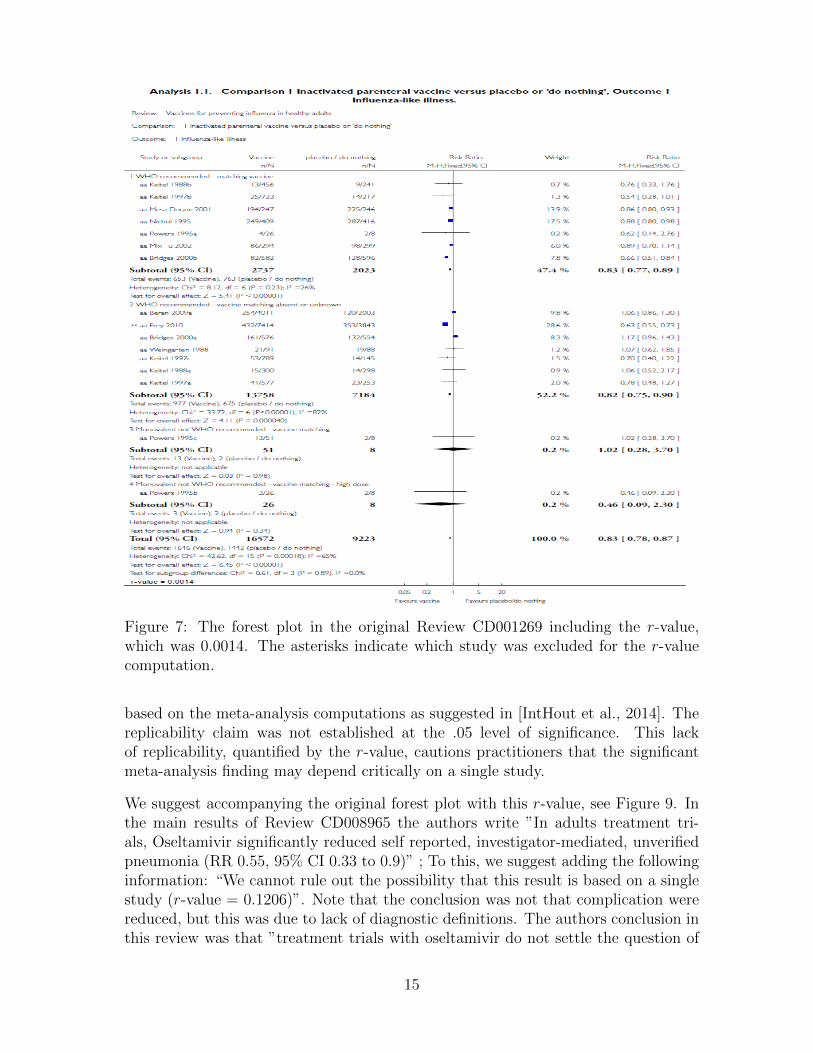
Figure 7: The forest plot in the original Review CD001269 including the r-value,which was 0.0014. The asterisks indicate which study was excluded for the r-valuecomputation.
based on the meta-analysis computations as suggested in [IntHout et al., 2014]. Thereplicability claim was not established at the .05 level of significance. This lackof replicability, quantified by the r-value, cautions practitioners that the significantmeta-analysis finding may depend critically on a single study.
We suggest accompanying the original forest plot with this r-value, see Figure 9. Inthe main results of Review CD008965 the authors write ”In adults treatment tri-als, Oseltamivir significantly reduced self reported, investigator-mediated, unverifiedpneumonia (RR 0.55, 95% CI 0.33 to 0.9)” ; To this, we suggest adding the followinginformation: “We cannot rule out the possibility that this result is based on a singlestudy (r-value = 0.1206)”. Note that the conclusion was not that complication werereduced, but this was due to lack of diagnostic definitions. The authors conclusion inthis review was that ”treatment trials with oseltamivir do not settle the question of
15
whether the complications of influenza (such as pneumonia) are reduced, because ofa lack of diagnostic definitions”.
Figure 8: The forest plot in Review CD008965 (Left) and excluding study 1 (Right).The r-value was 0.1206. The sensitivity interval, [0.24, 1.13], is the confidence intervalexcluding study 1 (the black diamond in the right panel) with an additional (small)right tail. The axis is on the logarithmic scale.
B Sensitivity analysis computation details
Let pLi1,...,ik and pRi1,...,ik be, respectively, the left- and right- p-values from a meta-analysis on the subset (i1, . . . , ik) ⊂ {1, . . . , N} of the N studies in the full meta-analysis, k < N . Let Π(k) denote the set of all possible subsets of size k.
B.1 The r-value computation
For a meta-analysis based on N studies, a replicability claim is a claim that theconclusion remains significant (e.g., rejection of the null hypothesis of no treatmenteffect) using a meta-analysis of each of the
(N
u−1
)subsets of N − u+ 1 studies, where
u = 2, . . . , N is a parameter chosen by the investigator. Specifically, for u = 2, areplicability claim is a claim that the conclusion remains significant using a meta-analysis of each of the N subsets of N − 1 studies.
The r-value for replicability analysis, where we claim replicability if the conclusionremains significant using a meta-analysis of each of the
(N
u−1
)subsets of N − u + 1
studies is computed as follows. For left- sided alternative, the r-value is
rL = max(i1,...,iN−u+1)∈Π(N−u+1)
pLi1,...,iN−u+1.
16
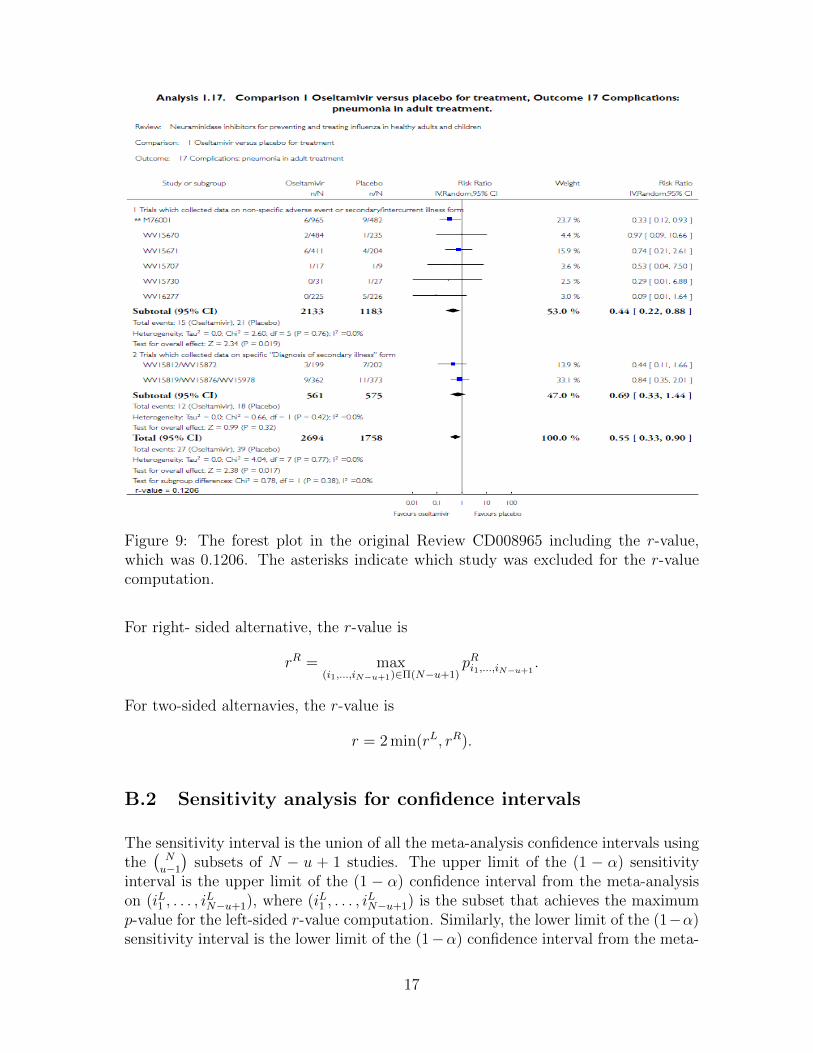
Figure 9: The forest plot in the original Review CD008965 including the r-value,which was 0.1206. The asterisks indicate which study was excluded for the r-valuecomputation.
For right- sided alternative, the r-value is
rR = max(i1,...,iN−u+1)∈Π(N−u+1)
pRi1,...,iN−u+1.
For two-sided alternavies, the r-value is
r = 2 min(rL, rR).
B.2 Sensitivity analysis for confidence intervals
The sensitivity interval is the union of all the meta-analysis confidence intervals usingthe
(N
u−1
)subsets of N − u + 1 studies. The upper limit of the (1 − α) sensitivity
interval is the upper limit of the (1 − α) confidence interval from the meta-analysison (iL1 , . . . , i
LN−u+1), where (iL1 , . . . , i
LN−u+1) is the subset that achieves the maximum
p-value for the left-sided r-value computation. Similarly, the lower limit of the (1−α)sensitivity interval is the lower limit of the (1−α) confidence interval from the meta-
17
analysis on (iR1 , . . . , iRN−u+1), where (iR1 , . . . , i
RN−u+1) is the subset that achieves the
maximum p-value for the right-sided r-value computation.
The meta-analysis is non-sensitive (at the desired value of u) if and only if the sensitiv-ity interval does not contain the null hypothesis value. This follows from the followingargument. To see this, note that r ≤ α, if and only if rL ≤ α/2 or rR ≤ α/2. SincerL ≤ α/2 if and only if the upper limit of all the meta-analysis 1 − α confidenceintervals of subsets of size N − u + 1 is below the null value, and rR ≤ α/2 if andonly if the lower limit of all the meta-analysis 1−α confidence intervals of subsets ofsize N − u+ 1 is above the null value, the result follows.
B.3 Leave-one-out sensitivity procedure
For meta-analysis with N studies and significant effect size θ < θ0 ,where θ0 is thenull effect ,e.g., 1 for HR (two- sided alternative):1) Compute meta-analysis of each of the
(N
u−1
)subsets of N − u+ 1 studies.
2) Choose the N −u+ 1 subset of studies that achieves the maximum p-value for theleft-sided r-value computation: (iL1 , . . . , i
LN−u+1).
3) Compute the two-sided r-value :
r = 2 min(rL, rR).
4) If the r-value≤ 0.05, the replicability is established in at lease u studies. Otherwise,the replicability is established in at most u−1 studies (for u=2 , r-value > 0.05 meansthat the finding is not replicable).
For meta-analysis with N studies and significant effect size θ > θ0 ,where θ0 is thenull effect ,e.g., 1 for HR (two- sided alternative):1) Compute meta-analysis of each of the
(N
u−1
)subsets of N − u+ 1 studies.
2) Choose the N −u+ 1 subset of studies that achieves the maximum p-value for theright-sided r-value computation: (iR1 , . . . , i
RN−u+1).
3) Compute the two-sided r-value :
r = 2 min(rL, rR).
4) If the r-value≤ 0.05, the replicability is established in at lease u studies. Otherwise,the replicability is established in at most u−1 studies (for u=2 , r-value > 0.05 meansthat the finding is not replicable).
C Random effects meta analysis simulation
Using the following simulation we demonstrate that a significant random effect meta-analysis is not equivalent to replicability. Meaning, random effect meta-analysis can
18
be significant even though the effect is greater than zero in only one study out of N .We show that the probability of rejecting the null hypothesis with a single outlyingstudy can be as high as 6 times the nominal level using the meta-analysis computa-tions of [Higgins et al., 2011], and as high as 3 times the nominal level using the moreconservative approach of [IntHout et al., 2014].
For N ∈ {3, 5, 7, 9, 20} studies, we sampled N − 1 effects µi, i = 1, .., N − 1 fromthe distribution N(0, τ 2), where τ 2 ∈ {0.01, 0.04, 0.09, 0.25, 0.49, 1}. For the Nthstudy, the effect was µn ∈ {0, 0.05, 0.1, . . . , 4.5, 5}. For each study i ∈ {1, . . . , N}, wesampled observed effects θ̂i from the normal distribution with mean µi and standarddeviation 0.01. We computed the random effect meta-analysis one-sided p-value us-ing the computations suggested in [Higgins et al., 2011], i.e., using the z-test on theaverage observed effects, as well as using the t-test on the sample of observed effects.We estimated the probability of rejection the null hypothesis of zero mean based on104 iterations.
Figures 10 and 11 show the resulting estimated probability of rejecting the null hy-pothesis. The random effect meta-analysis is significant in more than 5% of theiterations for all N in values of µN > 0 that are not too large relative to the value ofτ . The larger the value of τ 2, the greater the range of µN > 0 for which the nominallevel of significance is not maintained.
In [Higgins et al., 2011], the normal distribution is used for the random effect meta-analysis p-value, instead of the t-distribution with N − 1 degrees of freedom which inour simulation (with equal study weights) results in an exact α = 0.05 level test whenµN = 0. We see that the usage of the z-test instead of the t-test results in a typeI error rate substantially greater than 5% under the null hypothesis (i.e. µN = 0)and in a higher rejection rate of the null hypothesis for µN > 0 in comparison to thefraction of rejections using the t-test when there is no replicability.
19
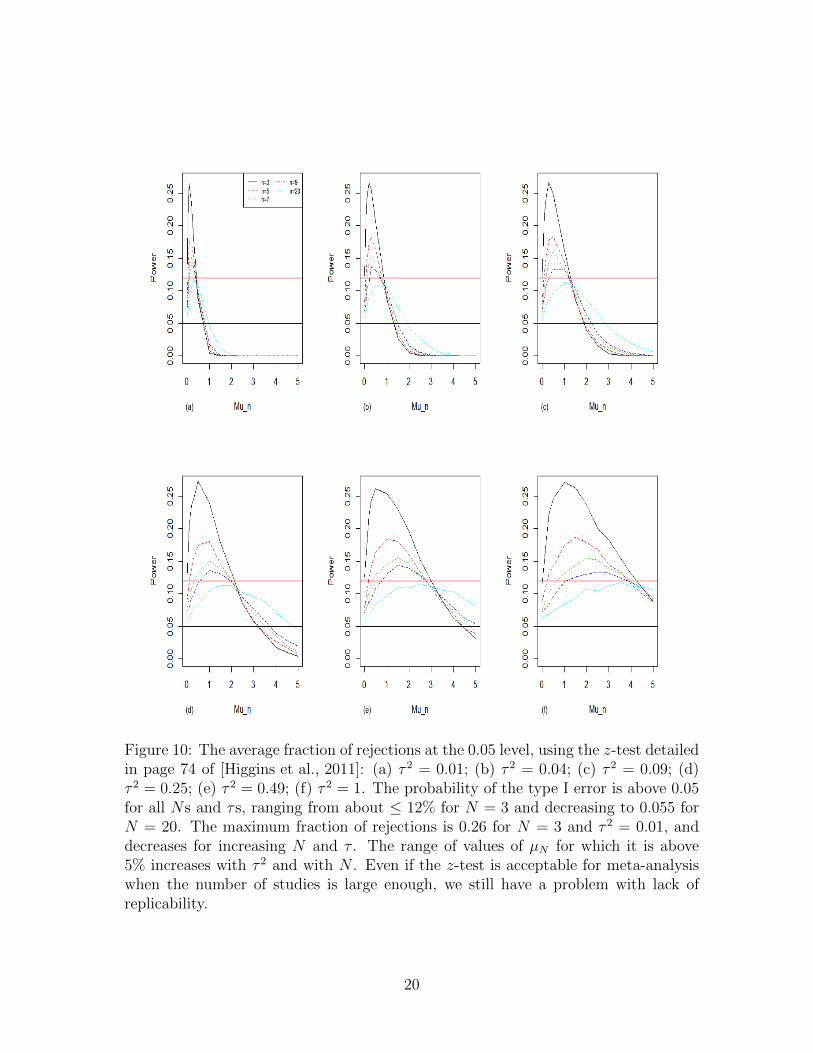
Figure 10: The average fraction of rejections at the 0.05 level, using the z-test detailedin page 74 of [Higgins et al., 2011]: (a) τ 2 = 0.01; (b) τ 2 = 0.04; (c) τ 2 = 0.09; (d)τ 2 = 0.25; (e) τ 2 = 0.49; (f) τ 2 = 1. The probability of the type I error is above 0.05for all Ns and τs, ranging from about ≤ 12% for N = 3 and decreasing to 0.055 forN = 20. The maximum fraction of rejections is 0.26 for N = 3 and τ 2 = 0.01, anddecreases for increasing N and τ . The range of values of µN for which it is above5% increases with τ 2 and with N . Even if the z-test is acceptable for meta-analysiswhen the number of studies is large enough, we still have a problem with lack ofreplicability.
20
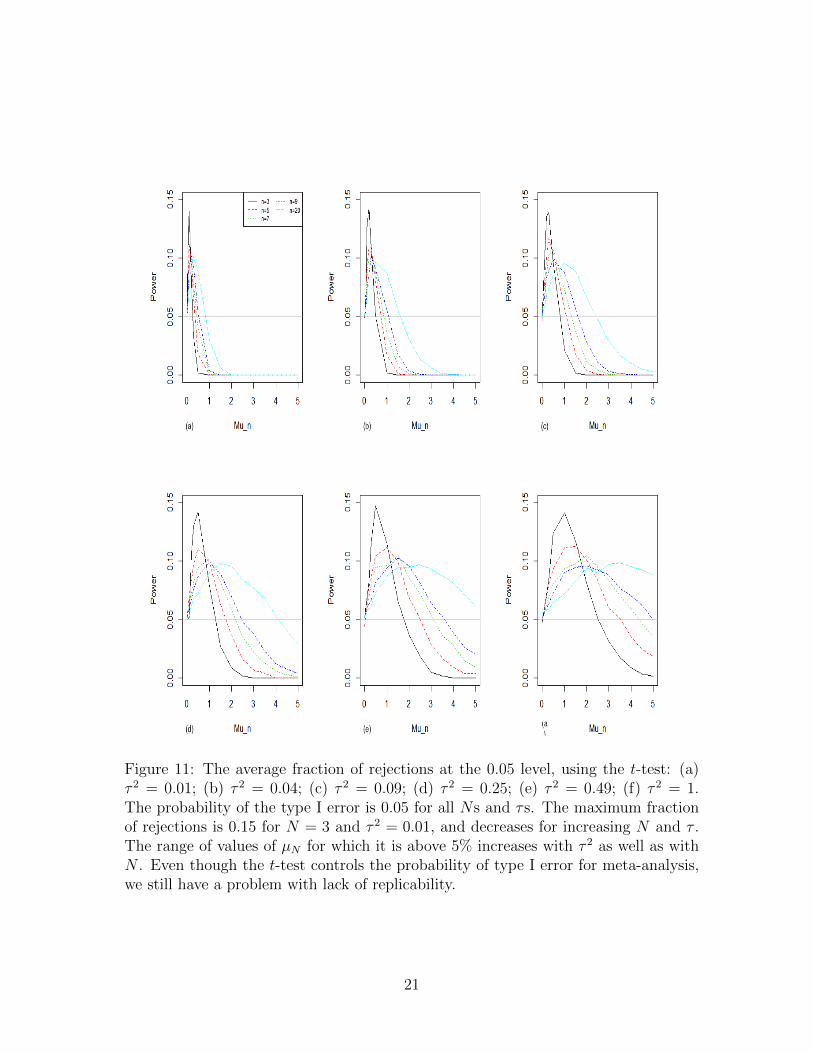
Figure 11: The average fraction of rejections at the 0.05 level, using the t-test: (a)τ 2 = 0.01; (b) τ 2 = 0.04; (c) τ 2 = 0.09; (d) τ 2 = 0.25; (e) τ 2 = 0.49; (f) τ 2 = 1.The probability of the type I error is 0.05 for all Ns and τs. The maximum fractionof rejections is 0.15 for N = 3 and τ 2 = 0.01, and decreases for increasing N and τ .The range of values of µN for which it is above 5% increases with τ 2 as well as withN . Even though the t-test controls the probability of type I error for meta-analysis,we still have a problem with lack of replicability.
21