Embed Size (px)
Citation preview
Quantifying rapid changes in coastal topography using modern mapping
techniques and GIS
HELENA MITASOVA, THOMAS G. DRAKE,
Department of Marine, Earth and Atmospheric Sciences, North Carolina State University,
Raleigh, NC 27695;
ph: 919-513-1327 email: [email protected] fax 919 515-7802
DAVID BERNSTEIN
Center For Marine and Wetland Studies, Coastal Carolina University
1270 Atlantic Avenue, Conway, SC 29526
RUSSELL S. HARMON
Army Research Office, Army Research Laboratory, Research Triangle Park, NC 27709
1

ABSTRACT
Innovativemethodologybasedon a combinationof Real Time Kinematic GPS (RTK-GPS),
lidar, and opensourceGIS was developedto gain a betterunderstandingof rapid changesin
coastaltopography.Improved spatial interpolation techniqueswere implementedto produce
detailedtopographicsurfacesfrom lidar andRTK-GPSdata.The methodologyis demonstrated
for two North Carolinaareas: Jockey'sRidgeStatePark,andBald HeadIsland. The Jockey's
Ridgestudy quantifiesrecentdunemovementand identifies areasof elevationloss and rapid
horizontalmigration that are threateningexisting infrastructure.The Bald Head Island study
examinespre- and post-nourishmentbeachevolution. The dynamicsof beachtopography,its
geometricpropertiesandestimatesof erodedanddepositedsandvolumesweredeterminedby
combining lidar elevationdata (1997-2000)with quarterly RTK-GPS measurements.Spatio-
temporalanalysisconfirms the relativestability of the central“pivot point” beachsectionand
revealsthat the beachchangesits shapefrom convexeastof the pivot point, to concaveto the
westof it in 1997-98andreversedshapesin year2000.The pivot point alsodividesthe beach
into two sectionsthat exhibit markedlydifferent responsesto nourishment.Although the entire
length of nourishedbeach retreated,the analysis reveals that the western section lost all
nourishedsandoffshore,whereasin the eastsection,significant sandvolume was pushedup
onto the beach, creating potential for recovery.
Key Terms: digital elevation model , beach erosion, sand dune, lidar, Kinematic GPS,
topographic analysis
2
INTRODUCTION
Overthepastdecade,thestandard30mUSGSDigital ElevationModel (DEM) hasbeen
successfullyusedfor a wide rangeof earthscienceapplications.However,its resolutionand
accuracywere not sufficient for representationof many coastal low-relief landscapeswith
features(e.g.,beachdunes,berms,scarps)that requireoneorderof magnitudehigherresolution
for adequatedigital representation(1-3 m, WoolardandColby, 2002). Acquiring suchdatafor
largerareasat shorttime intervals(oneyearandless)usingtraditionalgroundbasedsurveysor
photogrammetrywould be prohibitively time consumingandexpensive.Therefore,monitoring
of coastalchangehasuntil recentlybeen2-D, focusingon shorelineevolution (that could be
extractedfrom aerial photography)supportedby a limited set of shoreperpendicularprofiles.
Neither the 30m DEMs generatedat time intervalsof decadesnor 2-D shorelineand profile
mappingcan fully capturethe rapid coastal changescausedby natural processesor human
intervention.For example,identification of protectivebeachdune loss, assessmentof moved
sandvolumes,or evolutionof nourishedbeachesarechangesthat can influencethe designof
largecoastalmanagementprojects(oftencostingmillions of dollars).Accuratedataanda better
understandingof coastaltopographicchangecansignificantly improvethe successrateof such
coastal engineering projects.
Recentdevelopmentof RealTime KinematicGPS(RTK-GPS)andLight Detectionand
Ranging(lidar) technologieshave dramaticallychangedthe efficiency of 3-D mappingand
made repeatedhigh resolution measurementsof topography feasible for large areas (for
example,an airbornelidar typically acquiresmillions of x,y,zpoints with 1-3m spacingper
hour). Highly automateddata acquisition requiresprocessing,analysis,and visualization of
3

massive volumes of georeferenceddata, often acquired within different computational
environmentsand formats.GIS is a naturalchoicefor integrationand analysisof this type of
data;however,a traditional cartographyoriented2-D GIS approachis not sufficient (Raper,
1999). Recentdevelopmentsof modular and extendableproprietary GIS tools, as well as
emergenceof OpenSourceGIS (NetelerandMitasova,2002),havecreatedan opportunityto
extendthe rangeof GIS applicationsto new areas,including oceanographyandcoastalstudies.
Advanced3-D GIS tools substantiallyincreaseefficiency in dataprocessingand provide the
capabilitiesto gain new insights into geospatialaspectsof complex coastalsystems.GIS is
becomingan important tool in severalareasof coastalresearchand management,such as
monitoring,analysisandrisk assessment,predictionof impactsusingmodelingandsimulations,
as well as in planning and decision support (NOAA, 2000; Wright and Bartlett, 1999).
To explore the new possibilities for assessmentof rapid coastal changewe have
developeda methodologyfor 3-D analysisof coastaltopographyevolution basedon existing
high resolution lidar-basedelevation data combined with low cost, on-ground RTK-GPS
surveys.Thevalueof suchanalysisis illustratedby applicationsto coastalNorth Carolinasites
that face significant management challenges.
METHODS
High resolutionelevationdatawere acquiredfor two North Carolina locations:a) the
sanddunefield at Jockey'sRidge StatePark and b) a beachon Bald HeadIsland (Figure 1).
Both areashavehighly dynamictopographyanddisplaycomplexinteractionsbetweennatural
processesand human impacts. In the first case,the rate of dune field movementhad been
4

underestimatedwhentheStateParkwasestablishedin 1974(Judeet al., 2000).As a result,the
subsequentmigration of dunesoutsidethe park boundarieshasposedsignificant management
challenge.Thesecondarea,thesouthshoreof Bald Headisland,hasbeenexperiencingchronic
beacherosionand seriousconcernshavebeenraisedaboutthe impactsof a recentnavigation
channeldredgingproject in the adjacentCapeFearriver. To assessthe evolutionof thesetwo
areasand evaluateeffectivenessof implementedmanagementstrategies,a GIS databasewas
establishedand a proceduredevelopedfor integrationof the relevantspatio-temporaldata to
supportcontinuedanalysisof on-going changes.The methodologyinvolves dataacquisition,
preprocessing(includinggeoreferencing,projection,andrectificationtypically performedwithin
the surveyingsystems),importationinto a GIS, transformationto a commonrasterdatamodel,
and finally, spatial and spatio-temporal analysis and visualization.
Figure 1. Location of the study areas on the Outer Banks of North Carolina.
5

Data acquisition
Assessmentof rapid topographicchangewasbasedon elevationdataacquiredby lidar
andRTK-GPS.Lidar surveysof theNorth Carolinacoastwereperformedfor theAirborneLidar
Assessmentof CoastalErosion (ALACE) project during the years1997, 1998, 1999, 2000
(NOAA CoastalServicesCenter,2002; Stockdonet al., 2002). The Airborne Topographic
Mapper II (ATM-II) system was used to sample topographyfrom 700m altitude, which
generates200-300mmeterwide overlappingswathswith elevationmeasuredevery1-3 meters
(for technicaldetailsseeNOAA andUSGS,2002). Reportedverticalaccuracyin openareasis
15 cm (for detailedanalysisof accuracyfor quantifying beachchangesseeSallengeret al.,
2003). The results of the lidar surveys are dense "point clouds" of x,y,z data without
classification (e.g., for breaklinesor structures)and with significant oversamplingin the
overlappingareas.The data from the project are available for download from Lidar DAta
RetrievalTool (LDART) web site (LDART, 2002).Unfortunately,the ALACE programended
systematicannualmappingin 2000andnow contracswith the privatesectorbasedon coastal
management needs, so only limited high resolution elevation data are available after 2000 .
RTK-GPS has beenemployedto capturethe continuing topographicchangesin our
study areas. This technique, with a reported 10cm vertical accuracy, provides less detailed DEM,
but it is much easierto deploy. RTK-GPS has beenapplied for 2-D shorelinemappingfor
several years (e.g., List and Farris, 1999) and methodologyhas been developedfor cost
effective,rapid3-D beachmonitoring(for technicaldetailsseeMorton et al., 1999;Freeman,et
al. 2003; Bernsteinet al., 2003).For the Jockey'sRidgedunefield only dunecrestsandpeaks
6
weresurveyedon foot, dueto therestrictionsof vehiclemovementwithin thepark.On theBald
HeadIslandbeach,elevationswereautomaticallysampledat 3-6 m intervalsalongthe pathof
theall-terrainvehicleusedin thesurveys.While thedensityof along-pathdatawascomparable
to that for lidar, for practicalreasonsof time andcost,thedistancebetweenpathswasat leasta
magnitude larger than the along-path resolution (20-30 m for shore-parallel paths and 200-300 m
for shore-perpendicularpaths).This spatialanisotropyin dataacquisitionpresentedchallenges
for analysisthat requiredmodification of spatial interpolationmethod.The issueof optimal
beachsamplingpatternfor RTK GPScontinuesto bestudiedandsomepreliminaryresults were
reported by Bernstein et al. (2003).
By comparisonto data obtainedby traditional surveysor manualdigitization, which
typically include only a relatively small numberof carefully selectedand labeledpoints,data
collection using modern, highly automatedsurveying technologiespresentsa number of
challenges for processing:
� data sets are massive with oversampling and noise,
� coverage may be anisotropic (RTK- GPS) and/or heterogeneous with gaps,
� lidar datahaveno attributesexceptelevation,so objects,featuresand breaklinesmust be
identified during post-processing, often using the reflectance or imagery data
� mappingis very efficient (on the orderof 103 points/hourfor RTK-GPSand106 points/hour
for lidar), thereforeit canberepeatedat selectedtime intervals(e.g.annually)leadingto time
series of elevation surfaces that require solid support for processing of spatio-temporal data.
To meet thesechallenges,GIS tools should be capableof handling massivedata sets and
7

elevationsurfacesneedto be representedby a digital datamodel that supportsintegrationand
comparisonof datawith different samplingpatterns.Although a TriangularIrregularNetwork
(TIN) datamodelis commonlyusedfor representationof elevationsurfaces,eachdatasampling
has a different TIN structure,which makesit difficult to achievea consistencyneededfor
comparisonof temporalseriesof data.Therefore,grid representationbasedon thehigh accuracy
spatialapproximationmethoddescribedbelow,wasselectedas a moreappropriatedatamodel
for GIS dataanalysisandvisualization.OpenSourceGRASSGIS (NetelerandMitasova,2002)
wasusedasa GIS environment,becauseof its uniquespatialinterpolation,topographicanalysis,
3D visualization tools, and easy handling of large data sets. The possibility to modify the code to
fulfill the needs of a new application also contributed to this selection.
Spatial approximation and topographic analysis by RST
Computation of high resolution DEMs from lidar and kinematic GPS data was
performed by the function called RegularizedSpline with Tension and Smoothing (RST,
MitasovaandMitas, 1993;Mitas andMitasova,1999).The methodwasspeciallydesignedto
meetthe requirementsfor topographicanalysisby allowing simultaneouscomputationof slope
andcurvaturesbasedon derivativesof theRSTfunction(MitasovaandHofierka,1993).Several
studieshavedemonstratedits high accuracy(e.g.,MitasovaandMitas, 1993;McCauley,1995;
Hofierkaet al., 2002).Thequad-treebasedsegmentationprocedureensuresthecontinuityof the
resulting surfaceand, at the sametime, makesthe computationefficient for large data sets
(Mitasova et al., 1995). Comparisonof this method in terms of its design,properties,and
applicationswith otherspatialinterpolationmethods(suchTIN-basedmethodsandkriging) is
8
discussedin Mitas and Mitasova(1999). The equationsfor the interpolationfunction and its
partialderivatives,aswell asequationsusedfor thecomputationof slope,aspectandcurvatures,
can be found in Neteler and Mitasova (2002).
The RST function imitatesa behaviorof a thin flexible sheetforcedto passthroughor
close to the data points. Its tension parameter(Franke, 1985; Mitas and Mitasova, 1999;
Hutchinson,1989)tunesthesheetpropertiesbetweenthatof a stiff thin plate(leadingto a very
smoothsurface)andanelasticmembrane(leadingto a roughsurfacewith extremein eachdata
point). The tensionparameteris scaledependentand can be generalizedto a tensorwhich
enablesmodeling of anisotropy (Mitasova and Mitas, 1993), a feature that was especially
importantfor modelingbeachmorphologybasedon RTK-GPSsurvey.The RST methodalso
supportssmoothingof noisydatausingspatiallyvariablesmoothingparameterthatcontrolsthe
deviationsbetweenthe resulting surfaceand given data points. The smoothingand tension
parameterscanbeselectedempiricallyor by minimizationof thepredictiveerrorestimatedby a
cross-validation procedure (Mitasova et al., 1995; Hofierka et al., 2002).
Processing point data from lidar
For lower resolution analysis,with the size of grid cells larger than the distances
betweenpoints(5m andmore),simplegriddingmethodssuchasaveraging,provideddirectly by
the LDART web site (LDART, 2002),are sufficient.For example,the differencebetweenthe
sandvolume loss estimatedfrom a 5m resolutiongridded DEM and from a 2m resolution
interpolatedDEM wasonly 3% of the estimatedvolume(Mitasovaet al., 2003).However,for
analysisof active areaswhereit was importantto identify the featureshaving characteristic
9

lengthscloseto the spatialsamplinginterval, the RST spatialapproximationprovidedsuperior
resultsas illustrated by Figure 2. While simple gridding at 5m resolutionprovidedadequate
representationof the overall shapeof the dune,the 1m resolutionDEM computedby the RST
methodrevealedfencespartially buried in the sandand allowedus to identify the sharpdune
crestsand slip-faces.For the beachsurvey, interpolatedsurfacescapturedfeaturesthat are
important indicatorsof beachstability (e.g.,berms)or active erosion(scarps).To reducethe
impact of noise, presentin the lidar measurements,a small, empirically selectedvalue of
smoothing was used.
Figure 2. Gridding lidar data for Jockey's Ridge: a) assigning points to 5m grid, the highest resolution
that creates a continuous surface, b) approximating to 1m grid using RST leads to a DEM that reveals
buried fences and provides crisp representation of dune crests without the need to define breaklines.
10

Processing RTK-GPS data
Gridding techniques for data obtained by traverse sampling using various
interpolation methods were evaluated by McCauley (1995) in the context of RTK-GPS
mapping of agricultural fields. This study demonstrated that the results obtained by the
RST function and nearest neighbor method were better than the results from inverse
distance weight interpolation and kriging. Compared to a typical agricultural field, the
traversing and gridding of coastal topography poses specific challenges due to terrain
anisotropy caused by wind- and wave-generated sediment-transport processes. While lidar
data provide sufficient sampling density to capture the anisotropic beach features,
obtaining adequate representation with RTK-GPS was more difficult. Approximation at
resolutions similar to the distances between the traverse paths (30m grid cell size and
more) was straightforward, however, smaller features mapped along the paths were lost.
To capture at least some of this detail by using higher resolutions (5m grid cell size and
smaller), approximation with anisotropy was used (Figure 3). The isotropic approximation
resulted in a surface with artificial waves (undershoots and overshoots between the shore-
perpendicular profiles as shown by the unrealistic pattern of contours in Figure 3b), the
introduction of anisotropy in the direction of long-shore profiles removed the artificial
features and lead to a typical, relatively straight beach topography (Figure 3c). Similarly
as for kriging, anisotropy was applied as a rescaling factor in a given direction. The
direction was estimated within the GIS as a direction of the longshore profile, but it can be
11

also measured in the field or estimated by geostatistical analysis. In the current RST
implementation, anisotropy is spatially uniform, so areas with different anisotropy need to
be split into subsections. This was not necessary for our study area but for more general
applications support for continuously variable anisotropy needs to be added to RST to
make the application to curved shoreline areas more efficient.
Figure 3. Interpolation of RTK-GPS data by RST: a) traditional survey pattern used in 2001: shoreline
and cross-shore profiles; b) approximation of a DEM from traditional survey pattern using RST without
anisotropy, c) more realistic beach representation is achieved from the same data by using RST with
anisotropy; d) survey pattern, better suited for computation of DEM, used for 2002 and 2003
measurements but anisotropy is still needed to avoid artifacts.
Analysis of topographic change
Identification and quantificationof changesin topographywas performedwithin GIS
usingstandardGIS tools,suchasmapalgebraandspatialquerycombinedwith interactive3-D
visualization.In the first application,migration of the dune field and changein elevationat
12
selectedlocations was estimatedusing spatial query and distancefunction applied to the
combinationof interpolatedlidar-basedDEM andRTK-GPStraversedata.The assessmentof
recentchangein elevationand sandvolumesfor the Bald Head Island beachwas basedon
computationof first- andsecond-orderdifferencesbetweenthe interpolatedsurfacesusingmap
algebra.The differenceswere usedto estimatespatialdistribution and total amountsof sand
volume loss and gain and to identify erosion acceleration.
RESULTS
Integration of modern surveying data from lidar and RTK-GPS allowed us to perform
spatio-temporal analysis of monitored coastal areas at high spatial and temporal resolutions,
quantify the observed changes and gain unique insights into ongoing coastal processes.
Dunes at Jockeys Ridge State Park
Jockey'sRidge,the largestactivesanddunefield on theUS eastcoast,lies within a 400
acrestatepark on the North CarolinaOuter Banks(Figure1, Figure 4). Encroachmentof the
dunestowarda roadandhomeson the southernborderof the park hasbeena continuingland
managementproblem.Judgeetal. (2000)comparedthedunetopographybasedon contourmaps
and photogrammetricdataproducedin 1950,1974 and 1995.This work demonstrateda long
term trendof southwarddunemigration,a lowering of the highestduneelevations(especially
themainridge),andconcomitantsandvolumeincreaseat lower elevations.In recentyears,sand
fencing was installed on the south dune to slow its migration.
13
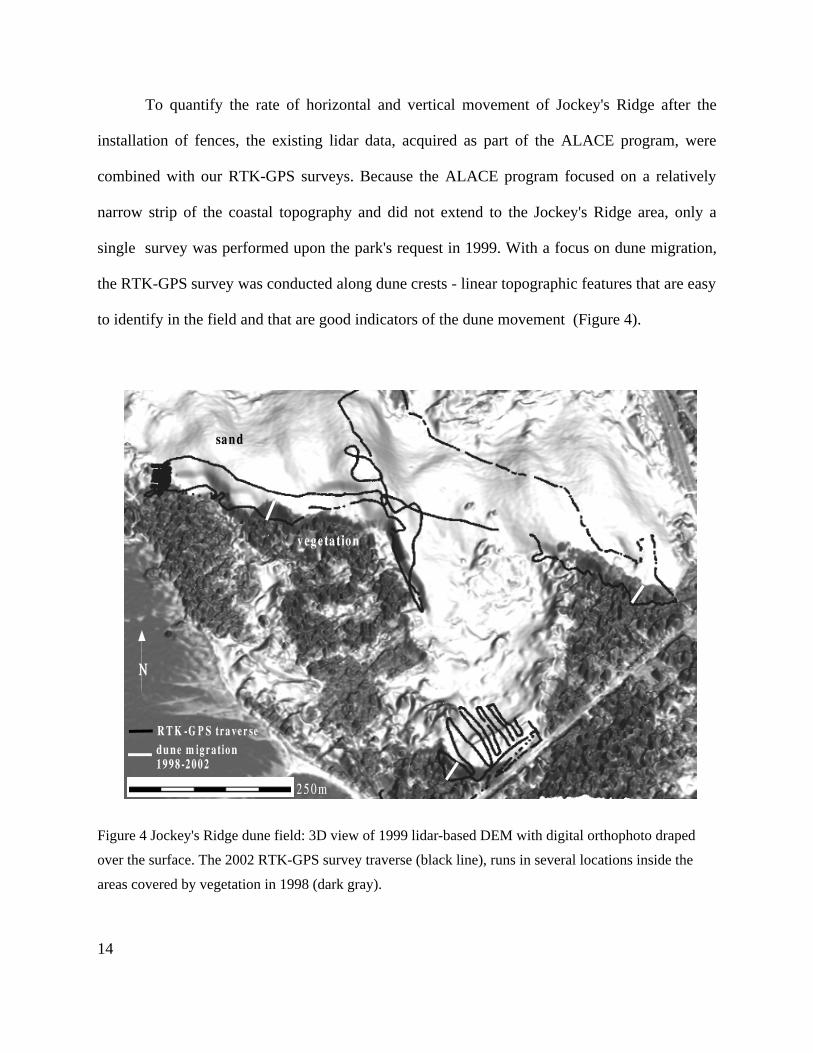
To quantify the rate of horizontal and vertical movementof Jockey'sRidge after the
installationof fences,the existing lidar data,acquiredas part of the ALACE program,were
combinedwith our RTK-GPSsurveys.Becausethe ALACE programfocusedon a relatively
narrow strip of the coastaltopographyand did not extendto the Jockey'sRidge area,only a
single surveywasperformeduponthe park'srequestin 1999.With a focuson dunemigration,
theRTK-GPSsurveywasconductedalongdunecrests- lineartopographicfeaturesthatareeasy
to identify in the field and that are good indicators of the dune movement (Figure 4).
Figure 4 Jockey's Ridge dune field: 3D view of 1999 lidar-based DEM with digital orthophoto draped
over the surface. The 2002 RTK-GPS survey traverse (black line), runs in several locations inside the
areas covered by vegetation in 1998 (dark gray).
14

TheRTK-GPStraversedatacollectedin thewinter of 2002werecomparedwith the1m
resolutionDEM approximatedby RST using the 1999 lidar data.The high resolutionwas
necessaryfor representationof dunecrestsassharpedgesand for estimationof their location
with horizontalprecisionof 1m. To identify the exactlocationsof dunecrestsand slip faces,
profile curvaturesof the elevationsurfacewerecomputedsimultaneouslywith approximation.
The curvatureanalysiswasperformedat 1m resolutionat threedifferent levelsof detail which
were determinedby the tension and smoothing parameters(Figure 5). Based on visual
inspection,the surfacewith tension=400provided the most useful result (Figure 5b). Higher
tensioncapturedthe lidar noisepattern(Figure5a); lower tensionsmoothed-outthecrestsbut it
providedcleardelineationof themainduneshoulders(Figure5c). Becausethedensityof lidar
datawassohigh, thesharpedgesof dunecrestswerecapturedwithout the needto definethem
as breaklines.
In addition to the lidar and RTK-GPSdata,an infrared orthophoto(IR-DOQQ) at 1m
resolutionwasavailablefor 1998.This imagewasusedto assesshorizontaldunemovementin
thoseareaswherethedunehasmigratedontopre-existingvegetation.Thelengthandorientation
of maximumhorizontaldunemovementweremeasuredperpendicularlyto the threemaindune
crests(Table1). Vertical changewascomputedalongthe RTK-GPSpathsby transformingthe
RTK-GPStraverseto a 1m resolutionrasterrepresentationand thencomputingthe difference
betweenthe1999lidar DEM and2002RTK-GPSelevationsusingmapalgebra.Themaximum
elevationchangesare reportedin Table 1. The comparisonof the 1998-1999-2002horizontal
dunecrestslocationsshowsthat all dunecrestshavemovedin the south/south-westdirection
between20mto 40m,thusthreateningtheroadandhomesalongthesouthboundaryof thepark.
15

After installation of fences,the primary direction of the south dune movementhas shifted
towardsthe west.The differencesin 1999-2002elevationsindicatethat the duneis flattening,
loosingover2m at its highestpoint (Table1). Gainsin elevationmorethan2m wereobservedin
lower elevation areas where protection fences were installed, proving their effectiveness in
trapping sand.However, the most significant increasein elevation (over 4m) was observedin low
elevationareasthat wereovertakenby migratingdunecrests.Thesechangesare in generalagreement
with the analysisby Judgeat al. (2000) however,the lossof elevationon the main ridge seemsto be
accelerating.
Table 1 Maximum vertical and horizontal dune change in [m] at different sections.
location horizontalchange 98-99
horizontalchange 99-02
migrationdirection
verticalchange 99-02
elevation1999
elevation2002
main dune peak - - - -2.1 25.7 23.6
main dune crest A - 45 S 3.9 14.3 18.2
main dune crest B 10 18 S 4 6.5 10.5
south dune peak - - - -3.0 10.8 7.8
south dune crest 7 21 SW 4.7 1.4 6.1
south dune fence C - - - 1.7 3.6 5.3
south dune fence D - - - 2.8 7.2 10
east dune near peak - - - -1.7 15.3 13.6
east dune crest 16 25 SW 3 1.7 3.7
The quantitativeassessmentof dunemovementmadepossiblethroughthe useof state-
of-the-artmappingtechnologiesand integratedGIS analysishasprovidednew insight into the
short-termevolution of the Jockey'sRidge sanddunefield. Throughdetailedspatialanalysis,
areasof relative dune stability were located,areasand direction of active dune translation
requiring land managementintervention were identified, and ratesof changeover the time
intervals 1998-1999-2002 were quantified.
16
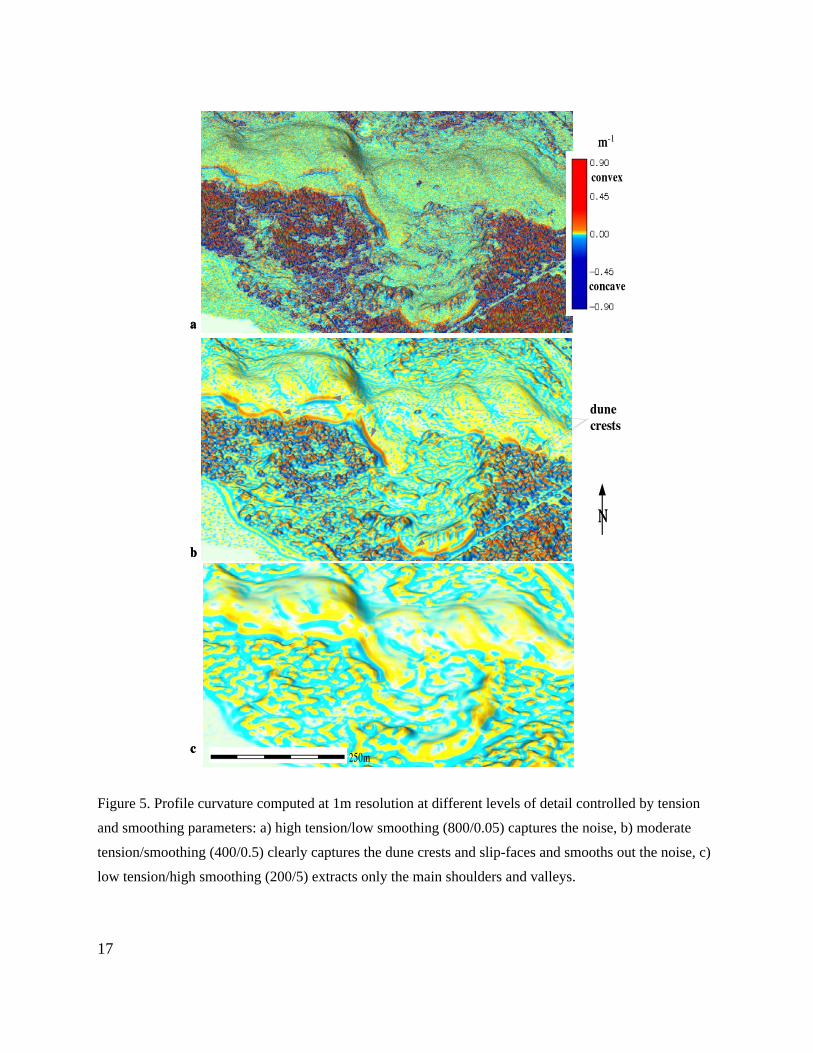
Figure 5. Profile curvature computed at 1m resolution at different levels of detail controlled by tension
and smoothing parameters: a) high tension/low smoothing (800/0.05) captures the noise, b) moderate
tension/smoothing (400/0.5) clearly captures the dune crests and slip-faces and smooths out the noise, c)
low tension/high smoothing (200/5) extracts only the main shoulders and valleys.
17
Bald Head Island
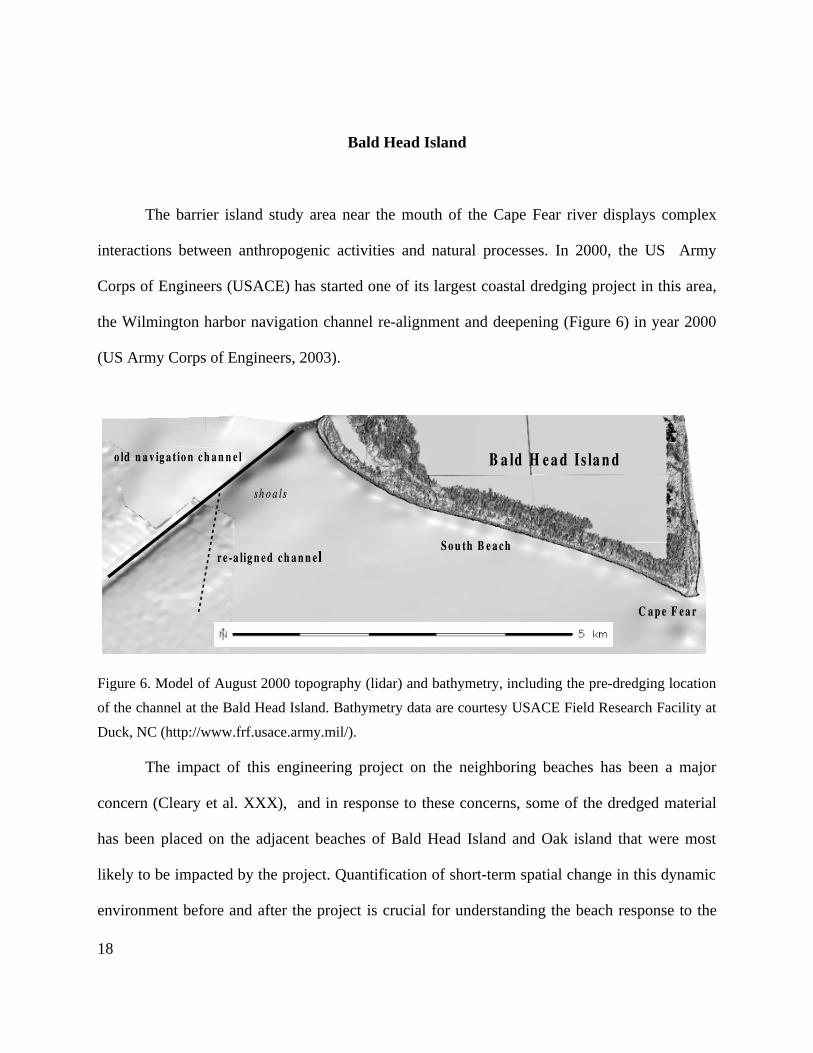
The barrier island study areanearthe mouth of the CapeFearriver displayscomplex
interactionsbetweenanthropogenicactivities and natural processes.In 2000, the US Army
Corpsof Engineers(USACE)hasstartedoneof its largestcoastaldredgingprojectin this area,
the Wilmington harbornavigationchannelre-alignmentanddeepening(Figure6) in year2000
(US Army Corps of Engineers, 2003).
Figure6. Model of August2000topography(lidar) andbathymetry,including thepre-dredginglocation
of thechannelat theBald HeadIsland.BathymetrydataarecourtesyUSACEField ResearchFacility at
Duck, NC (http://www.frf.usace.army.mil/).
The impact of this engineeringproject on the neighboringbeacheshasbeena major
concern(Clearyet al. XXX ), andin responseto theseconcerns,someof the dredgedmaterial
hasbeenplacedon the adjacentbeachesof Bald HeadIsland and Oak island that were most
likely to be impactedby theproject.Quantificationof short-termspatialchangein this dynamic
environmentbeforeandafter the project is crucial for understandingthe beachresponseto the
18

substantial modifications in nearby bathymetry and for finding sustainablemanagement
solutions.
TheSouthBeachof Bald HeadIslandhasbeena major focusof the monitoringefforts.
Analysis of historical maps (Cleary et al., 1989) has shown rotation of the South Beach shoreline
around relatively stable central pivot point area (Figure 7). The counterclockwiserotation
accompaniedby growth of the west sectionof the beach(over 800m) was reversedin 1960s
whenWilmington harborchannelwasdeepenedto 12m and,in someplaces,reachedbedrock.
While thestudyby Clearyet al. (1989),basedon mapsandaerialphotographs,providedinsight
into the long term 2-D evolution of shoreline,the availabledatacould not be usedto assess
changesin the beachmorphologyor to estimatethe volume of erodedsand.The lidar ATM
surveys(NOAA-USGS,2002)performedin 1997,1998,1999,and2000providedexcellentdata
for assessmentof the “pre-project” beach evolution including the impacts of two major
hurricanes(Bonniein 1998andFloyd in 1999).After thecompletionof thenourishmentproject
in summer2001,ongoingquarterlyRTK-GPSsurveyshaveprovidedlessdetailed,but adequate
representation of beach evolution.
To quantifythepre-nourishmenttopographicchangetheannuallidar elevationdatawere
approximatedto 2m resolutiongrids by RST. Becausethe lidar surveyextendsto the sea,as
well asbeyondthe beachinto vegetatedanddevelopedareas,a maskwascreatedthat restricts
the analysisonly to the 4.5km long andbetween120mto 70m wide openbeach coveringan
areaof 36ha.The differencebetweenthe 1997 and 2000 elevationsurfaceswithin this area
indicatesthat the beachsandlosswasaround375,000m3, of which about15%wastransported
landwardoverthebeachdune,increasingtheelevationup to 1.5m in someareas;theremainder
was lost offshore.Temporaldistribution of erosionwas relatively steadybetween120,000-
19

160,000m3 annually,while sandgainsdueto accretionandoverwashvariedbetween24,000-
42,000 m3 per year. Both erosion and accretion rates were spatially variable and their
distributionhadsignificantimpacton thecross-shorebeachshape.Lidar datafrom 1997define
a wide, convexbeachwith well-developedbermsin the westsectionof the studiedareaanda
concaveshapewith a steepscarpin the east(Figure 7). The shapeof the beachtransforms
smoothly from convex to concavealong the relatively stablepivot point area(Figure 7). By
2000,after two majorhurricanes,thescarpat theeastendhaderodedcompletely,changingthe
eastsectionbeachshapeto uniform with low slope.By comparison,rapid erosionof the berms
in the westsectionchangedthe beachshapetherefrom convexto concavewith a well-defined
scarp.Secondorder differencesshow acceleratingerosionat the foot of the beachscarpand
decelerationon thelower partof beachwith gentlerslopes.This indicatesthatthescarpsmaybe
acceleratingerosiondueto their steepslopein absenceof anysignificantwind sandtransportto
fill the concaveareasat the foot of the scarpandlower the slope.However,currentlythereare
almost no data showing the change of beach geometry due to the sand transport by wind.
The beachwas nourishedwith sanddredgedfrom the re-alignedchannelin the spring
andsummerof 2001,changingits shapeto convexalongthe entirelengthof thebeach(Figure
7). Basedon the RTK-GPSsurveyperformedin December2001,the nourishedbeachquickly
gaineda shapedistributionsimilar to theoneobservedin 2000.TheMay 2002dataindicatethat
the intenseerosionobservedbeforenourishmenthadcontinuedin the westsection,closeto the
areawith mostsignificantchangesin bathymetry.ThedifferencesbetweentheDecember2001,
May 2002,andSeptember2002datashowthat the sandvolumelosscontinuedat an increased
rate and that nourishmentdid not havea substantialimpact on the patternof erosionprocess
(Figure7). The endof the eastbeachsectioncloseto CapeFearwasextending,following the
20

trendobservedin 2000,andthis trendhadbeenenhancedby thebeachnourishment.Thecentral
part of the beach,aroundthe pivot point, hasbeenrelatively stableboth beforeand after the
nourishment(Figure 7). The RTK-GPS survey conductedafter tropical storm Gustav in
September2002produceda particularlyinterestingobservation.While comparisonbasedsolely
on 2-D shorelineposition showsretreatalong the entire length of the beach(Figure 7), 3-D
analysisrevealsdifferentbehaviorfor theeastandwestsections.Thewestsection lost mostof
its new sandwithin a year of nourishmentand, in someareas,erosionhasmovedthe beach
inland beyond the 2000 pre-nourishment surface. By contrast, a substantial portion of sand in the
eastsectionwas pushedup onto the beach,increasingelevationin someareasup to 0.6 m,
creating conditions for partial beach recovery.
This analysisindicatesthat, underthe currentconditions,the westsectionof the beach
will only be sustainedthroughfrequentnourishment or relocationof the deependchannel.A
betterunderstandingof nearshoreprocessesandnewnourishmentapproachesmaybenecessary
to return the beach to self-sustaining dynamic equilibrium.
CONCLUSIONS
Theanalysisof rapid topographicchangeat two different locationson the North Carolinacoast
demonstratethat the integrationof modernmappingtechniquesandwell-designedgeospatialmodeling
and analysistools can provide new insights into the short term evolution of coastallandscapesby
quantifying topographicchangeat high levelsof spatialand temporaldetail. Suchresultscanprovide
importantinformationfor landmanagementdecisionmakingaswell asmethodologiesandtoolsthatcan
be applied to other coastal regions.
21

Figure7. Overlayof lidar-based1997and2000elevationsurfaces, visualizedusingmultiple surfacesandcutting planes.Detail showschangein thewest(convexto concave),central(relatively stable)andeast (concave to convex) crossections.
Figure 8. Overlayed lidar-based2000 elevation surfaceand RTK-GPS-basedDec. 2001, May andSeptember2002 surfaces.Crossectionsshow completeerosionof nourishedbeachin the west sectionand erosion accompanied by redistribution of sand on the beach in the central and east sections.
22

Applicationof our methodologyto theJockey'sRidgesanddunefield hasconfirmedthe
long term trend of dune erosionand migration with possibleaccelerationof this processin
recentyears.The main ridge haslost almosthalf of its elevationsince1950andthe horizontal
movementof crestscontinuesat rates20-40m per year. The recentplacementof downwind
fenceshasbeeneffectivein trappingsand,however,the impactis limited to thelower elevation
areas.The ongoingstudy of this areawill be further enhancedby the recentreleaseof North
Carolinafloodplainmappingelevationdataobtainedby a different type of lidar. This new data
will allow us to comparethe spatial patternand volumesof erosionand accretionafter the
installation of fences with those reported in a study by Jude et al. (2000).
TheRTK-GPSsurveysallowedusto studyBald HeadIslandSouthbeachasa complex,
continuoussurface, analyze its geometry, and quantify the beach responseto changesin
bathymetryand nourishment.Using 3-D visualizationof multiple surfacesit was possibleto
detectimportantaspectsof beachevolution,suchaschangein thebeachshapeandthedifferent
fateof transportedsandin theeastandwestsectionsof thebeach.Thestudyprovidedimportant
information for coastal managementrelated to effectivenessof beach nourishment and
possibilities for improving beach stability.
ACKNOWLEDGMENTS
Support from the National ResearchCouncil and U.S. Army ResearchOffice is
gratefully acknowledged.The lidar data were provided by USGS/NOAA Coastal change
program (http://www.csc.noaa.gov/crs/tcm/about_ldart.html ) while the bathymetrydata were
provided by the USACE Field Research Facility, Duck (http://www.frf.usace.army.mil/mound/).
23

REFERENCES
BERNSTEIN, D., JUN-YONG PARK, FORTE M.F., GAYES P.T., AND MITASOVA, H.,
2003, Spatial Survey Framework Analysis for 3D Mapping of Beach and Shoreface
Morphology, in Proc. of the Int. Conf. on Coastal Sediments 2003. CD-ROM, World Scientific
Publishing Corp. and East Meets West Productions, Corpus Christi, Texas, USA.
CLEARY, W.J., HOSIER, P.E., AND GAMMIL, S.P.,1989, Historic and dredging-induced
shorelinechanges,Bald Head Island, CapeFear,North Carolina, in Coastal Zone '89 Post-
Conference Proceedings.
FRANKE, R., 1985,Thin platesplinewith tension.ComputerAidedGeometricalDesign,Vol.
2, pp. 87-95.
FREEMAN,C. W., WELLS, J.T., AND BERNSTEIN,D., 2003,Spatio-temporalvariability in
shorelineand nearshoremorphology:resultsfrom 3D monitoring efforts along BogueBanks,
North Carolina, in Proc. of the Int. Conf. on Coastal Sediments2003, CD-ROM, World
Scientific Publishing Corp. and East Meets West Productions, Corpus Christi, Texas, USA
HOFIERKA, J., PARAJKA, J., MITASOVA, H., AND MITAS, L., 2002,Modeling impactof
terrainon precipitationusing3-D spatialinterpolation.Transactionsin GIS, Vol. 6(2), pp. 135-
150.
24

HUTCHINSONM. F., 1989.A newprocedurefor griddingelevationandstreamline datawith
automatic removal of spurious pits. Journal of Hydrology, Vol. 106, pp. 211-32.
JUDGE, E.K., COURTNEY, M.G., AND OVERTON, M.F., 2000, Topographicanalysisof
dunevolume and position, Jockey'sridge statepark, North Carolina,Shoreand Beach, Vol.
68(4), pp. 19-24.
LDART, 2002, LIDAR DAta Retrieval Tool, NOAA Coastal Services Center,
http://www.csc.noaa.gov/crs/tcm/about_ldart.html
LIST, J.,AND FARRIS,A., 1999,Large-scaleshorelineresponseto stormsandfair weather,in
Proceedings of the International Conference on Coastal Sediments '99, pp. 1324-1338.
MCCAULEY, J.D., 1995, Smoothfunction approximationfor surfacerepresentationof soil
sensor data, PhD thesis. Purdue University, West Lafayette, IN
MITAS, L. AND MITASOVA, H., 1999,SpatialInterpolation,in P.Longley,M.F. Goodchild,
D.J. Maguire, D.W.Rhind (Eds.),GeographicalInformation Systems:Principles, Techniques,
Management and Applications, Wiley, 481-492.
MITASOVA, H., BERNSTEIN,D., DRAKE, T.G.,HARMON, R., AND MILLER, C.H.,2003,
Spatio-temporalanalysisof beach morphology using LIDAR, RTK-GPS and Open source
GRASSGIS, in Proc. of the Int. Conf.on CoastalSediments2003. CD-ROM, World Scientific
25

Publishing Corp. and East Meets West Productions, Corpus Christi, Texas, USA.
MITASOVA, H., MITAS, L., BROWN,W.M., GERDES,D.P.,AND KOSINOVSKY, I., 1995,
Modeling spatiallyandtemporallydistributedphenomena:New methodsandtools for GRASS
GIS. International Journal of GIS, Vol. 9 , pp. 443-446.
MITASOVA, H., AND MITAS, L., 1993, Interpolationby regularizedspline with tension:I.
Theory and implementation. Mathematical Geology, Vol. 25, pp. 641-655.
MITASOVA, H., AND HOFIERKA, J.,1993,Interpolationby regularizedsplinewith tension:
II. Application to terrainmodelingandsurfacegeometryanalysis.MathematicalGeology,Vol.
25, pp. 657-669.
MORTON R. A., LEACH M. P., PAINE J.G., AND CARDOZA M. A., 1999, Monitoring beach
changes using GPS surveying techniques. Journal of Coastal Research, Vol. 9 (3), pp. 702-720.
NETELER, M. AND MITASOVA, H., 2002, Open SourceGIS: A GRASSGIS Approach,
Kluwer Academic Press, Boston, Dordrecht, 464 pages.
NOAA, 2000, Coastal visions 2025. Electronic document: http:// www.noaa.gov
NOAA CoastalServicesCenter,2002, Topographicchangemapping, Electronic document:
http://www.csc.noaa.gov/crs/tcm/index.html
26
NOAA and USGS, 2002, Airborne Topographic Mapper, Electronic document:
http://www.csc.noaa.gov/crs/tcm/atm2.html
RAPER,J., 1999,2.5 and 3D GIS for coastalgeomorphology,in Wright D. and Bartlett, D.,
(Eds), Marine and Coastal Geographical Information Systems, Taylor & Francis, pp. 129-136.
SALLENGER A.H., KRABILL W.B., SWIFT, R.N., BROCK, J., LIST H.J., HANSEN, M.,
HOLMAN, R.A., MANIZADE, S., SONTAG, J., MEREDITH, A., MORGAN, K., YUNKEL,
J.K., FREDERICK, E.B. AND STOCKDON, H.F, 2003, Evaluationof airbornetopographic
Lidar for quantifying beach changes. Journal of Coastal Research, Vol. 19 (1), pp. 125-133.
STOCKDON,H.F., SALLENGER A.H., LIST H.J., AND HOLMAN, R.A., 2002,Estimation
of shorelineposition and changeusing airbornetopographicLIDAR data.Journal of Coastal
Research, Vol. 18 (3), pp. 502-513.
US Army Corps of Engineers,2003, Wilmington Harbor Project, Electronic document:
http://www.saw.usace.army.mil/wilmington-harbor/main.htm
WOOLARD, J.W. AND COLBY, J.D., 2002, Spatial characterization,resolution, and
volumetric changeof coastaldunesusing airborneLIDAR: Cape Hatteras,North Carolina.
Geomorphology, Vol. 48, 269-287.
WRIGHT, D. AND BARTLETT, D., (Eds), 1999, Marine and Coastal Geographical
Information Systems. Taylor & Francis.
27

FIGURE CAPTIONS
Figure 1. Location of the study areas on the Outer Banks of North Carolina.
Figure 2. Gridding lidar data for Jockey's Ridge: a) assigning points to 5m grid, the highest resolution
that creates a continuous surface, b) approximating to 1m grid using RST leads to a DEM that reveals
buried fences and provides crisp representation of dune crests without the need to define breaklines.
Figure 3. Interpolation of RTK-GPS data by RST: a) traditional survey pattern used in 2001: shoreline
and cross-shore profiles; b) approximation of a DEM from traditional survey pattern using RST without
anisotropy, c) more realistic beach representation is achieved from the same data by using RST with
anisotropy; d) survey pattern, better suited for computation of DEM, used for 2002 and 2003
measurements however, anisotropy is still needed to avoid artifacts..
Figure 4 Jockey's Ridge dune field: 3D view of 1999 lidar-based DEM with digital orthophoto draped
over the surface. The 2002 RTK-GPS survey traverse (black line), runs in several locations inside the
areas covered by vegetation in 1998 (dark gray).
Figure5. Profile curvaturecomputedat 1m resolutionat different levelsof detail controlledby tension
and smoothingparameters:a) high tension/lowsmoothing(800/0.05)capturesthe noise,b) moderate
tension/smoothing(400/0.5)clearlycapturesthedunecrestsandslip-facesandsmoothsout thenoise,c)
low tension/high smoothing (200/5) extracts only the main shoulders and valleys.
Figure6. Model of August2000topography(lidar) andbathymetry,including thepre-dredginglocation
of thechannelat theBald HeadIsland.BathymetrydataarecourtesyUSACEField ResearchFacility at
28

Duck, NC (http://www.frf.usace.army.mil/).
Figure 7. Overlay of lidar based 1997 and 2000 elevation surfaces, visualized using multiple surfaces
and cutting planes. Detail shows change in the west (convex to concave), central (relatively stable) and
east (concave to convex) crossections.
Figure 8. Overlayed lidar-based2000 elevation surfaceand RTK-GPS-basedDec. 2001, May and
September2002 surfaces.Crossectionsshow completeerosionof nourishedbeachin the west section
and erosion accompanied by redistribution of sand on the beach in the central and east sections.
29