Embed Size (px)
Citation preview
2016 Annual Conference
Quantifying Flicker: Fourier Filtering of Light Jonathan McHugh, PE; McHugh Energy Consultants
& Michael McGaraghan; Energy Solutions
Agenda
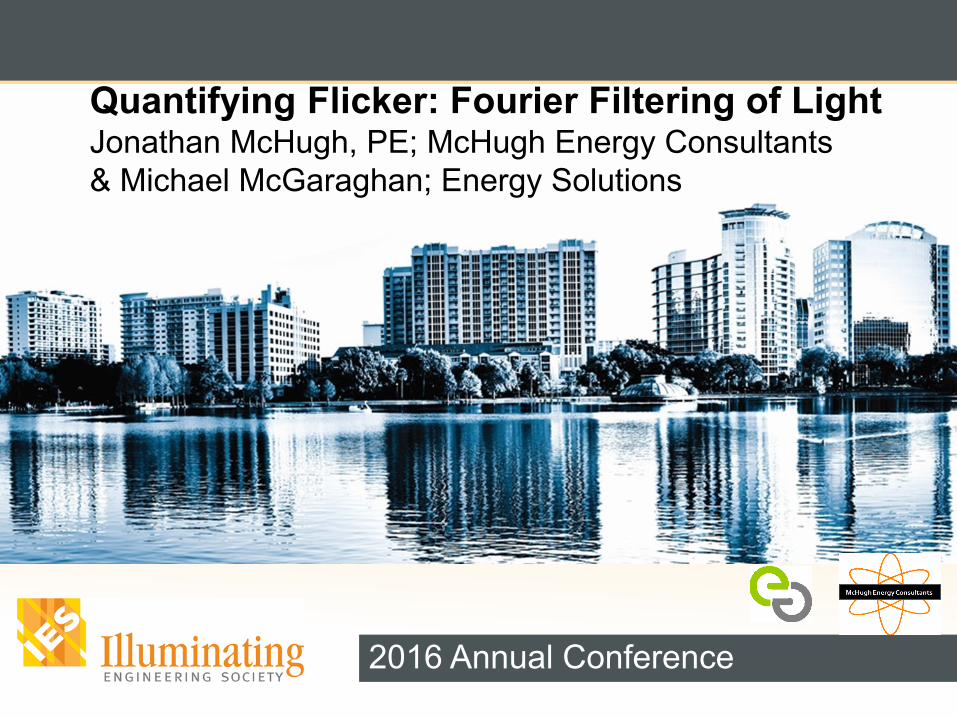
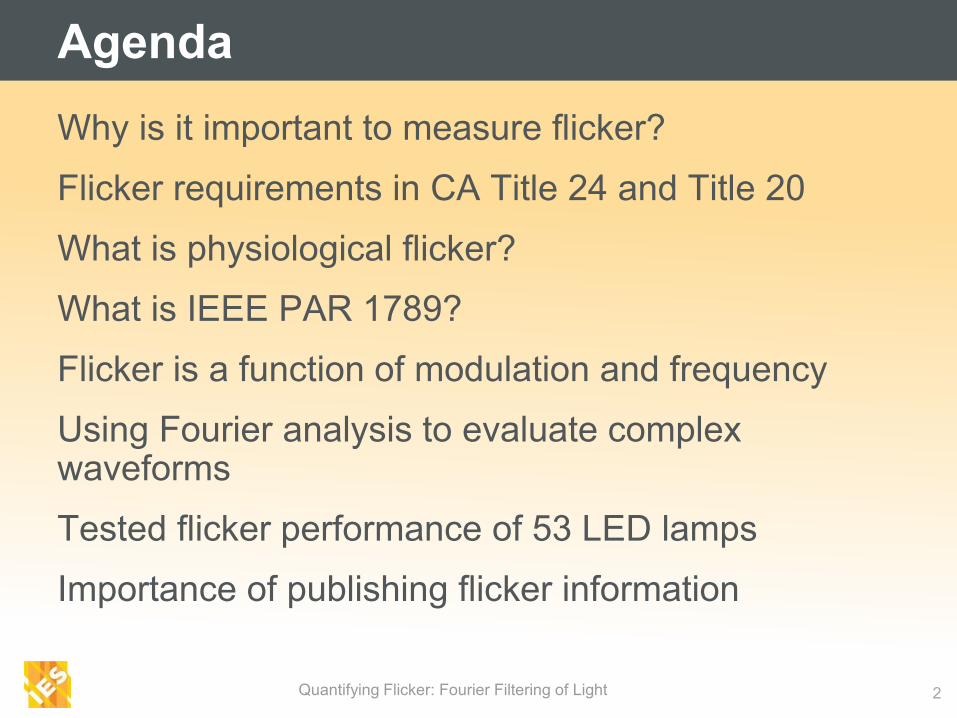
Why is it important to measure flicker?
Flicker requirements in CA Title 24 and Title 20
What is physiological flicker?
What is IEEE PAR 1789?
Flicker is a function of modulation and frequency
Using Fourier analysis to evaluate complex waveforms
Tested flicker performance of 53 LED lamps
Importance of publishing flicker information
Quantifying Flicker: Fourier Filtering of Light 2
3
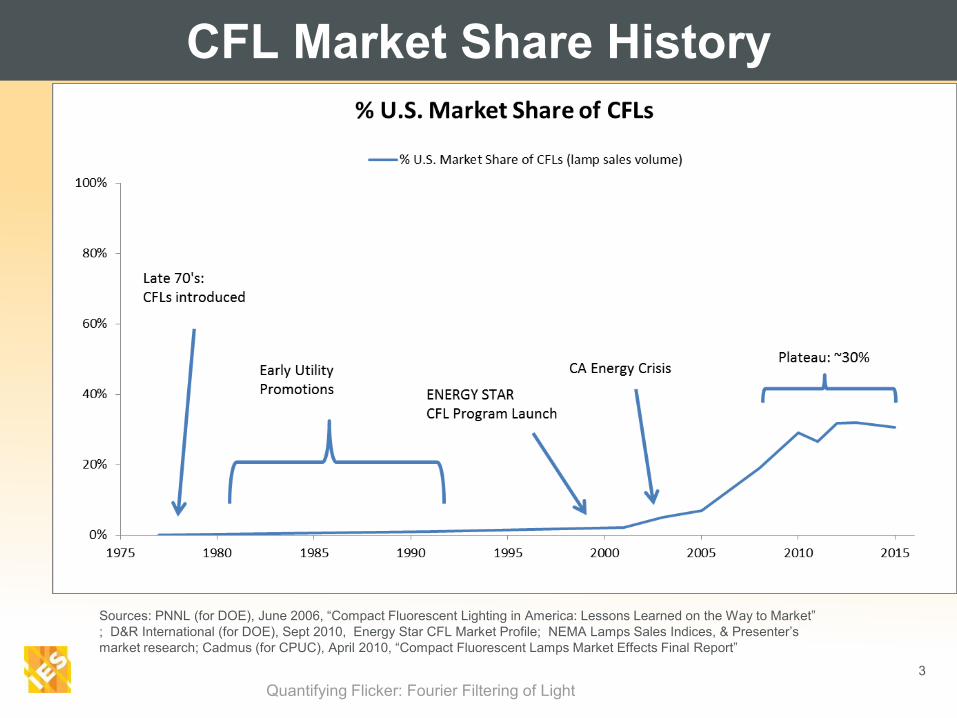
CFL Market Share History
Quantifying Flicker: Fourier Filtering of Light
Sources: PNNL (for DOE), June 2006, “Compact Fluorescent Lighting in America: Lessons Learned on the Way to Market”
; D&R International (for DOE), Sept 2010, Energy Star CFL Market Profile; NEMA Lamps Sales Indices, & Presenter’s
market research; Cadmus (for CPUC), April 2010, “Compact Fluorescent Lamps Market Effects Final Report”
4
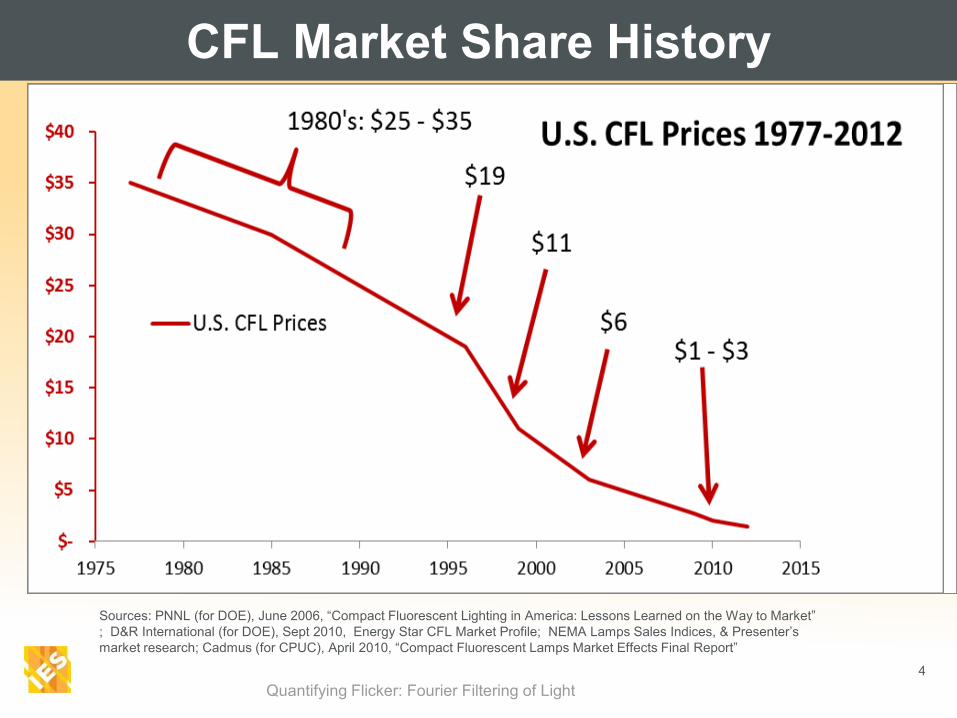
CFL Market Share History
Quantifying Flicker: Fourier Filtering of Light
Sources: PNNL (for DOE), June 2006, “Compact Fluorescent Lighting in America: Lessons Learned on the Way to Market”
; D&R International (for DOE), Sept 2010, Energy Star CFL Market Profile; NEMA Lamps Sales Indices, & Presenter’s
market research; Cadmus (for CPUC), April 2010, “Compact Fluorescent Lamps Market Effects Final Report”
5
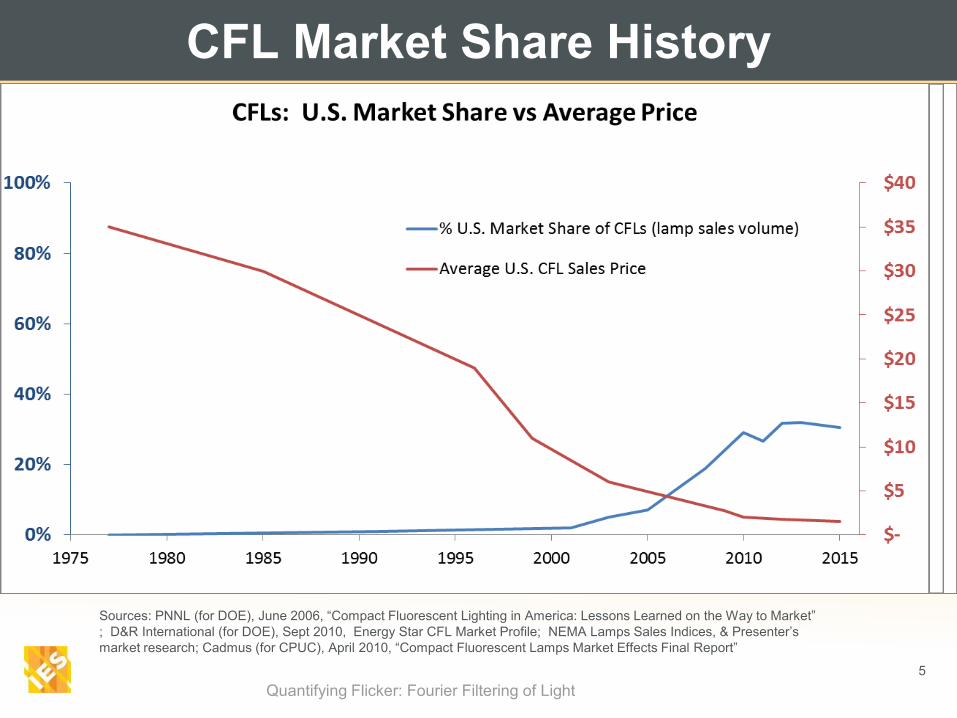
CFL Market Share History
Quantifying Flicker: Fourier Filtering of Light
Sources: PNNL (for DOE), June 2006, “Compact Fluorescent Lighting in America: Lessons Learned on the Way to Market”
; D&R International (for DOE), Sept 2010, Energy Star CFL Market Profile; NEMA Lamps Sales Indices, & Presenter’s
market research; Cadmus (for CPUC), April 2010, “Compact Fluorescent Lamps Market Effects Final Report”
Why did market share stall?
In by 2010 CFLs had:
•High availability
•High market awareness
•Low prices
•Significant rebate support and promotion
And yet market share stalled around 30%….
Why?
Quantifying Flicker: Fourier Filtering of Light 6
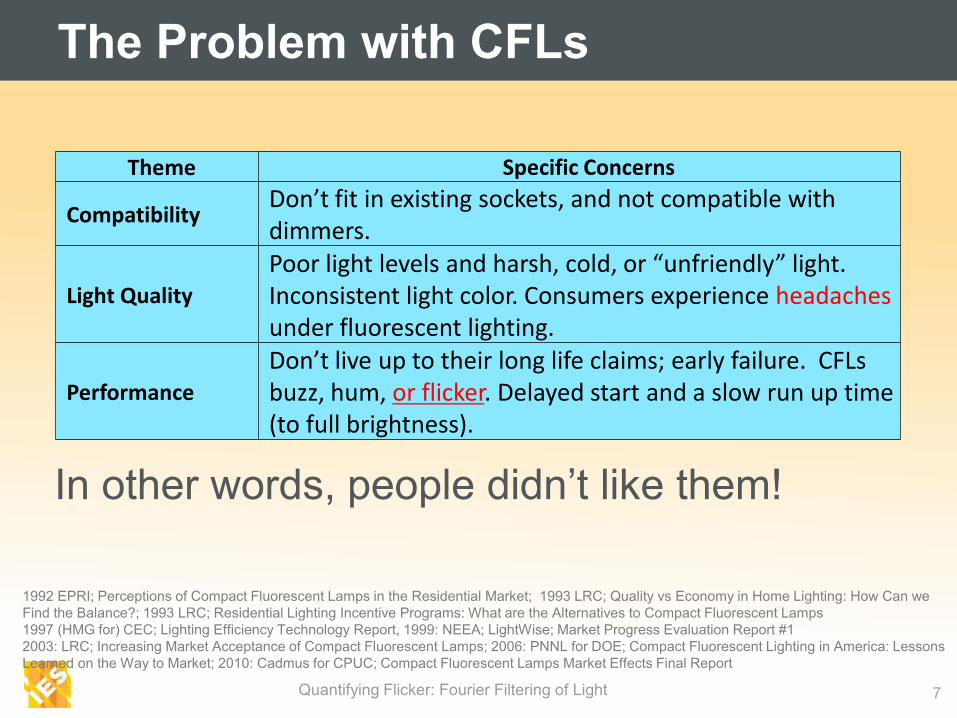
The Problem with CFLs
In other words, people didn’t like them!
1992 EPRI; Perceptions of Compact Fluorescent Lamps in the Residential Market; 1993 LRC; Quality vs Economy in Home Lighting: How Can we
Find the Balance?; 1993 LRC; Residential Lighting Incentive Programs: What are the Alternatives to Compact Fluorescent Lamps
1997 (HMG for) CEC; Lighting Efficiency Technology Report, 1999: NEEA; LightWise; Market Progress Evaluation Report #1
2003: LRC; Increasing Market Acceptance of Compact Fluorescent Lamps; 2006: PNNL for DOE; Compact Fluorescent Lighting in America: Lessons
Learned on the Way to Market; 2010: Cadmus for CPUC; Compact Fluorescent Lamps Market Effects Final Report
Theme Specific Concerns
Compatibility Don’t fit in existing sockets, and not compatible with dimmers.
Light Quality
Poor light levels and harsh, cold, or “unfriendly” light. Inconsistent light color. Consumers experience headaches under fluorescent lighting.
Performance
Don’t live up to their long life claims; early failure. CFLs buzz, hum, or flicker. Delayed start and a slow run up time (to full brightness).
Quantifying Flicker: Fourier Filtering of Light 7
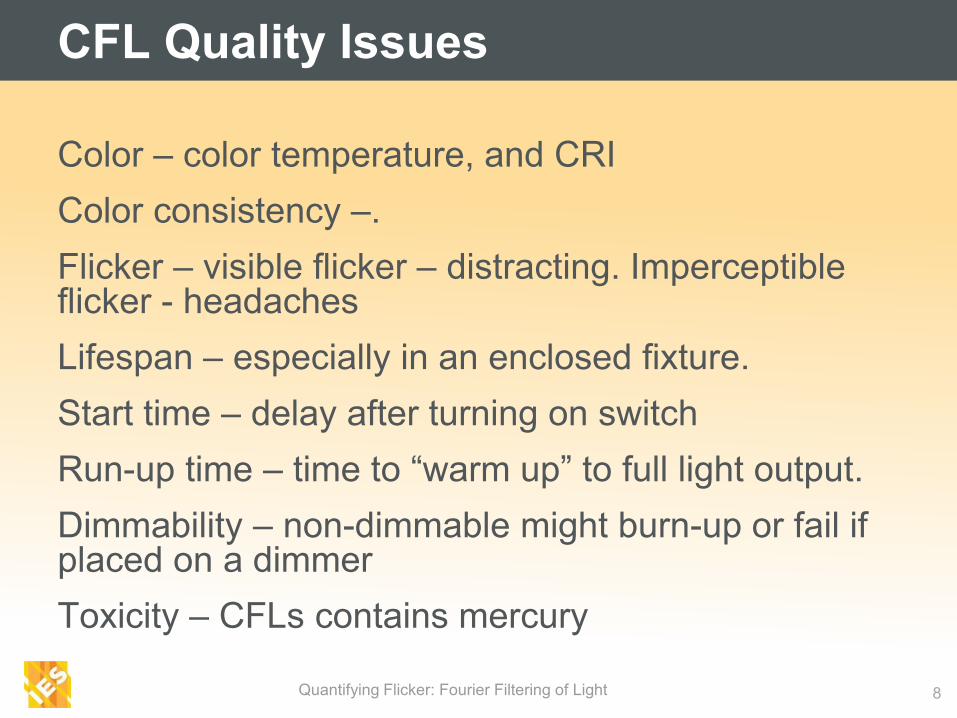
CFL Quality Issues
Color – color temperature, and CRI
Color consistency –.
Flicker – visible flicker – distracting. Imperceptible flicker - headaches
Lifespan – especially in an enclosed fixture.
Start time – delay after turning on switch
Run-up time – time to “warm up” to full light output.
Dimmability – non-dimmable might burn-up or fail if placed on a dimmer
Toxicity – CFLs contains mercury
Quantifying Flicker: Fourier Filtering of Light 8
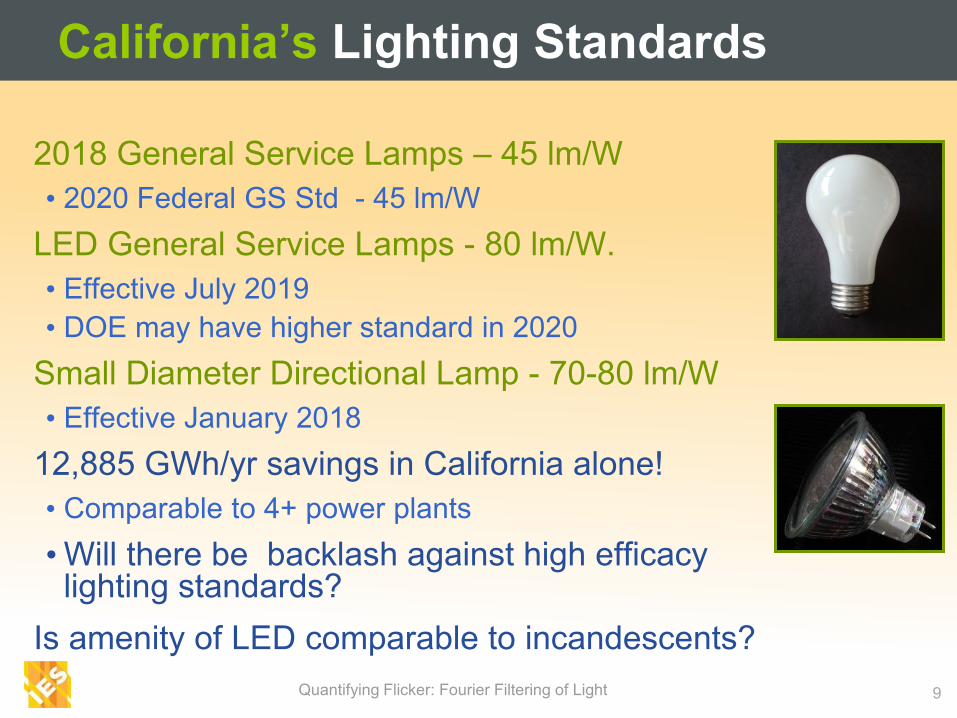
California’s Lighting Standards
2018 General Service Lamps – 45 lm/W
• 2020 Federal GS Std - 45 lm/W
LED General Service Lamps - 80 lm/W.
• Effective July 2019
• DOE may have higher standard in 2020
Small Diameter Directional Lamp - 70-80 lm/W
• Effective January 2018
12,885 GWh/yr savings in California alone!
• Comparable to 4+ power plants
•Will there be backlash against high efficacy lighting standards?
Is amenity of LED comparable to incandescents?
Quantifying Flicker: Fourier Filtering of Light 9
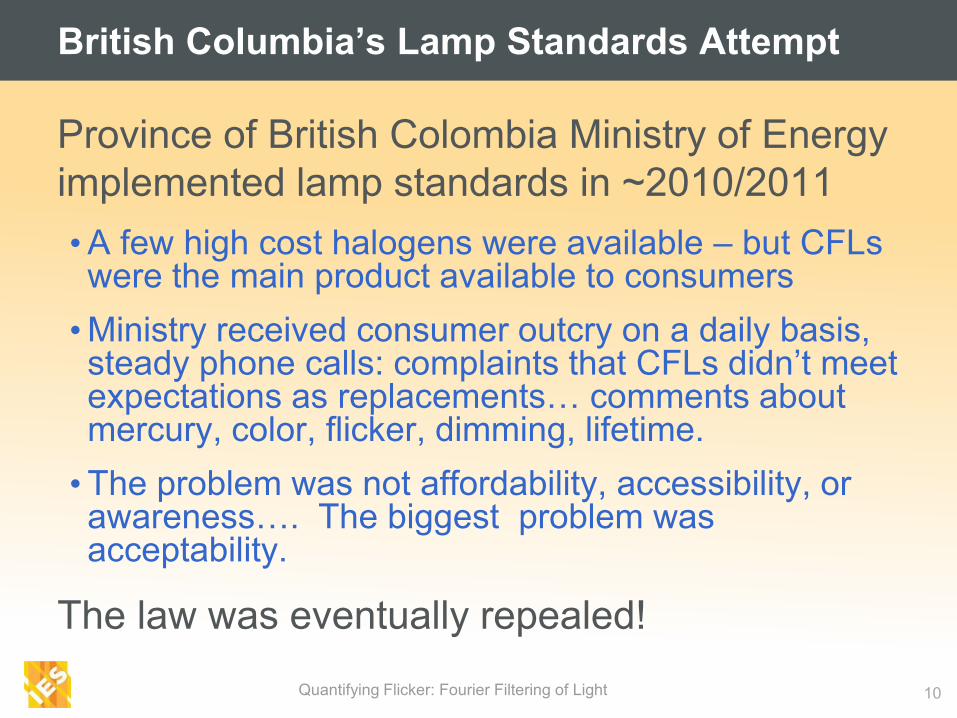
British Columbia’s Lamp Standards Attempt
Quantifying Flicker: Fourier Filtering of Light 10
Province of British Colombia Ministry of Energy
implemented lamp standards in ~2010/2011
•A few high cost halogens were available – but CFLs were the main product available to consumers
•Ministry received consumer outcry on a daily basis, steady phone calls: complaints that CFLs didn’t meet expectations as replacements… comments about mercury, color, flicker, dimming, lifetime.
•The problem was not affordability, accessibility, or awareness…. The biggest problem was acceptability.
The law was eventually repealed!
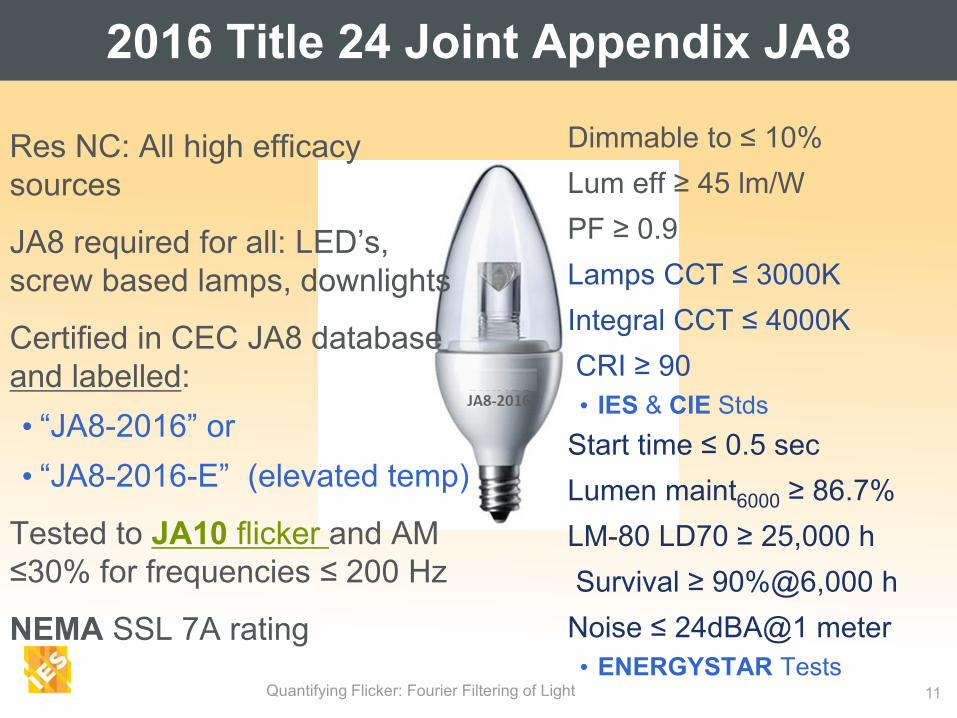
Res NC: All high efficacy
sources
JA8 required for all: LED’s,
screw based lamps, downlights
Certified in CEC JA8 database
and labelled:
• “JA8-2016” or
• “JA8-2016-E” (elevated temp)
Tested to JA10 flicker and AM
≤30% for frequencies ≤ 200 Hz
NEMA SSL 7A rating
Dimmable to ≤ 10%
Lum eff ≥ 45 lm/W
PF ≥ 0.9
Lamps CCT ≤ 3000K
Integral CCT ≤ 4000K
CRI ≥ 90
• IES & CIE Stds
Start time ≤ 0.5 sec
Lumen maint6000 ≥ 86.7%
LM-80 LD70 ≥ 25,000 h
Survival ≥ 90%@6,000 h
Noise ≤ 24dBA@1 meter
• ENERGYSTAR Tests
2016 Title 24 Joint Appendix JA8
Quantifying Flicker: Fourier Filtering of Light 11
What is Flicker?
Quantifying Flicker: Fourier Filtering of Light 12
Flicker is amplitude modulation of light at frequencies that have effects on human physiology
• Similar concept to sound and ultrasound
• At higher frequencies modulation perceived less
Perceptible flicker – can be noticed directly.
• Impacted by intensity, frequency, moving objects
• Some people more sensitive
• Flicker can trigger seizures or migraines in some people
Imperceptible flicker – impacts performance and health though not perceived
• Magnetic ballasted lighting studies: Veitch and McColl (1995), Veitch and Newsham (1998) and Wilkins et al. (1989)
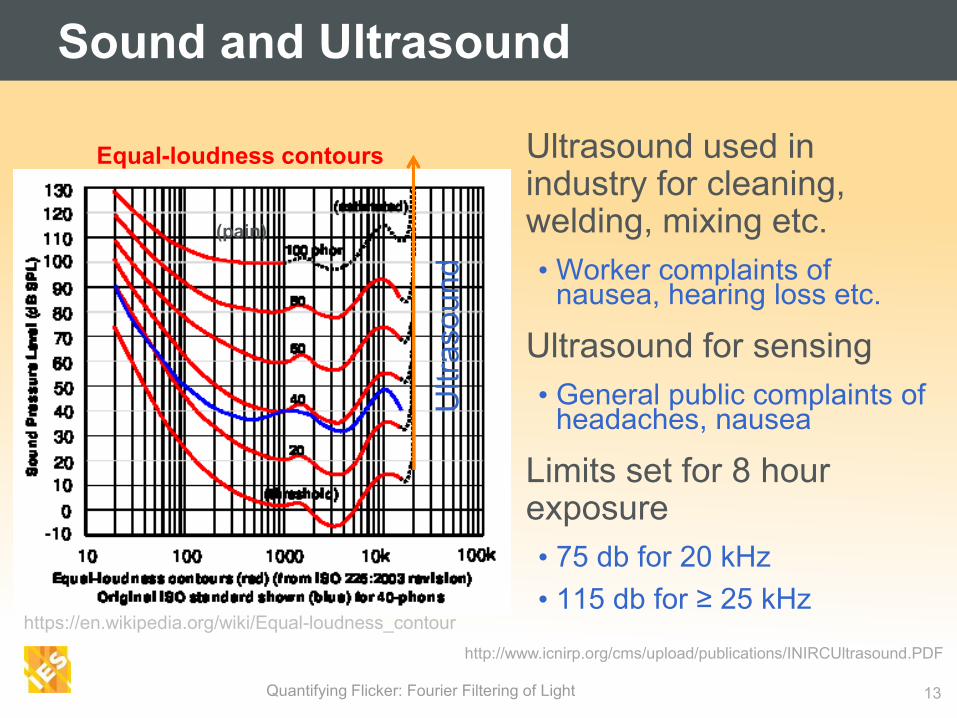
Ultrasound used in industry for cleaning, welding, mixing etc.
• Worker complaints of nausea, hearing loss etc.
Ultrasound for sensing
• General public complaints of headaches, nausea
Limits set for 8 hour exposure
• 75 db for 20 kHz
• 115 db for ≥ 25 kHz
Sound and Ultrasound
Quantifying Flicker: Fourier Filtering of Light 13
(pain)
https://en.wikipedia.org/wiki/Equal-loudness_contour
Equal-loudness contours
http://www.icnirp.org/cms/upload/publications/INIRCUltrasound.PDF
Ultra
sou
nd
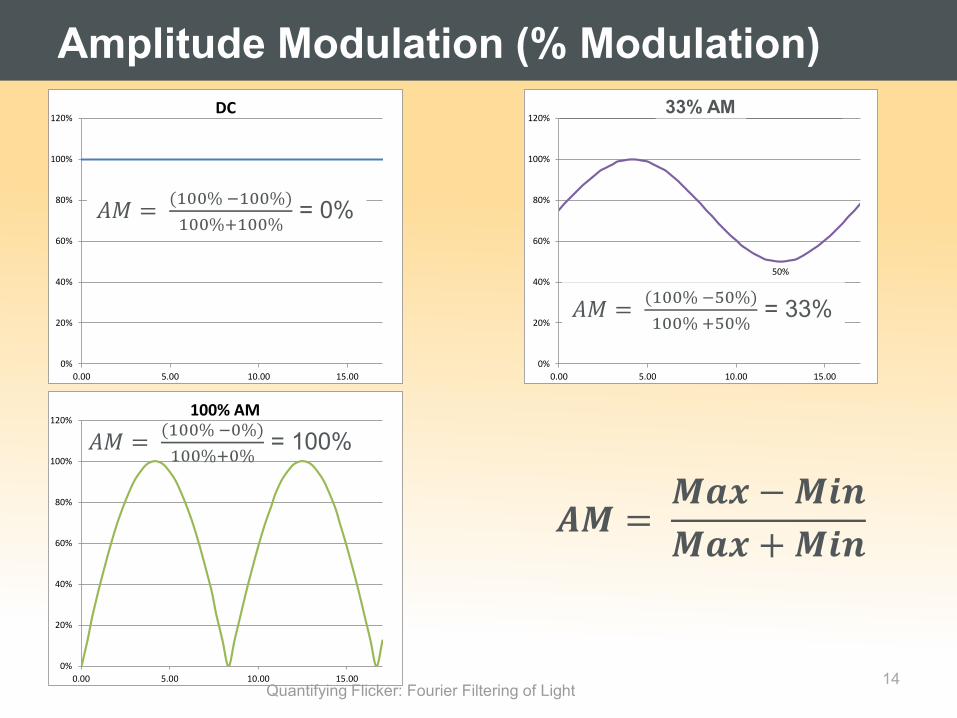
Amplitude Modulation (% Modulation)
14 0%
20%
40%
60%
80%
100%
120%
0.00 5.00 10.00 15.00
100% AM
0%
20%
40%
60%
80%
100%
120%
0.00 5.00 10.00 15.00
DC
𝐴𝑀 = (100% −100%)
100%+100% = 0%
𝐴𝑀 = (100% −0%)
100%+0% = 100%
Quantifying Flicker: Fourier Filtering of Light
𝑨𝑴 = 𝑴𝒂𝒙 − 𝑴𝒊𝒏
𝑴𝒂𝒙 + 𝑴𝒊𝒏
50%
0%
20%
40%
60%
80%
100%
120%
0.00 5.00 10.00 15.00
50% AM
𝐴𝑀 = (100% −50%)
100% +50% = 33%
33% AM
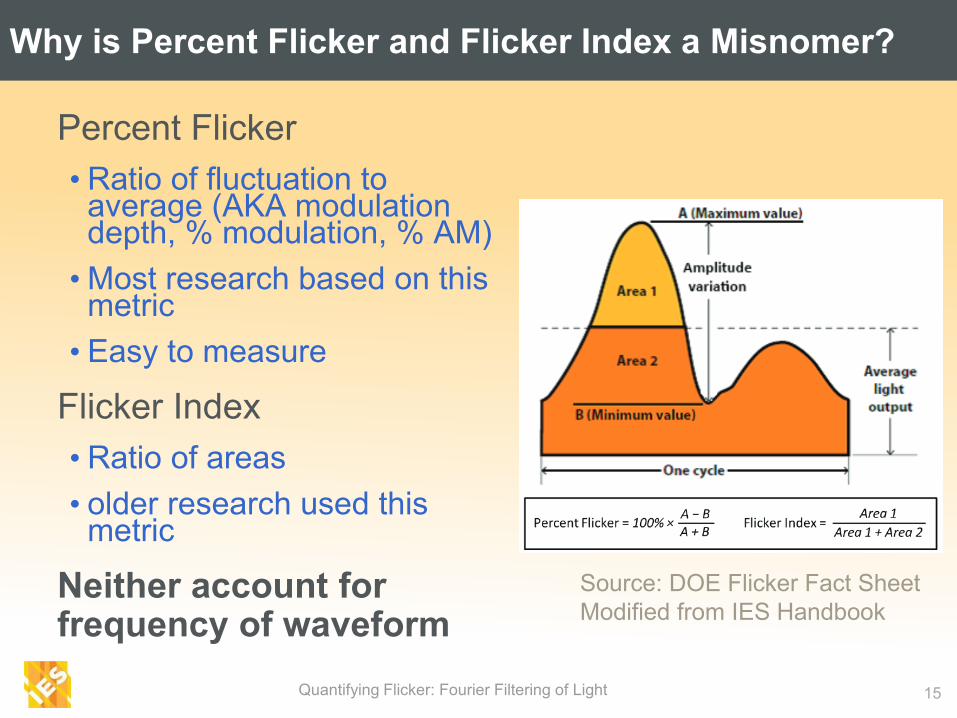
Why is Percent Flicker and Flicker Index a Misnomer?
Quantifying Flicker: Fourier Filtering of Light 15
Percent Flicker
• Ratio of fluctuation to average (AKA modulation depth, % modulation, % AM)
• Most research based on this metric
• Easy to measure
Flicker Index
• Ratio of areas
• older research used this metric
Neither account for frequency of waveform
Source: DOE Flicker Fact Sheet
Modified from IES Handbook
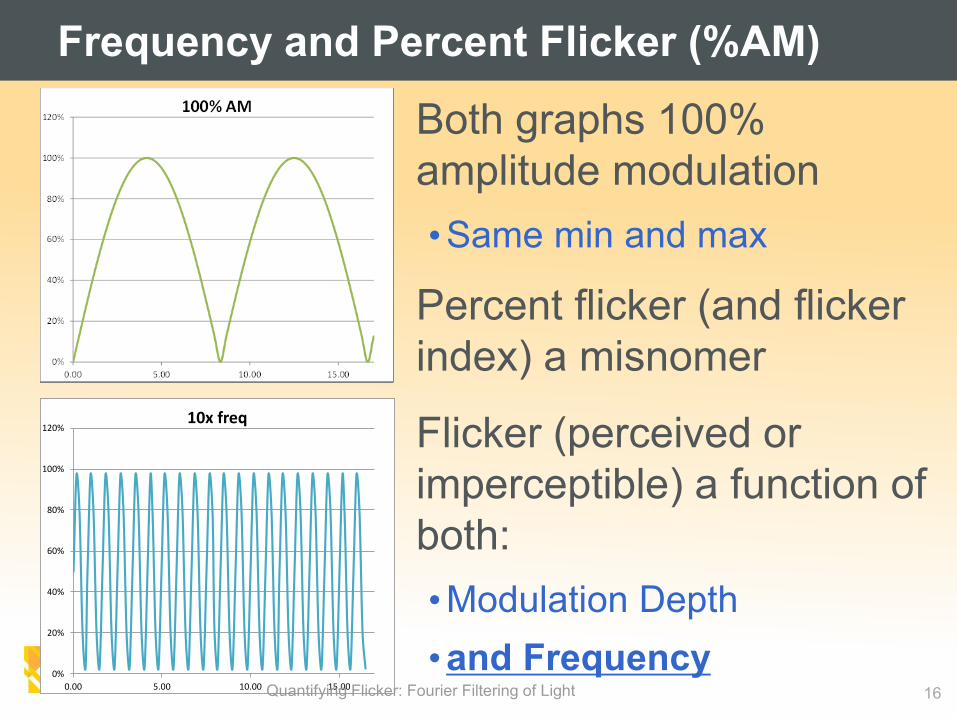
Both graphs 100%
amplitude modulation
•Same min and max
Percent flicker (and flicker
index) a misnomer
Flicker (perceived or
imperceptible) a function of
both:
•Modulation Depth
•and Frequency
Frequency and Percent Flicker (%AM)
16
0%
20%
40%
60%
80%
100%
120%
0.00 5.00 10.00 15.00
10x freq
Quantifying Flicker: Fourier Filtering of Light
17
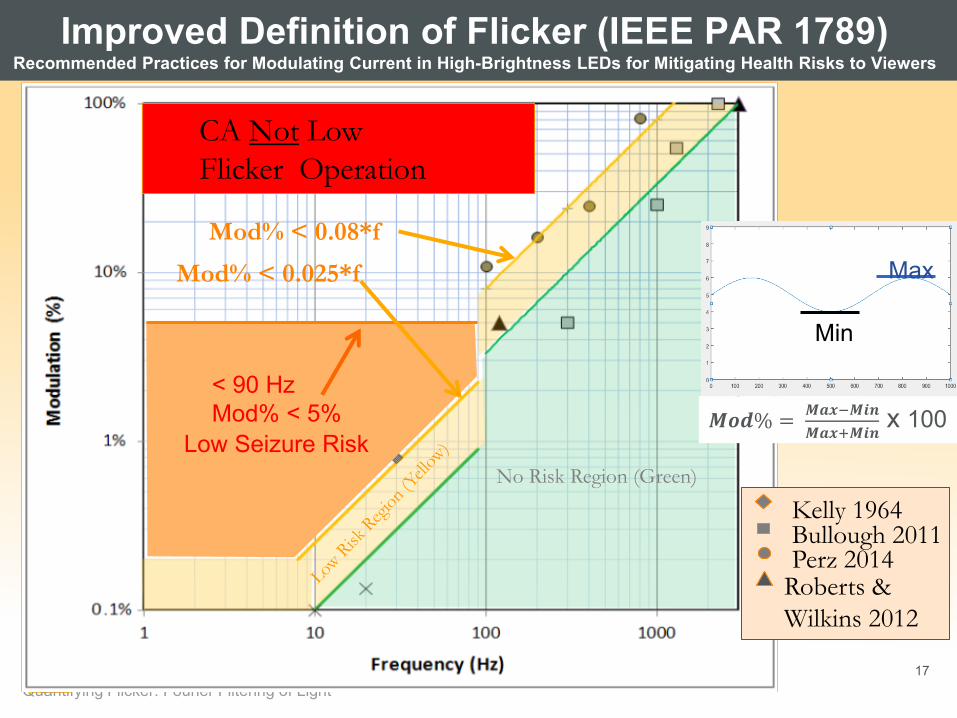
Improved Definition of Flicker (IEEE PAR 1789) Recommended Practices for Modulating Current in High-Brightness LEDs for Mitigating Health Risks to Viewers
Quantifying Flicker: Fourier Filtering of Light
Mod% < 0.025*f
Mod% < 0.08*f
No Risk Region (Green)
Kelly 1964 Bullough 2011 Perz 2014
Roberts &
Wilkins 2012
CA Not Low
Flicker Operation
Max
Min
𝑴𝒐𝒅% = 𝑴𝒂𝒙−𝑴𝒊𝒏
𝑴𝒂𝒙+𝑴𝒊𝒏 x 100
Low Seizure Risk
< 90 Hz
Mod% < 5%
18
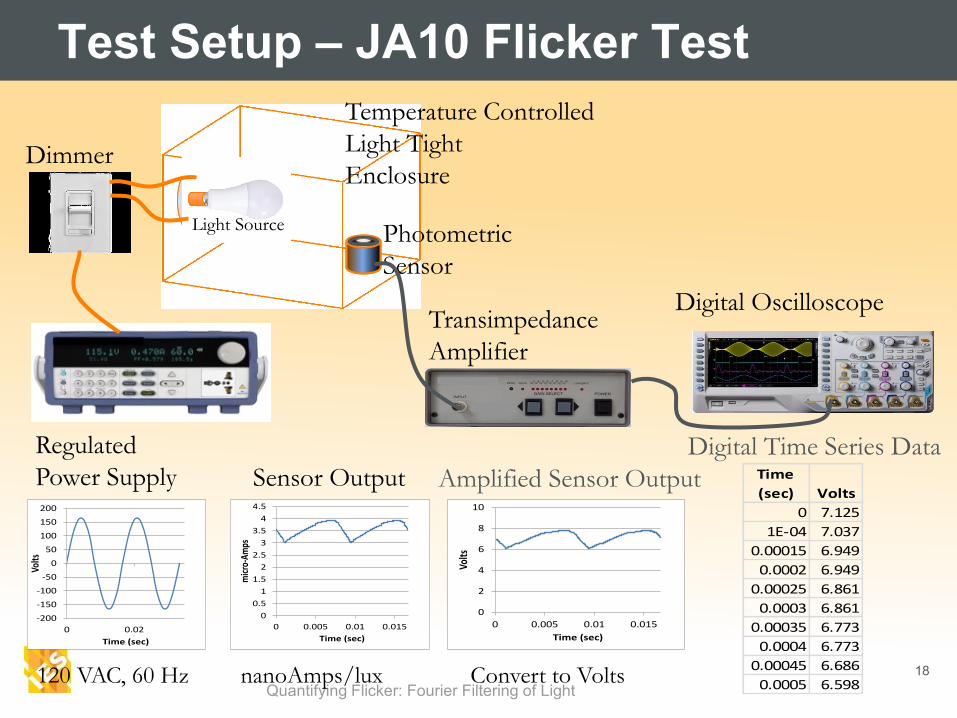
Test Setup – JA10 Flicker Test
Quantifying Flicker: Fourier Filtering of Light
Temperature Controlled
Light Tight
Enclosure
Regulated
Power Supply
Light Source
Dimmer
-200
-150
-100
-50
0
50
100
150
200
0 0.02
Volts
Time (sec)
Photometric
Sensor
0
0.5
1
1.5
2
2.5
3
3.5
4
4.5
0 0.005 0.01 0.015
mic
ro-A
mps
Time (sec)
Sensor Output
120 VAC, 60 Hz nanoAmps/lux Convert to Volts
Digital Oscilloscope
Time
(sec) Volts
0 7.125
1E-04 7.037
0.00015 6.949
0.0002 6.949
0.00025 6.861
0.0003 6.861
0.00035 6.773
0.0004 6.773
0.00045 6.686
0.0005 6.598
Digital Time Series Data
Transimpedance
Amplifier
0
2
4
6
8
10
0 0.005 0.01 0.015
Volts
Time (sec)
Amplified Sensor Output
19
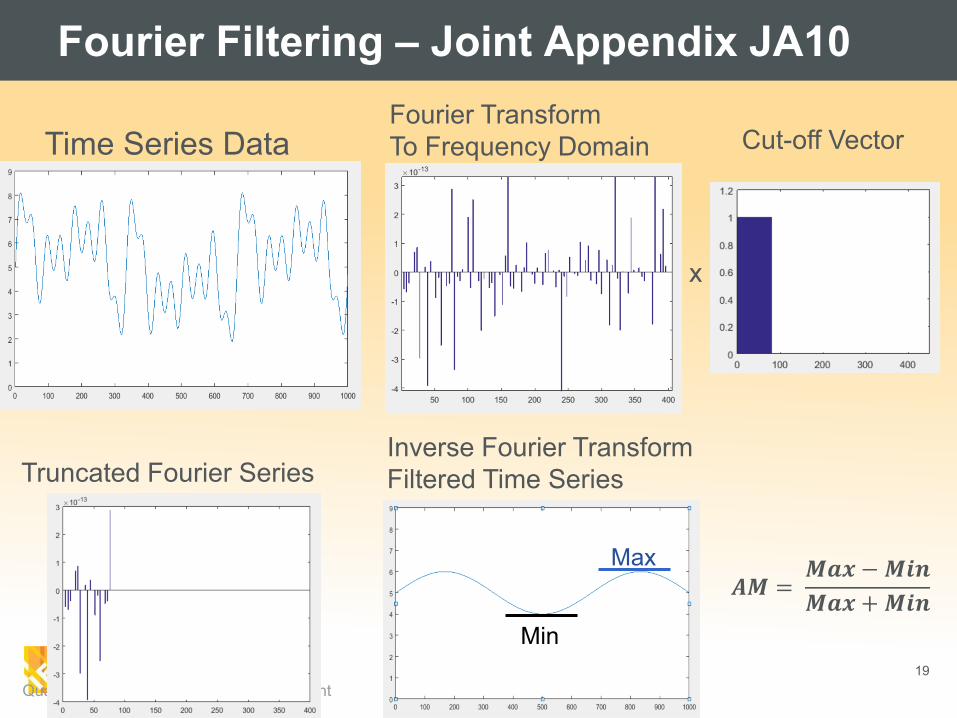
Fourier Filtering – Joint Appendix JA10
Quantifying Flicker: Fourier Filtering of Light
Time Series Data Fourier Transform
To Frequency Domain
x
Truncated Fourier Series
Cut-off Vector
Max
Min
Inverse Fourier Transform
Filtered Time Series
𝑨𝑴 = 𝑴𝒂𝒙 − 𝑴𝒊𝒏
𝑴𝒂𝒙 + 𝑴𝒊𝒏
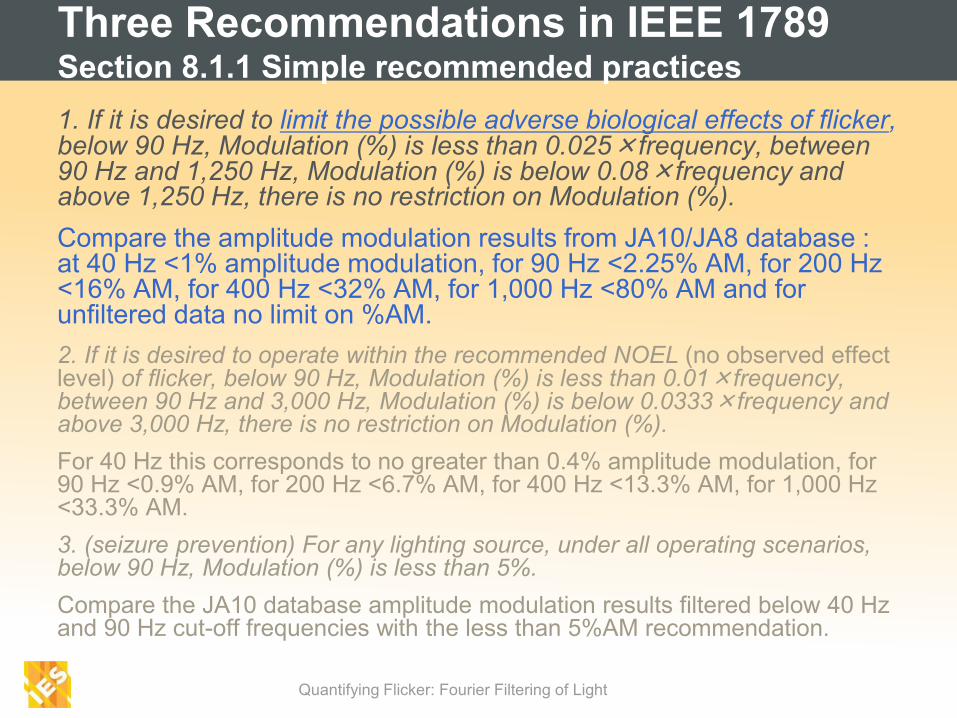
Three Recommendations in IEEE 1789 Section 8.1.1 Simple recommended practices
Quantifying Flicker: Fourier Filtering of Light
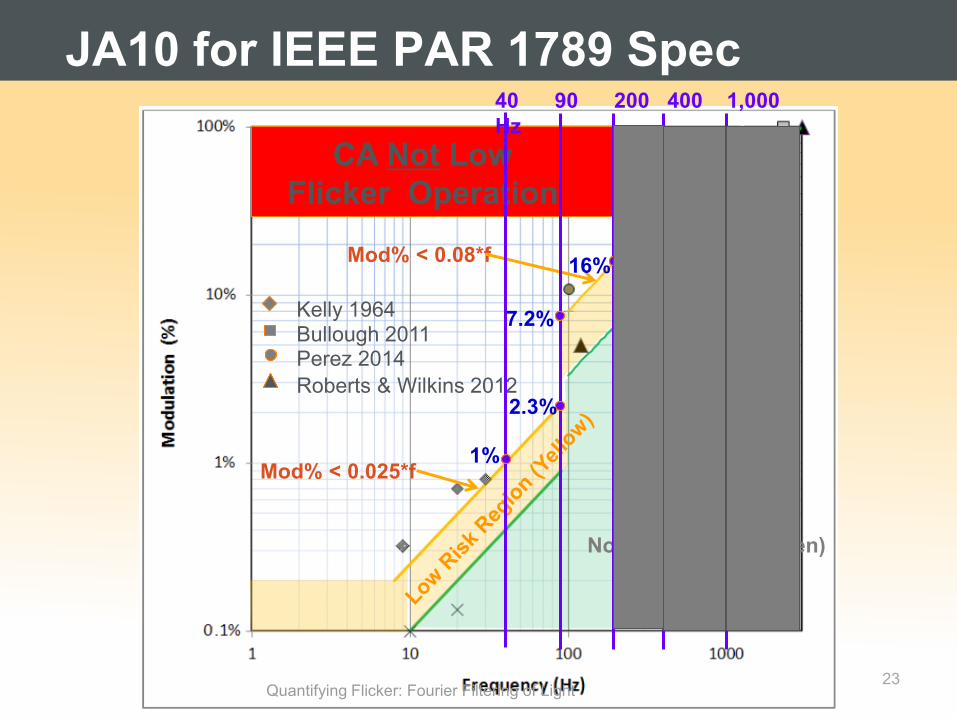
1. If it is desired to limit the possible adverse biological effects of flicker, below 90 Hz, Modulation (%) is less than 0.025×frequency, between 90 Hz and 1,250 Hz, Modulation (%) is below 0.08×frequency and above 1,250 Hz, there is no restriction on Modulation (%).
Compare the amplitude modulation results from JA10/JA8 database : at 40 Hz <1% amplitude modulation, for 90 Hz <2.25% AM, for 200 Hz <16% AM, for 400 Hz <32% AM, for 1,000 Hz <80% AM and for unfiltered data no limit on %AM.
2. If it is desired to operate within the recommended NOEL (no observed effect level) of flicker, below 90 Hz, Modulation (%) is less than 0.01×frequency, between 90 Hz and 3,000 Hz, Modulation (%) is below 0.0333×frequency and above 3,000 Hz, there is no restriction on Modulation (%).
For 40 Hz this corresponds to no greater than 0.4% amplitude modulation, for 90 Hz <0.9% AM, for 200 Hz <6.7% AM, for 400 Hz <13.3% AM, for 1,000 Hz <33.3% AM.
3. (seizure prevention) For any lighting source, under all operating scenarios, below 90 Hz, Modulation (%) is less than 5%.
Compare the JA10 database amplitude modulation results filtered below 40 Hz and 90 Hz cut-off frequencies with the less than 5%AM recommendation.
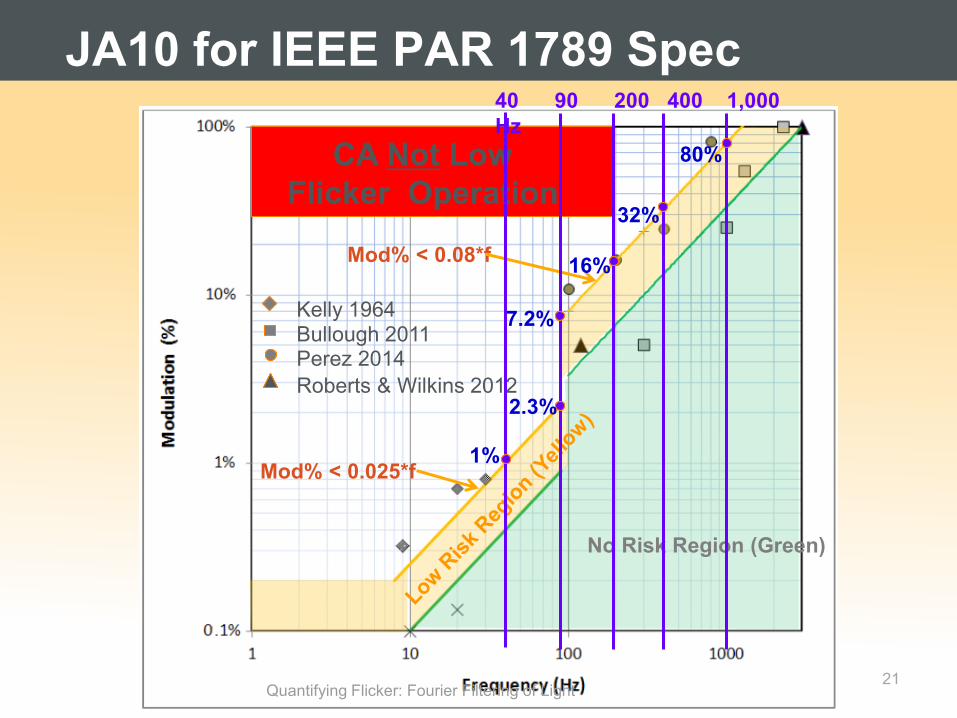
JA10 for IEEE PAR 1789 Spec
Mod% < 0.025*f
Mod% < 0.08*f
No Risk Region (Green)
CA Not Low
Flicker Operation
Kelly 1964 Bullough 2011 Perez 2014
Roberts & Wilkins 2012
40 90 200 400 1,000
Hz
1%
7.2%
16%
32%
80%
2.3%
21 Quantifying Flicker: Fourier Filtering of Light
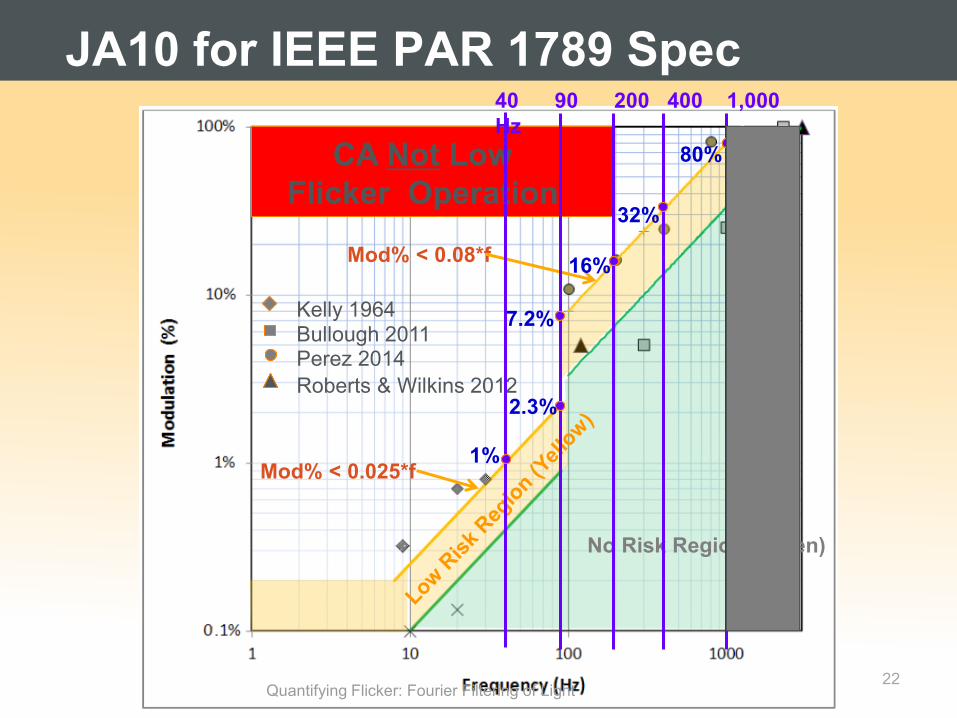
JA10 for IEEE PAR 1789 Spec
Mod% < 0.025*f
Mod% < 0.08*f
No Risk Region (Green)
CA Not Low
Flicker Operation
Kelly 1964 Bullough 2011 Perez 2014
Roberts & Wilkins 2012
40 90 200 400 1,000
Hz
1%
7.2%
16%
32%
80%
2.3%
22 Quantifying Flicker: Fourier Filtering of Light
JA10 for IEEE PAR 1789 Spec
Mod% < 0.025*f
Mod% < 0.08*f
No Risk Region (Green)
CA Not Low
Flicker Operation
Kelly 1964 Bullough 2011 Perez 2014
Roberts & Wilkins 2012
40 90 200 400 1,000
Hz
1%
7.2%
16%
32%
80%
2.3%
23 Quantifying Flicker: Fourier Filtering of Light
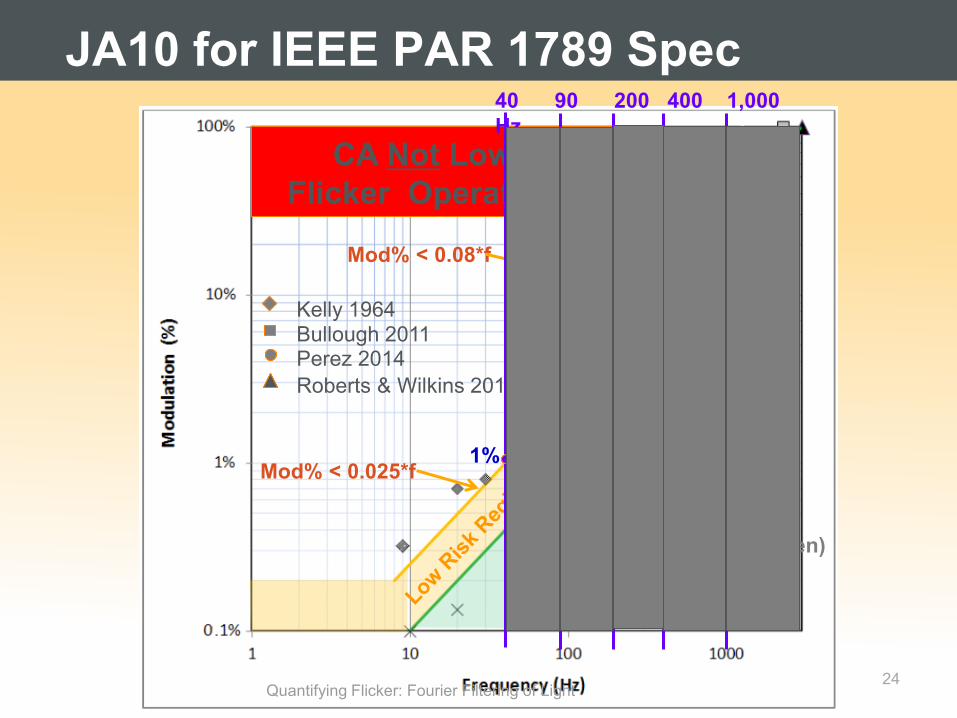
JA10 for IEEE PAR 1789 Spec
Mod% < 0.025*f
Mod% < 0.08*f
No Risk Region (Green)
CA Not Low
Flicker Operation
Kelly 1964 Bullough 2011 Perez 2014
Roberts & Wilkins 2012
40 90 200 400 1,000
Hz
1%
7.2%
16%
32%
80%
2.3%
24 Quantifying Flicker: Fourier Filtering of Light
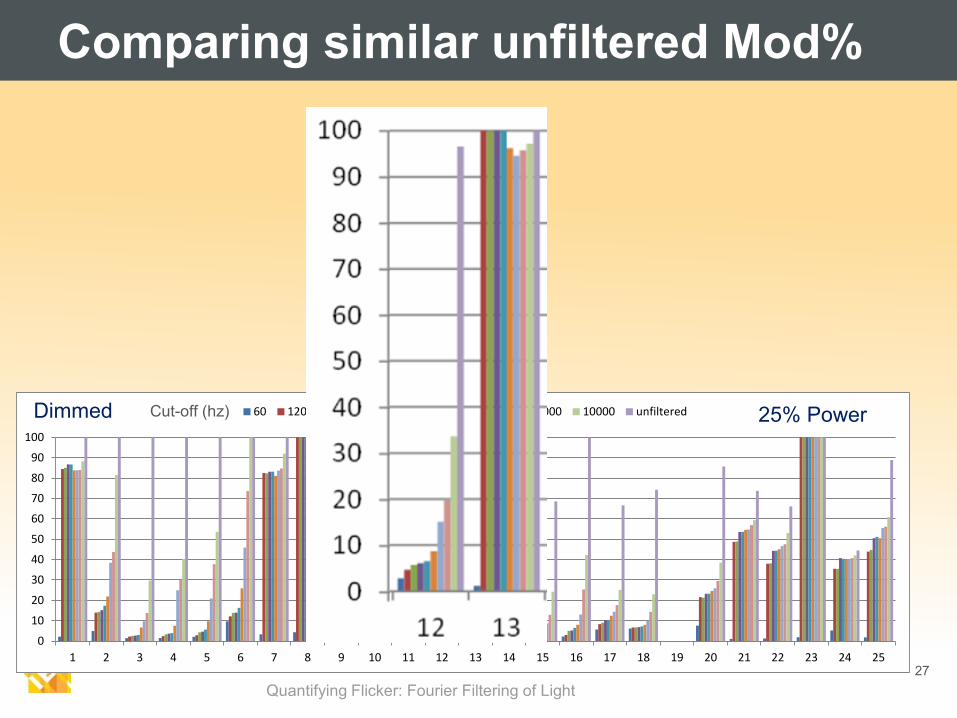
Flicker Tests of 25 LED A-lamps (2013)
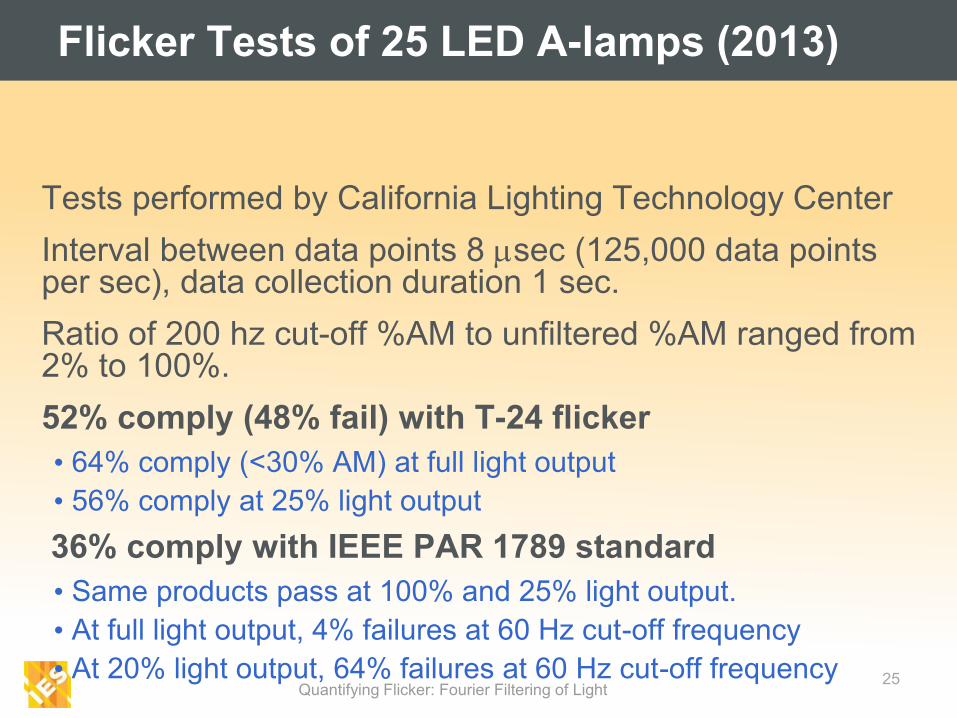
Tests performed by California Lighting Technology Center
Interval between data points 8 sec (125,000 data points per sec), data collection duration 1 sec.
Ratio of 200 hz cut-off %AM to unfiltered %AM ranged from 2% to 100%.
52% comply (48% fail) with T-24 flicker
• 64% comply (<30% AM) at full light output
• 56% comply at 25% light output
36% comply with IEEE PAR 1789 standard
• Same products pass at 100% and 25% light output.
• At full light output, 4% failures at 60 Hz cut-off frequency
• At 20% light output, 64% failures at 60 Hz cut-off frequency 25 Quantifying Flicker: Fourier Filtering of Light
26
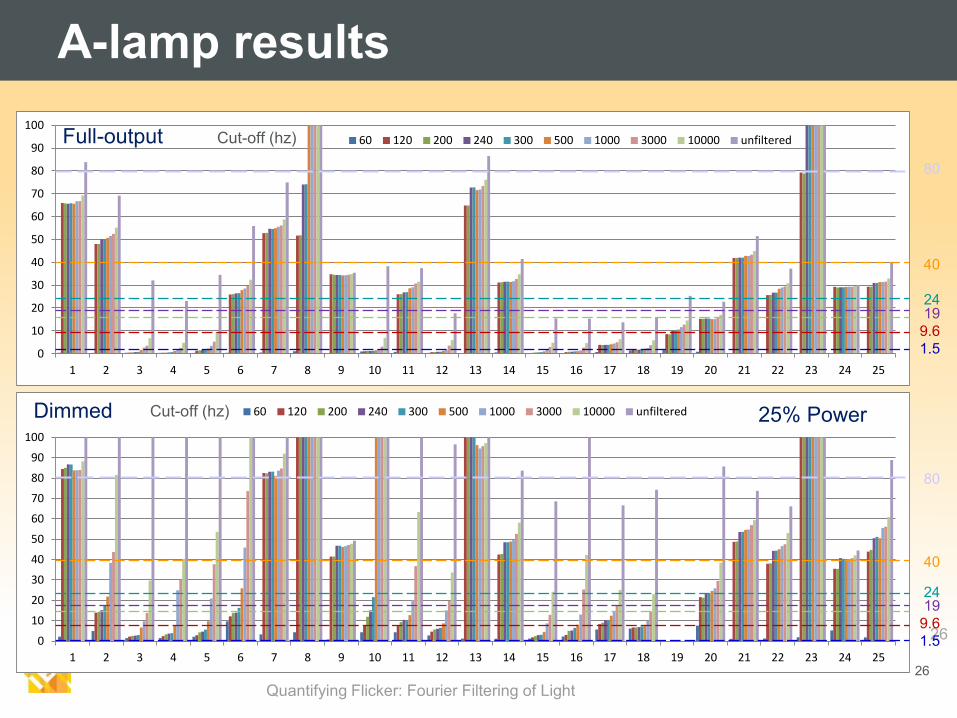
A-lamp results
Quantifying Flicker: Fourier Filtering of Light
26
0
10
20
30
40
50
60
70
80
90
100
1 2 3 4 5 6 7 8 9 10 11 12 13 14 15 16 17 18 19 20 21 22 23 24 25
60 120 200 240 300 500 1000 3000 10000 unfiltered
0
10
20
30
40
50
60
70
80
90
100
1 2 3 4 5 6 7 8 9 10 11 12 13 14 15 16 17 18 19 20 21 22 23 24 25
60 120 200 240 300 500 1000 3000 10000 unfiltered
80
40
24
80
40
24
19
9.6
1.5
19
9.6
1.5
Cut-off (hz)
Cut-off (hz)
Full-output
25% Power Dimmed
27
Comparing similar unfiltered Mod%
Quantifying Flicker: Fourier Filtering of Light
0
10
20
30
40
50
60
70
80
90
100
1 2 3 4 5 6 7 8 9 10 11 12 13 14 15 16 17 18 19 20 21 22 23 24 25
60 120 200 240 300 500 1000 3000 10000 unfilteredCut-off (hz) 25% Power Dimmed
28
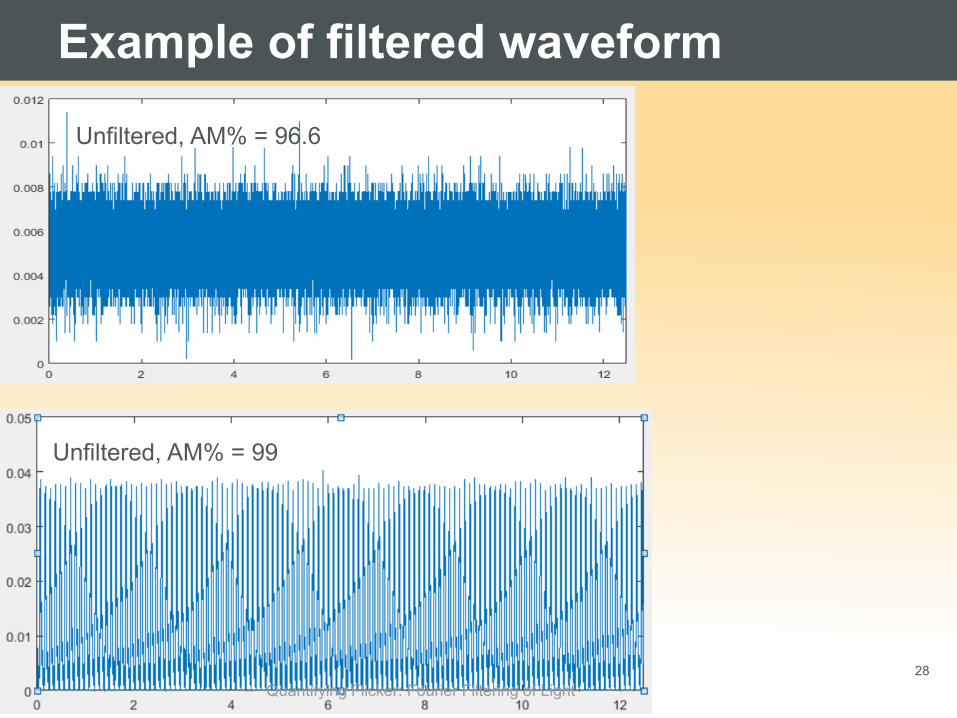
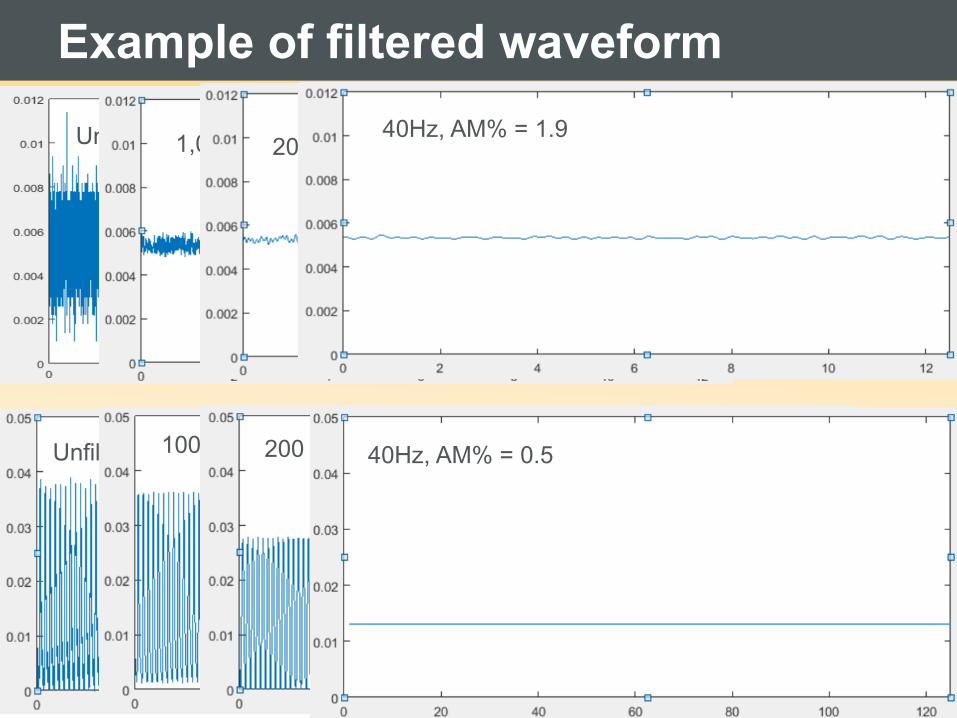
Unfiltered, AM% = 96.6
Unfiltered, AM% = 99
Example of filtered waveform
Quantifying Flicker: Fourier Filtering of Light
29
Unfiltered, AM% = 96.6
Unfiltered, AM% = 99
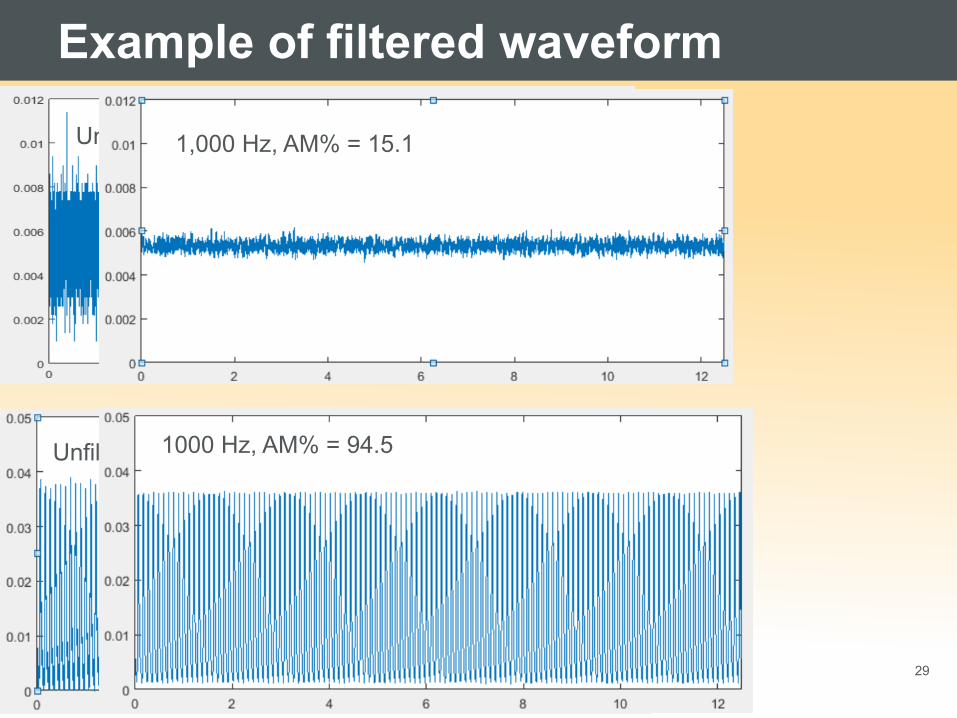
Example of filtered waveform
Quantifying Flicker: Fourier Filtering of Light
1,000 Hz, AM% = 15.1
1000 Hz, AM% = 94.5
30
Unfiltered, AM% = 96.6
Unfiltered, AM% = 99
Example of filtered waveform
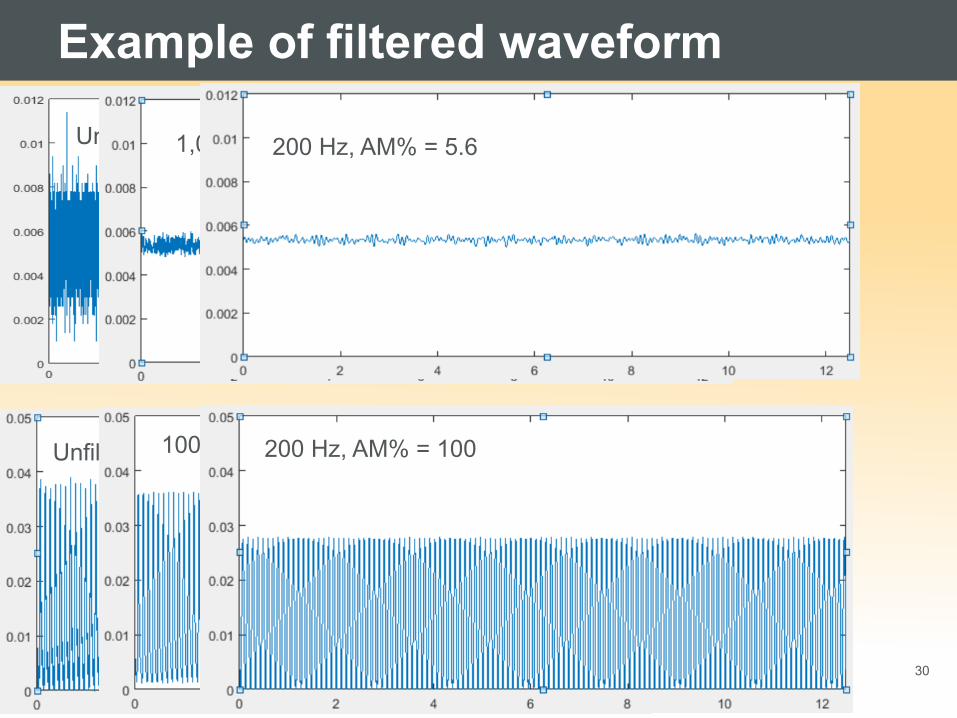
Quantifying Flicker: Fourier Filtering of Light
1,000 Hz, AM% = 15.1
1000 Hz, AM% = 94.5
200 Hz, AM% = 5.6
200 Hz, AM% = 100
31
Unfiltered, AM% = 96.6
Unfiltered, AM% = 99
Example of filtered waveform
Quantifying Flicker: Fourier Filtering of Light
1,000 Hz, AM% = 15.1
1000 Hz, AM% = 94.5
200 Hz, AM% = 5.6
200 Hz, AM% = 100
40 Hz, AM% = 1.9 40Hz, AM% = 1.9
40Hz, AM% = 0.5
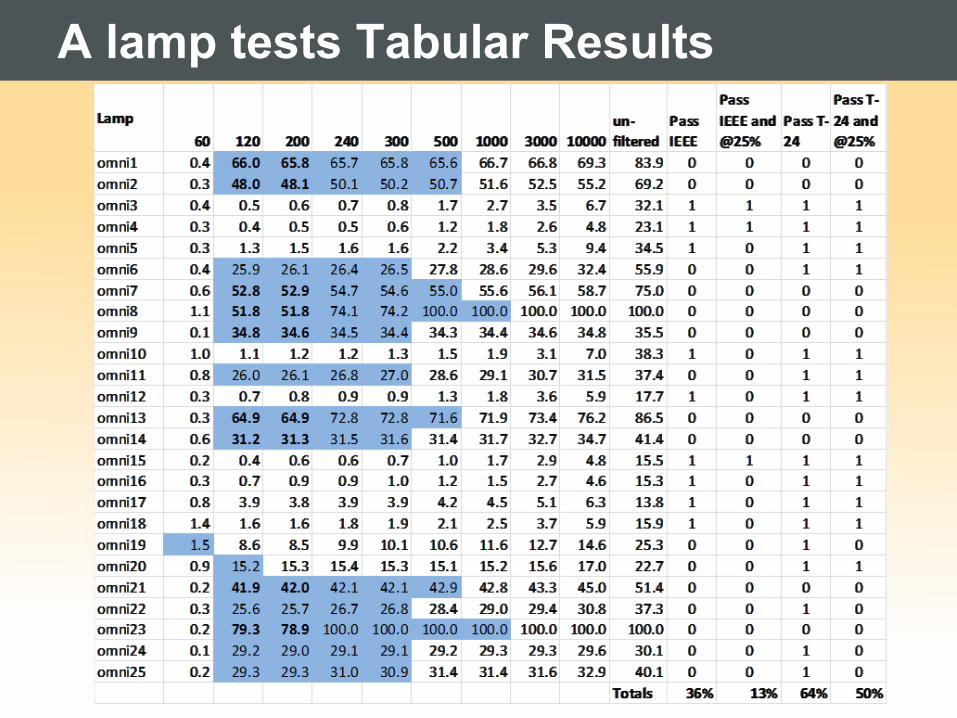
A lamp tests Tabular Results
Quantifying Flicker: Fourier Filtering of Light
33
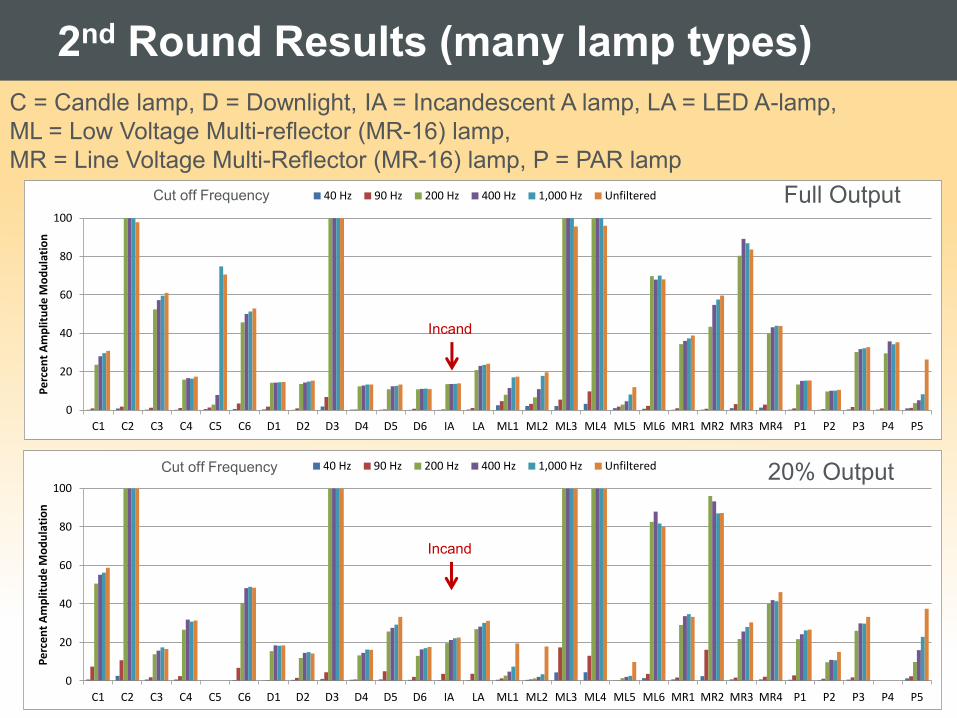
2nd Round Results (many lamp types)
Quantifying Flicker: Fourier Filtering of Light
0
20
40
60
80
100
C1 C2 C3 C4 C5 C6 D1 D2 D3 D4 D5 D6 IA LA ML1 ML2 ML3 ML4 ML5 ML6 MR1 MR2 MR3 MR4 P1 P2 P3 P4 P5
Pe
rce
nt
Am
plit
ud
e M
od
ula
tio
n
40 Hz 90 Hz 200 Hz 400 Hz 1,000 Hz Unfiltered Full Output Cut off Frequency
Incand
0
20
40
60
80
100
C1 C2 C3 C4 C5 C6 D1 D2 D3 D4 D5 D6 IA LA ML1 ML2 ML3 ML4 ML5 ML6 MR1 MR2 MR3 MR4 P1 P2 P3 P4 P5
Pe
rce
nt
Am
plit
ud
e M
od
ula
tio
n
40 Hz 90 Hz 200 Hz 400 Hz 1,000 Hz Unfiltered 20% Output Cut off Frequency
Incand
C = Candle lamp, D = Downlight, IA = Incandescent A lamp, LA = LED A-lamp,
ML = Low Voltage Multi-reflector (MR-16) lamp,
MR = Line Voltage Multi-Reflector (MR-16) lamp, P = PAR lamp
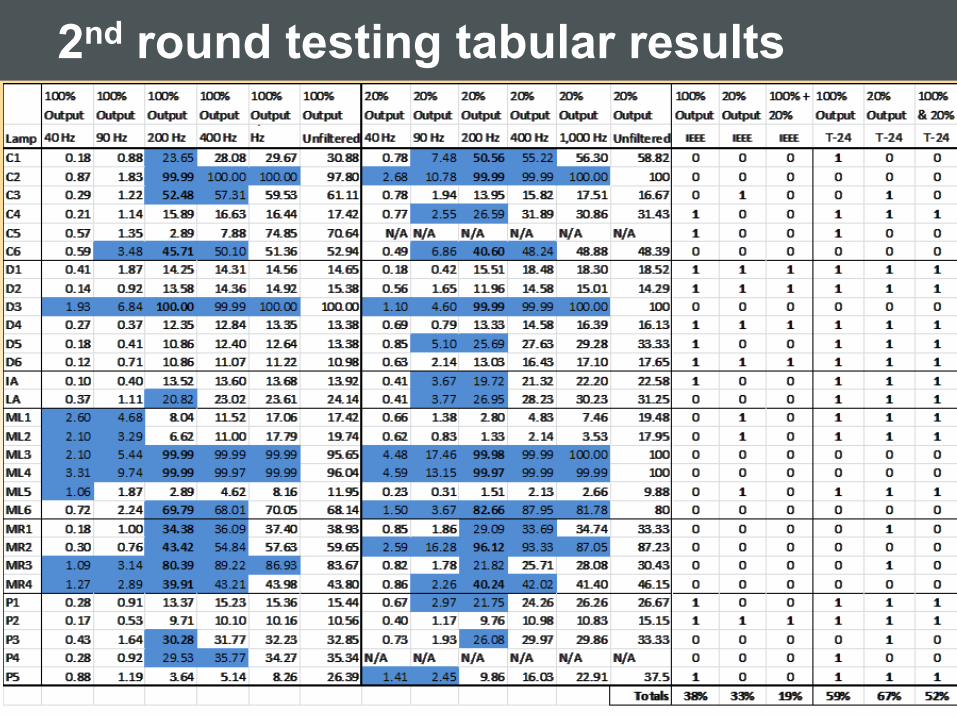
2nd round testing tabular results
Quantifying Flicker: Fourier Filtering of Light
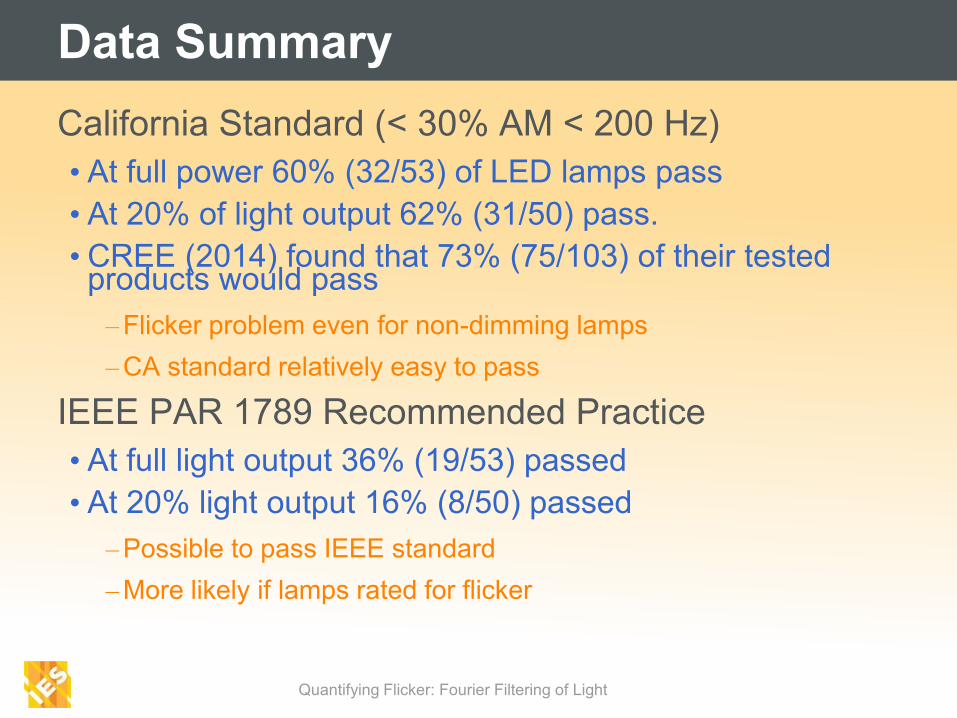
Data Summary
Quantifying Flicker: Fourier Filtering of Light
California Standard (< 30% AM < 200 Hz)
• At full power 60% (32/53) of LED lamps pass
• At 20% of light output 62% (31/50) pass.
• CREE (2014) found that 73% (75/103) of their tested products would pass
–Flicker problem even for non-dimming lamps
–CA standard relatively easy to pass
IEEE PAR 1789 Recommended Practice
• At full light output 36% (19/53) passed
• At 20% light output 16% (8/50) passed
–Possible to pass IEEE standard
–More likely if lamps rated for flicker
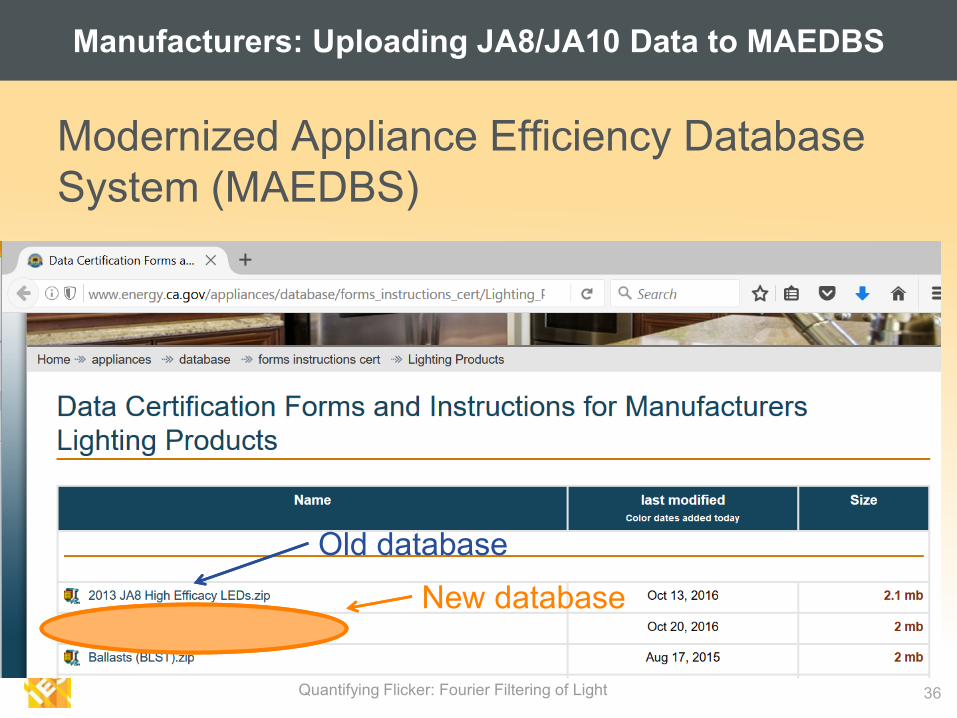
Manufacturers: Uploading JA8/JA10 Data to MAEDBS
Quantifying Flicker: Fourier Filtering of Light 36
Modernized Appliance Efficiency Database
System (MAEDBS)
Old database
New database
37
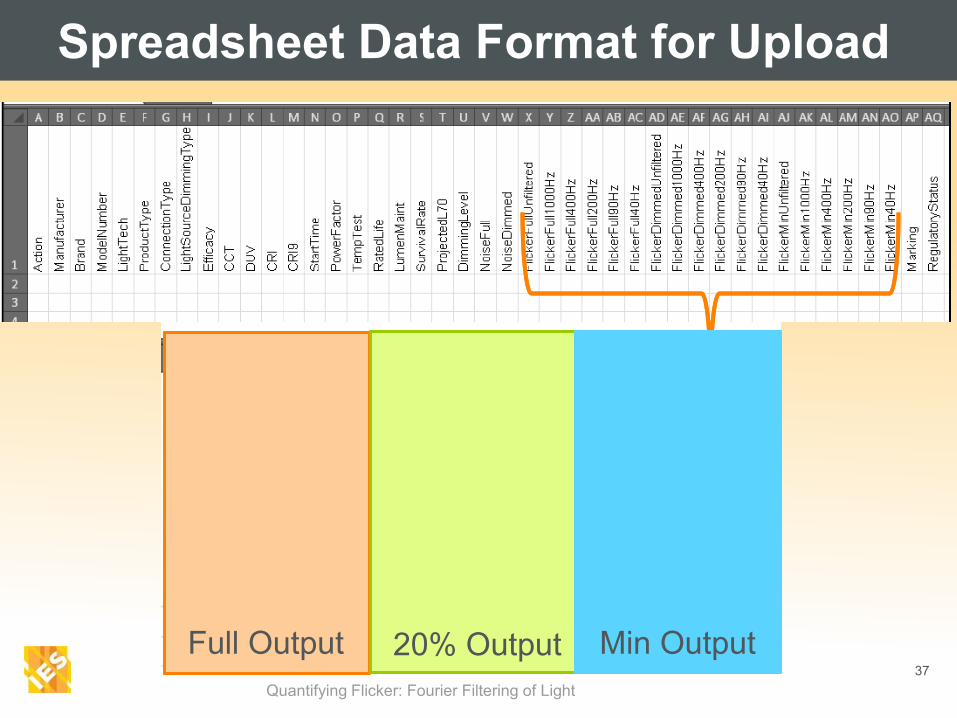
Spreadsheet Data Format for Upload
Quantifying Flicker: Fourier Filtering of Light
Min Output 20% Output Full Output
38
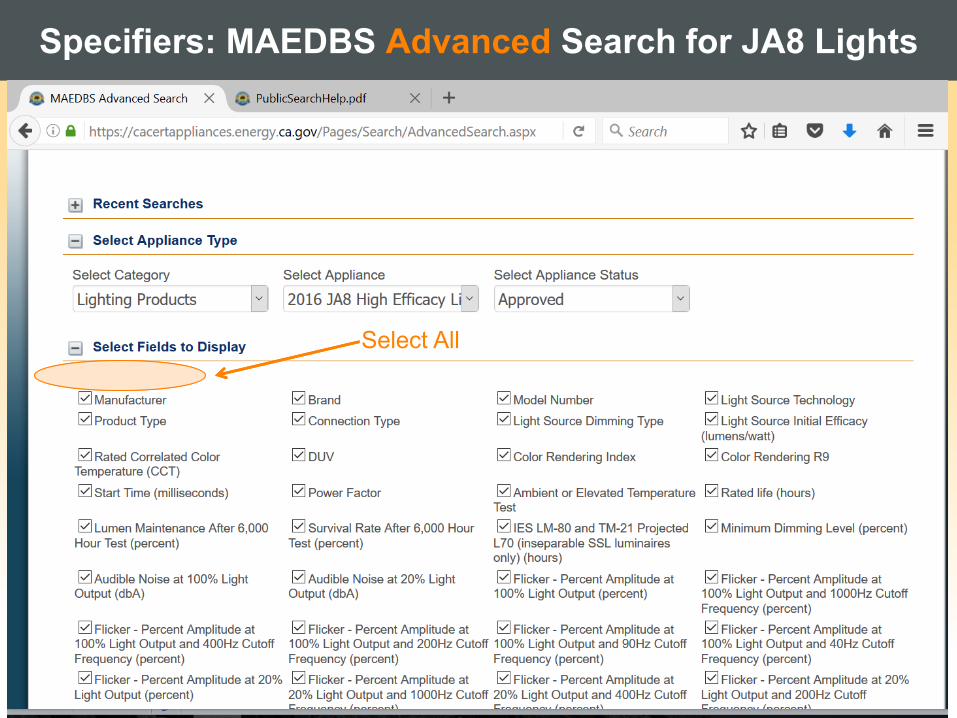
Specifiers: MAEDBS Advanced Search for JA8 Lights
Quantifying Flicker: Fourier Filtering of Light 38
Select All
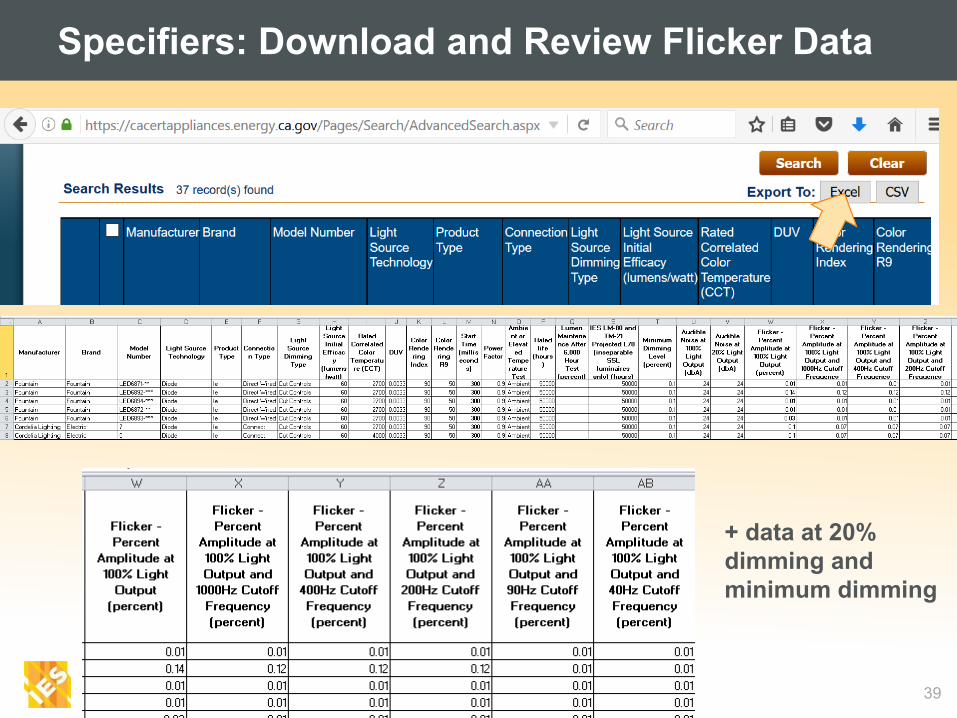
Specifiers: Download and Review Flicker Data
Quantifying Flicker: Fourier Filtering of Light
+ data at 20%
dimming and
minimum dimming
39
Summary
Quantifying Flicker: Fourier Filtering of Light 40
Physiological flicker broader scope than TLA
•Perceptible flicker (TLA) and …
• Imperceptible flicker with impact on health and performance
• IEEE PAR 1789 captures both effects of flicker
Flicker is an important metric of lighting quality
•A function of modulation depth and frequency
Fourier analysis can provide repeatable decomposition of signal into different frequencies that can be weighted or filtered to better reflect physiological response.
Flicker and Lighting Market
Quantifying Flicker: Fourier Filtering of Light 41
Some really good LED products
• Less flicker than incandescent!
Some really high flicker LED products
• 100% AM at 120 Hz!
• Poorly performing products could poison the market for LEDs and make for unhappy clients
Market transformation tools:
• Minimum flicker standards (i.e. T-24 and T-20)
• Recommended practice: i.e. IEEE PAR 1789
• Information: JA8 database,
• More information: ENERGYSTAR, DLC, CEE – test and list requirement.
Acknowledgements
This work was supported by the California Statewide IOU Codes & Standards program
• Pat Eilert, Program Manager
Project management provided by Mike McGaraghan Dan Young and Bryan Boyce, Energy Solutions
California Lighting Technology Center, UL and ITL providing high quality lighting measurements.
Michael Poplawski, Pacific Northwest Laboratory great technical resource and round robin participant
California Energy Commission and all other reviewers of the 2016 Title 24 residential lighting proposal and JA10
42 Quantifying Flicker: Fourier Filtering of Light