Embed Size (px)
Citation preview
Quantifying excess fuel
consumption for pavement
design and maintenance
decisions
Mehdi Akbarian, Arghavan Louhghalam,
Jeremy Gregory, Franz-Josef Ulm
Pavement LCA 2017
April 12, 2017
Slide 2
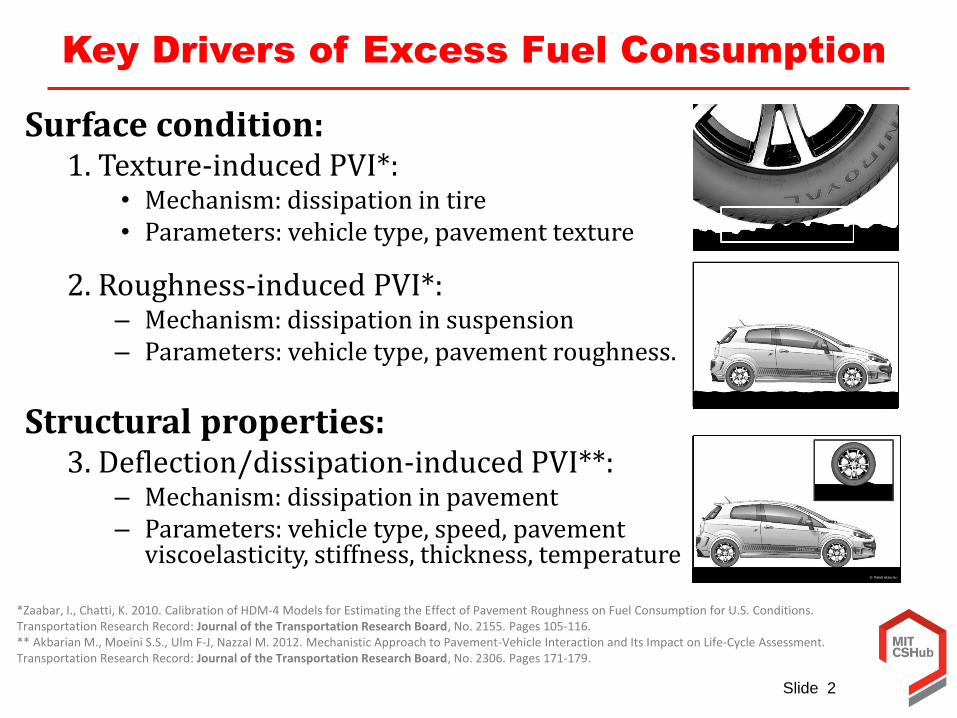
Key Drivers of Excess Fuel Consumption
Surface condition:1. Texture-induced PVI*:
• Mechanism: dissipation in tire• Parameters: vehicle type, pavement texture
2. Roughness-induced PVI*: – Mechanism: dissipation in suspension– Parameters: vehicle type, pavement roughness.
Structural properties:3. Deflection/dissipation-induced PVI**:
– Mechanism: dissipation in pavement– Parameters: vehicle type, speed, pavement
viscoelasticity, stiffness, thickness, temperature
*Zaabar, I., Chatti, K. 2010. Calibration of HDM-4 Models for Estimating the Effect of Pavement Roughness on Fuel Consumption for U.S. Conditions. Transportation Research Record: Journal of the Transportation Research Board, No. 2155. Pages 105-116.** Akbarian M., Moeini S.S., Ulm F-J, Nazzal M. 2012. Mechanistic Approach to Pavement-Vehicle Interaction and Its Impact on Life-Cycle Assessment. Transportation Research Record: Journal of the Transportation Research Board, No. 2306. Pages 171-179.
Slide 3
Pavement-induced fuel consumption research
Deflection Induced PVI
Roughness Induced PVI
Probabilistic PVI Implementation

Slide 4
Key research findings
We can quantify excess fuel consumption due to pavement-vehicle interaction
Probabilistic analysis provides useful estimates even with limited data
Surface and structure matter
Slide 5
Pavement-induced fuel consumption research
Deflection Induced PVI
Roughness Induced PVI
Probabilistic PVI Implementation
Slide 6
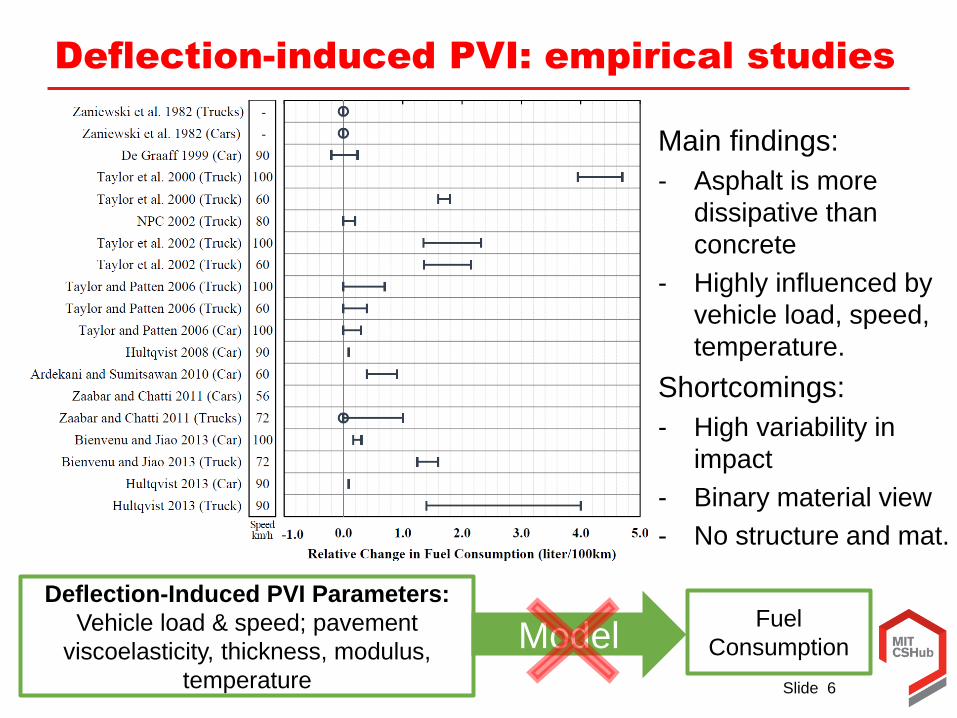
Main findings:
- Asphalt is more
dissipative than
concrete
- Highly influenced by
vehicle load, speed,
temperature.
Shortcomings:
- High variability in
impact
- Binary material view
- No structure and mat.
Deflection-Induced PVI Parameters:
Vehicle load & speed; pavement
viscoelasticity, thickness, modulus,
temperature
Fuel
ConsumptionModel
Deflection-induced PVI: empirical studies
Slide 7
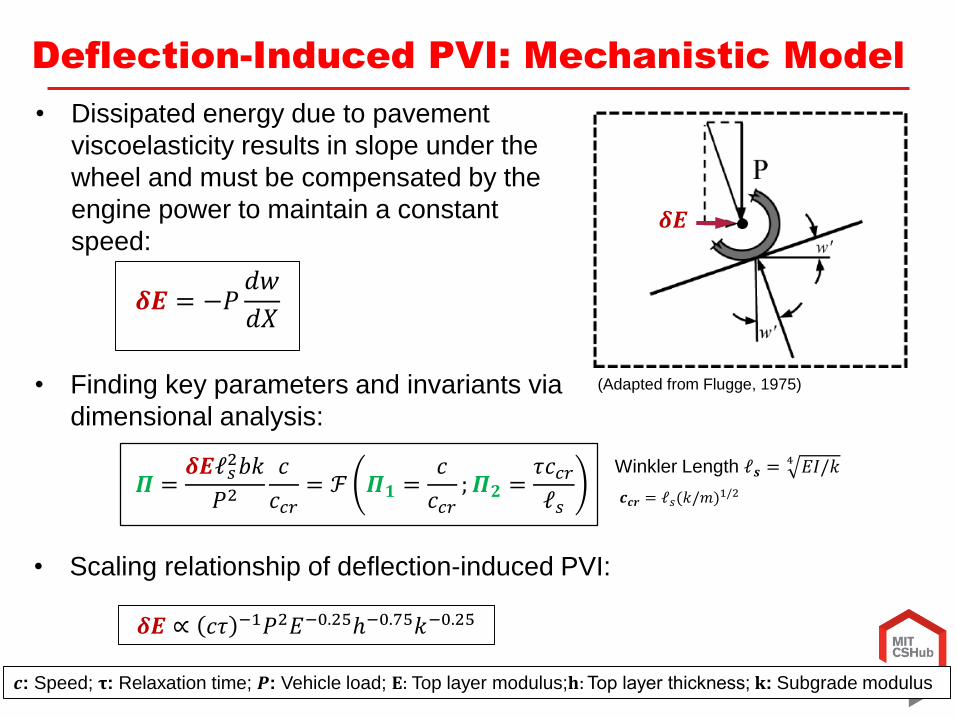
• Dissipated energy due to pavement
viscoelasticity results in slope under the
wheel and must be compensated by the
engine power to maintain a constant
speed:
• Finding key parameters and invariants via
dimensional analysis:
Deflection-Induced PVI: Mechanistic Model
• Scaling relationship of deflection-induced PVI:
(Adapted from Flugge, 1975)
𝜹𝑬
𝜹𝑬 = −𝑃𝑑𝑤
𝑑𝑋
𝒄𝒄𝒓 = 𝓁𝑠(𝑘/𝑚)1/2
Winkler Length 𝓁𝒔 =4 𝐸𝐼/𝑘
𝜫 =𝜹𝑬𝓁𝑠
2𝑏𝑘
𝑃2𝑐
𝑐𝑐𝑟= ℱ 𝜫𝟏 =
𝑐
𝑐𝑐𝑟; 𝜫𝟐 =
𝜏𝑐𝑐𝑟𝓁𝑠
𝜹𝑬 ∝ 𝑐𝜏 −1𝑃2𝐸−0.25ℎ−0.75𝑘−0.25
𝒄: Speed; 𝛕: Relaxation time; 𝑷: Vehicle load; 𝐄: Top layer modulus;𝐡:Top layer thickness; 𝐤: Subgrade modulus
Slide 8
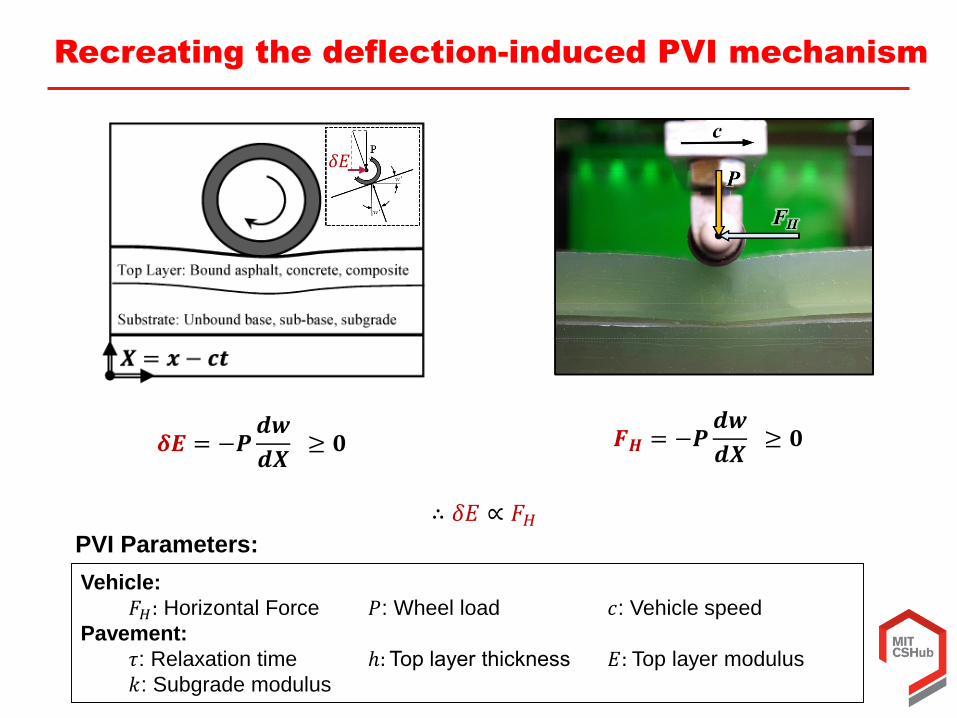
𝑭𝑯 = −𝑷𝒅𝒘
𝒅𝑿≥ 𝟎
∴ 𝛿𝐸 ∝ 𝐹𝐻
𝜹𝑬 = −𝑷𝒅𝒘
𝒅𝑿≥ 𝟎
Vehicle:
𝐹𝐻: Horizontal Force 𝑃: Wheel load 𝑐: Vehicle speed
Pavement:
𝜏: Relaxation time ℎ:Top layer thickness 𝐸: Top layer modulus
𝑘: Subgrade modulus
Recreating the deflection-induced PVI mechanism
𝛿𝐸
PVI Parameters:
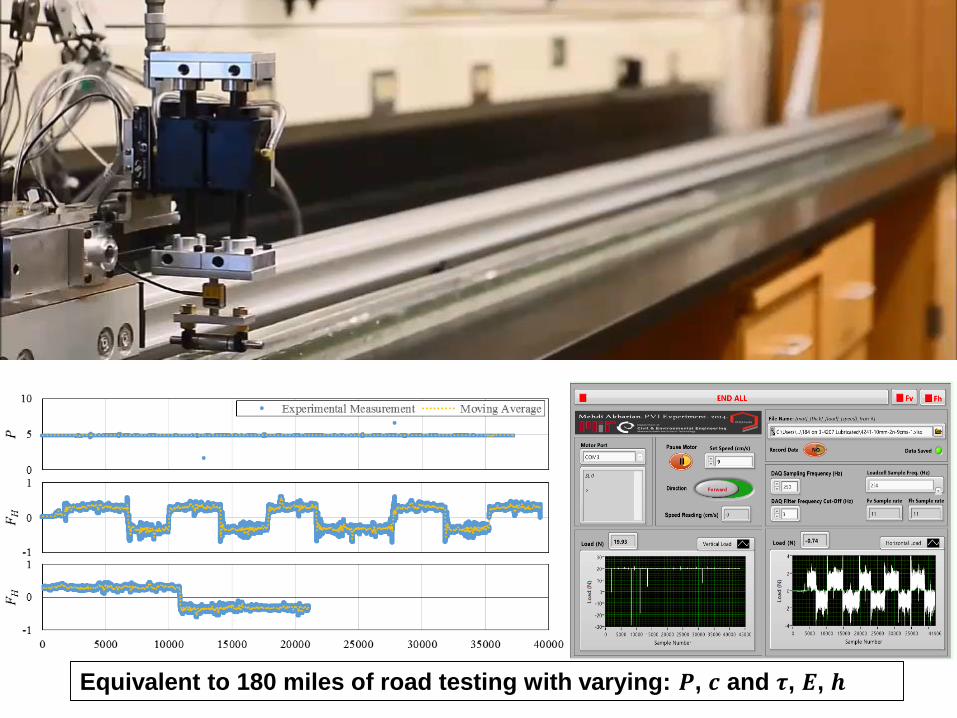
Slide 9
9
Equivalent to 180 miles of road testing with varying: 𝑷, 𝒄 and 𝝉, 𝑬, 𝒉
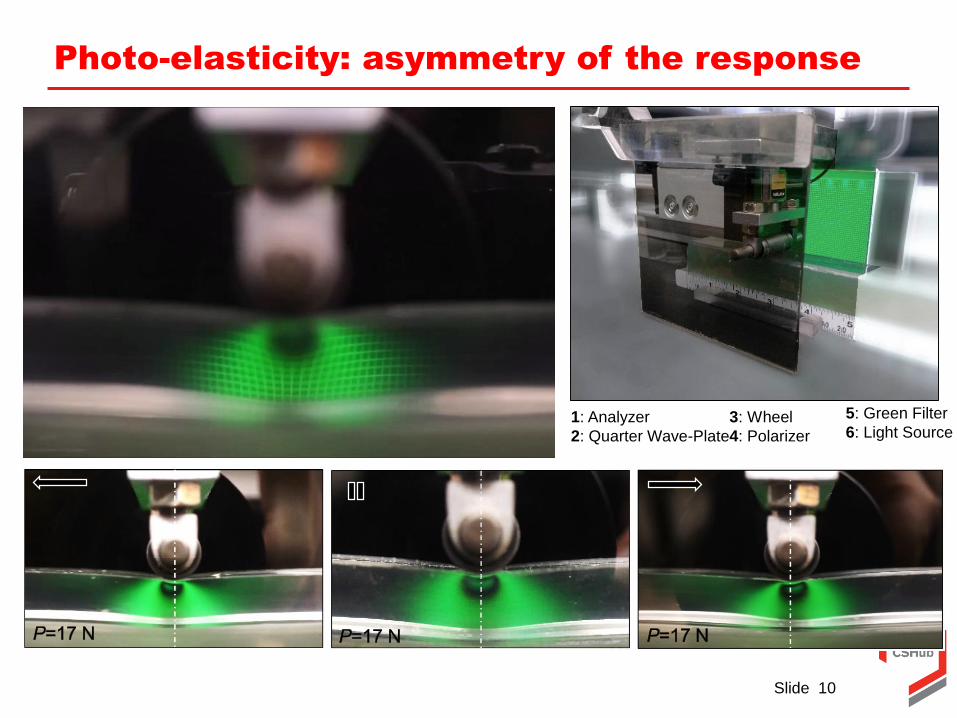
Slide 10
1: Analyzer
2: Quarter Wave-Plate
3: Wheel
4: Polarizer
5: Green Filter
6: Light Source
Photo-elasticity: asymmetry of the response
Slide 11
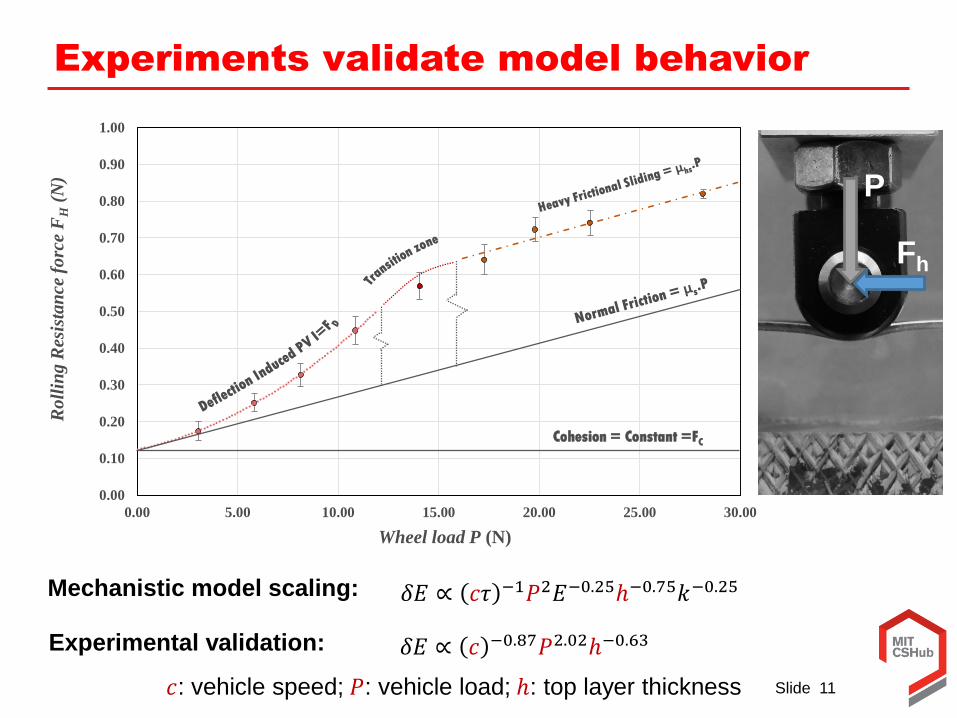
Experiments validate model behavior
0.00
0.10
0.20
0.30
0.40
0.50
0.60
0.70
0.80
0.90
1.00
0.00 5.00 10.00 15.00 20.00 25.00 30.00
Ro
llin
g R
esis
tan
ce f
orc
e F
H(N
)
Wheel load P (N)
Cohesion = Constant =FC
𝛿𝐸 ∝ 𝑐𝜏 −1𝑃2𝐸−0.25ℎ−0.75𝑘−0.25Mechanistic model scaling:
Experimental validation: 𝛿𝐸 ∝ 𝑐 −0.87𝑃2.02ℎ−0.63
𝑐: vehicle speed; 𝑃: vehicle load; ℎ: top layer thickness
P
Fh
Slide 12
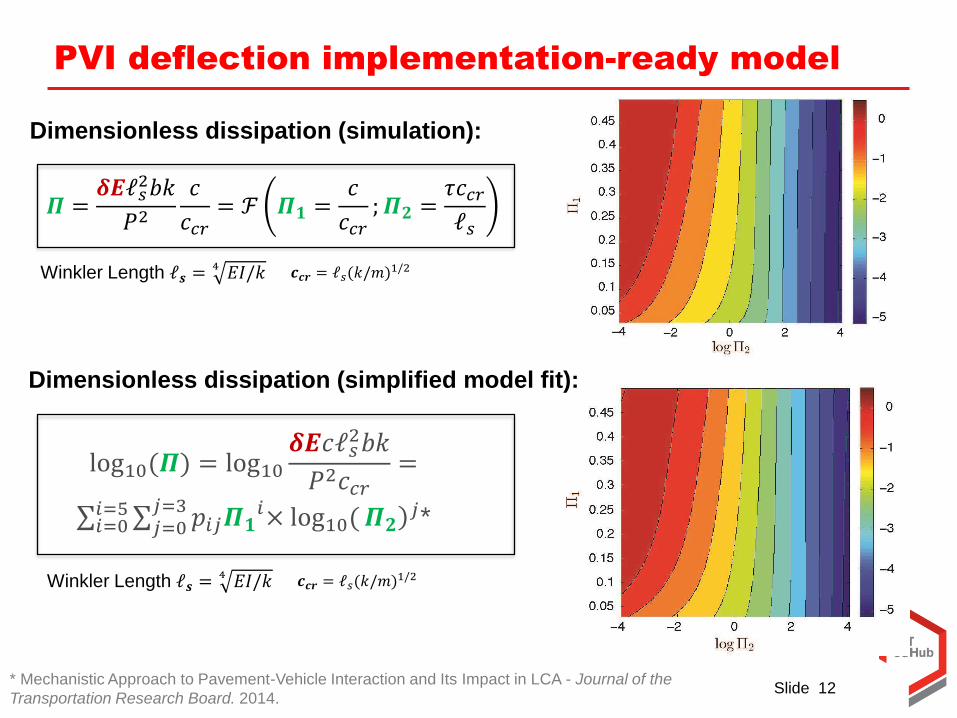
PVI deflection implementation-ready model
* Mechanistic Approach to Pavement-Vehicle Interaction and Its Impact in LCA - Journal of the
Transportation Research Board. 2014.
log10(𝜫) = log10𝜹𝑬𝑐𝓁𝑠
2𝑏𝑘
𝑃2𝑐𝑐𝑟=
σ𝑖=0𝑖=5σ𝑗=0
𝑗=3𝑝𝑖𝑗𝜫𝟏
𝑖 )× log10(𝜫𝟐𝑗*
Dimensionless dissipation (simplified model fit):
𝜫 =𝜹𝑬𝓁𝑠
2𝑏𝑘
𝑃2𝑐
𝑐𝑐𝑟= ℱ 𝜫𝟏 =
𝑐
𝑐𝑐𝑟; 𝜫𝟐 =
𝜏𝑐𝑐𝑟𝓁𝑠
Dimensionless dissipation (simulation):
𝒄𝒄𝒓 = 𝓁𝑠(𝑘/𝑚)1/2Winkler Length 𝓁𝒔 =4 𝐸𝐼/𝑘
𝒄𝒄𝒓 = 𝓁𝑠(𝑘/𝑚)1/2Winkler Length 𝓁𝒔 =4 𝐸𝐼/𝑘
Slide 13
Pavement-induced fuel consumption research
Deflection Induced PVI
Roughness Induced PVI
Probabilistic PVI Implementation
Slide 14
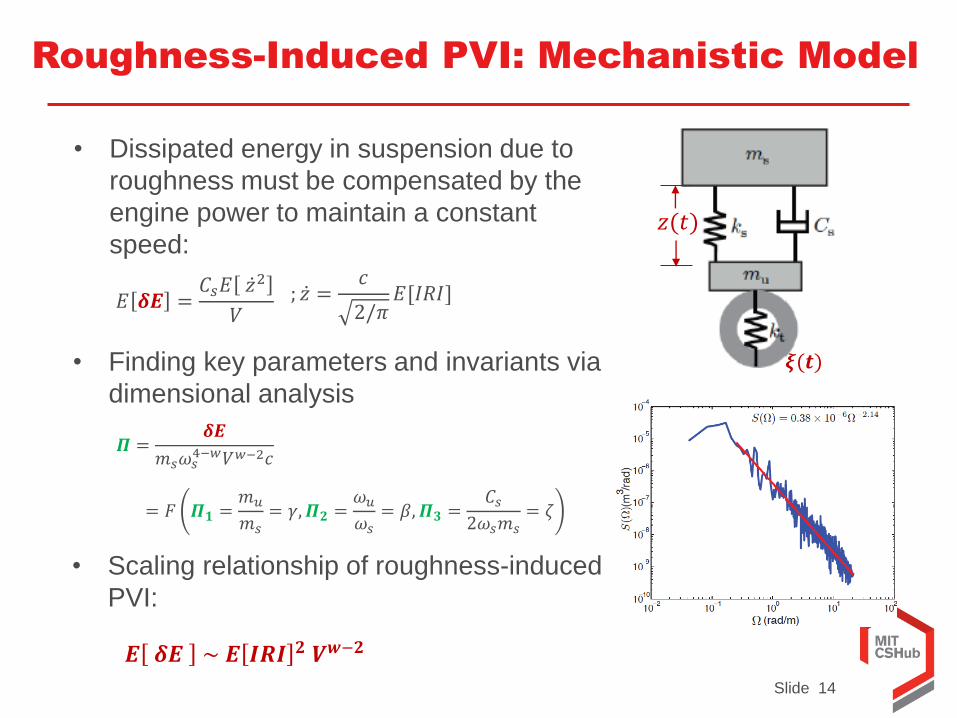
𝐸 𝜹𝑬 =𝐶𝑠𝐸 ሶ𝑧2
𝑉
• Dissipated energy in suspension due to
roughness must be compensated by the
engine power to maintain a constant
speed:
• Finding key parameters and invariants via
dimensional analysis
𝑧(𝑡)
𝝃(𝒕)
Roughness-Induced PVI: Mechanistic Model
• Scaling relationship of roughness-induced
PVI:
𝑬 𝜹𝑬 ~ 𝑬 𝑰𝑹𝑰 𝟐 𝑽𝒘−𝟐
𝜫 =𝜹𝑬
𝑚𝑠𝜔𝑠4−𝑤𝑉𝑤−2𝑐
= 𝐹 𝜫𝟏 =𝑚𝑢
𝑚𝑠= 𝛾,𝜫𝟐 =
𝜔𝑢
𝜔𝑠= 𝛽,𝜫𝟑 =
𝐶𝑠2𝜔𝑠𝑚𝑠
= 𝜁
; ሶ𝑧 =𝑐
2/𝜋𝐸[𝐼𝑅𝐼]
Slide 15
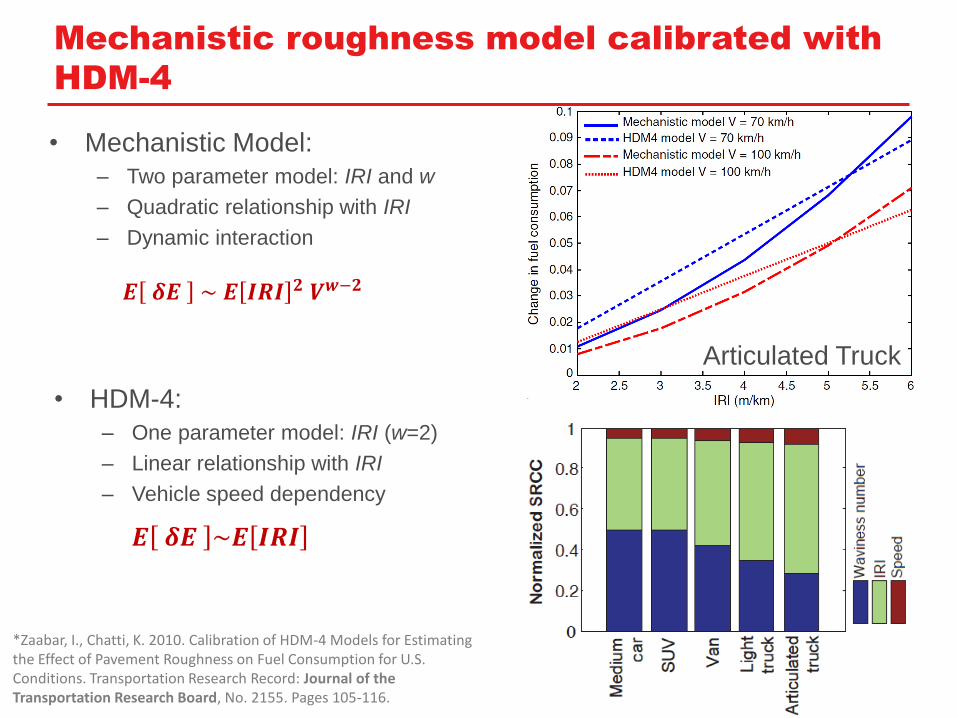
Mechanistic roughness model calibrated with
HDM-4
*Zaabar, I., Chatti, K. 2010. Calibration of HDM-4 Models for Estimating the Effect of Pavement Roughness on Fuel Consumption for U.S. Conditions. Transportation Research Record: Journal of the Transportation Research Board, No. 2155. Pages 105-116.
𝑬 𝜹𝑬 ~𝑬 𝑰𝑹𝑰
Articulated Truck
• Mechanistic Model:
– Two parameter model: IRI and w
– Quadratic relationship with IRI
– Dynamic interaction
• HDM-4:
– One parameter model: IRI (w=2)
– Linear relationship with IRI
– Vehicle speed dependency
𝑬 𝜹𝑬 ~ 𝑬 𝑰𝑹𝑰 𝟐 𝑽𝒘−𝟐
Slide 16
Pavement-induced fuel consumption research
Deflection Induced PVI
Roughness Induced PVI
Probabilistic PVI Implementation
Slide 17
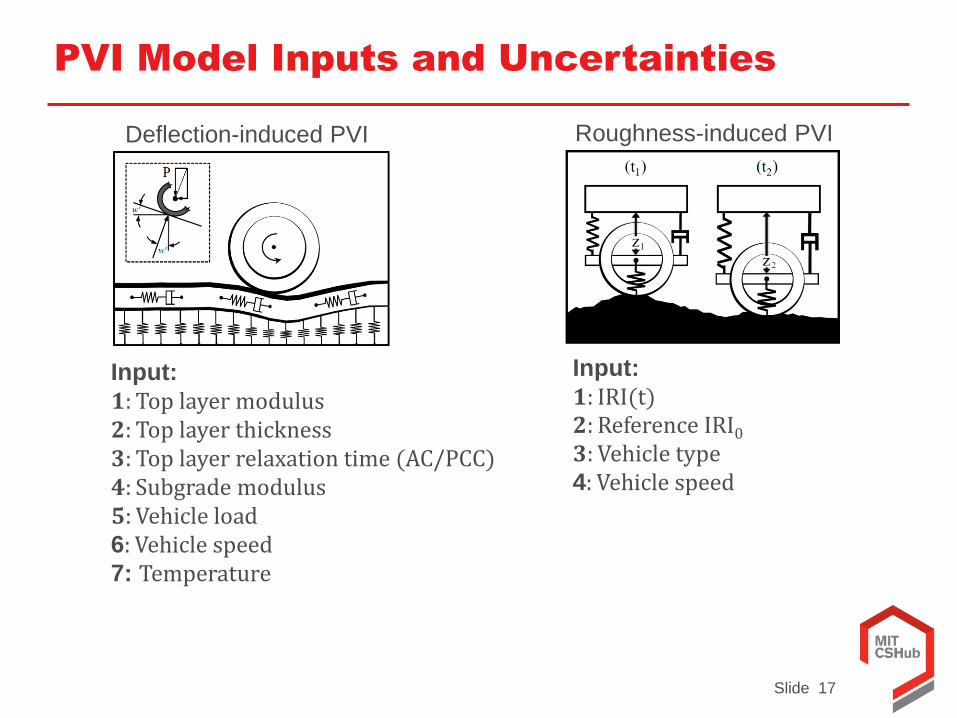
PVI Model Inputs and Uncertainties
Input:
𝟏: Top layer modulus𝟐: Top layer thickness𝟑: Top layer relaxation time (AC/PCC)𝟒: Subgrade modulus𝟓: Vehicle load6: Vehicle speed7: Temperature
Input:
𝟏: IRI(t)𝟐: Reference IRI0𝟑: Vehicle type4: Vehicle speed
Deflection-induced PVI Roughness-induced PVI
Slide 18
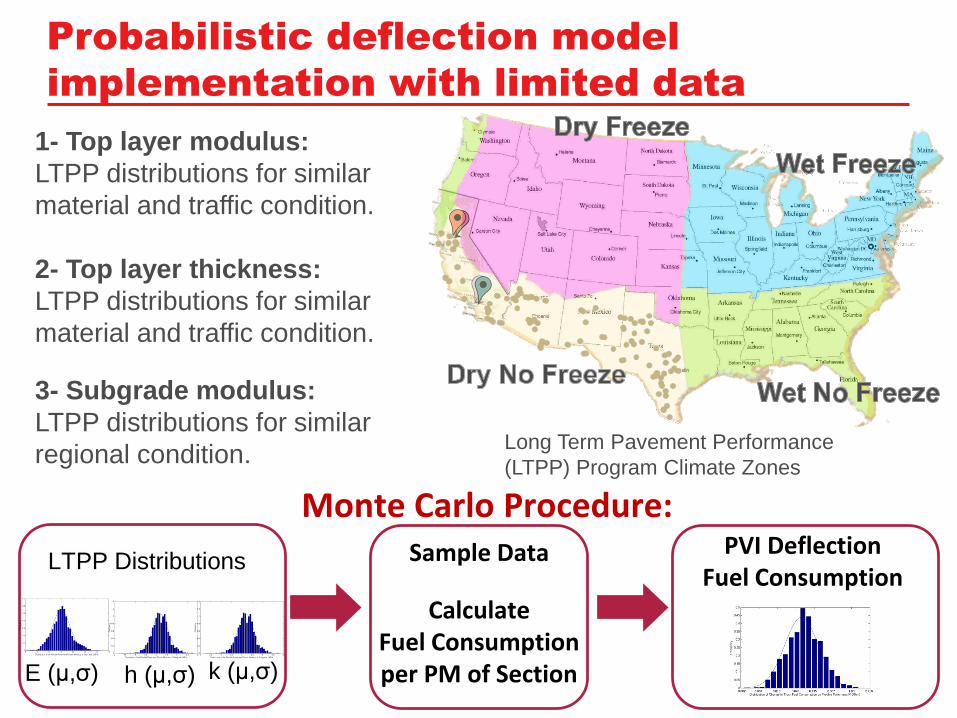
Probabilistic deflection model
implementation with limited data
1- Top layer modulus:
LTPP distributions for similar
material and traffic condition.
2- Top layer thickness:
LTPP distributions for similar
material and traffic condition.
3- Subgrade modulus:
LTPP distributions for similar
regional condition.Long Term Pavement Performance
(LTPP) Program Climate Zones
Sample Data
CalculateFuel Consumption per PM of SectionE (μ,σ) k (μ,σ)
PVI DeflectionFuel Consumption
Monte Carlo Procedure:
h (μ,σ)
LTPP Distributions
Slide 19
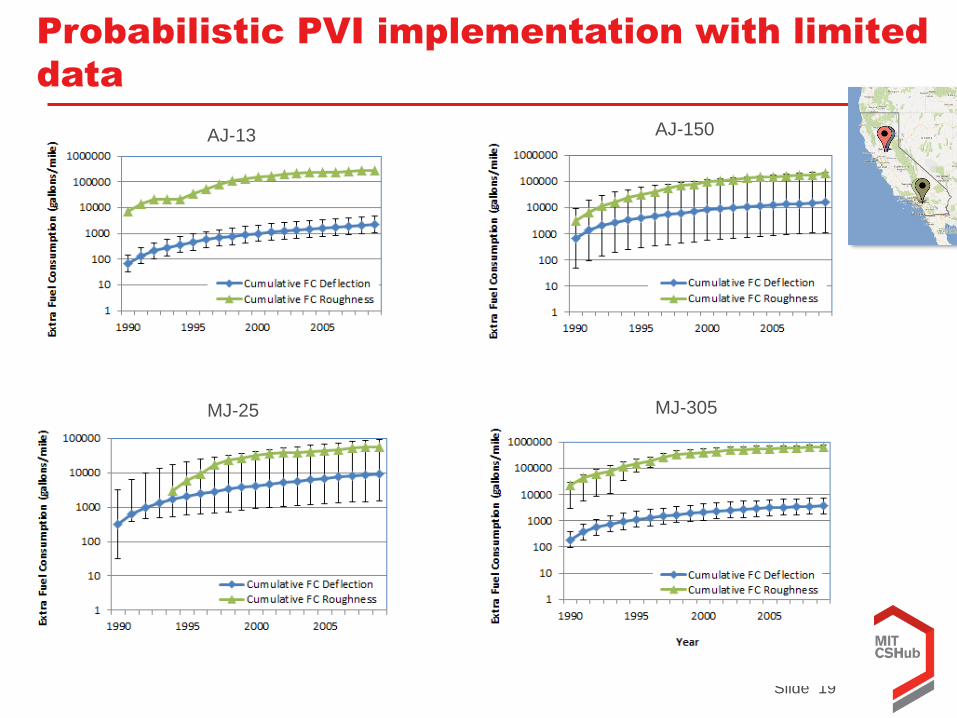
Probabilistic PVI implementation with limited
data
AJ-13 AJ-150
MJ-25 MJ-305
Slide 20
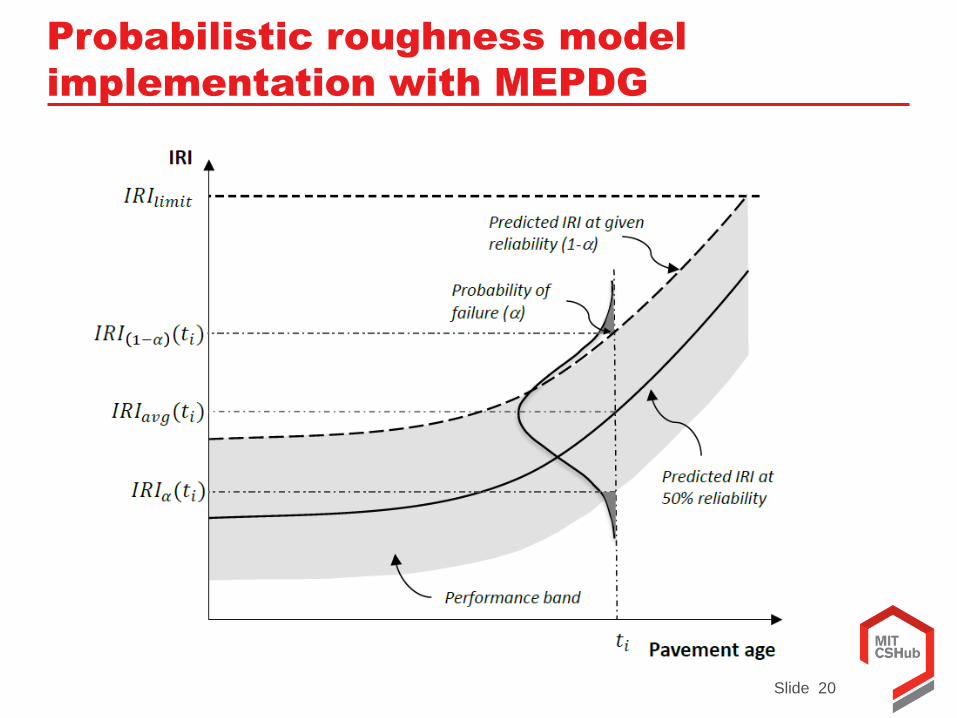
Probabilistic roughness model
implementation with MEPDG
Slide 21
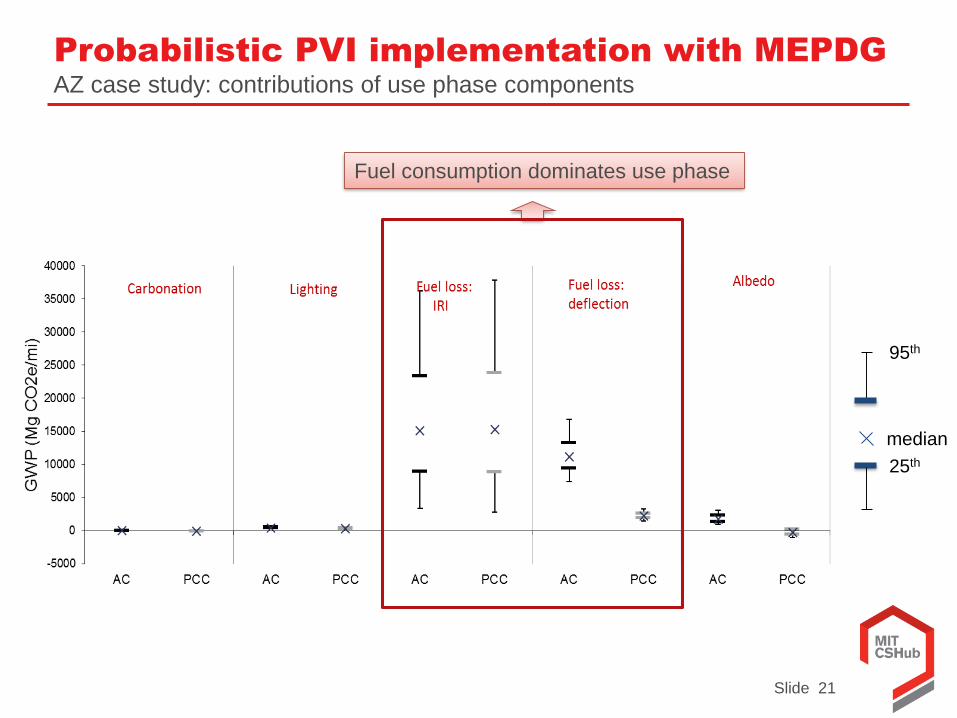
Probabilistic PVI implementation with MEPDGAZ case study: contributions of use phase components
Fuel consumption dominates use phase
5th
25th
75th
95th
median
Slide 22
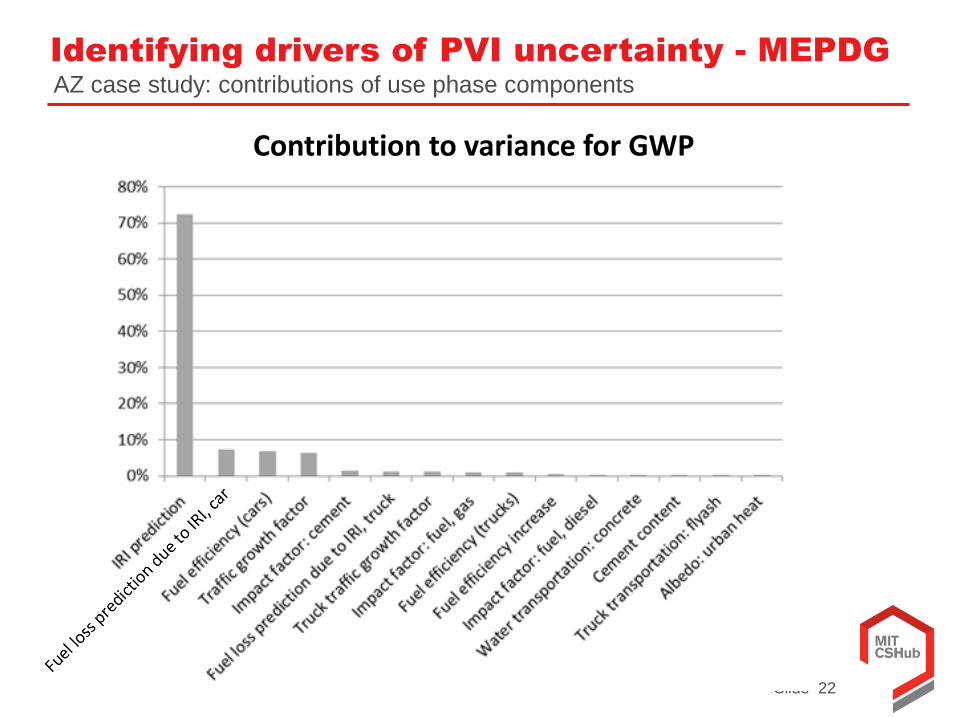
Identifying drivers of PVI uncertainty - MEPDGAZ case study: contributions of use phase components
Contribution to variance for GWP
Slide 23
Key research findings
We can quantify excess fuel consumption due to pavement-vehicle interaction
Probabilistic analysis provides useful estimates even with limited data
Surface and structure matter


![pvicollective.compvicollective.com/.../uploads/2012/09/pvi-annual-report-2… · Web viewpvi. collective: [performance] [video] [intervention][] pvi. pvi. collective. collective](https://img.pdfslide.us/doc/110x75/5aadeb937f8b9a5d0a8b7182/web-viewpvi-collective-performance-video-intervention-pvi-pvi-collective.jpg)