Embed Size (px)
Citation preview
Quantifying ETG Transport In Spherical Tokamaks With Flow Shear
Walter Guttenfelder
Aug. 28, 2009
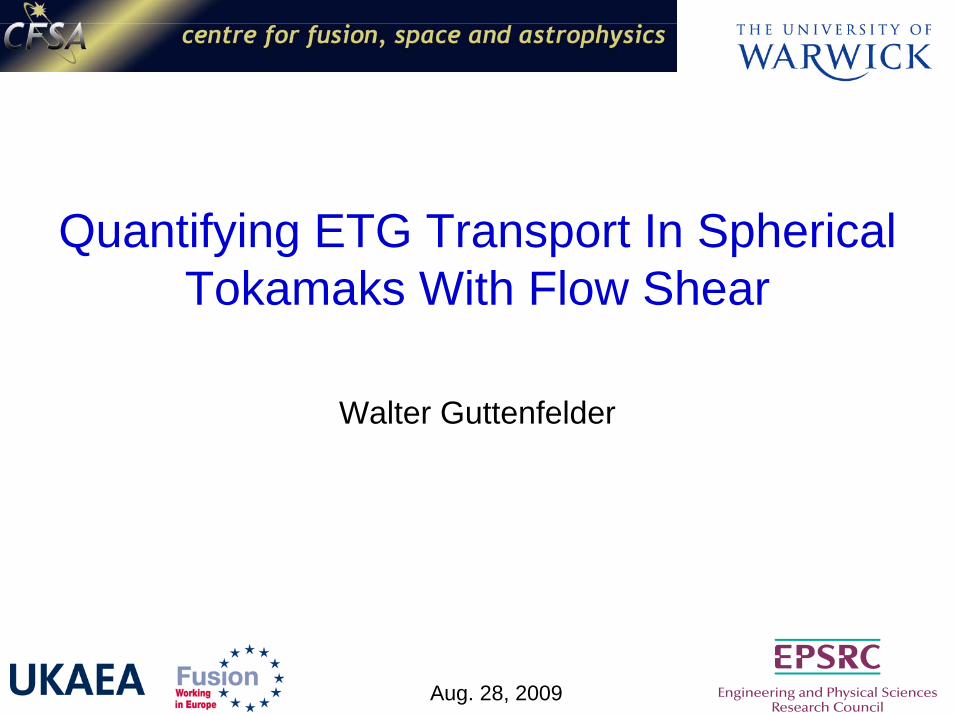
Overview
• Relevance of ETG to spherical tokamaks
• ST-like nonlinear gyrokinetic simulations (low aspect ratio, shaped, strong E×B shear)
• Convergence of simulations using kinetic ions & electrons with grid size, resolution and boundary conditions using GYRO (comparison with adiabatic ion model)
• Temperature profile predictions using a model transport expression derived from nonlinear simulations
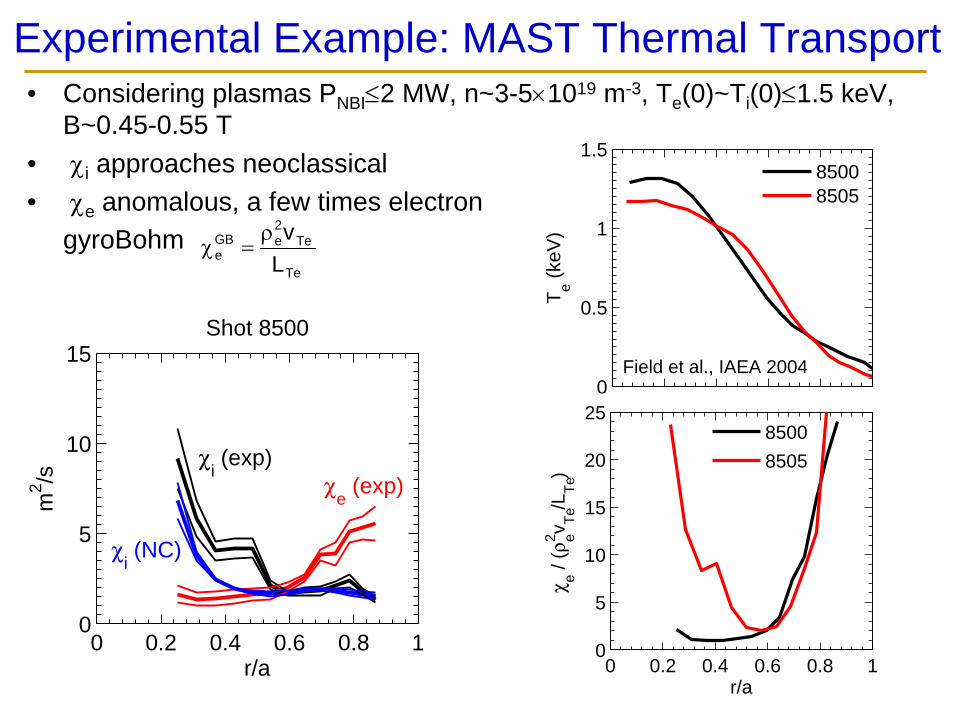
Experimental Example: MAST Thermal Transport• Considering plasmas PNBI≤2 MW, n~3-5×10¹⁹ m-3, Te(0)~Ti(0)≤1.5 keV,
B~0.45-0.55 T• χi approaches neoclassical• χe anomalous, a few times electron
gyroBohm
0 0.2 0.4 0.6 0.8 10
5
10
15
r/a
Shot 8500
m2 /s
χi (exp)
χe (exp)
χi (NC)
0 0.2 0.4 0.6 0.8 10
0.5
1
1.5
Te (
keV
)
85008505
0 0.2 0.4 0.6 0.8 10
5
10
15
20
25
r/a
χ e / (ρ
e2 v Te/L
Te)
8500
8505
Te
Te2eGB
e Lvρ
=χ
Field et al., IAEA 2004
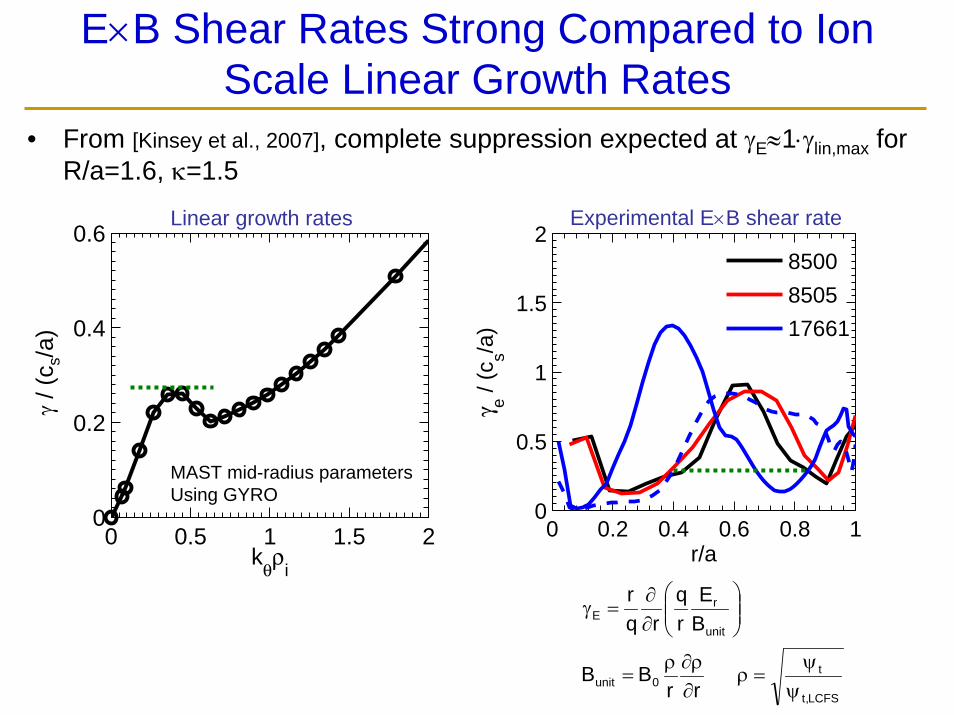
E×B Shear Rates Strong Compared to Ion Scale Linear Growth Rates
• From [Kinsey et al., 2007], complete suppression expected at γE≈1⋅γlin,max for R/a=1.6, κ=1.5
LCFS,t
t0unit
unit
rE
rr
BB
BE
rq
rqr
ψψ
=ρ∂ρ∂ρ
=
⎟⎟⎠
⎞⎜⎜⎝
⎛∂∂
=γ
0 0.5 1 1.5 20
0.2
0.4
0.6
kθρ
i
Ti
0 0.2 0.4 0.6 0.8 10
0.5
1
1.5
2
r/a
γ e / (c
s/a)
8500
8505
17661
Experimental E×B shear rateLinear growth rates
γ/ (
c s/a
)
MAST mid-radius parametersUsing GYRO
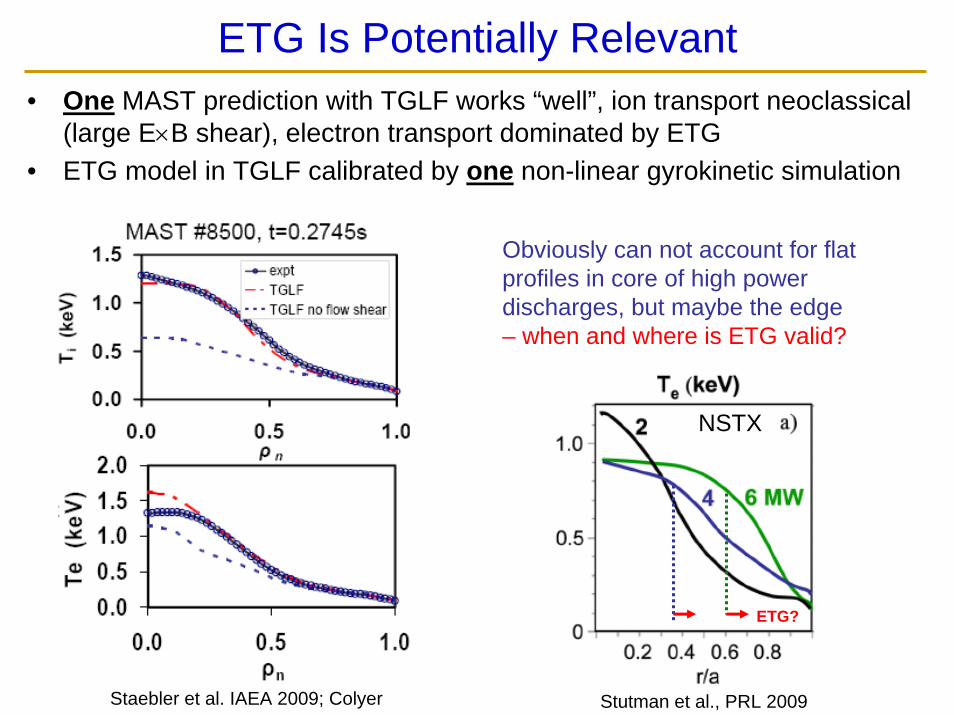
ETG Is Potentially Relevant• One MAST prediction with TGLF works “well”, ion transport neoclassical
(large E×B shear), electron transport dominated by ETG• ETG model in TGLF calibrated by one non-linear gyrokinetic simulation
Staebler et al. IAEA 2009; Colyer Stutman et al., PRL 2009
Obviously can not account for flat profiles in core of high power discharges, but maybe the edge – when and where is ETG valid?
ETG?
NSTX
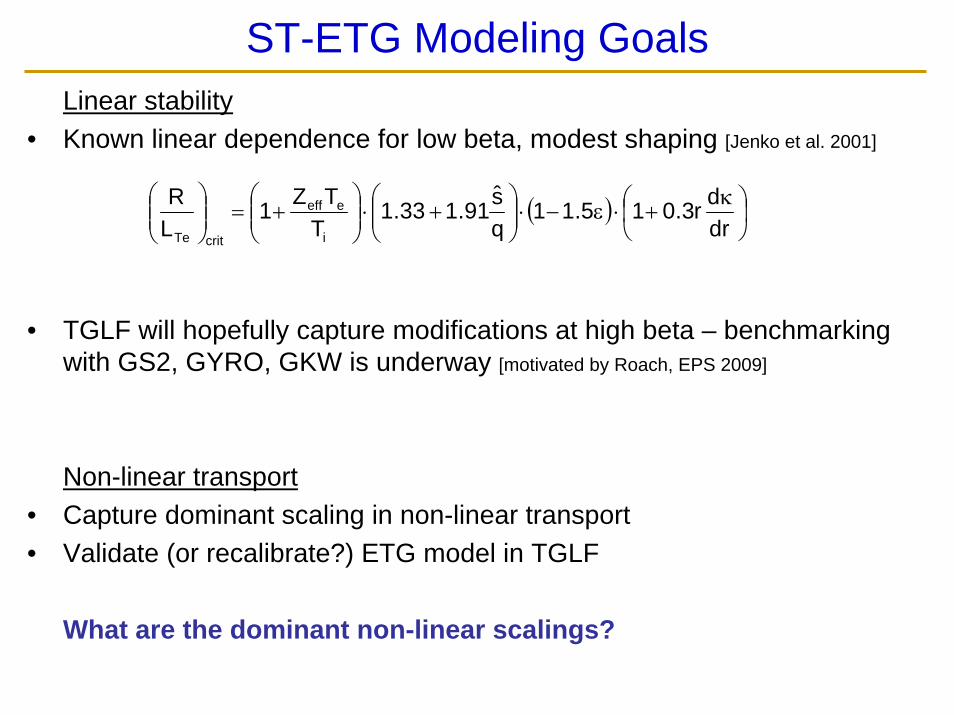
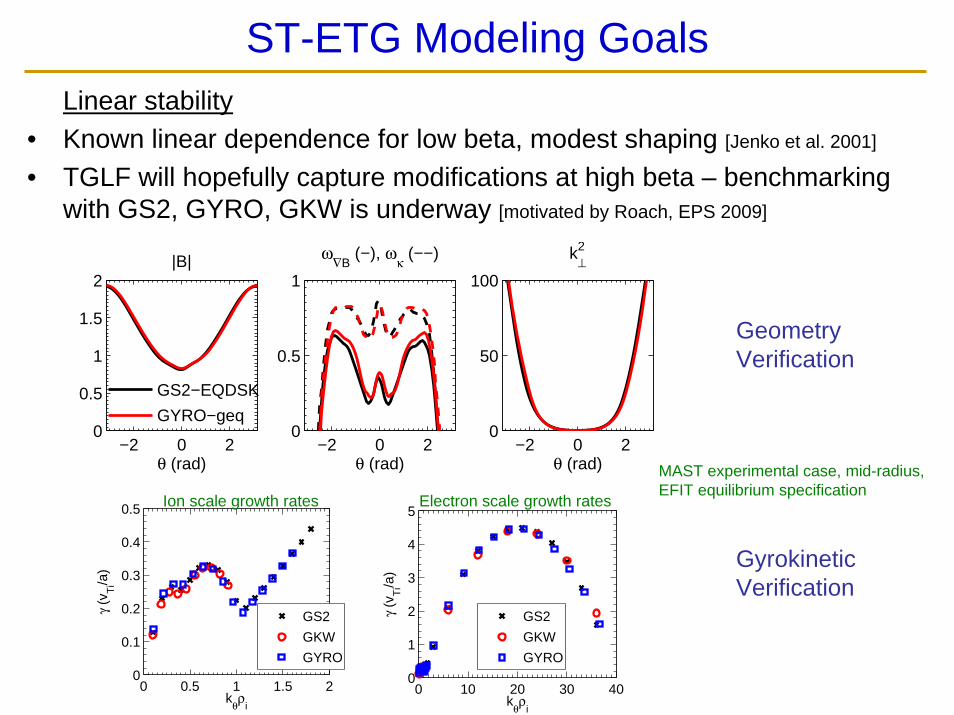
ST-ETG Modeling GoalsLinear stability
• Known linear dependence for low beta, modest shaping [Jenko et al. 2001]
• TGLF will hopefully capture modifications at high beta – benchmarking with GS2, GYRO, GKW is underway [motivated by Roach, EPS 2009]
Non-linear transport• Capture dominant scaling in non-linear transport• Validate (or recalibrate?) ETG model in TGLF
What are the dominant non-linear scalings?
( ) ⎟⎠⎞
⎜⎝⎛ κ+⋅ε−⋅⎟⎟
⎠
⎞⎜⎜⎝
⎛+⋅⎟⎟
⎠
⎞⎜⎜⎝
⎛+=⎟⎟
⎠
⎞⎜⎜⎝
⎛drdr3.015.11
qs91.133.1
TTZ1
LR
i
eeff
critTe
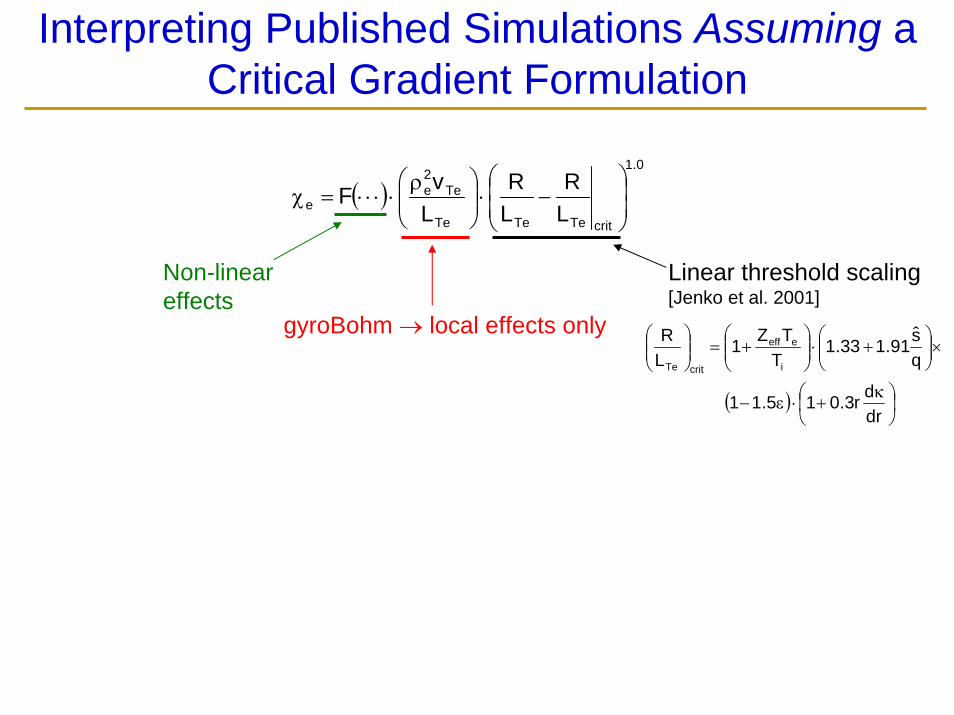
Interpreting Published Simulations Assuming a Critical Gradient Formulation
( )0.1
critTeTeTe
Te2e
e LR
LR
LvF ⎟
⎟⎠
⎞⎜⎜⎝
⎛−⋅⎟⎟
⎠
⎞⎜⎜⎝
⎛ ρ⋅⋅⋅⋅=χ
gyroBohm → local effects only
Non-lineareffects
( ) ⎟⎠⎞
⎜⎝⎛ κ+⋅ε−
×⎟⎟⎠
⎞⎜⎜⎝
⎛+⋅⎟⎟
⎠
⎞⎜⎜⎝
⎛+=⎟⎟
⎠
⎞⎜⎜⎝
⎛
drdr3.015.11
qs91.133.1
TTZ1
LR
i
eeff
critTe
Linear threshold scaling[Jenko et al. 2001]
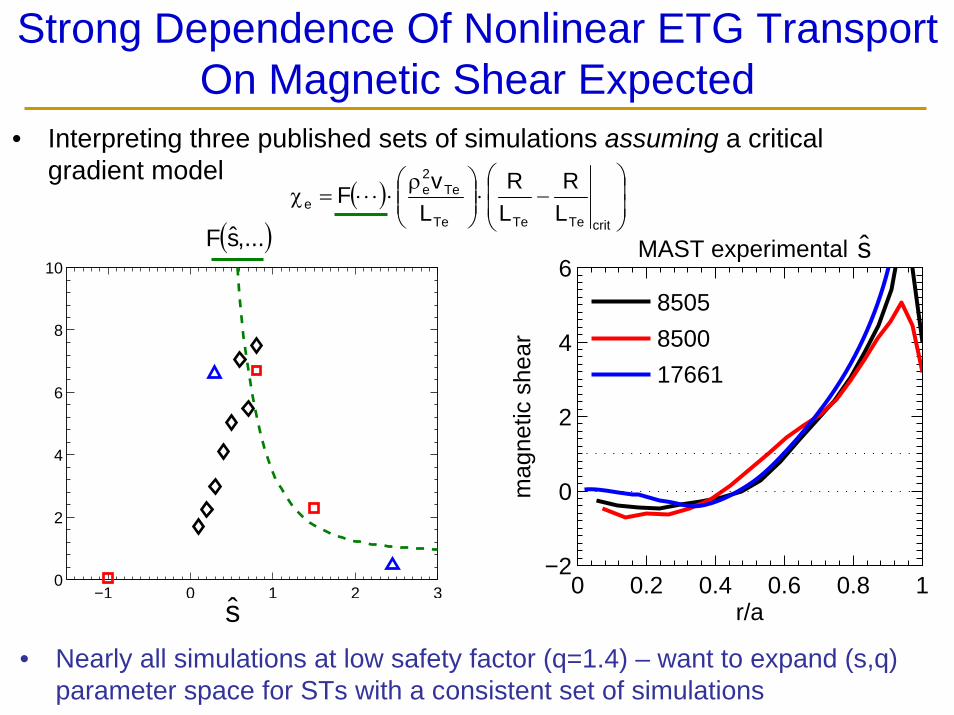
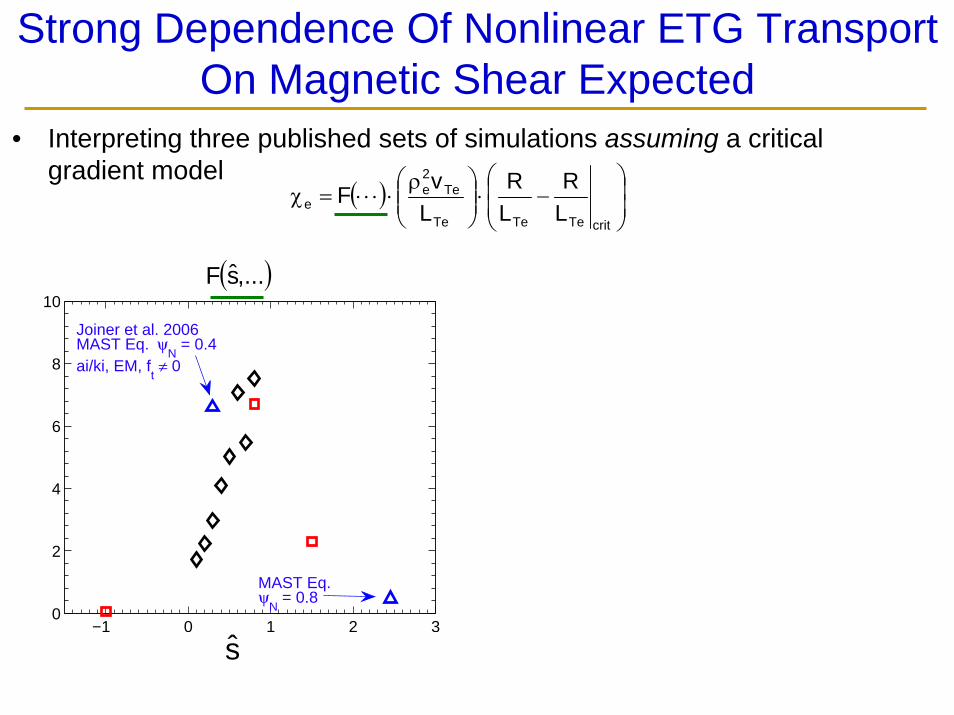
Strong Dependence Of Nonlinear ETG Transport On Magnetic Shear Expected
• Interpreting three published sets of simulations assuming a critical gradient model
( ) ⎟⎟⎠
⎞⎜⎜⎝
⎛−⋅⎟⎟
⎠
⎞⎜⎜⎝
⎛ ρ⋅⋅⋅⋅=χ
critTeTeTe
Te2e
e LR
LR
LvF
−1 0 1 2 30
2
4
6
8
10
( ),...sF
s0 0.2 0.4 0.6 0.8 1
−2
0
2
4
6
r/a
mag
netic
she
ar
8505
8500
17661
MAST experimental s
• Nearly all simulations at low safety factor (q=1.4) – want to expand (s,q) parameter space for STs with a consistent set of simulations
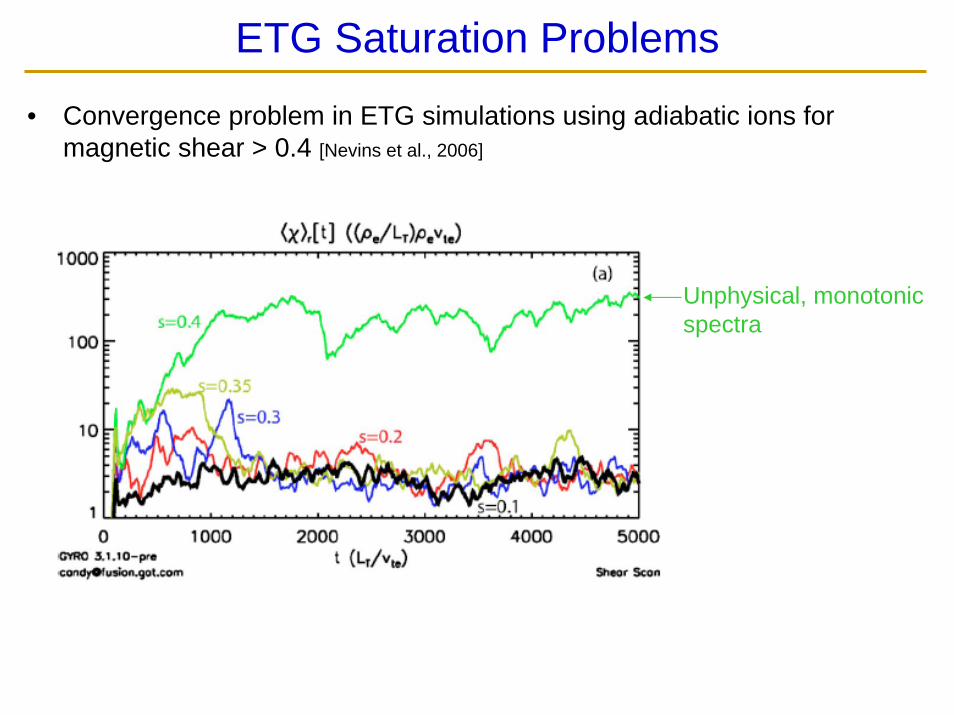
ETG Saturation Problems
• Convergence problem in ETG simulations using adiabatic ions for magnetic shear > 0.4 [Nevins et al., 2006]
Unphysical, monotonicspectra
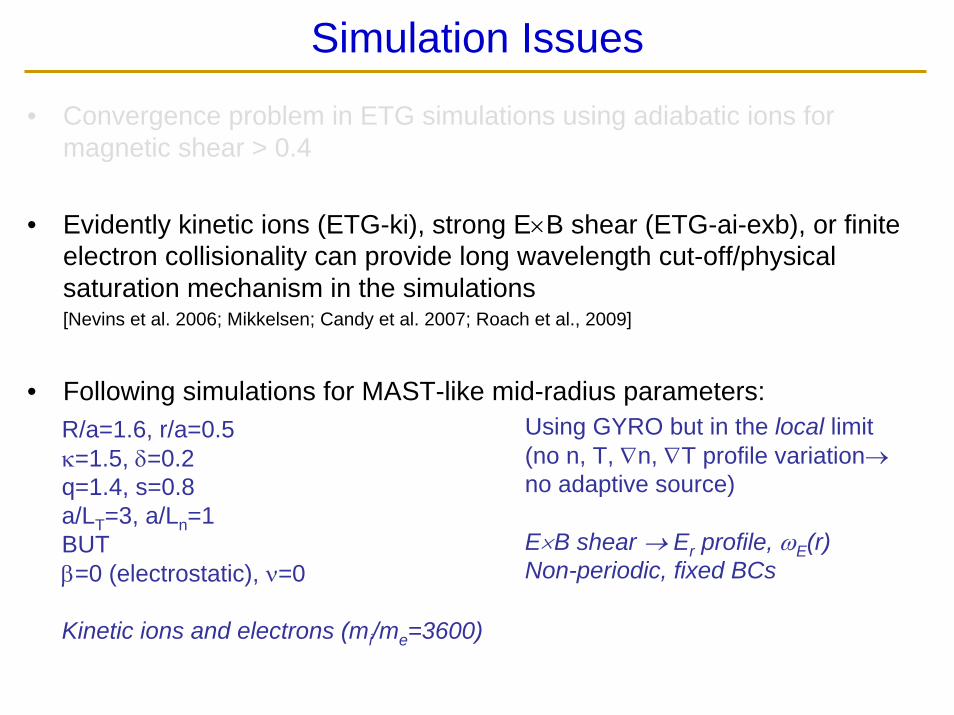
Simulation Issues
• Convergence problem in ETG simulations using adiabatic ions for magnetic shear > 0.4
• Evidently kinetic ions (ETG-ki), strong E×B shear (ETG-ai-exb), or finite electron collisionality can provide long wavelength cut-off/physical saturation mechanism in the simulations[Nevins et al. 2006; Mikkelsen; Candy et al. 2007; Roach et al., 2009]
• Following simulations for MAST-like mid-radius parameters:R/a=1.6, r/a=0.5κ=1.5, δ=0.2q=1.4, s=0.8a/LT=3, a/Ln=1BUTβ=0 (electrostatic), ν=0
Kinetic ions and electrons (mi/me=3600)
Using GYRO but in the local limit(no n, T, ∇n, ∇T profile variation→no adaptive source)
E×B shear → Er profile, ωE(r)Non-periodic, fixed BCs
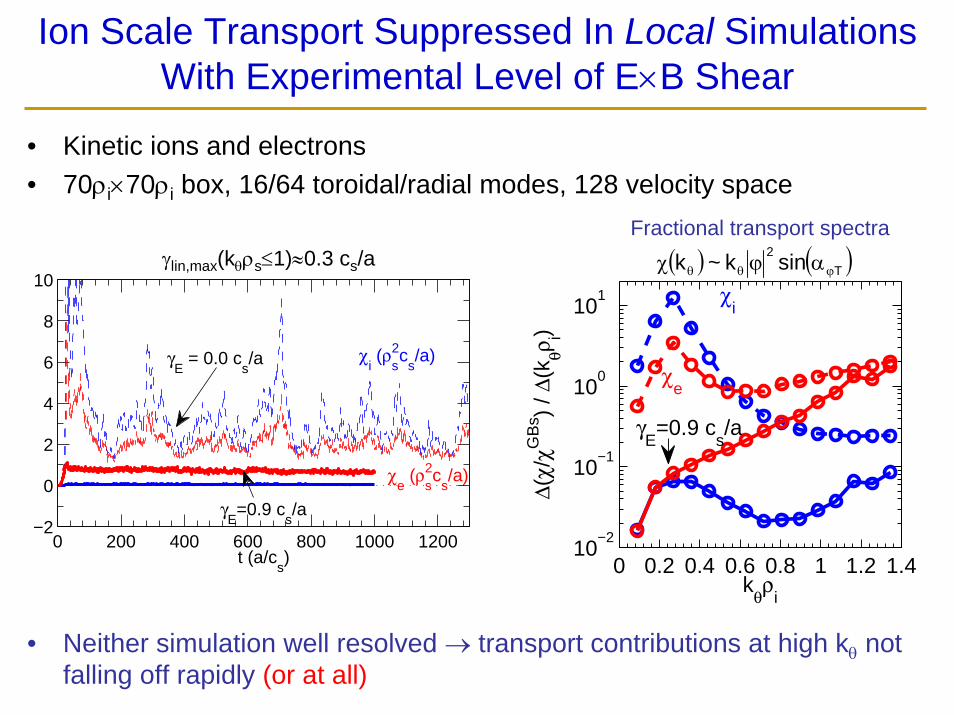
Ion Scale Transport Suppressed In Local Simulations With Experimental Level of E×B Shear
• Kinetic ions and electrons• 70ρi×70ρi box, 16/64 toroidal/radial modes, 128 velocity space
• Neither simulation well resolved → transport contributions at high kθ not falling off rapidly (or at all)
0 0.2 0.4 0.6 0.8 1 1.2 1.410
−2
10−1
100
101
kθρ
i
Δ(χ/
χGB
s ) / Δ
(kθρ i)
χi
χe
γE=0.9 c
s/a
0 200 400 600 800 1000 1200−2
0
2
4
6
8
10
t (a/cs)
χi (ρ
s2c
s/a)
χe (ρ
s2c
s/a)
γE=0.9 c
s/a
γE = 0.0 c
s/a
Fractional transport spectraγlin,max(kθρs≤1)≈0.3 cs/a ( ) ( )T
2 sink~k ϕθθ αϕχ
10−1
100
101
102
10−4
10−3
10−2
10−1
100
kθρ
i
Δ(χ/
χGB
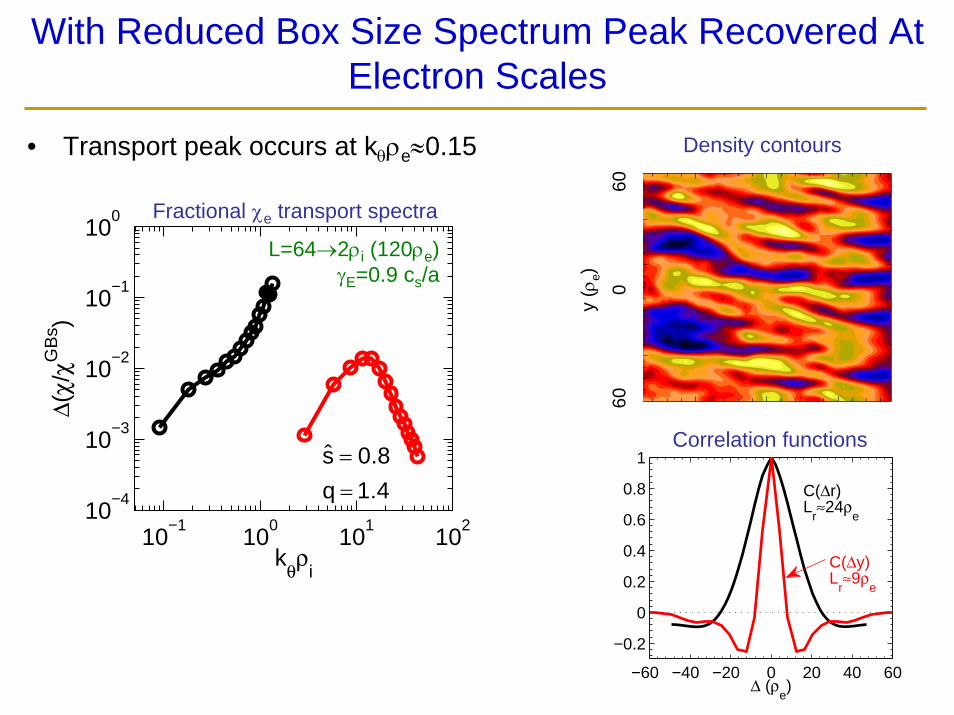
s )With Reduced Box Size Spectrum Peak Recovered At
Electron Scales
• Transport peak occurs at kθρe≈0.15
−60 −40 −20 0 20 40 60
−0.2
0
0.2
0.4
0.6
0.8
1
Δ (ρe)
C(Δr)L
r≈24ρ
e
C(Δy)L
r≈9ρ
e
Density contours
Correlation functions
L=64→2ρi (120ρe)γE=0.9 cs/a
Fractional χe transport spectra
y (ρ
e)
60
0
6
0
4.1q8.0s
==
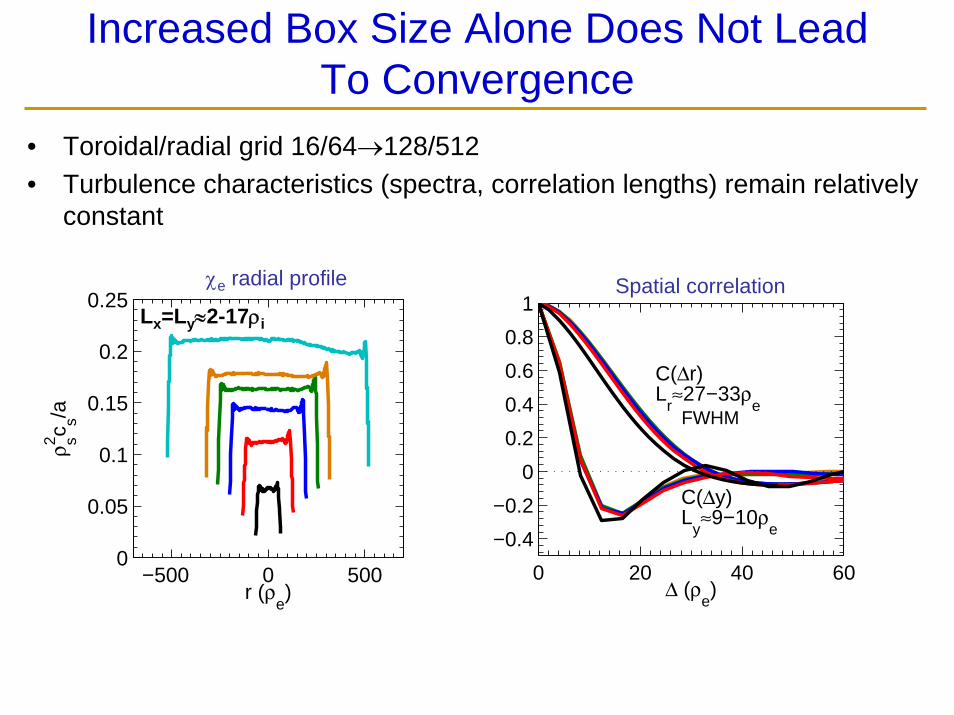
Increased Box Size Alone Does Not Lead To Convergence
• Toroidal/radial grid 16/64→128/512• Turbulence characteristics (spectra, correlation lengths) remain relatively
constant
−500 0 5000
0.05
0.1
0.15
0.2
0.25
r (ρe)
ρ s2 c s/a
0 20 40 60
−0.4
−0.2
0
0.2
0.4
0.6
0.8
1
Δ (ρe)
C(Δr)L
r≈27−33ρ
e
C(Δy) L
y≈9−10ρ
e
Spatial correlation
FWHM
χe radial profile
Lx=Ly≈2-17ρi
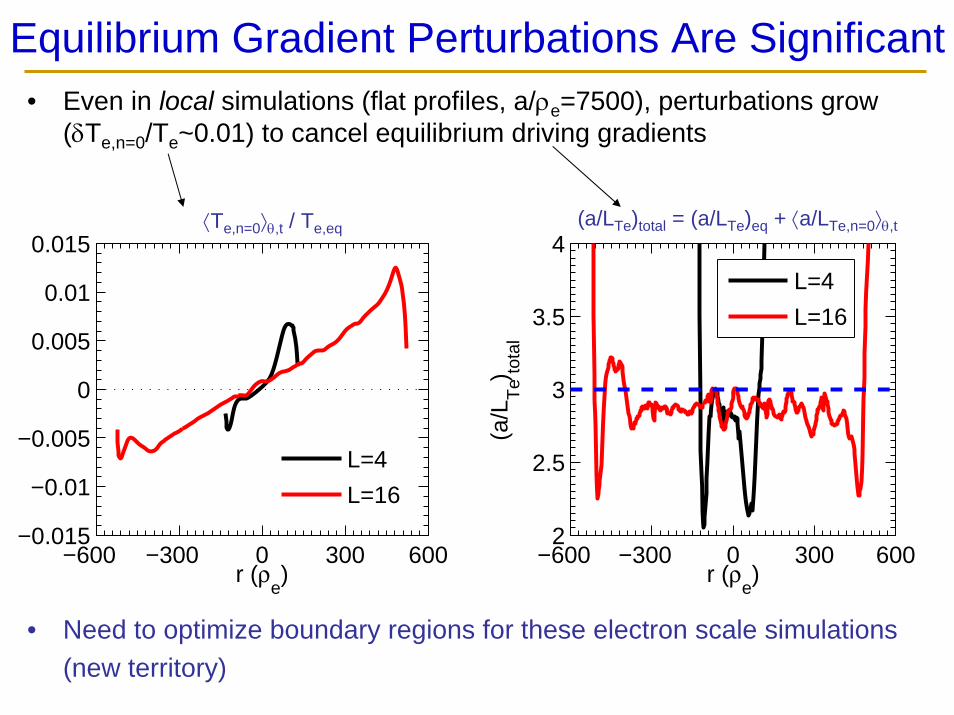
Equilibrium Gradient Perturbations Are Significant• Even in local simulations (flat profiles, a/ρe=7500), perturbations grow
(δTe,n=0/Te~0.01) to cancel equilibrium driving gradients
• Need to optimize boundary regions for these electron scale simulations(new territory)
−600 −300 0 300 600−0.015
−0.01
−0.005
0
0.005
0.01
0.015
r (ρe)
L=4
L=16
−600 −300 0 300 6002
2.5
3
3.5
4
r (ρe)
(a/L
Te) to
tal
L=4
L=16
⟨Te,n=0⟩θ,t / Te,eq (a/LTe)total = (a/LTe)eq + ⟨a/LTe,n=0⟩θ,t
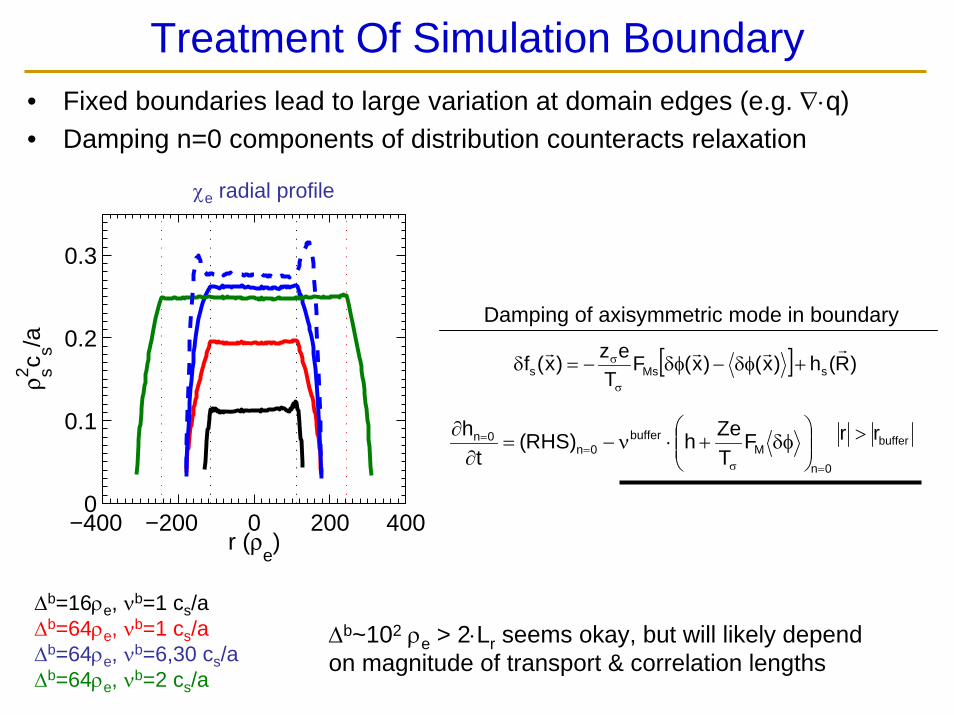
Treatment Of Simulation Boundary• Fixed boundaries lead to large variation at domain edges (e.g. ∇⋅q)• Damping n=0 components of distribution counteracts relaxation
−400 −200 0 200 4000
0.1
0.2
0.3
r (ρe)
ρ s2 c s/a
Δb=16ρe, νb=1 cs/aΔb=64ρe, νb=1 cs/aΔb=64ρe, νb=6,30 cs/aΔb=64ρe, νb=2 cs/a
0nM
buffer0n
0n FTZeh)RHS(
th
=σ=
=⎟⎟⎠
⎞⎜⎜⎝
⎛δφ+⋅ν−=
∂∂
[ ] )R(h)x()x(FT
ez)x(f sMss
rrrr+δφ−δφ−=δ
σ
σ
Damping of axisymmetric mode in boundary
bufferrr >
Δb~102 ρe > 2⋅Lr seems okay, but will likely depend on magnitude of transport & correlation lengths
χe radial profile
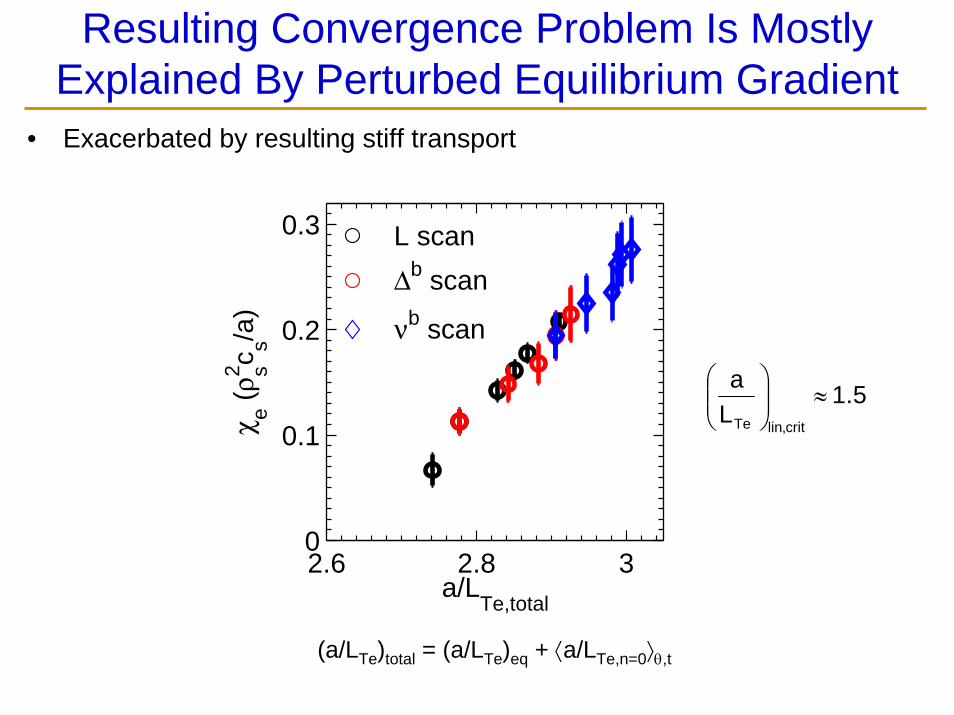
Resulting Convergence Problem Is Mostly Explained By Perturbed Equilibrium Gradient
• Exacerbated by resulting stiff transport
(a/LTe)total = (a/LTe)eq + ⟨a/LTe,n=0⟩θ,t
5.1La
crit,linTe
≈⎟⎟⎠
⎞⎜⎜⎝
⎛
2.6 2.8 30
0.1
0.2
0.3
a/LTe,total
χ e (ρ s2 c s/a
)
L scan
Δb scan
νb scan
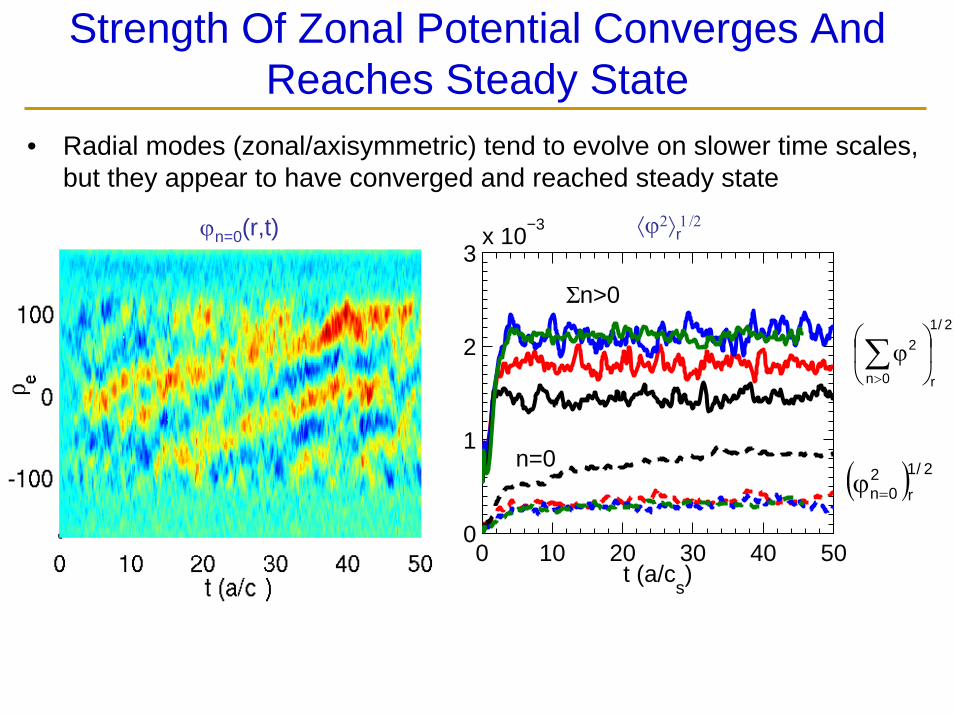
Strength Of Zonal Potential Converges And Reaches Steady State
• Radial modes (zonal/axisymmetric) tend to evolve on slower time scales, but they appear to have converged and reached steady state
0 10 20 30 40 500
1
2
3x 10
−3
t (a/cs)
n=0
Σn>02/1
r0n
2 ⎟⎠
⎞⎜⎝
⎛ϕ∑
>
( ) 2/1r
20n=ϕ
⟨ϕ2⟩r1/2ϕn=0(r,t)
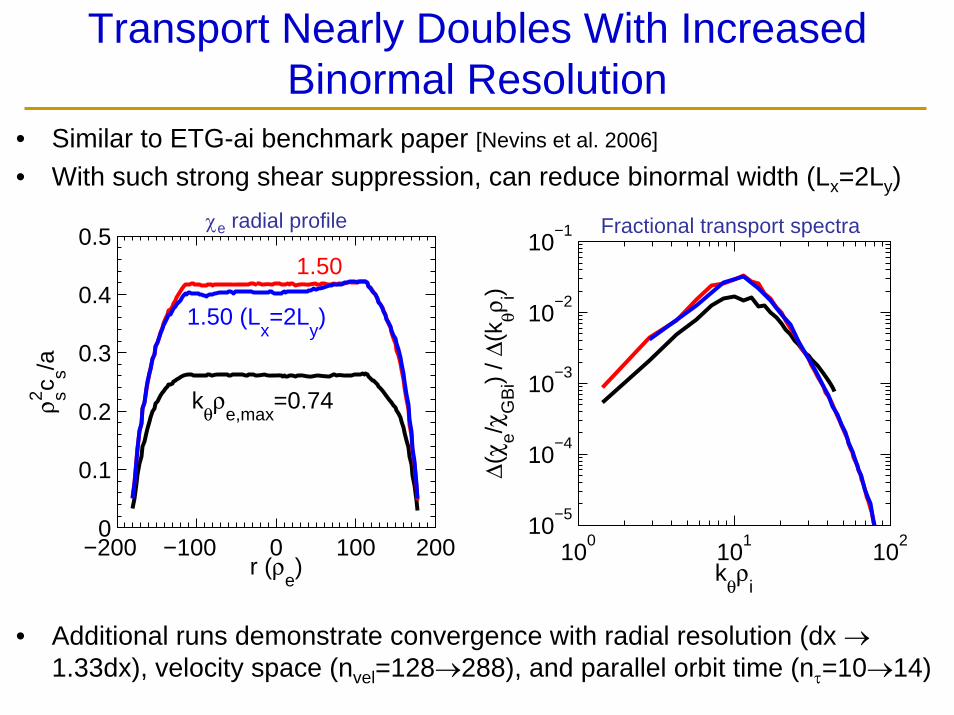
Transport Nearly Doubles With Increased Binormal Resolution
• Similar to ETG-ai benchmark paper [Nevins et al. 2006]
• With such strong shear suppression, can reduce binormal width (Lx=2Ly)
• Additional runs demonstrate convergence with radial resolution (dx →1.33dx), velocity space (nvel=128→288), and parallel orbit time (nτ=10→14)
−200 −100 0 100 2000
0.1
0.2
0.3
0.4
0.5
r (ρe)
ρ s2 c s/a
kθρ
e,max=0.74
1.50
1.50 (Lx=2L
y)
100
101
102
10−5
10−4
10−3
10−2
10−1
kθρ
i
Δ(χ e/χ
GB
i) / Δ
(kθρ i)
χe radial profile Fractional transport spectra
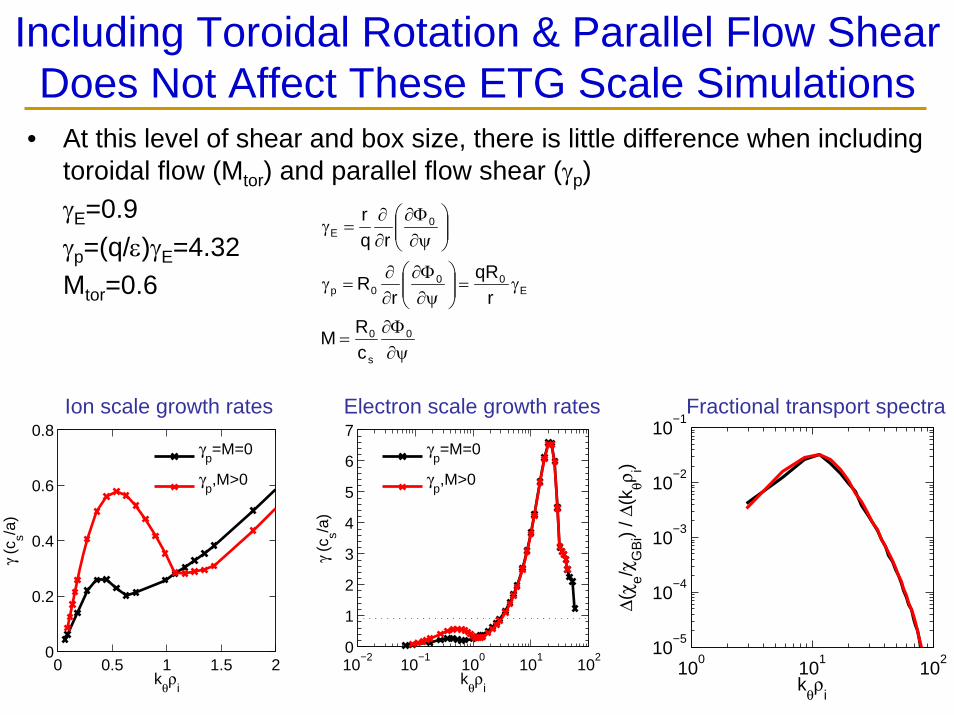
Including Toroidal Rotation & Parallel Flow Shear Does Not Affect These ETG Scale Simulations
• At this level of shear and box size, there is little difference when including toroidal flow (Mtor) and parallel flow shear (γp)γE=0.9γp=(q/ε)γE=4.32Mtor=0.6
100
101
102
10−5
10−4
10−3
10−2
10−1
kθρ
i
Δ(χ e/χ
GB
i) / Δ
(kθρ i)
0 0.5 1 1.5 20
0.2
0.4
0.6
0.8
kθρ
i
γ (c
s/a)
γp=M=0
γp,M>0
10−2
10−1
100
101
102
0
1
2
3
4
5
6
7
kθρ
i
γ (c
s/a)
γp=M=0
γp,M>0
ψ∂Φ∂
=
γ=⎟⎟⎠
⎞⎜⎜⎝
⎛ψ∂Φ∂
∂∂
=γ
⎟⎟⎠
⎞⎜⎜⎝
⎛ψ∂Φ∂
∂∂
=γ
0
s
0
E00
0p
0E
cRM
rqR
rR
rqr
Ion scale growth rates Electron scale growth rates Fractional transport spectra
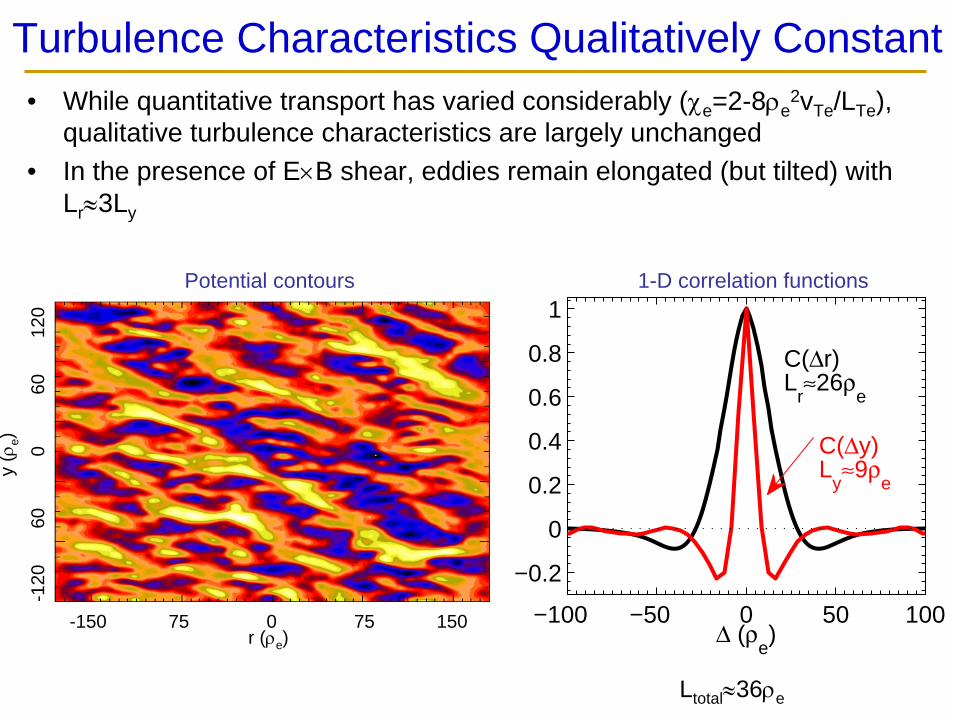
Turbulence Characteristics Qualitatively Constant• While quantitative transport has varied considerably (χe=2-8ρe
2vTe/LTe), qualitative turbulence characteristics are largely unchanged
• In the presence of E×B shear, eddies remain elongated (but tilted) with Lr≈3Ly
-150 75 0 75 150r (ρe)
y (ρ
e)
-120
60
0
60
120
−100 −50 0 50 100
−0.2
0
0.2
0.4
0.6
0.8
1
Δ (ρe)
C(Δr)L
r≈26ρ
e
C(Δy)L
y≈9ρ
e
Potential contours
Ltotal≈36ρe
1-D correlation functions
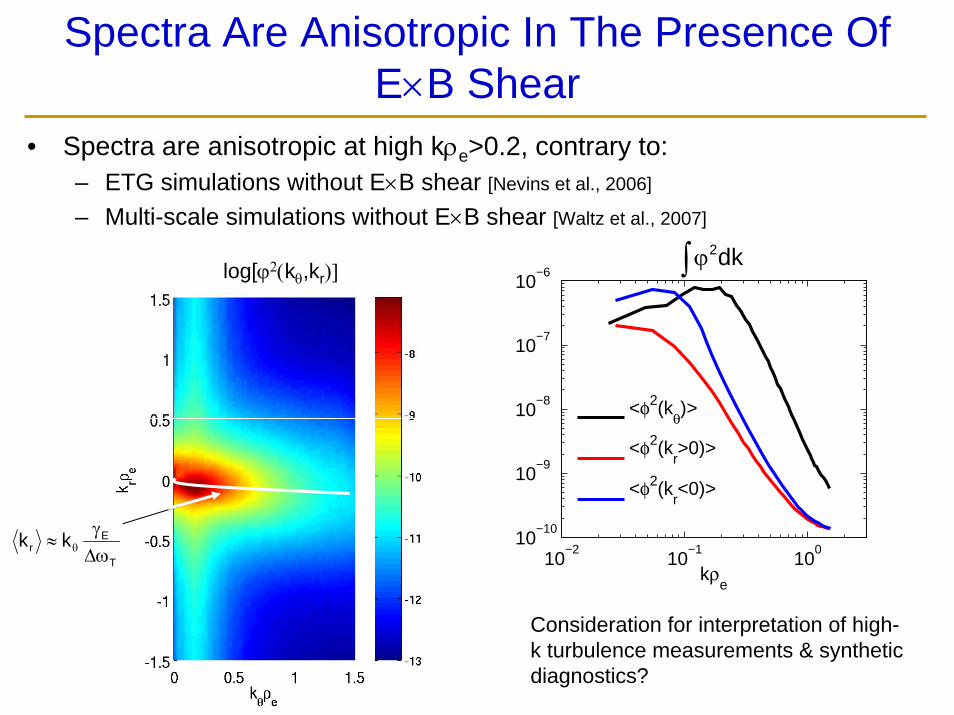
Spectra Are Anisotropic In The Presence Of E×B Shear
• Spectra are anisotropic at high kρe>0.2, contrary to:– ETG simulations without E×B shear [Nevins et al., 2006]
– Multi-scale simulations without E×B shear [Waltz et al., 2007]
10−2
10−1
100
10−10
10−9
10−8
10−7
10−6
kρe
<φ2(kθ)>
<φ2(kr>0)>
<φ2(kr<0)>
log[ϕ2(kθ,kr)] ∫ ϕ dk2
T
Er kk
ωΔγ
≈ θ
Consideration for interpretation of high-k turbulence measurements & synthetic diagnostics?
0 10 20 30 40 500
1
2
3
4x 10
−3
t (a/cs)
n=0
Σn>0
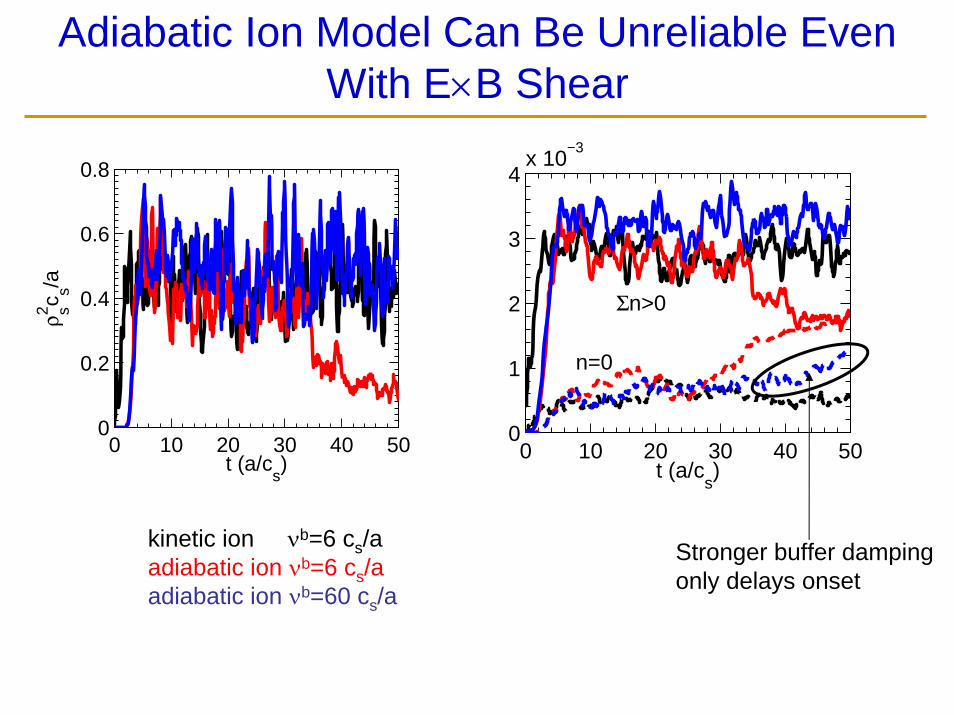
Adiabatic Ion Model Can Be Unreliable Even With E×B Shear
kinetic ion νb=6 cs/aadiabatic ion νb=6 cs/aadiabatic ion νb=60 cs/a
Stronger buffer dampingonly delays onset
0 10 20 30 40 500
0.2
0.4
0.6
0.8
t (a/cs)
ρ s2 c s/a
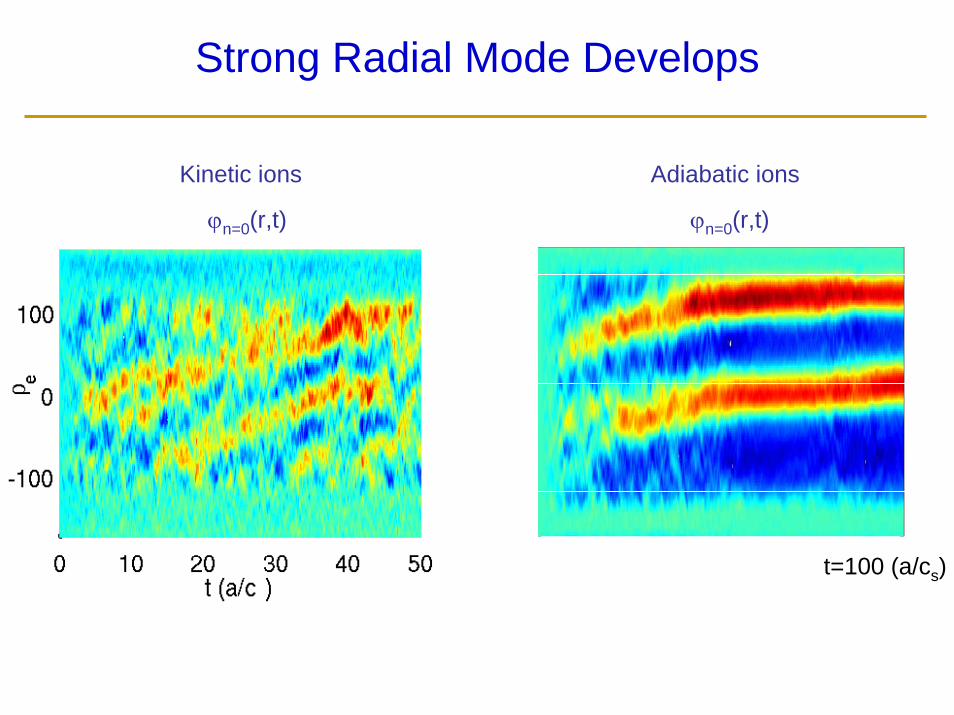
Strong Radial Mode Develops
ϕn=0(r,t) ϕn=0(r,t)
t=100 (a/cs)
Kinetic ions Adiabatic ions
While The Adiabatic Ion Model Can Be Unreliable It Has Been Used For An Initial Scan in s & q
• Earlier (naïve) simulations for comparable box size and resolution were run for varying magnetic shear and safety factor
• They used different boundary conditions and adaptive source (relatively strong, small perturbed gradients)
• None of the simulations exhibited the transition
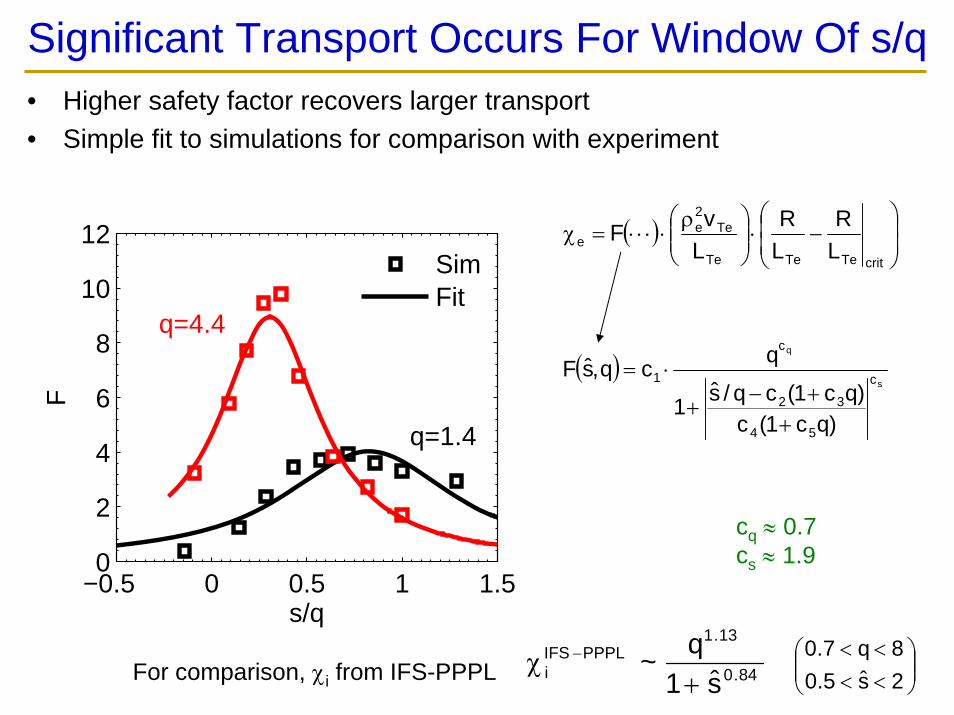
Significant Transport Occurs For Window Of s/q• Higher safety factor recovers larger transport• Simple fit to simulations for comparison with experiment
−0.5 0 0.5 1 1.50
2
4
6
8
10
12
s/q
F
q=1.4
q=4.4
SimFit
( )s
q
c
54
32
c
1
)qc1(c)qc1(cq/s1
qcq,sF
++−
+
⋅=
( )
cq ≈ 0.7cs ≈ 1.9
⎟⎟⎠
⎞⎜⎜⎝
⎛−⋅⎟⎟
⎠
⎞⎜⎜⎝
⎛ ρ⋅⋅⋅⋅=χ
critTeTeTe
Te2e
e LR
LR
LvF
84.0
13.1PPPLIFS
i s1q~+
χ −⎟⎟⎠
⎞⎜⎜⎝
⎛<<<<
2s5.08q7.0
For comparison, χi from IFS-PPPL
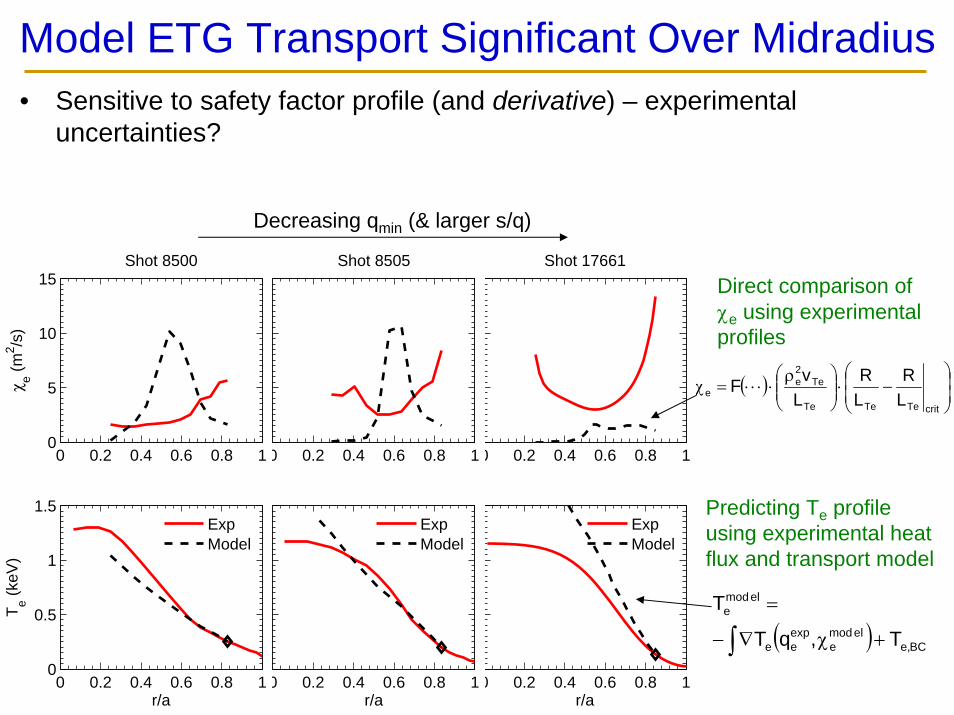
Model ETG Transport Significant Over Midradius• Sensitive to safety factor profile (and derivative) – experimental
uncertainties?
Decreasing qmin (& larger s/q)
( ) ⎟⎟⎠
⎞⎜⎜⎝
⎛−⋅⎟⎟
⎠
⎞⎜⎜⎝
⎛ ρ⋅⋅⋅⋅=χ
critTeTeTe
Te2e
e LR
LR
LvF
0 0.2 0.4 0.6 0.8 10
5
0
5Shot 17661
0 0.2 0.4 0.6 0.8 10
5
1
5
r/a
ExpModel
0 0.2 0.4 0.6 0.8 10
5
0
5Shot 8505
0 0.2 0.4 0.6 0.8 10
.5
1
.5
r/a
ExpModel
0 0.2 0.4 0.6 0.8 10
5
10
15
χ e (m
2 /s)
Shot 8500
0 0.2 0.4 0.6 0.8 10
0.5
1
1.5
r/a
Te (
keV
)
ExpModel
( ) BC,eelmod
eexpee
elmode
T,qT
T
+χ∇−
=
∫
Direct comparison of χe using experimental profiles
Predicting Te profile using experimental heat flux and transport model
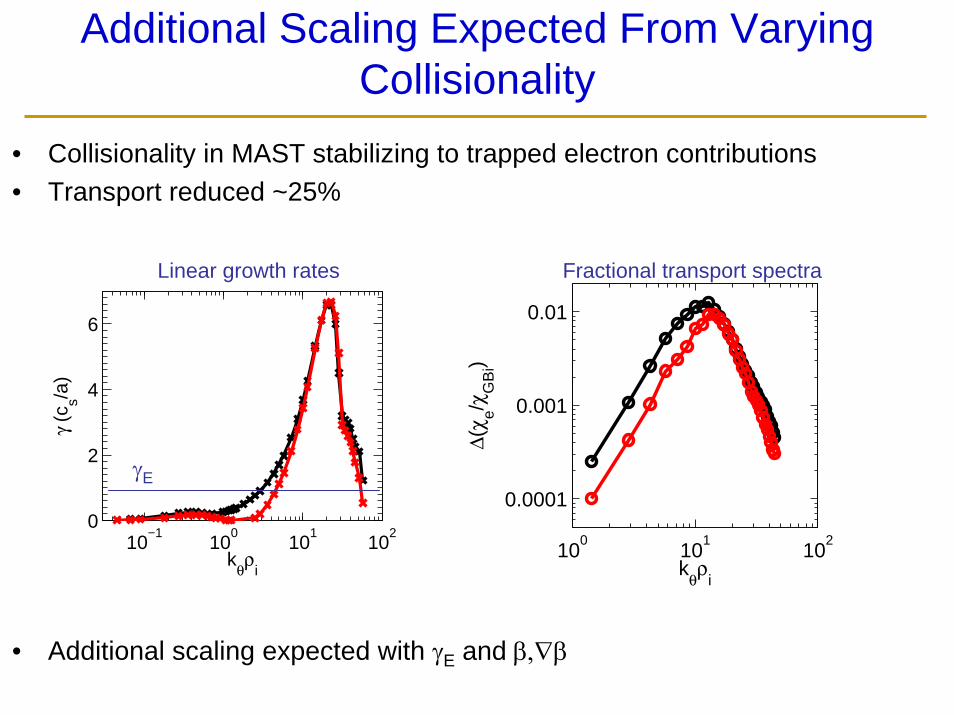
Additional Scaling Expected From Varying Collisionality
• Collisionality in MAST stabilizing to trapped electron contributions• Transport reduced ~25%
• Additional scaling expected with γE and β,∇β
100
101
102
0.0001
0.001
0.01
kθρ
i
Δ(χ e/χ
GB
i)
10−1
100
101
102
0
2
4
6
kθρ
i
γ (c
s/a)
Linear growth rates Fractional transport spectra
γE
Summary
• Demonstrating convergence of ETG simulations for large magnetic shear, important for spherical tokamak parameters
• Sensitive to simulation boundary (not using spectral flux tube representation)
• Adiabatic ion model with E×B shear can reproduce kinetic ion results, at least in some cases – expect larger disparity for reduced E×B shear (increased drive at ion scales)
• Initial simple transport model seems to recover similar behaviour to TGLF predictions (in one instance)

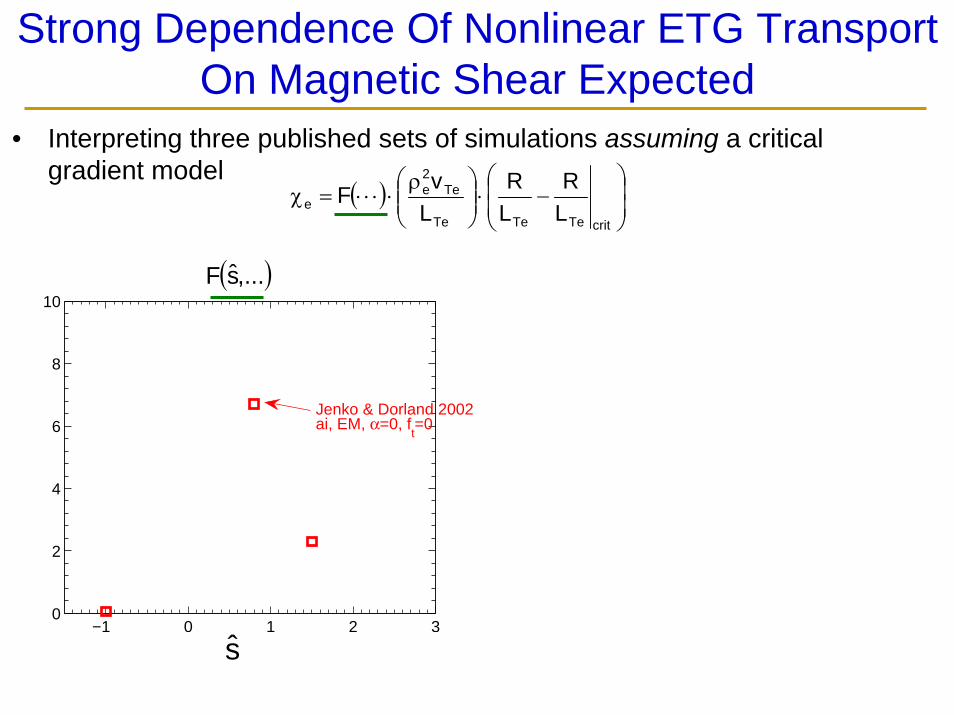
Strong Dependence Of Nonlinear ETG Transport On Magnetic Shear Expected
• Interpreting three published sets of simulations assuming a critical gradient model
( ) ⎟⎟⎠
⎞⎜⎜⎝
⎛−⋅⎟⎟
⎠
⎞⎜⎜⎝
⎛ ρ⋅⋅⋅⋅=χ
critTeTeTe
Te2e
e LR
LR
LvF
−1 0 1 2 30
2
4
6
8
10
Jenko & Dorland 2002ai, EM, α=0, f
t=0
( ),...sF
s
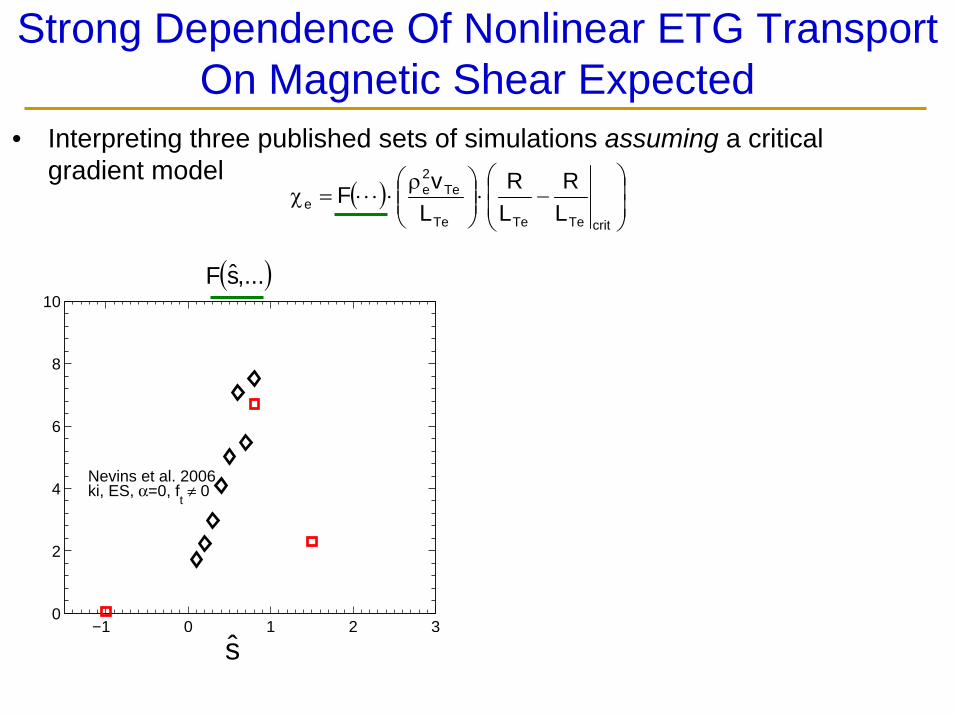
Strong Dependence Of Nonlinear ETG Transport On Magnetic Shear Expected
• Interpreting three published sets of simulations assuming a critical gradient model
( ) ⎟⎟⎠
⎞⎜⎜⎝
⎛−⋅⎟⎟
⎠
⎞⎜⎜⎝
⎛ ρ⋅⋅⋅⋅=χ
critTeTeTe
Te2e
e LR
LR
LvF
−1 0 1 2 30
2
4
6
8
10
Nevins et al. 2006ki, ES, α=0, f
t ≠ 0
( ),...sF
s
Strong Dependence Of Nonlinear ETG Transport On Magnetic Shear Expected
• Interpreting three published sets of simulations assuming a critical gradient model
( ) ⎟⎟⎠
⎞⎜⎜⎝
⎛−⋅⎟⎟
⎠
⎞⎜⎜⎝
⎛ ρ⋅⋅⋅⋅=χ
critTeTeTe
Te2e
e LR
LR
LvF
−1 0 1 2 30
2
4
6
8
10
Joiner et al. 2006MAST Eq. ψ
N = 0.4
ai/ki, EM, ft ≠ 0
MAST Eq.ψ
N = 0.8
( ),...sF
s
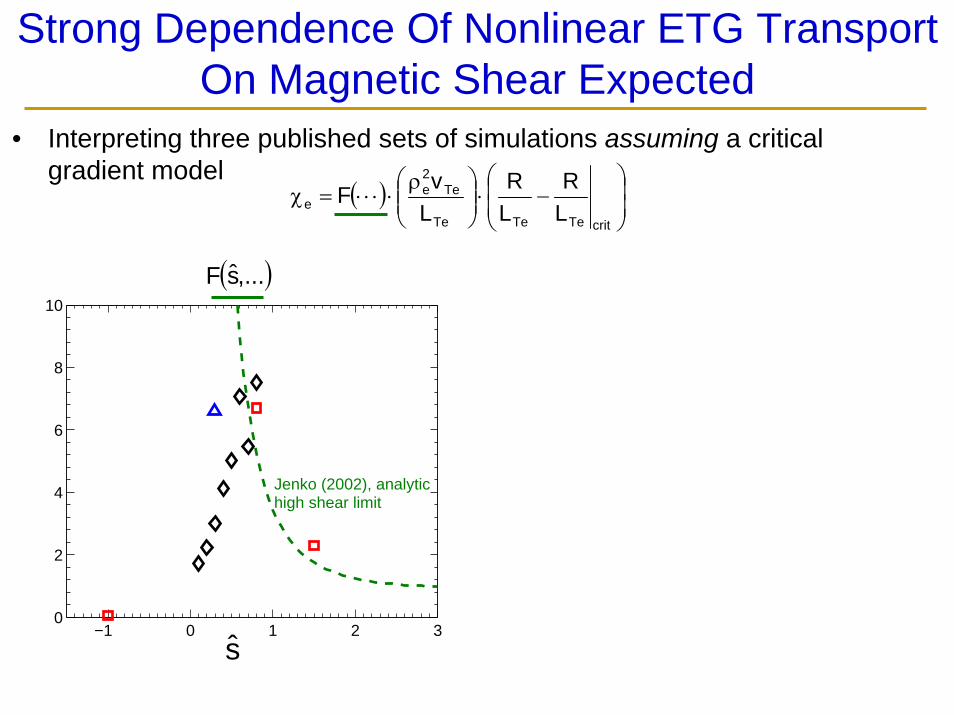
Strong Dependence Of Nonlinear ETG Transport On Magnetic Shear Expected
• Interpreting three published sets of simulations assuming a critical gradient model
( ) ⎟⎟⎠
⎞⎜⎜⎝
⎛−⋅⎟⎟
⎠
⎞⎜⎜⎝
⎛ ρ⋅⋅⋅⋅=χ
critTeTeTe
Te2e
e LR
LR
LvF
−1 0 1 2 30
2
4
6
8
10
Jenko (2002), analytichigh shear limit
( ),...sF
s
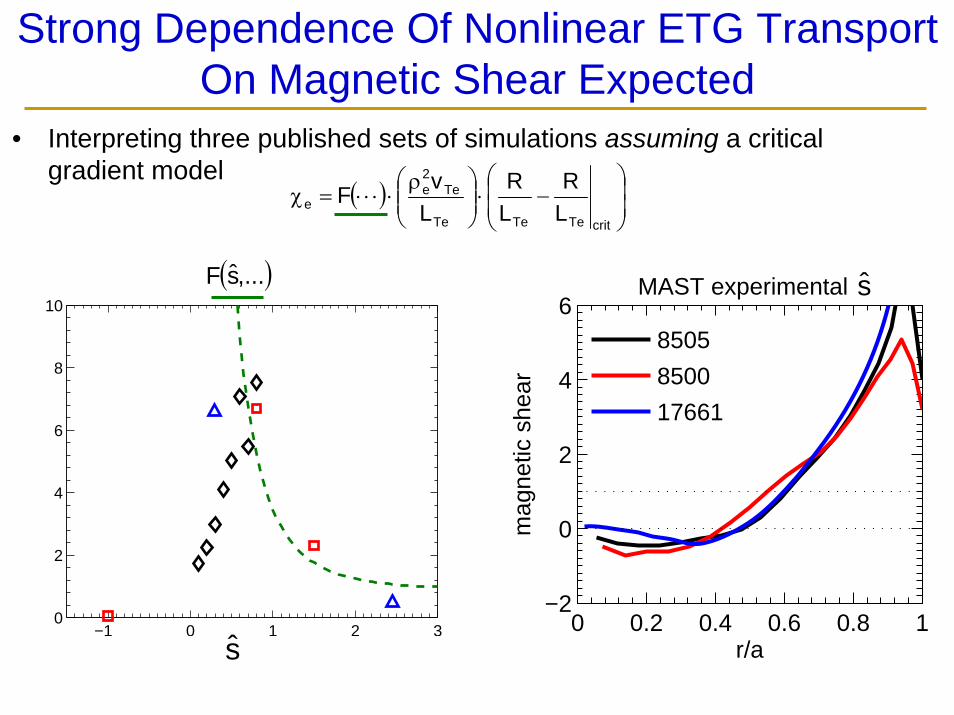
Strong Dependence Of Nonlinear ETG Transport On Magnetic Shear Expected
• Interpreting three published sets of simulations assuming a critical gradient model
( ) ⎟⎟⎠
⎞⎜⎜⎝
⎛−⋅⎟⎟
⎠
⎞⎜⎜⎝
⎛ ρ⋅⋅⋅⋅=χ
critTeTeTe
Te2e
e LR
LR
LvF
−1 0 1 2 30
2
4
6
8
10
( ),...sF
s0 0.2 0.4 0.6 0.8 1
−2
0
2
4
6
r/a
mag
netic
she
ar
8505
8500
17661
MAST experimental s
ST-ETG Modeling GoalsLinear stability
• Known linear dependence for low beta, modest shaping [Jenko et al. 2001]
• TGLF will hopefully capture modifications at high beta – benchmarking with GS2, GYRO, GKW is underway [motivated by Roach, EPS 2009]
0 0.5 1 1.5 20
0.1
0.2
0.3
0.4
0.5
kθρ
i
γ (v
Ti/a
)
GS2
GKW
GYRO
0 10 20 30 400
1
2
3
4
5
kθρ
i
γ (v
Ti/a
)
GS2
GKW
GYRO
−2 0 20
0.5
1
1.5
2
θ (rad)
|B|
−2 0 20
0.5
1
θ (rad)
ω∇B
(−), ωκ (−−)
−2 0 20
50
100
θ (rad)
k⊥2
GS2−EQDSK
GYRO−geq
GeometryVerification
GyrokineticVerification
MAST experimental case, mid-radius, EFIT equilibrium specification
Ion scale growth rates Electron scale growth rates