Embed Size (px)
Citation preview

A version of this paper will be presented at the Fifth Dubrovnik Conference on Sustainable Development of Energy, Water, and Environment Systems in Dubrovnik, Croatia, September 2009.
ERG/200906
Quantifying energy security: An Analytic Hierarchy Process approach
Larry Hughes, PhD Energy Research Group
Department of Electrical and Computer Engineering Dalhousie University
Halifax, Nova Scotia, Canada [email protected]
http://lh.ece.dal.ca/enen
6 May 2009

Quantifying energy security: An Analytic Hierarchy Process approach
Niki Sheth and Larry Hughes
Abstract
Energy security, unlike climate change, the other major energy-related challenge the world faces in the twenty-first century, cannot be easily measured. Greenhouse gases can be expressed in terms of their global warming potential, while the carbon intensities of carbon-based fuels associated with various anthropogenic activities are well known. The same cannot be said for energy security, as it exhibits qualitative rather than quantitative characteristics.
Despite this, ranking a jurisdiction’s different energy sources would give the public, policy-makers, and politicians a clearer understanding of the jurisdiction’s energy mix and the state of its energy security.
This paper presents a methodology which employs the multi-criteria decision analysis tool, Analytic Hierarchy Process (AHP), to produce an energy security index for each source making up a jurisdiction’s energy mix. The index, when used in conjunction with the consumption associated with each energy source, can also be displayed graphically, allowing the energy security state to be visualized.
1 Introduction
Over the past year, the world has witnessed a number of energy-related events such as the
spiking of crude oil prices, the ongoing Russia-Ukraine natural gas pipeline dispute, and
declining production from major world oil fields such as the North Sea and Cantarell (BP 2008).
These and other events have all contributed to the increasing importance of energy security
(the reliable supply of energy at an affordable price (IEA 2001)) to many jurisdictions and will
undoubtedly continue to do so into the future, given the volatility in world energy markets, the
growing competition for energy resources, and the need for economic development and
poverty reduction (World Bank 2005).
Greenhouse gases, the world’s other major energy-related challenge, can be measured
quantitatively in terms of their global warming potential and total emissions. The same cannot
be said for energy security, as it is a qualitative rather than a quantitative measurement.
However, if the different energy sources used by a jurisdiction could be ranked in terms of their
energy security, the general public, policy-makers, and politicians would be given a clearer
understanding of the jurisdiction’s energy mix and the state of its energy security

Sheth and Hughes: Quantifying energy security 2
This paper presents a methodology that employs the decision analysis tool, Analytic Hierarchy
Process (AHP), to rank a jurisdiction’s energy sources in terms of their relative energy security.
The methodology employs three criteria, supply, infrastructure, and affordability, which are
applied to the energy sources consumed by the jurisdiction or by energy services within the
jurisdiction. The result is a table of the energy sources and their quantitative rankings. The
methodology has been extended to include a visualization tool that produces a graphical
representation of the ranking and energy consumption of each energy sources.
The paper includes a detailed examination of the methodology and its implementation.
Examples of its application to two jurisdictions are presented. Other applications and
extensions of the tool are also discussed.
2 Analytic Hierarchy Process
Analytical Hierarchy Process (AHP) is a Multi-Criteria Decision Making (MCDM) technique
developed by Saaty in 1980, which decomposes a complex MCDM problem into a system of
hierarchies (Triantaphyllou 2000, Forman and Gass 2001). AHP is widely used in the field of
energy and environment, including such areas as energy policy analysis, electric power
planning, technology choice and project appraisal, energy utility operations and management,
energy-related environmental policy analysis, energy-related environmental control and
management (Zhou, Ang and Poh 2006). Simplicity, ease of understanding and the fact that
AHP decomposes a complex problem into a simple hierarchy, are some of the reasons for AHP’s
wide application in the field of energy and environmental modeling (Pohekar and
Ramachandran 2004, Wedley 1990).
AHP consists of four phases:
1. Decomposition, that is, construction of hierarchical structure,
2. Comparative judgment,
3. Consistency analysis, and
4. Final ranking of the alternatives.

Sheth and Hughes: Quantifying energy security 3
2.1 Phase 1: Decomposition
AHP decomposes a decision problem into a hierarchical structure consisting of three main
levels. The highest represents the overall goal of the decision making process. One or more
intermediate levels contain the decision criteria and any optional sub-criteria. The lowest one
consists of the decision alternatives. The hierarchical structure of the basic AHP model allows
dependencies among elements to exist between the levels of the hierarchy only; the direction
of impact is toward the top of the hierarchy (Buyukazici and Sucu 2003).
2.2 Phase 2: Comparative judgment
With the decision hierarchy formed, the decision-maker can develop relative weights—or
priorities—to rank each criterion and alternative. This begins with a pair-wise comparison of
the criteria; to assist in this process, Saaty developed a scale of 1 to 9 to perform pair-wise
comparisons, as shown in Table 1.
Table 1. Saaty’s pair-wise comparison table (Saaty and Alexander 1989)
Value Meaning
1 A and B are of equal importance
3 A is moderately or weakly more important than B
5 A is strongly more important than B
7 A is demonstrably or very strongly more important than B
9 A is extremely or absolutely more important than B
2, 4, 6, 8 Intermediate values
Reciprocals If activity i has one of the above numbers assigned to it when compared with activity j, then j has the reciprocal value when compared with i.
Fractions Only occur when a reciprocal ratio is obtained.
The first step is to perform pair-wise comparisons of the different criterion with respect to the
overall goal of the decision-making process and the results of the comparisons are entered into
a matrix. An activity is equally important when compared to itself, thus, each element in the
diagonal of the matrix has a value of 1. All other elements in the matrix must satisfy the
relation 𝑎𝑖 ,𝑗 =1
𝑎𝑗 ,𝑖. This matrix is the basic unit of the analysis and is called the “pair-wise
comparison matrix” or simply, “judgment matrix”.
Sheth and Hughes: Quantifying energy security 4
After the pair-wise comparison is completed, a vector of priorities is computed for the criteria.
Saaty suggests a number of ways in which the vector can be obtained (T. Saaty 1980); the
method adopted in this research is to multiply the n elements in each row and take the nth root
(the geometric mean) of the result. The resulting n-element vector is then normalized, giving
the priority vector.
Next, the alternatives undergo comparisons. If the comparisons are qualitative, the alternatives
are subject to pair-wise comparisons with respect to each criterion—as is done for the
criteria—creating a judgment matrix for each criterion. A vector of priorities is calculated from
the judgment matrix, as described in the previous paragraph. On the other hand, if the
comparisons are quantitative, the priority vector is obtained by summing the n values of the
alternatives and creating a normalized vector of the alternatives.
2.3 Phase 3: Consistency analysis
One of the major advantages of AHP is that it does not demand perfect consistency; it allows
inconsistency, while at the same time providing a measure of the inconsistency in each set of
comparative judgments. Inconsistencies can occur in the judgment matrix for a variety of
reasons, including absence of information, clerical error, and lack of concentration (Forman and
Gass 2001).
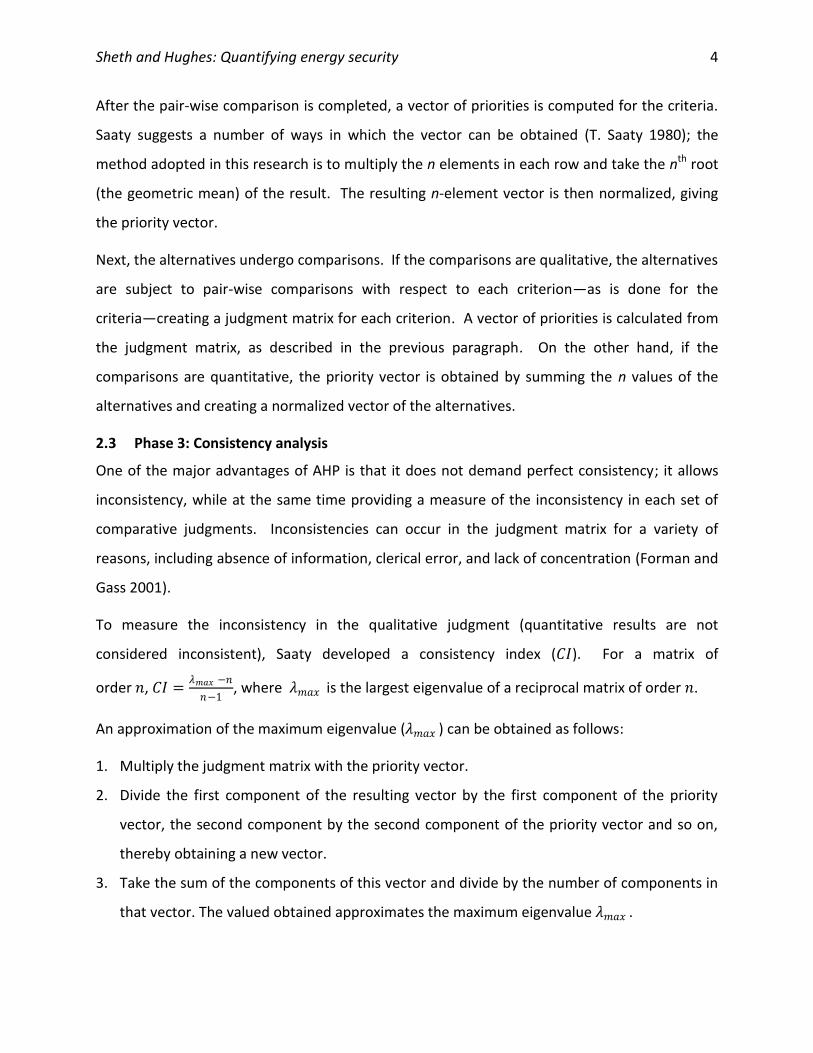
To measure the inconsistency in the qualitative judgment (quantitative results are not
considered inconsistent), Saaty developed a consistency index (𝐶𝐼). For a matrix of
order 𝑛, 𝐶𝐼 =𝜆𝑚𝑎𝑥 −𝑛
𝑛−1, where 𝜆𝑚𝑎𝑥 is the largest eigenvalue of a reciprocal matrix of order 𝑛.
An approximation of the maximum eigenvalue (𝜆𝑚𝑎𝑥 ) can be obtained as follows:
1. Multiply the judgment matrix with the priority vector.
2. Divide the first component of the resulting vector by the first component of the priority
vector, the second component by the second component of the priority vector and so on,
thereby obtaining a new vector.
3. Take the sum of the components of this vector and divide by the number of components in
that vector. The valued obtained approximates the maximum eigenvalue 𝜆𝑚𝑎𝑥 .

Sheth and Hughes: Quantifying energy security 5
The closer 𝜆𝑚𝑎𝑥 is to 𝑛 (the size of the matrix) the more consistent is the result.
The consistency analysis is completed by determining the consistency ratio (𝐶𝑅), the ratio of
the consistency index and the “random index”. The random index (𝑅𝐼) values for simulated,
random reciprocal matrices of different orders are shown in Table 2.
Table 2. Random Index values for matrices of different orders (Saaty and Alexander 1989)
Matrix order 1 2 3 4 5 6 7 8 9 10
Random Index 0.00 0.00 0.58 0.90 1.12 1.24 1.32 1.41 1.45 1.49
A consistency ratio of 0.10 (10 percent) is considered acceptable. Hence, avoiding large
inconsistencies in the judgment matrices, requires finding the 𝐶𝑅 for every judgment matrix. If
the value of 𝐶𝑅 is greater than 0.10, a return to the comparative judgment phase and a repeat
of the pair-wise comparisons until 𝐶𝑅 falls into the acceptable range is recommended.
2.4 Phase 4: Final ranking of the alternatives
If the criterion weights are denoted 𝐶𝑗 , and weight (or priority) for alternative 𝑖 with respect to
criterion 𝑗 is 𝐴𝑖 ,𝑗 , then the final priority of alternative 𝑖, 𝑃𝑖 , can be calculated from following
equation, 𝑃𝑖 = 𝐴𝑖 ,𝑗 × 𝐶𝑗𝑛𝑗=1 , where 𝑛 is the number of criteria.
The alternative with the highest priority value is considered to be the most suitable solution for
the decision problem, while the alternative with the lowest priority value is least appropriate
for that decision problem.
3 Quantifying Energy Security with AHP
The state of energy security in a particular service, sector, or jurisdiction is dictated by its
energy supplies, the cost of these supplies, and the infrastructure required to produce,
distribute, and possibly to store the energy for the consumer. Determining the influence of an
energy source on the energy security of a jurisdiction, or an energy service within the
jurisdiction, can be more subjective and not as easily quantifiable as identifying the greenhouse
gas emissions factor associated with the energy source. In its simplest form, an energy source
can be classified as either “secure” or “insecure”; however, this distinction can appear to be
arbitrary and without merit or basis. It may also hide the fact that one form of energy may
have “shades” of security, with some sources being more secure than others. Any methodology

Sheth and Hughes: Quantifying energy security 6
chosen to rank an energy source in terms of a jurisdiction’s energy security must be justifiable
and should not be jurisdiction-specific.
3.1 Objective
AHP is used to evaluate the different energy alternatives available to a jurisdiction and from
this, rank their contribution to the jurisdiction’s (or energy service’s) energy security. The
objective is to prioritize the energy sources for a given service or task in terms of how secure
they are deemed to be. Applying AHP to the criteria and alternatives will result in a relative
ranking of each energy source, in terms of its security, for the jurisdiction’s energy portfolio.
3.2 Criteria
The choice of criteria is dictated by the objective, which in this case deals with energy security.
Most definitions of energy security can be summarized as the supply of a reliable source of
energy at an affordable price. This suggests that energy security depends upon two criteria:
supply and price. However, since the supply criterion requires a supply of energy and
infrastructure to distribute the energy, it can be further decomposed into supply and
infrastructure, giving three criteria: supply, infrastructure, and price.
The judgment matrix for the criteria is created using the pair-wise comparison technique (i.e.,
qualitative ranking) discussed in section 2.2, with values obtained from Table 1. The criteria are
prioritized in accordance with their overall importance to the objective.
3.3 Alternatives
The alternatives are the different energy sources that can be used to meet the objective. They
are ranked by applying AHP’s qualitative (pair-wise) or quantitative (normalized) rules to the
alternatives for each criterion (i.e., supply, infrastructure, and price). The alternatives should
be specific to the objective; that is, some sources are not normally used to meet the energy
needs of a particular service (for example, low-temperature solar for transportation). The end
result is a relative ranking of the energy sources, from the most to the least secure for each
criterion.
The following guidelines are recommended when making the pair-wise comparisons of the
alternatives for each criterion:
Sheth and Hughes: Quantifying energy security 7
Supply. The state of the physical or actual supply of energy available for the service or task.
This is a qualitative value that takes into account the state of the resource, including
competition for the resource, its depletion rate, and any jurisdictional or political issues
associated with the resource. Supply can be discussed in terms of the amount available
currently or in the future; the timeline chosen must be applied to all criteria. The quantity or
consumption of supply is not considered here as it is addressed later.
Infrastructure. The infrastructure used to either produce the energy or deliver it to the
service or task. The results are influenced by such factors as the infrastructure’s capacity,
age, accessibility, and the distance between the supplier and the consumer, each of which
can be expressed quantitatively or qualitatively. As either the distance or the complexity of
the infrastructure rises, the security of the system can be decreased.
Price. The price paid for a unit of energy. Depending upon the objective’s service or task,
this may be subject to taxation or subsidies.
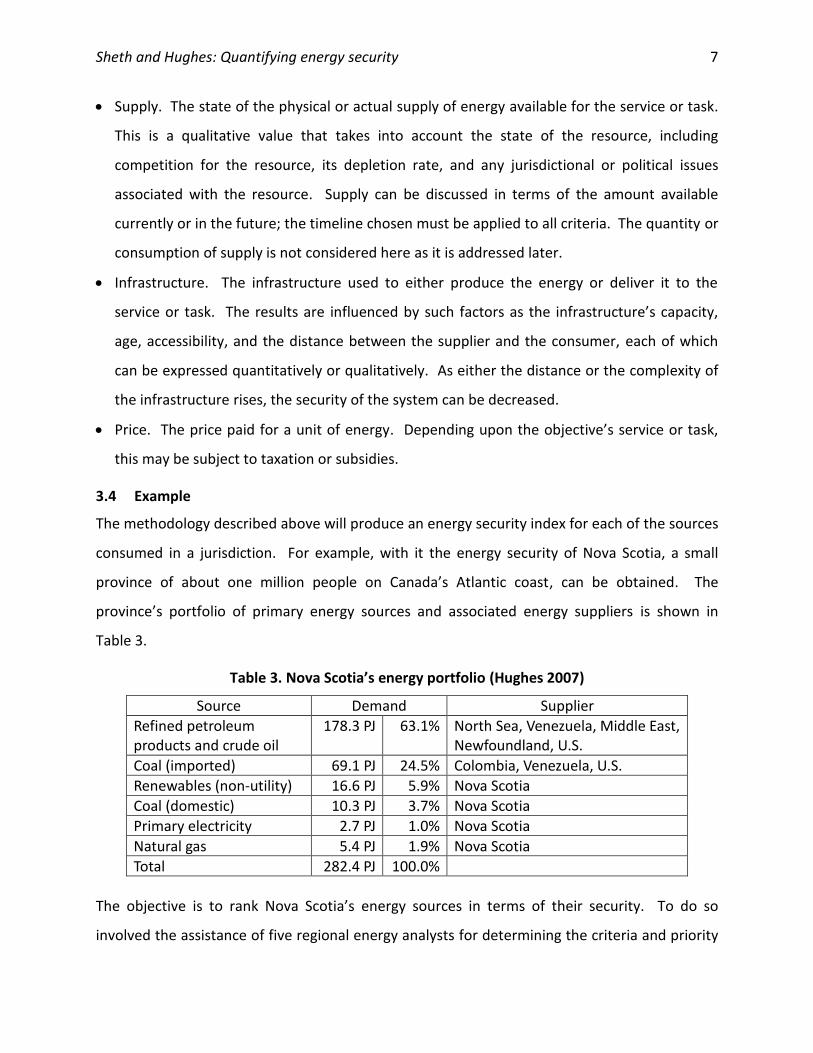
3.4 Example
The methodology described above will produce an energy security index for each of the sources
consumed in a jurisdiction. For example, with it the energy security of Nova Scotia, a small
province of about one million people on Canada’s Atlantic coast, can be obtained. The
province’s portfolio of primary energy sources and associated energy suppliers is shown in
Table 3.
Table 3. Nova Scotia’s energy portfolio (Hughes 2007)
Source Demand Supplier
Refined petroleum products and crude oil
178.3 PJ 63.1% North Sea, Venezuela, Middle East, Newfoundland, U.S.
Coal (imported) 69.1 PJ 24.5% Colombia, Venezuela, U.S.
Renewables (non-utility) 16.6 PJ 5.9% Nova Scotia
Coal (domestic) 10.3 PJ 3.7% Nova Scotia
Primary electricity 2.7 PJ 1.0% Nova Scotia
Natural gas 5.4 PJ 1.9% Nova Scotia
Total 282.4 PJ 100.0%
The objective is to rank Nova Scotia’s energy sources in terms of their security. To do so
involved the assistance of five regional energy analysts for determining the criteria and priority

Sheth and Hughes: Quantifying energy security 8
vectors. The results of the criteria rankings are shown in Table 4, with supply being the most
important and infrastructure the least.
Table 4. Ranking of the criteria
Supply Infrastructure Price
0.57 0.14 0.29
Next, the priority vectors of the energy sources (from Table 3) were identified in terms of each
criterion. Supply and infrastructure required pair-wise comparisons as they are qualitative,
while the price vector was obtained quantitatively. The total consumption associated with each
energy source was not included in the ranking process. Table 5 shows the results.
Table 5. Ranking of alternatives with respect to each criterion
Source Supply Infrastructure Price
Oil 0.10 0.20 0.11
Domestic coal 0.19 0.14 0.09
Imported coal 0.12 0.12 0.18
Natural gas 0.08 0.09 0.11
Hydroelectricity 0.32 0.25 0.36
Renewables 0.19 0.20 0.16
The final step was to calculate the energy security index for each source. This involved applying
the judgment matrix (Table 4) to the ranking of the alternatives (Table 5), producing the indices
shown in Table 6.
Table 6. Energy security index for each energy source
Source Index
Oil 0.12
Domestic coal 0.15
Imported coal 0.14
Natural gas 0.09
Hydroelectricity 0.32
Renewables 0.18
In this example, hydroelectricity is considered the most secure, followed by non-utility
renewables and domestic coal. Oil has a low ranking because most oil is imported into Nova
Scotia from outside Canada with only an estimated 20 percent from Canadian sources

Sheth and Hughes: Quantifying energy security 9
(Newfoundland and Labrador), while natural gas has limited infrastructure in Nova Scotia and
its supply is in decline (NEB 2007).
4 Visualizing Energy Security
The energy security ranking alone does not convey to the reader the importance of or reliance
on an energy source—this is because the amount of each energy source consumed is omitted
from the methodology. Combining consumption with the ranking, while not part of the AHP
process, can produce a better understanding of energy security. Although demonstrable in any
number of ways, the approach described here is to create a visualization tool that plots each
energy source on a graph, with the consumption or demand on the y-axis and the security
ranking on the x-axis. An example of the energy security graph for Nova Scotia, using the
results from the previous section, is shown in Figure 1.
Figure 1. The energy security index for Nova Scotia’s energy sources
The graph presents a visualization of the state of Nova Scotia’s energy security. It shows that,
for example, hydroelectricity is considered to be about 3.5 times more secure than natural gas,
although its contribution to Nova Scotia’s energy supply is about the same. The graph also
highlights the province’s overwhelming reliance on oil and imported coal—neither of which is
considered to be particularly secure. For the province to improve its energy security, efforts
must be made to reduce its dependence on these energy sources.
Oil
Domestic coal
Imported coal
Natural gas HydroRenewables
0
20
40
60
80
100
120
140
160
180
200
0.050 0.100 0.150 0.200 0.250 0.300 0.350
Sup
ply
(P
J)
Energy security index

Sheth and Hughes: Quantifying energy security 10
Other jurisdictions have been examined with the visualization tool. For example, the rankings
of Canada’s energy sources are shown in Figure 2.
Figure 2. The energy security index for Canada’s energy sources
Another benefit of the visualization tool is the ability to show the advantage of examining
energy security at a local level. For example, the above graph for Canada masks the fact that
most of eastern Canada relies on imports of oil and oil products; however, the graph for the
smaller region of Nova Scotia makes this abundantly clear.
5 Implementation
The methodology is implemented as a software tool in Excel and Visual Basic for Applications
(VBA) and consists of a series of spreadsheets, each handling one part of the AHP process:
creating the criteria, comparing the alternatives, obtaining the final ranking, and producing the
graphical visualization of the ranking. Excel and VBA were chosen as they allow the
manipulation of matrices. The software is available from the authors.
6 Discussion
We have made the ranking tool available to energy analysts and have used its result to explain
regional energy security issues to the general public and a number of politicians. Several
analysts found a challenge in adapting to Saaty’s pair-wise comparison rules shown in Table 1.
Solar, Earth
Crude (import)
Natural gas (import)
Coal (import)
Natural gas (domestic)
Renewables
Nuclear
Coal (domestic)
Hydro
Crude (domestic)
0
10,000
20,000
30,000
40,000
50,000
60,000
70,000
80,000
0.000 0.050 0.100 0.150 0.200 0.250
Sup
ply
(P
J)
Energy security index

Sheth and Hughes: Quantifying energy security 11
As well, doing the comparisons on paper beforehand, rather than at a computer, allowed for
easier adjustment of the input.
The tool is useful in that it illustrates the current state and understanding of energy security. It
permits the “what-if” type of questions to be answered; for example, “what if oil prices
double?” or “what if more natural gas infrastructure were to be built?” These queries can
stimulate debate and, importantly, act as a means to raise awareness of energy security and
how it can be improved, as well as the impact associated with doing nothing.
The results from the tool have also been useful in other areas of our research. For example, in
the development of energy wedges (Hughes 2009), the security of different energy sources can
be judged for their suitability or potential contribution as a wedge.
7 Concluding Remarks
Over the past decade, supply shortages, infrastructure failures, and volatile prices have made
energy security an issue in most, if not all, energy importing nations. As the need to improve
energy security slowly becomes apparent to the public, policymakers, and politicians, there is a
parallel need to improve the way in which it is presented to these groups. This paper has
offered a methodology whereby different energy sources used by a jurisdiction can be ranked
in terms of supply, infrastructure, and price. The results of the methodology can then be
combined with the jurisdiction’s consumption to obtain an energy security graph, permitting
the state of energy security in a jurisdiction to be visualized.
The tool used to support the methodology is the Analytic Hierarchy Process (AHP). Using AHP
to determine the relative energy security of a jurisdiction’s energy sources makes it possible to
compare various energy sources based on quantitative as well as qualitative criteria.
In addition to prioritizing a jurisdiction’s energy sources with the methodology, this paper has
also shown how the ranking can be presented graphically to allow a visualization of the
jurisdiction’s energy consumption.
The availability of the ranking tool is permitting other areas of research to be pursued; for
example:

Sheth and Hughes: Quantifying energy security 12
Analyzing the impact of distance and infrastructure on regional and local energy security
Considering alternative energy sources and how they could improve energy security
Examining energy security from a historical perspective
Projecting future energy security
We are also creating another version of the tool to allow a jurisdiction to rank its energy
security and its greenhouse gas emissions.
Acknowledgements
The authors would like to thank members of the Energy Research Group for their comments
and suggestions on this work.
References
BP. BP Statistical Review of World Energy. London: BP plc, 2008. Buyukazici, Murat, and Meral Sucu. "The Analytic Hierarchy and Analytic Network Processes."
2003, 65-73. Forman, E.H, and S.I Gass. The Analytic Hierarchy Process--An Exposition. Linthicum, Maryland:
Institute for Operations Research and the Management Sciences (INFORMS), 2001, 469-486. Hughes, Larry. Energy Security in Nova Scotia. Ottawa: Canadian Centre for Policy Alternatives,
2007. Hughes, Larry. "Energy wedges: A systematic way of addressing energy security and greenhouse
gas emissions." Dubrovnik, 2009. IEA. Toward a sustainable energy future. Paris: International Energy Agency, 2001. NEB. Canada's Energy Future: Reference Case and Scenarios to 2030. Calgary: National Energy
Board, 2007. Pohekar, S. D., and M. Ramachandran. "Application of multi-criteria decision making to
sustainable energy planning—A review." Renewable & sustainable energy review (Renewable and Sustainable Energy Reviews) 8, no. 4 (2004): 365-381.
Saaty, T., and J. Alexander. Conflict Resolution:The Analytic Hierarchy Process. Praeger, 1989. Saaty, T.L. The Analytic Hierarchy Process. McGraw-Hill, 1980. Triantaphyllou, E. Multi-Criteria Decision Making Methods: A Comparative Study. Dordrecht:
Kluwer Academic Publishers, 2000. Wedley, W. C. Combining Qualitative and Quantitative Factors - An Analytic Hierarchy
Approach. Socio-Economic Planning Sciences, 1990, 57-64. World Bank. Energy Security Issues. Moscow-Washington: World Bank, 2005. Zhou, P, P.W Ang, and K.L Poh. "Decision analysis in energy and environmental modeling: An
update." 2006, 2604-2622.