Embed Size (px)
Citation preview
City, University of London Institutional Repository
Citation: Popov, P. T., Netkachov, A. and Salako, K. ORCID: 0000-0003-0394-7833 (2014). Quantification of the Impact of Cyber Attack in Critical Infrastructures. Lecture Notes in Computer Science, 8696, pp. 316-327. doi: 10.1007/978-3-319-10557-4_35
This is the accepted version of the paper.
This version of the publication may differ from the final published version.
Permanent repository link: https://openaccess.city.ac.uk/id/eprint/4363/
Link to published version: http://dx.doi.org/10.1007/978-3-319-10557-4_35
Copyright: City Research Online aims to make research outputs of City, University of London available to a wider audience. Copyright and Moral Rights remain with the author(s) and/or copyright holders. URLs from City Research Online may be freely distributed and linked to.
Reuse: Copies of full items can be used for personal research or study, educational, or not-for-profit purposes without prior permission or charge. Provided that the authors, title and full bibliographic details are credited, a hyperlink and/or URL is given for the original metadata page and the content is not changed in any way.
City Research Online: http://openaccess.city.ac.uk/ [email protected]
City Research Online
A. Bondavalli et al. (Eds.): SAFECOMP 2014 Workshops, LNCS 8696, pp. 316–327, 2014. © Springer International Publishing Switzerland 2014
Quantification of the Impact of Cyber Attack in Critical Infrastructures
Oleksandr Netkachov, Peter Popov, and Kizito Salako
Centre for Software Reliability, City University London, UK {Oleksandr.Netkachov.1,P.T.Popov,K.O.Salako}@city.ac.uk
Abstract. In this paper we report on a recent study of the impact of cyber-attacks on the resilience of complex industrial systems. We describe our ap-proach to building a hybrid model consisting of both the system under study and an Adversary, and we demonstrate its use on a complex case study - a ref-erence power transmission network (NORDIC 32), enhanced with a detailed model of the computer and communication system used for monitoring, protec-tion and control. We studied the resilience of the modelled system under differ-ent scenarios: i) a base-line scenario in which the modelled system operates in the presence of accidental failures without cyber-attacks; ii) scenarios in which cyber-attacks can occur. We discuss the usefulness of our findings and outline directions for further work.
Keywords: Critical Infrastructures, Power Transmission Network, IEC 61850, stochastic modelling.
1 Introduction
Security of industrial control systems (ICS) used to control critical infrastructure (CI) has been extensively studied in the last few years by both industry and academia. Generally, the services offered by CI are somewhat robust with respect to single com-ponent failures of the underlying network. The reaction to multiple and cascading failures, however, is much harder to predict. Dependencies and interdependencies are an important source of risk and a significant factor in our uncertainty of risk assess-ment, particularly the risk due to cascading failures in which the rate and size of loss is amplified.
Although there are similarities between the ICS and the information and communi-cation technology (ICT) systems, important differences between the two exist [1]. High availability and real-time response to events in industrial systems make some defenses against cyber-attacks widely used in ICT (e.g. patching) inadequate for ICS.
The literature rarely acknowledges other differences between the ICT and ICS, which make the detection of failures/cyber-attacks in the ICS easier to achieve than in the ICT. The processes that an ICS controls are generally either directly observable or reliable methods for indirect measurement exist. For instance, whether a power gene-rator is connected to the power grid or not, is either directly observable or can be es-tablished reliably using sophisticated software tools such as state estimators.
Quantification of the Impact of Cyber Attack in Critical Infrastructures 317
The paper is organized as follows: In section 2 we state the problem of quantitative risk assessment studied in the paper. In section 3 we provide a description of the modeling framework, the approach we take to modeling cyber-attacks on ICS and a brief description of the case study used to illustrate the approach. Section 4 summa-rizes our findings, section 5 – the related research. Finally, section 6 concludes the paper and outlines directions for future research.
2 Problem Statement
In the past we developed a method for quantifying the impact of interdependencies between CI [2], which we called Preliminary Interdependency Analysis (PIA). PIA starts by a systematic search for CI interdependencies at a fairly high level of abstrac-tion; interdependencies which might otherwise be overlooked. In a separate study [3] we demonstrated that although using a high level of abstraction is useful, the risk assessment results are, in general, quite sensitive to the level of abstraction. PIA ac-knowledges this fact via a set of refinements in model building, which invite the mod-eller to create hybrid models of the modelled infrastructures and choose the level of modelling abstraction that suits the specific study. The software tools developed to support the PIA method allow the modeller to quickly build complex hybrid models which combine: i) stochastic models of the elements of the modelled system, which account for functional, spatial and other stochastic dependencies between these ele-ments, and ii) domain specific deterministic models, necessary in case a high fidelity analysis is sought. Such deterministic models, e.g. flow models, typically operate on a subset of modelled elements.
Cyber security of ICS has been a topic of active research recently (some important contributions are summarised in the Related Research section). Its practical impor-tance, the need for empirical studies and the difficulties with these have been widely recognised.
A common problem with cyber security research is that it concentrates on security incidents in the ICT/ICS, while the real impact of successful attacks is rarely quanti-fied. As a result, quantitative risk assessment is difficult. As we pointed out in the introduction, while such an approach is, to some extent, justified in ICT systems (for instance, how one assesses the impact of information theft is an open debate), with industrial systems the real impact of a cyber incident may be relatively easy to quan-tify. For instance, the impact of losing a generator in a power system as a result of a cyber-attack will vary between 0, in case other generators can provide additional power to compensate fully for the lost generator, to losses due to not supplying power to some consumers, in case the spare power generation capacity of the other genera-tors in the network is insufficient to meet the current power demand. PIA models are well suited for quantitative risk assessment as they model, stochastically, both the controlled plant and the ICS. So far, however, PIA has not been used to explicitly address cyber security concerns. Bridging this gap is the focus of this paper. We pro-pose to extend the PIA method by adding an Adversary model and building on the recent work by others in this direction, e.g. the ADVISE formalism [4].
318 O. Netkachov, P. Popov, and K. Salako
3 Solution
Due to a lack of space we concentrate on describing the extension of the PIA method. Technical details about the newly implemented simulation engine, used for resilience assessment of our chosen case study, the NORDIC 32 system, in the presence of cy-ber-attacks will be provided in separate publications.
3.1 The System under Study
We use a non-trivial case study of a power transmission network to demonstrate the analysis one can undertake with the extended PIA and to evaluate how well the method scales to realistically complex industrial systems.
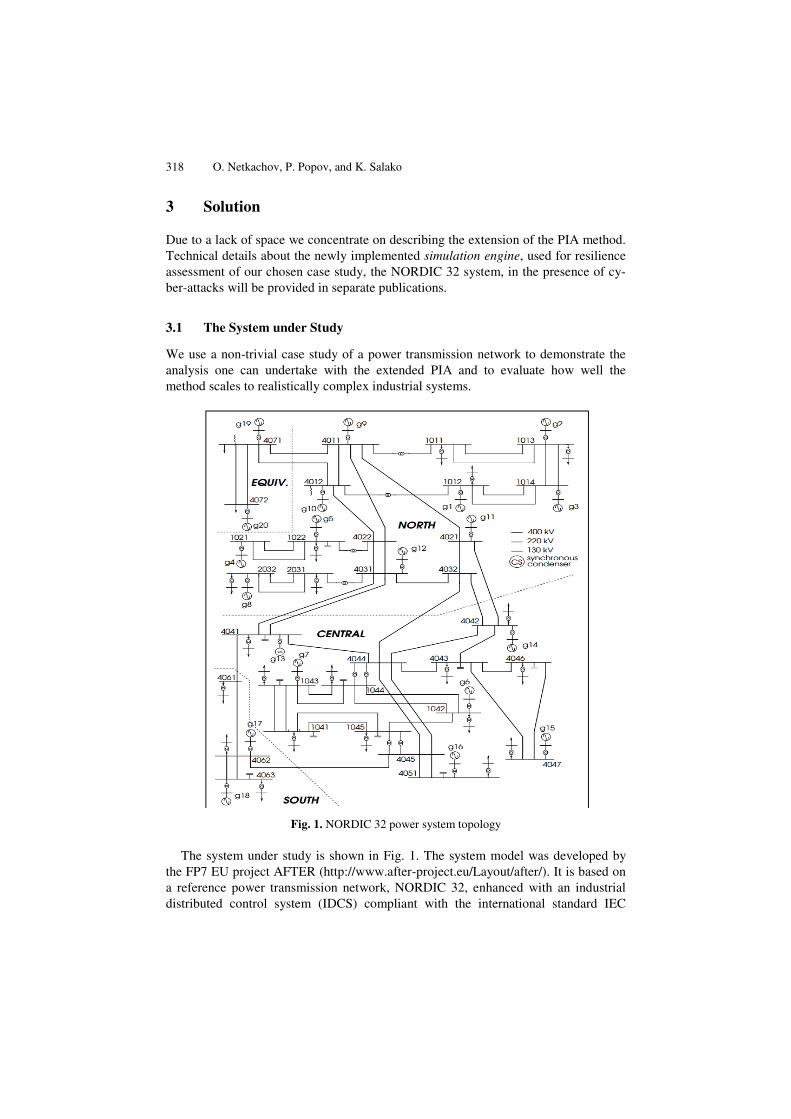
Fig. 1. NORDIC 32 power system topology
The system under study is shown in Fig. 1. The system model was developed by the FP7 EU project AFTER (http://www.after-project.eu/Layout/after/). It is based on a reference power transmission network, NORDIC 32, enhanced with an industrial distributed control system (IDCS) compliant with the international standard IEC
Quantification of the Impact of Cyber Attack in Critical Infrastructures 319
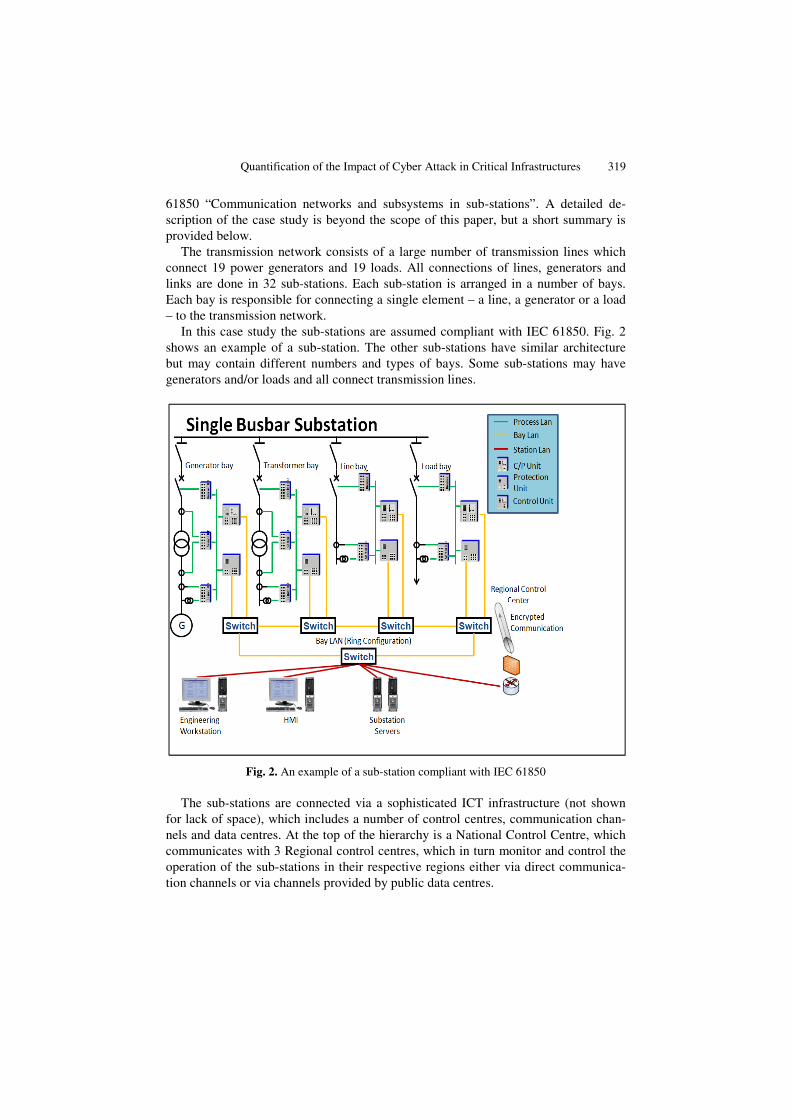
61850 “Communication networks and subsystems in sub-stations”. A detailed de-scription of the case study is beyond the scope of this paper, but a short summary is provided below.
The transmission network consists of a large number of transmission lines which connect 19 power generators and 19 loads. All connections of lines, generators and links are done in 32 sub-stations. Each sub-station is arranged in a number of bays. Each bay is responsible for connecting a single element – a line, a generator or a load – to the transmission network.
In this case study the sub-stations are assumed compliant with IEC 61850. Fig. 2 shows an example of a sub-station. The other sub-stations have similar architecture but may contain different numbers and types of bays. Some sub-stations may have generators and/or loads and all connect transmission lines.
Fig. 2. An example of a sub-station compliant with IEC 61850
The sub-stations are connected via a sophisticated ICT infrastructure (not shown for lack of space), which includes a number of control centres, communication chan-nels and data centres. At the top of the hierarchy is a National Control Centre, which communicates with 3 Regional control centres, which in turn monitor and control the operation of the sub-stations in their respective regions either via direct communica-tion channels or via channels provided by public data centres.
320 O. Netkachov, P. Popov, and K. Salako
Each bay is responsible for (dis)connecting one element from the transmission network. This is achieved by a set of elements – relays and electronic devices1 of the following two types – either a protection device or a control device. The function of the protection devices is to disconnect the power elements from the transmission net-work, e.g. as a result of overloading of a line or of a generator. The control devices, on the other hand, are used to connect or disconnect the power elements from the network and are typically used by either the operators in the respective control centres or by “special purpose software” (SPS) designed to undertake some of the operators’ functions automatically.
Each sub-station has a Local Area Network (LAN), which allows the local devices to communicate with each other. The LAN is protected from the rest of the world by a firewall (as shown by the “brick wall” in Fig. 2). Legitimate traffic in and out the sub-station is allowed, of course.
Each of the protection or control functions (with respect to the individual bays) is available whenever there exists a minimal cut set of available equipment supporting the function. A predicate defining minimal cut sets is provided with each function: some functions are achieved using functionally redundant components, others are not.
We model the entire system probabilistically, by building a stochastic state ma-chine for each element included in the system description. Each state machine has two states – “OK” and “Fail”. Depending on the element type, its model in addition to a state machine may include additional properties. For instance, the model of a genera-tor will have a property defining the maximum output power; the model of a load includes the power consumed as an additional property, etc. The interested reader may find further details in [2].
3.2 Modelling Cyber-Attacks
Now we describe an Adversary model, added to the model of the system. For the system under study, each sub-station has a dedicated firewall which iso-
lates the sub-station from the rest of the world. We assumed that an intrusion detec-tion/prevention system (IDS/IPS) would monitor the traffic in the sub-station’s LAN. When the IDS/IPS detects illegitimate traffic it blocks the Adversary from accessing the assets controlled through the sub-station’s LAN.
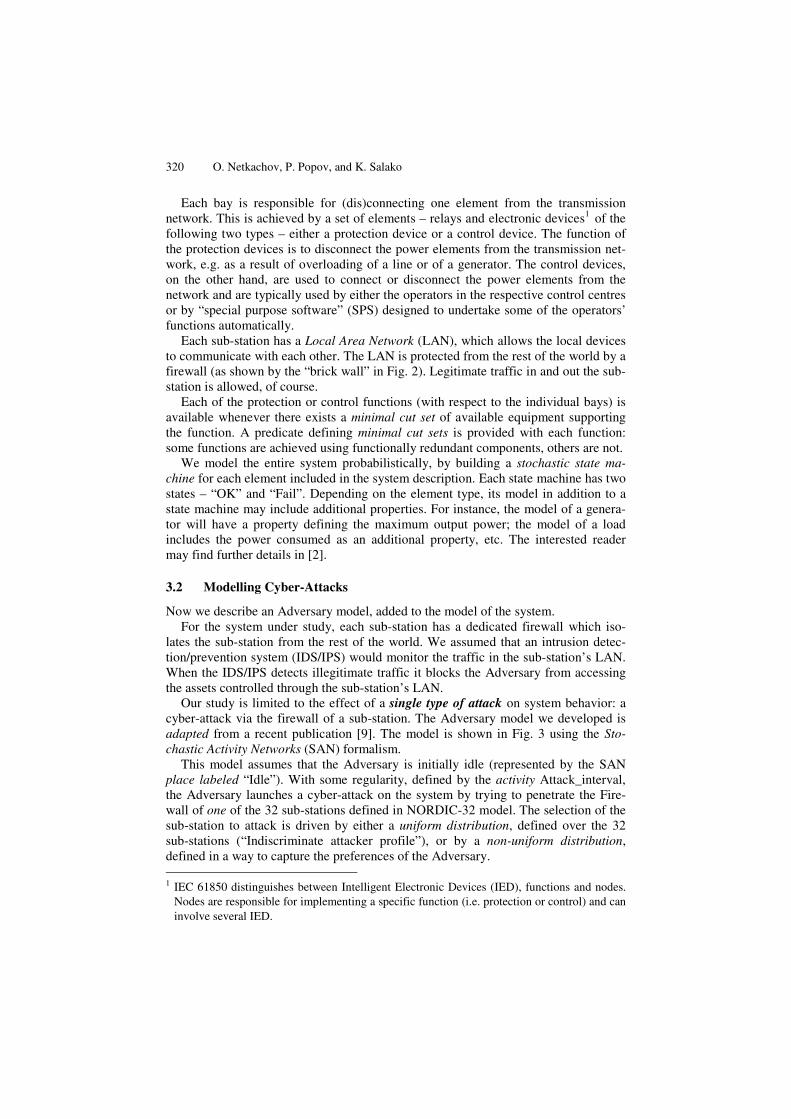
Our study is limited to the effect of a single type of attack on system behavior: a cyber-attack via the firewall of a sub-station. The Adversary model we developed is adapted from a recent publication [9]. The model is shown in Fig. 3 using the Sto-chastic Activity Networks (SAN) formalism.
This model assumes that the Adversary is initially idle (represented by the SAN place labeled “Idle”). With some regularity, defined by the activity Attack_interval, the Adversary launches a cyber-attack on the system by trying to penetrate the Fire-wall of one of the 32 sub-stations defined in NORDIC-32 model. The selection of the sub-station to attack is driven by either a uniform distribution, defined over the 32 sub-stations (“Indiscriminate attacker profile”), or by a non-uniform distribution, defined in a way to capture the preferences of the Adversary. 1 IEC 61850 distinguishes between Intelligent Electronic Devices (IED), functions and nodes.
Nodes are responsible for implementing a specific function (i.e. protection or control) and can involve several IED.
Quantification of the Impact of Cyber Attack in Critical Infrastructures 321
Fig. 3. Model of Adversary applied to NORDIC 32
We chose to model the preferences of the Adversary by setting the distribution over the set of sub-stations in such a way that the Adversary would prefer to attack either the largest generators or the largest loads (“major targets” profile). Under this profile we assumed that the Adversary is equally likely to switch off generators or loads and will never attempt to switch off a transmission line. Under the current mod-el we also assume that the firewalls of all sub-stations are equally easy/difficult to penetrate. In fact, the SAN model in Fig. 3 is a sub-model of our Adversary model: it does not include how our Adversary chooses a sub-station. Instead, this model shows the steps that follow the Adversary’s initial selection of a sub-station to attack:
─ The Adversary may target each of the firewall configuration rules. The decision of which rule to attack is modeled by the activity Firewall_attack. In Fig. 3 we assume that there are 4 rules to choose between, which is just an example. The model as-sumes that the rules are equally likely to be chosen by an attacker – the probabili-ties associated with the outputs of the Firewall_attack activity are all set to 0.25.
─ Once a rule is selected (modeled by the places Rule_1 – Rule_4), the Adversary spends time trying to break the selected rule, which is modeled by the activities At-tack_1 – Attack_4, respectively. This effort may be successful or unsuccessful. In the case of a failed attempt, the Adversary returns to an idle state and may launch another attack later, likely to be on a different sub-station.
─ In the case of a successful penetration through the firewall, the model enters the state “Penetrated”, which in turn has three alternative options for the Adversary to proceed: to switch off a generator (in case a bay exists in the sub-station, via which a generator is connected to the grid), to switch off a load (in case a bay exists in the sub-station via which a consumer is connected to the grid) or disconnect a line from the grid (selecting at random one of those controlled by the sub-station).
─ If the Adversary succeeds, she leaves the sub-station. In other words the Adversary under this model affects at most one bay per attack. This choice is modeled by the instantaneous activity Next_step, which returns the Adversary to the state “Idle”.
─ IDS/IPS is modeled by the activity IDS_detection, which is enabled if the model state is “Penetrated”. This activity competes with the activities selecting which bay
322 O. Netkachov, P. Popov, and K. Salako
will be targeted by the Adversary. The Adversary may be detected before she switches off a bay. As soon as the activity IDS_detection fires, the attack is aborted and the Adversary is returned to “Idle”.
A successful attack may trigger further activities in the system. For instance, any malicious switching-off of a bay may be “detected” when a new power flow calcula-tions is run. If so, via the respective control function, an attempt is made to reconnect those bays which have been disconnected by the Adversary.
In the presented Adversary model we assume that all timed activities are exponen-tially distributed. We studied the effect of the rates of some of these distributions on the selected utility function (discussed below).
4 Findings
4.1 Rewards
We were interested in measuring the effect of cyber-attacks on the system under study. We chose to compare the behavior of a base-line model, i.e. a model without cyber-attacks, with the behavior of the model in which cyber-attacks are enabled (“system under attack”). For the comparison we chose as a reward (utility function) the deviation of the supplied power, in the presence of failures and attacks, from the known maximum power supplied of 10,940 MW. This reward has been used in the analysis of power systems by others [9]. Other suitable candidates would be the size of cascades as we have done in the past [3]. We compute the reward at any state-machine event in the model and log these values during the simulations. Clearly, for every simulation run, the value of the supplied power varies over time to form a con-tinuous-time stochastic process. We study the following two statistics of this process:
─ The average power supplied during a simulation run. This would be lower than the maximum power. We selected, somewhat arbitrarily, the length of a simulation run to be the equivalent of 10 years of operation. The average over this period will vary between simulated runs, and we look at the distribution of this average over a number of runs.
─ The standard deviation of the power supplied during a simulation run, as a meas-ure of the variability of the supplied power. This statistic, too, varies between the simulation runs, and we look at the average over a number of simulation runs.
4.2 Studies
The studied system is non-trivial. It consists of more than 1500 modeling elements. With the chosen parameterization, based on input from domain experts, we observed a significant number (~7000 … 32,000) of events over a single simulation run. Many of these events require power flow calculations and control optimizations, which take considerable time to complete. As a result, a single simulation run takes approximate-ly 5 min to complete. Obtaining results with high confidence would require a large
Quantification of the Impact of Cyber Attack in Critical Infrastructures 323
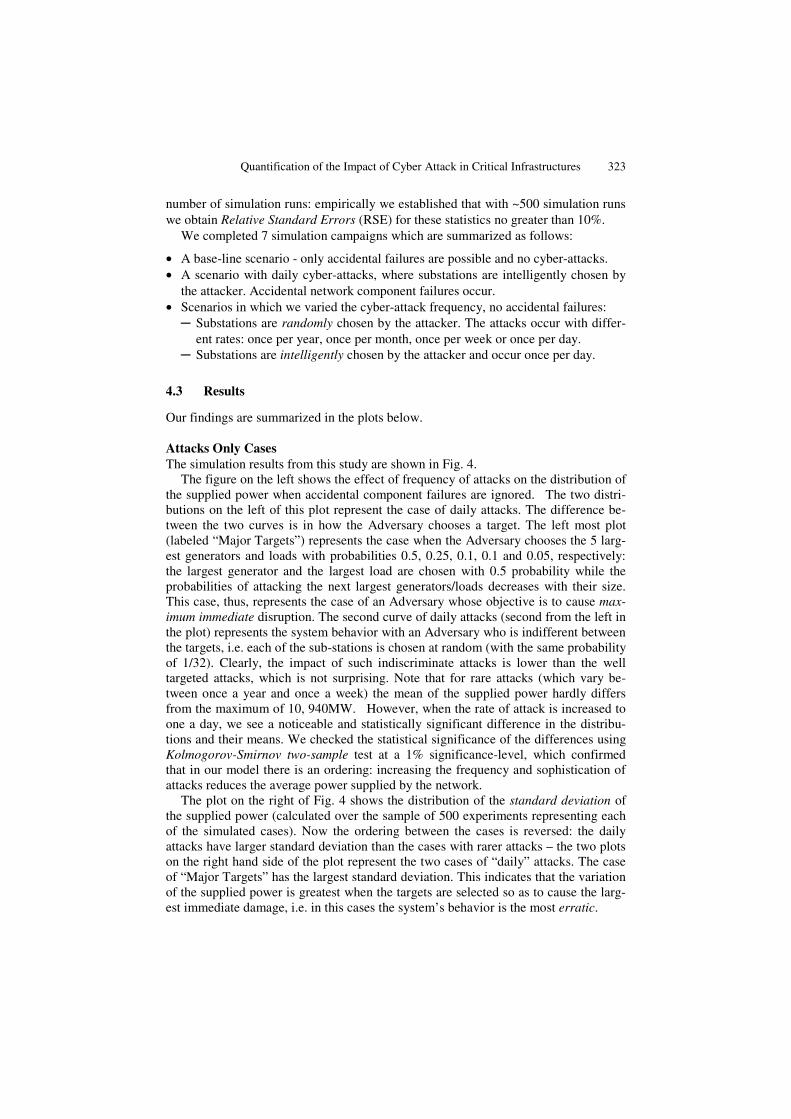
number of simulation runs: empirically we established that with ~500 simulation runs we obtain Relative Standard Errors (RSE) for these statistics no greater than 10%.
We completed 7 simulation campaigns which are summarized as follows:
• A base-line scenario - only accidental failures are possible and no cyber-attacks. • A scenario with daily cyber-attacks, where substations are intelligently chosen by
the attacker. Accidental network component failures occur. • Scenarios in which we varied the cyber-attack frequency, no accidental failures: ─ Substations are randomly chosen by the attacker. The attacks occur with differ-
ent rates: once per year, once per month, once per week or once per day. ─ Substations are intelligently chosen by the attacker and occur once per day.
4.3 Results
Our findings are summarized in the plots below.
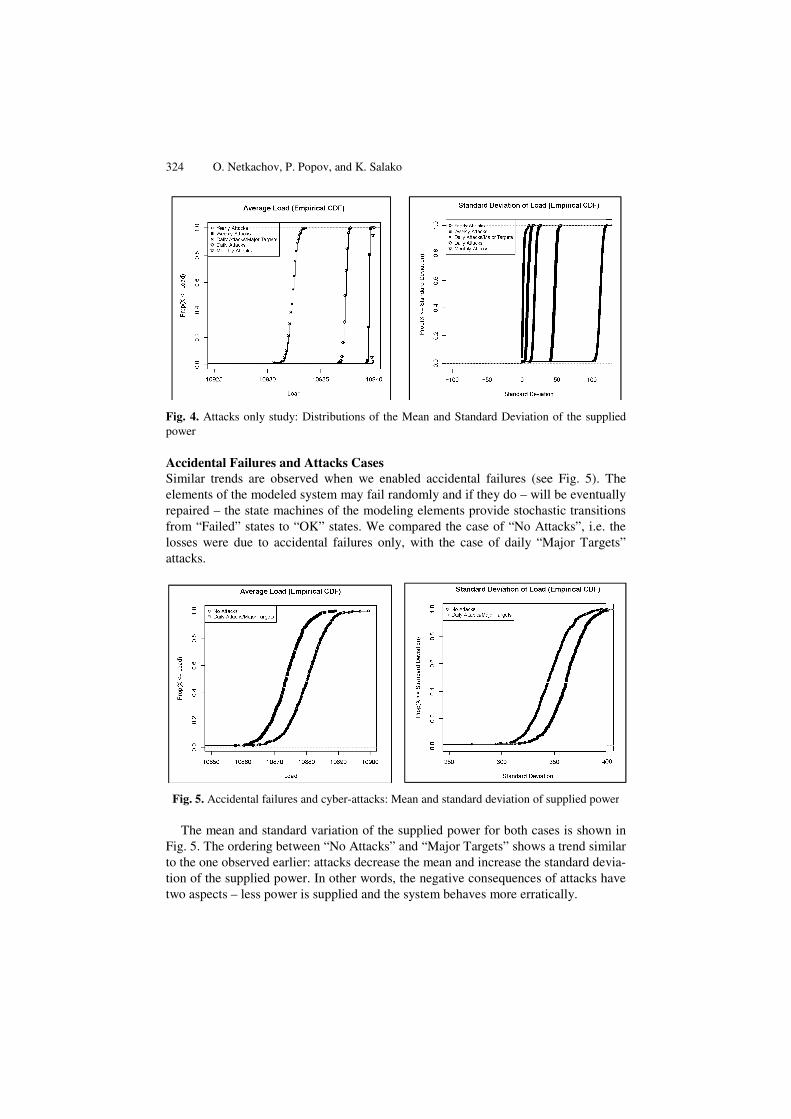
Attacks Only Cases The simulation results from this study are shown in Fig. 4.
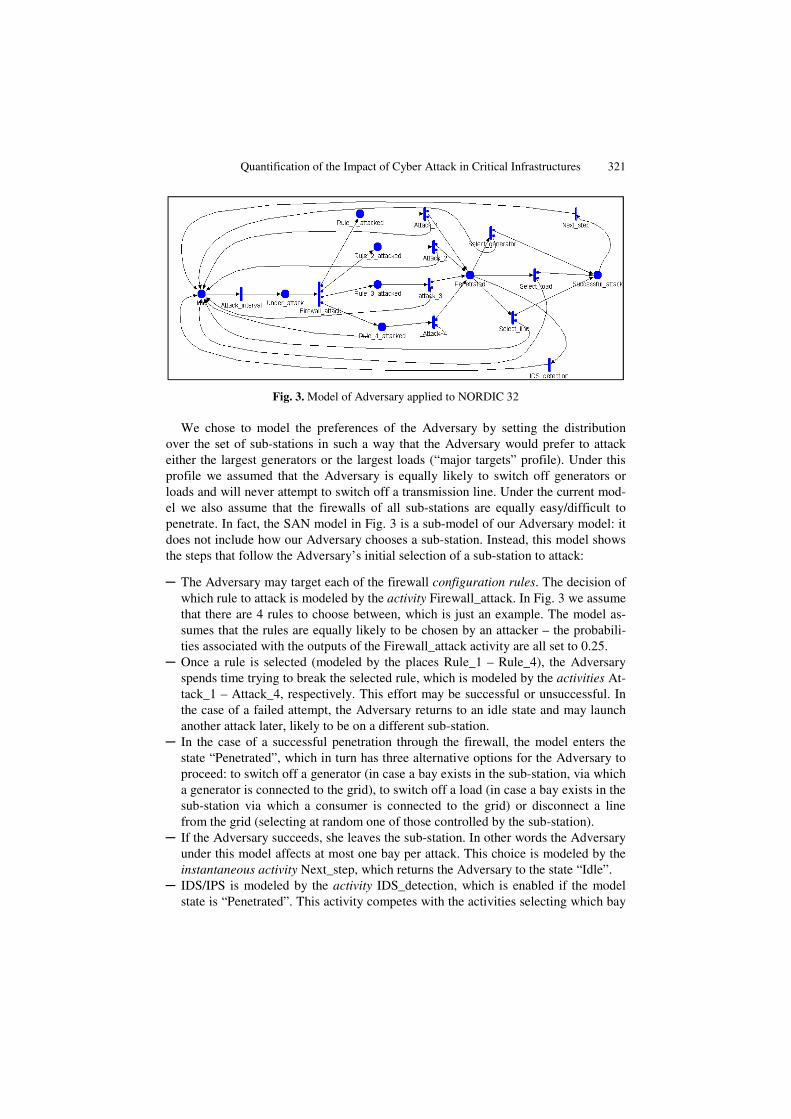
The figure on the left shows the effect of frequency of attacks on the distribution of the supplied power when accidental component failures are ignored. The two distri-butions on the left of this plot represent the case of daily attacks. The difference be-tween the two curves is in how the Adversary chooses a target. The left most plot (labeled “Major Targets”) represents the case when the Adversary chooses the 5 larg-est generators and loads with probabilities 0.5, 0.25, 0.1, 0.1 and 0.05, respectively: the largest generator and the largest load are chosen with 0.5 probability while the probabilities of attacking the next largest generators/loads decreases with their size. This case, thus, represents the case of an Adversary whose objective is to cause max-imum immediate disruption. The second curve of daily attacks (second from the left in the plot) represents the system behavior with an Adversary who is indifferent between the targets, i.e. each of the sub-stations is chosen at random (with the same probability of 1/32). Clearly, the impact of such indiscriminate attacks is lower than the well targeted attacks, which is not surprising. Note that for rare attacks (which vary be-tween once a year and once a week) the mean of the supplied power hardly differs from the maximum of 10, 940MW. However, when the rate of attack is increased to one a day, we see a noticeable and statistically significant difference in the distribu-tions and their means. We checked the statistical significance of the differences using Kolmogorov-Smirnov two-sample test at a 1% significance-level, which confirmed that in our model there is an ordering: increasing the frequency and sophistication of attacks reduces the average power supplied by the network.
The plot on the right of Fig. 4 shows the distribution of the standard deviation of the supplied power (calculated over the sample of 500 experiments representing each of the simulated cases). Now the ordering between the cases is reversed: the daily attacks have larger standard deviation than the cases with rarer attacks – the two plots on the right hand side of the plot represent the two cases of “daily” attacks. The case of “Major Targets” has the largest standard deviation. This indicates that the variation of the supplied power is greatest when the targets are selected so as to cause the larg-est immediate damage, i.e. in this cases the system’s behavior is the most erratic.
324 O. Netkachov, P. Pop
Fig. 4. Attacks only study: Dipower
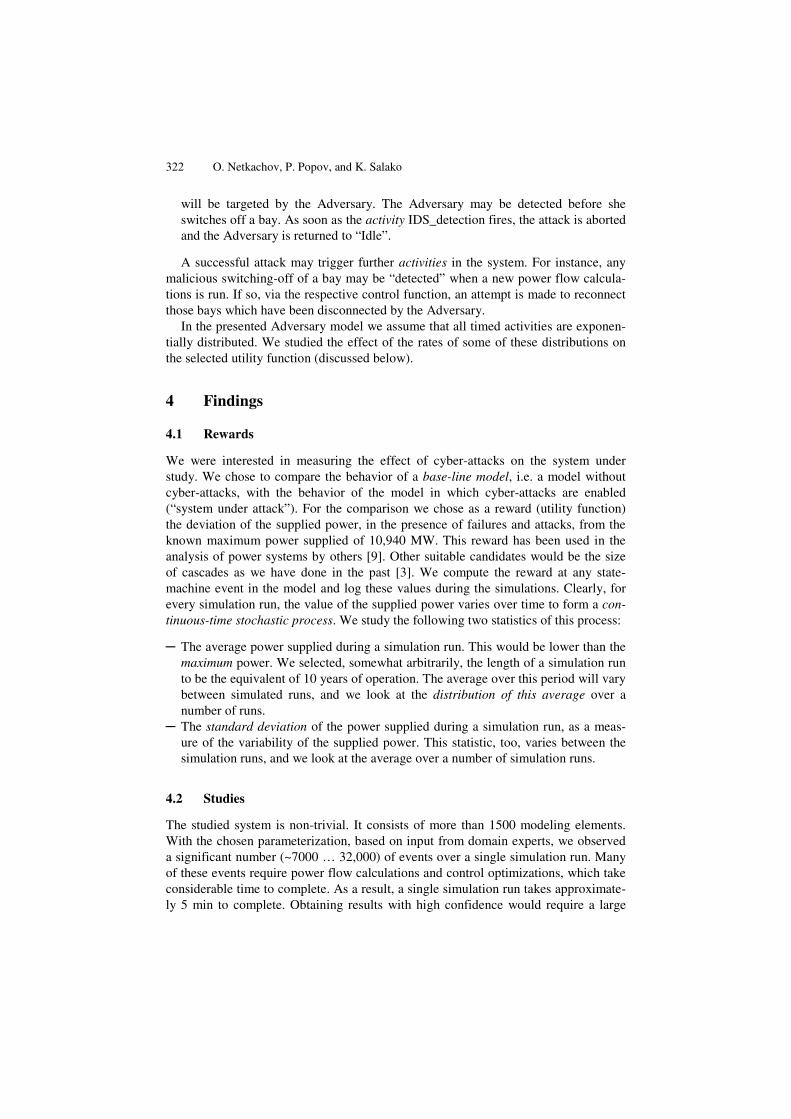
Accidental Failures and ASimilar trends are observeelements of the modeled syrepaired – the state machinfrom “Failed” states to “OKlosses were due to accidenattacks.
Fig. 5. Accidental failures an
The mean and standard Fig. 5. The ordering betweeto the one observed earlier: tion of the supplied power. two aspects – less power is
pov, and K. Salako
istributions of the Mean and Standard Deviation of the supp
Attacks Cases ed when we enabled accidental failures (see Fig. 5). Tystem may fail randomly and if they do – will be eventuanes of the modeling elements provide stochastic transitiK” states. We compared the case of “No Attacks”, i.e. ntal failures only, with the case of daily “Major Targe
nd cyber-attacks: Mean and standard deviation of supplied pow
variation of the supplied power for both cases is shownen “No Attacks” and “Major Targets” shows a trend simattacks decrease the mean and increase the standard devIn other words, the negative consequences of attacks hsupplied and the system behaves more erratically.
plied
The ally ions the
ets”
wer
n in milar
via-have
Quantification of the Impact of Cyber Attack in Critical Infrastructures 325
5 Related Research
Different aspects of SCADA system security have been studied extensively. Influential reports by both the Department of Homeland Security [8] and the Na-
tional Institute of Standards and Technology (NIST) [1] provide a comprehensive discussion of current SCADA architectures and best practice approaches for their security.
Stochastic models have been used in the past to address, specifically, the cyber se-curity of industrial control systems. For instance, Ten et. al [9] offer a model based on stochastic Petri nets, adapted for cyber security on power transmission systems. The study is similar to ours, except that Ten et. al do not provide a base line study and primarily concentrate on cyber-attacks under a fixed model parameterisation.
The ADVISE formalism [4] offers an alternative approach to stochastic modelling of a rational Adversary. The utility function used by ADVISE is computed based on the preferences of an adversary and on the likelihood of an attack being detected. The modelling approach allows for non-determinism – in terms of an outcome of a par-ticular step in an attack – but any decision that the adversary would need to take during the attack is driven by her preferences, defined in the model statically. The formalism allows one to study one attacker and attack-strategy at a time; comparison of the impact of multiple, different attackers and attack-strategies requires building separate models and studies.
An interesting approach to modelling an adaptive adversary is developed by Marti-nelli et al [10]. The key idea there is captured by a graph describing the steps that an adversary could take, including “stepping back” in case of unsuccessful attack.
Nash equilibrium has recently become popular in cyber security research, e.g. [11]. The ideal of Nash equilibrium is attractive as it establishes, under fairly broad as-sumptions, the existence of the worst consequences from cyber-attacks without hav-ing to define, in detail, the attacks in specific contexts.
6 Conclusions
We described an approach to stochastic modelling of industrial control systems in which both accidental failures and cyber-attacks are treated in a unified way:
─ accidental failures of the elements of the systems are modelled as stochastic state machines which allow the modeller to chose the right level of modelling abstrac-tion (by selecting the most appropriate state machine);
─ malicious behaviour of an Adversary (i.e. cyber-attacks) are modelled by stochastic state machines too, and these capture the behaviour of an adversary (their knowl-edge/preferences about the assets under attack);
─ the dependencies between the behaviour of the modelled elements – including accidental failures and the effects of successful cyber-attacks – are modelled via a set of additional models that are either deterministic – such as power flows – or probabilistic – e.g. stochastic dependencies between the elements of the system.
326 O. Netkachov, P. Popov, and K. Salako
We illustrated our approach on a non-trivial case study and report on the initial findings from a useful sensitivity analysis: we studied the effect, on system resilience, of varying model parameters of different threats and defenses. More specifically, we confirm that indiscriminate poorly prepared cyber-attacks will have negligible effect while attacks launched by a highly knowledgeable adversary – one capable of target-ing the most critical components of power systems (large generators and consumers) – can cause significant disruption.
Our approach allows one to explore the space of possible defenses, if necessary in-creasing the level of detail. For instance, we could explore the possibility of deploying IDS/IPS with different coverage in the different sub-stations. One would expect that higher coverage should be associated with assets which are highly critical, but under-taking detailed modeling will allow one to be more precise in stating how much better these IDS/IPS should be in order for the negative impact of cyber-attacks to be mini-mized to an acceptable level.
We chose a simple attack to illustrate the approach. Extending the work to more sophisticated scenarios of attacks is straightforward. Each new attack would require a new state machine, which would define the steps of an Adversary in launching an attack, a relatively simple task. A more interesting scenario would involve distributed attacks by an intelligent adversary.
We envisage extending the work in a number of ways. Expanding the work model-ing adversaries at the same level of abstraction, i.e. ignoring the specifics of the com-munication protocols used in the ICS. A number of attack scenarios are of immediate interest. An obvious extension of the adversary model used in this paper is one in which the adversary may attack more than one sub-station, e.g. until she eventually gets caught. Another scenario of interest would be to consider attacks which do not cause harm immediately. For instance, once access to a sub-station LAN is gained the adversary could change the thresholds of protection devices/functions. Such attacks lead to no immediate consequences for the power system, but incorrect threshold value may trip a line incorrectly in the future, e.g. as a result of even a minor acciden-tal failure. When multiple protection thresholds are altered the problem may escalate and lead to large cascades. Finally, scenarios of simultaneous and/or coordinated at-tacks by multiple Adversaries (SWARM attacks) are important in practice.
Some cyber-attacks exploit deficiencies of the communication protocols. The PIA approach – building hybrid models with level of abstraction tailored to the needs of the particular study – fits the modeling task well. In a recent study [12] we recorded evidence that the PIA style of modeling scales well to such detailed models.
Last but not least, the recent work to re-engineer the tools supporting the PIA me-thod makes it suitable to “study the future”, i.e. for studies in which the system under study evolves. The changes may concern the system topology (e.g. the system may grow if the study period spans several decades), the model parameters (e.g. the effect of ownership change /lack of investment may impact the resilience of the system) and, not least, the cyber crime patterns may evolve over time.
Quantification of the Impact of Cyber Attack in Critical Infrastructures 327
Acknowledgement. This work has been partially supported by the EU Framework Programme 7 project AFTER (“A Framework for electrical power systems vulner-ability identification, defence and Restoration”, Grant agreement no: 261788), and by the EU ARTEMIS JU programme project SESAMO (“Security and Safety Model-ling”, Grant agreement no: 295354).
References
1. Stouffer, K., Falco, J., Kent, K.: Guide to Supervisory Control and Data Acquisition (SCADA) and Industrial Control Systems Security, p. 164. National Institute of Standards and Technology (NIST) (2006)
2. Bloomfield, R.E., et al.: Preliminary Interdependency Analysis (PIA): Method and tool support, p. 56. Adelard LLP (2010)
3. Bloomfield, R., Buzna, L., Popov, P., Salako, K., Wright, D.: Stochastic Modelling of the Effects of Interdependencies between Critical Infrastructure. In: Rome, E., Bloomfield, R. (eds.) CRITIS 2009. LNCS, vol. 6027, pp. 201–212. Springer, Heidelberg (2010)
4. Ford, M.D., et al.: Implementing the ADVISE security modeling formalism in Möbius. In: The 43rd Annual IEEE/IFIP International Conference on Dependable Systems and Net-works (DSN). IEEE, Budapest (2013)
5. Sanders, W.H.: Mobius, http://www.mobius.illinois.edu/ [cited] 6. IRRIIS. Integrated Risk Reduction of Information-based Infrastructure Systems (IRRIIS)
(2006–2009), http://www.irriis.org/ [cited] 7. Hearing Before The Subcommittee On National Security, Cybersecurity: Assessing The
Immediate Threat To The United States 2011, House of Representatives One Hundred Twelfth Congress First Session (2011)
8. US-CERT, Recommended Practice: Improving Industrial Control Systems Cybersecurity with Defense-In-Depth Strategies, US-CERT, p. 44 (2009)
9. Ten, C.-W., Liu, C.-C., Manimaran, G.: Vulnerability Assessment of Cybersecurity for SCADA Systems. IEEE Transactions on Power Systems 23(4), 1836–1846 (2008)
10. Krautsevich, L., Martinelli, F., Yautsiukhin, A.: Towards Modelling Adaptive Attacker’s Behaviour. In: Garcia-Alfaro, J., Cuppens, F., Cuppens-Boulahia, N., Miri, A., Tawbi, N. (eds.) FPS 2012. LNCS, vol. 7743, pp. 357–364. Springer, Heidelberg (2013)
11. Johnson, B., Grossklags, J., Christin, N., Chuang, J.: Are Security Experts Useful? Baye-sian Nash Equilibria for Network Security Games with Limited Information. In: Gritzalis, D., Preneel, B., Theoharidou, M. (eds.) ESORICS 2010. LNCS, vol. 6345, pp. 588–606. Springer, Heidelberg (2010)
12. Cavalieri, S., et al.: Quantitative Assessment of Distributed Networks through Hybrid Sto-chastic Modelling. In: Bruneo, D., Distefano, S. (eds.) Quantitative Assessments of Distri-buted Systems, pp. 1–39. Scrivener Publishing LLC, USA (to appear)