Embed Size (px)
Citation preview
QUANTIFICATION OF THE EFFECT OF SYMMETRY IN FACE PERCEPTION
A THESIS SUBMITTED TO
THE GRADUATE SCHOOL OF INFORMATICS
OF
THE MIDDLE EAST TECHNICAL UNIVERSITY
BY
N. DİCLE DÖVENCİOĞLU
IN PARTIAL FULFILLMENT OF THE REQIUREMENTS FOR THE DEGREE OF
MASTER OF SCIENCE
IN
THE DEPARTMENT OF COGNITIVE SCIENCE
SEPTEMBER 2008


iv
ABSTRACT
QUANTIFICATION OF THE EFFECT OF SYMMETRY IN FACE PERCEPTION
DÖVENCİOĞLU, N. Dicle
M.S., Department of Cognitive Science
Supervisor: Assist. Prof. Dr. Didem GÖKÇAY
September 2008, 105 pages
Facial symmetry has been a central component in many studies on face
perception. The relationship between bilateral symmetry and subjective judgments
on faces is still arguable in the literature. In this study, a database of natural
looking face images with different levels of symmetry is constructed using several
digital preprocessing and morphing methods. Our aim is to investigate the
correlations between quantified asymmetry, perceived symmetry and a subjective
judgment: ‘attractiveness’. Images in the METU-Face Database are built to
represent three levels of symmetry (original, intermediate, and symmetrical)
within five classes which also represent the orientation of bilateral symmetry: left
v
versus right. In addition, the asymmetry of original images is quantified using a
landmark-based method. Based on the theory of holistic face perception, we
introduce a novel method to quantify facial asymmetry wholesomely: Entropy-
based quantification. In Experiment 1 and 2, images were rated on attractiveness
judgments and on perceived symmetry, respectively. Results indicate that
landmark-based quantifications were not sufficient to account for perceived
symmetry ratings (SRs), but they revealed that as the vertical deviation of the
symmetry decreases, attractiveness rating (AR) collected from that face increases.
Moreover, morphing classes and their relationship to both ARs and SRs were
highly correlated. Consistent with the previously done research, symmetrical
images were found more attractive. We found that although ARs were the same
for left versus right composites, for SRs, there is a significant difference between
left and right. Finally, a more elucidative quantification approach for subjective
face perception is achieved through significant correlations of entropy scores with
both ARs and SRs.
Keywords: Attractiveness, entropy, facial symmetry, landmarking, perceived
symmetry.
vi
ÖZ
YÜZ ALGISINDA SİMETRİNİN ETKİSİNİN ÖLÇÜLMESİ
DÖVENCİOĞLU, N. Dicle
Yüksek Lisans, Bilişsel Bilimler
Tez Yöneticisi: Yrd. Doç. Dr. Didem GÖKÇAY
Eylül 2008, 105 sayfa
Yüz algısı üzerine yapılan birçok çalışmada simetri önemli bir nokta olmuştur.
Literatürde yüzün simetrisi ve yüzlerle ilgili öznel yargıların ilişkisi halen
tartışmaya açıktır. Bu çalışmada çeşitli dijital işlemler ve bir animasyon yöntemi
kullanılarak doğal görünen fakat değişik simetri düzeylerinde olan resimlerden bir
veritabanı oluşturulmuştur. Amaç, ölçülen simetri, algılanan simetri ve bir öznel
yargı (çekicilik) arasındaki ilintiyi araştırmaktır. ODTÜ-Yüz Veritabanındaki
resimler beş simetri sınıfına ayrılırlar; bu sınıflar üç seviye (orijinal, ara değer ve
simetrik) simetriye ve de sağ ve sol ayrımı olacak şekilde simetrilerin yönüne göre
ayrılmıştır. Orijinal resimlerde ayrıca sınır işaretleri kullanılarak asimetri ölçümü
vii
yapılmıştır. Bütünsel yüz algılama kuramlarına dayanarak yüz asimetrisini ölçmek
için yeni bir de method tanıtmaktayız: Entropi ölçümü. Birinci ve ikinci
deneylerde resimler sırasıyla çekicilik ve algılanan simetriye göre
notlandırılmışlardır. Sonuçlara göre sınır işaretlerine dayalı ölçümler algılanan
simetriyi açıklamaya yeterli değildir; fakat yüzlerin simetrisindeki dikey
dalgalanma azaldıkça o yüzün aldığı çekicilik puanlarının arttığı saptanmıştır.
Bundan başka, simetri sınıflarının farklılıklarının hem çekicilik hem de algılanan
simetri notlarına yansıdığı görülmüştür. Önceki araştırmalara benzer olarak
simetrik yüzlerin daha çekici bulunduğu gösterilmiştir. Çekicilik yüzün sağ veya
sol tarafına göre değişik algılanmazken, simetri algısı için bu farkın önemli
olduğu bulunmuştur. Son olarak, entropi değerlerinin algılanan simetri ve
çekicilik ile bağıntılı olduğu bulunmuş, ve entropiye dayanan ölçümlerin öznel
yüz algısı çalışmaları için daha açıklayıcı bir teknik olduğu gösterilmiştir.
Anahtar Kelimeler: Çekicilik, entropi, yüz simetrisi, sınır işaretleri, algılanan
simetri.

viii
“Anneme ve Babama”

ix
ACKNOWLEDGMENTS
I gratefully acknowledge my thesis supervisor Assist. Prof. Didem Gökçay,
without her visionary thoughts this study would never be done. I also appreciate
all her contributions of funding and time which were indispensable for this thesis.
I am also grateful to Prof. H. Gürkan Tekman, for his motivating lectures on
visual cognition during Spring Term 2004 at METU; his class was my very first
motivation to study human visual perception. I thank Assist. Prof. Annette
Hohenberger, Assoc. Prof. Emre Özgen, Assist. Prof. Bilge Say, Dr. Mine
Mısırlısoy, and Dr. Erol Özçelik for their critical reading and stimulating
questions throughout this study; their comments made this thesis complete. Many
thanks also go to Dr. Albert Ali Salah for giving me the first version of the Matlab
code, which I used for landmarking images.
Dearest thanks go to my friends, Aslı Kılıç, Didem Kadıhasanoğlu, Burak
Erdeniz, Canan İpek, and Işın Demirşahin for easing this distressful course of
study into a collective work we all wanted to achieve. Despite the physical
distance between us, they were there for me on every kind of problem I
encountered. I would also like to thank Zeynep Başgöze, for lending me her
camera; and METU students for modelling for the METU-Face Database. I thank
all the staff at the Informatics Institute for being extremely helpful and providing
me the best environment to deal with academic issues.

x
I am grateful to each and every member of Opus Humanitatis whose presences
made otherwise tedious life in Ankara delightful; I am pleased to be a part of this
community and to make them an essential part of my life. I owe the greatest
gratitude to F. M. Bartholdy for his inspiring tunes and Ethiopian highlanders for
cultivating the first coffee beans.
Finally, my parents, together with my dear brother, Fırat, deserve the sincerest
thanks for their unconditional love and understanding for me; they were the best
at providing me the strongest encouragement and optimum solutions especially
when I needed them most. This thesis is dedicated to them. Thank you.

xi
TABLE OF CONTENTS
ABSTRACT ........................................................................................................... iv
ÖZ .......................................................................................................................... vi
DEDICATION.....................................................................................................viii
ACKNOWLEDGMENTS ..................................................................................... ix
TABLE OF CONTENTS ....................................................................................... xi
LIST OF TABLES ............................................................................................... xiii
LIST OF FIGURES..............................................................................................xiv
CHAPTER
1. INTRODUCTION ........................................................................................... 1
2. LITERATURE REVIEW ................................................................................ 5
2.1. FACE PERCEPTION ............................................................................... 6 2.1.1 Developmental psychology ................................................................... 6 2.1.2. Cognitive Psychology: Holistic Face Perception ............................. 6 2.1.3. Neurobiology of Face Perception ..................................................... 8 2.1.4. Face recognition algorithms ........................................................... 10
2.2. SYMMETRY IN BIOLOGY AND EVOLUTIONARY PSYCHOLOGY 10
2.2.1. The Definition of Symmetry ............................................................. 11 2.2.2. Perception of Symmetry .................................................................. 15
2.3. SUBJECTIVE JUDGEMENTS ON FACES .......................................... 19 2.4. QUANTIFICATION OF SYMMETRY AND CONSTRUCTION OF
SYMMETRIC FACES ...................................................................................... 23
xii
2.5. MOTIVATION FOR THE PRESENT THESIS ..................................... 28
3. EXPERIMENTS ............................................................................................ 30
3.1. CONSTRUCTION OF STIMULUS SET ............................................... 31 3.1.1. METU-Face Database ........................................................................ 31 3.2. EXPERIMENT 1: RATING ON ATTRACTIVENESS ......................... 44
3.2.1. Method ............................................................................................ 45 3.2.2. Results and Discussion .................................................................... 47
3.3. EXPERIMENT 2: RATING ON SYMMETRY ..................................... 51 3.3.1. Method ............................................................................................ 52 3.3.2. Results and Discussion .................................................................... 53
3.4. LIMITATIONS OF THE STUDY .......................................................... 56
4. DISCUSSION AND CONCLUSION ........................................................... 57
5. REFERENCES .............................................................................................. 63
6. APPENDIX .................................................................................................... 66
APPENDIX A: ATTRACTIVENESS RATINGS ORDERED BY IMAGE_ID ................. 66 APPENDIX B: ATTRACTIVENESS RATINGS ORDERED BY SUBJECT_ID .............. 68 APPENDIX C: SYMMETRY RATINGS ORDERED BY IMAGE_ID ........................... 69 APPENDIX D: SYMMETRY RATINGS ORDERED BY SUBJECT_ID ....................... 71 APPENDIX E: ATTRACTIVENESS REACTION TIMES ORDERED BY IMAGE_ID .... 72 APPENDIX F: SYMMETRY REACTION TIMES ORDERED BY IMAGE_ID .............. 74 APPENDIX G: INDIVIDUAL LANDMARKS X-COORDINATES .............................. 76 APPENDIX H: INDIVIDUAL LANDMARKS Y-COORDINATES .............................. 78 APPENDIX I: EXTREMITY AND MEDIAL AXES COORDINATES .......................... 80 APPENDIX J: DISTANCES OF LANDMARKS FROM VERTICAL & HORIZONTAL
AXES .................................................................................................................. 83 APPENDIX K: LOCAL AND GLOBAL ASYMMETRY SCORES .............................. 86 APPENDIX L: ENTROPY SCORES ...................................................................... 88 APPENDIX M: EDINBURGH HANDEDNESS INVENTORY .................................... 90 APPENDIX N: GÖNÜLLÜ KATILIM FORMU....................................................... 91

xiii
LIST OF TABLES
Table 1: Types of symmetries present in nature..................................................16
xiv
LIST OF FIGURES
Figure 1: Symmetry groups of ABC triangle (i) are shown: Rotation by 120
degrees (ii), rotation by 240 degrees (iii), mirror reflections with respect to
symmetry axes passing through A, B, C vertices (iv, v, vi, respectively). .... 13
Figure 2: Basic transformations for symmetrical forms: Translation (t), rotation,
900 here (r), mirror reflection (m), and scaling (s). ....................................... 14
Figure 3: Examples of rotational (i), repetition symmetries (ii) and fractals (iii). 15
Figure 4: Two symmetrical face images derived from each twin: Left-left and
right-right compositions. ................................................................................ 25
Figure 5: Five classes of symmetrical images generated with Gryphon Software:
Original (i), 25% symmetrical (ii), Full symmetrical (iii), 75% symmetrical
(iv), and mirror (v). ........................................................................................ 26
Figure 6: Resulting face morphs from Equation 2: Starts with an original image
(i), symmetrical image in the middle of the figure (ii), and the mirror version
at the end (iii). ................................................................................................ 27
Figure 7: Steps of pre-processing and morphing procedures, with input and output
databases. ....................................................................................................... 33
Figure 8: Extreme points of a face: uppermost (u), lowermost (w), leftmost (l) and
rightmost (r). .................................................................................................. 34
Figure 9: Examples from each database................................................................ 38
Figure 10: Extreme points and axes (i), facial landmarks (ii). .............................. 40
Figure 11: Average entropy values for three levels of symmetry. ........................ 44
Figure 12: Each face image appeared with a rating scale at the bottom. .............. 46
xv
Figure 13: Attractiveness scores averaged over morphing classes representing
symmetry. ...................................................................................................... 48
Figure 14: Attractiveness scores averaged over entropy classes representing
symmetry levels. ............................................................................................ 50
Figure 15: Mean ARs representing two genders: male and female. ..................... 51
Figure 16: Perceived symmetry scores averaged over morphing classes
representing symmetry. .................................................................................. 54
Figure 17: Mean SRs representing two genders: male and female. ...................... 55
Figure 18: Regression graph demonstrating the relationship between SRs and ARs
of original images. ......................................................................................... 56

1
CHAPTER 1
1. INTRODUCTION
“Imago animi vultus est, indices oculi.”
M. T. Cicero†
To describe a person we refer to facial descriptions very often, and identify
peoples' look mostly on how we see their faces, such as a happy looking girl, or a
frightened little boy. In our daily lives, we rely on the percept of faces so much
that police sketches are considered as official records. Faces are not only
† The countenance is the portrait of the soul, and the eyes mark its intentions. (M. Tullius Cicero, De Oratore (ed. A. S. Wilkins), III, 221.)
2
important in terms of introspection; they are also studied systematically in
cognitive science. Human infants are able to recognize faces starting at a very
early age, faces are found to be perceived differently than other objects; and a face
image activates a widely distributed area in the human cortex. We are better at
detecting a face in a crowded scene than any other sophisticated computer
algorithm. Face perception is a high level cognitive function: despite the
geometrical complexity, our visual system can identify a face at an instant; detect
the face holder's gender, age, or even his/her intentions towards us.
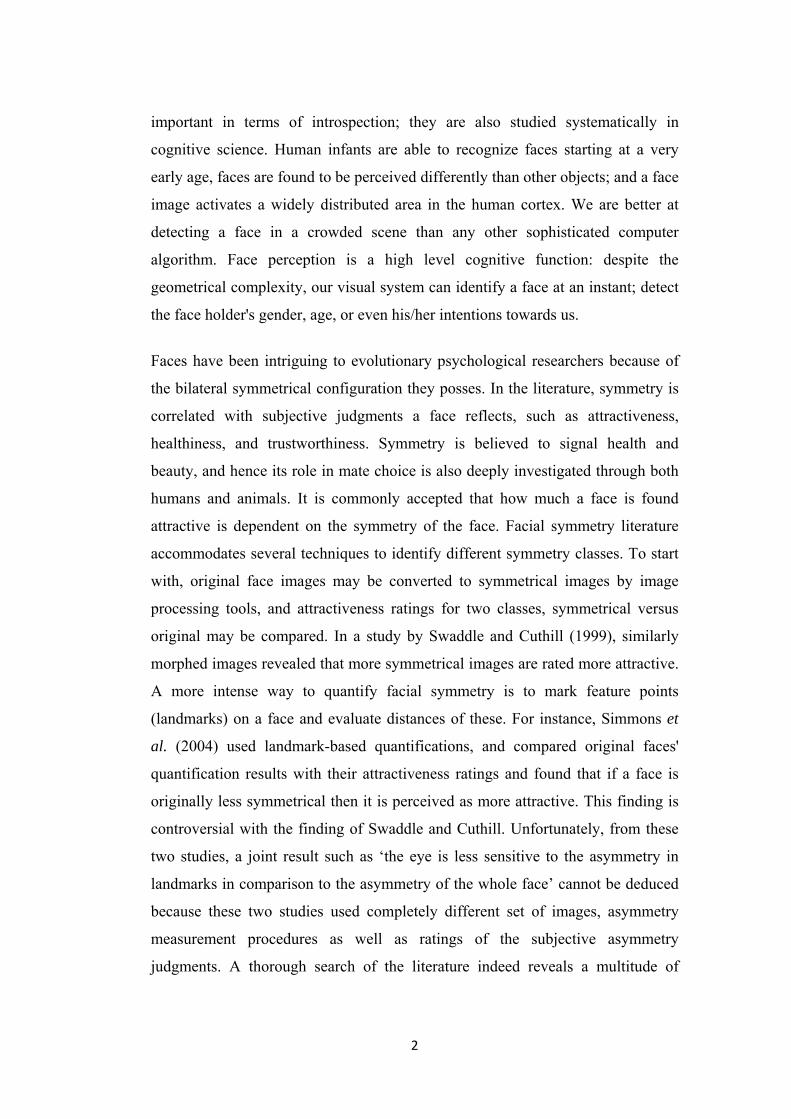
Faces have been intriguing to evolutionary psychological researchers because of
the bilateral symmetrical configuration they posses. In the literature, symmetry is
correlated with subjective judgments a face reflects, such as attractiveness,
healthiness, and trustworthiness. Symmetry is believed to signal health and
beauty, and hence its role in mate choice is also deeply investigated through both
humans and animals. It is commonly accepted that how much a face is found
attractive is dependent on the symmetry of the face. Facial symmetry literature
accommodates several techniques to identify different symmetry classes. To start
with, original face images may be converted to symmetrical images by image
processing tools, and attractiveness ratings for two classes, symmetrical versus
original may be compared. In a study by Swaddle and Cuthill (1999), similarly
morphed images revealed that more symmetrical images are rated more attractive.
A more intense way to quantify facial symmetry is to mark feature points
(landmarks) on a face and evaluate distances of these. For instance, Simmons et
al. (2004) used landmark-based quantifications, and compared original faces'
quantification results with their attractiveness ratings and found that if a face is
originally less symmetrical then it is perceived as more attractive. This finding is
controversial with the finding of Swaddle and Cuthill. Unfortunately, from these
two studies, a joint result such as ‘the eye is less sensitive to the asymmetry in
landmarks in comparison to the asymmetry of the whole face’ cannot be deduced
because these two studies used completely different set of images, asymmetry
measurement procedures as well as ratings of the subjective asymmetry
judgments. A thorough search of the literature indeed reveals a multitude of
3
incompatible methodology, which introduces a prohibiting factor to explain the
inconsistent findings.
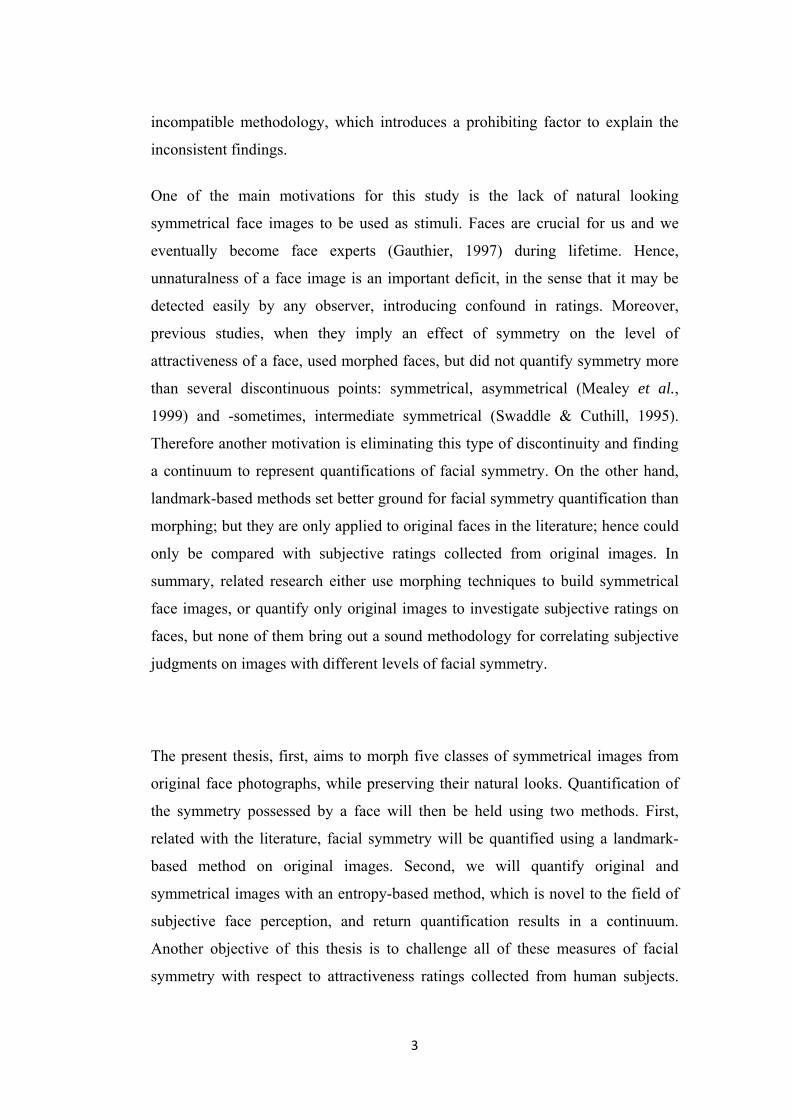
One of the main motivations for this study is the lack of natural looking
symmetrical face images to be used as stimuli. Faces are crucial for us and we
eventually become face experts (Gauthier, 1997) during lifetime. Hence,
unnaturalness of a face image is an important deficit, in the sense that it may be
detected easily by any observer, introducing confound in ratings. Moreover,
previous studies, when they imply an effect of symmetry on the level of
attractiveness of a face, used morphed faces, but did not quantify symmetry more
than several discontinuous points: symmetrical, asymmetrical (Mealey et al.,
1999) and -sometimes, intermediate symmetrical (Swaddle & Cuthill, 1995).
Therefore another motivation is eliminating this type of discontinuity and finding
a continuum to represent quantifications of facial symmetry. On the other hand,
landmark-based methods set better ground for facial symmetry quantification than
morphing; but they are only applied to original faces in the literature; hence could
only be compared with subjective ratings collected from original images. In
summary, related research either use morphing techniques to build symmetrical
face images, or quantify only original images to investigate subjective ratings on
faces, but none of them bring out a sound methodology for correlating subjective
judgments on images with different levels of facial symmetry.
The present thesis, first, aims to morph five classes of symmetrical images from
original face photographs, while preserving their natural looks. Quantification of
the symmetry possessed by a face will then be held using two methods. First,
related with the literature, facial symmetry will be quantified using a landmark-
based method on original images. Second, we will quantify original and
symmetrical images with an entropy-based method, which is novel to the field of
subjective face perception, and return quantification results in a continuum.
Another objective of this thesis is to challenge all of these measures of facial
symmetry with respect to attractiveness ratings collected from human subjects.
4
Similarly, facial symmetry quantifications will also be compared with perceived
symmetry ratings of the human subjects.
All quantification results are expected to correlate with both perceived
attractiveness and perceived symmetry ratings. Initially, landmark-based results
will be challenged with attractiveness ratings of original images. Consistent with
the literature, an original face is anticipated to be more attractive as its level of
symmetry increases. Next, morphing results will be examined to see whether
different classes of symmetrical images (e.g. original, symmetrical, mirror
images) acquire different ratings. Both attractiveness and perceived symmetry
ratings are expected to be higher for images with higher levels of symmetry
(highest for full symmetrical images). Finally, our novel method to quantify
holistic symmetry of faces is predicted to correlate with both subjective judgments
on faces and perceived symmetry: ratings are presumed to be higher for lower
entropy quantification results, hence symmetrical images.
Remainder of this thesis consists of three chapters. In chapter 2, essential
examples from related literature will be given to set ground for face perception,
symmetry perception and perceived subjective judgments on faces. The following
chapter covers details for the methods we used to prepare stimuli, experimental
procedures and statistical analyses of current study as well as limitations. Finally,
in the fourth chapter, our results are interpreted and opinion for future work is also
suggested in the last chapter.
5
CHAPTER 2
2. LITERATURE REVIEW
This chapter starts with a section elaborating on face perception; regarding the
developmental importance, basic theories, neural correlates and computer
algorithms of the way we perceive faces. Then in the next section symmetry is
reviewed starting with its types and common definitions in the literature, and
research involving perception of symmetrical patterns. This section is followed by
related examples from previously done research investigating the relationship
between facial symmetry and the percept of face for humans. Methods for
quantification of facial symmetry in both two- and three-dimensional images and
constructing symmetrical images are further reviewed in the fourth section.
Finally current study's intent to compensate for the discrepancies in the facial
symmetry quantification field is asserted.
6
2.1. FACE PERCEPTION
2.1.1 Developmental psychology
Decoding faces and facial expressions is the first frontier in social
communication, and it has a vital priority among all sorts of cognitive functions.
From the perspective of developmental psychology, faces are crucial because
acquisition of faces occur so early that babies identify face-like patterns in the first
hour they are born, and are able to recognize their mother from the first several
hours on (Pinker, 1997). Apart from visual attention to mother's live face,
preference for a facial configuration (2d sketches of facial features) is also shown
among minutes old neonatal infants (Sai, 2005). Response to the half profile and
profile of mother's face is available after 4-5 weeks and 10-12 weeks, respectively
(Sai, 1990). However, the results on such research still fail to answer the question
whether infants learn their mother's faces depending solely on their visual abilities
or intermodal experiences play the major role during face learning; hence further
research controlling mother's odor, voice, tactile sense of warmth or even
heartbeat is needed for a solid conclusion.
2.1.2. Cognitive Psychology: Holistic Face Perception
In addition to infants rapidity on learning faces compared to other complex
objects, studies done with adults also reveal a special level of processing for face
stimuli. A line of evidence that faces may be perceived differently in comparison
to other objects results from psychology experiments. Just like other visual
context effects in psychology such as word superiority effect (Johnston and
McClelland, 1973), face parts are found to be better perceived when presented as
a normal face stimulus compared to a set of scrambled constituent parts as stimuli.
7
This effect in face recognition paradigms is called face superiority effect (Purcell
and Stewart, 1988).
Face perception is also specially influenced by the orientation of the stimulus than
any other object recognition. Earlier studies with normal individuals suggest that
inverted faces take longer time to identify than their upright originals. This effect,
known as the face inversion effect, is independent from the face stimulus since its
complexity and image properties like brightness and contrast remain same when
you invert a face stimulus. Hence longer reaction times for perceiving an inverted
face may only be explained based on related brain activity (See, for a review,
Valentine, 1988). Unlike results attained from adults, children (of maximum 10
years old) show no latency for stimulus orientation when remembering faces
(Carey and Diamond, 1977); they almost equally remember upright and inverted
face photographs, where facial appendages suffice to convince them that the
photograph belongs to a different individual. These differences in children's face
perception are explained with the immaturity of right cerebral hemisphere by
authors.
Both face superiority effect and inversion effect support holistic representation of
faces. “We take as a starting point the idea that visual object representations are
hierarchically organized, such that the whole object is parsed into portions that
are explicitly represented as parts. [...] In this context, the claim that faces are
recognized holistically would mean that the representation of a face used in face
recognition is not composed of representations of face's parts, but more as a
whole face (Tanaka and Farah, 1993, p.226)”. Tanaka and Farah argue their point
in the light of three experiments. In each experiment they compare whole face
identification to three sets of stimuli: scrambled faces, inverted faces and houses.
As a result of their first and second experiments, identification of individual face
features is more accurate when presented in whole face images compared to
scrambled face stimuli (Experiment 1) or inverted face stimuli (Experiment 2).
8
They further investigate holistic object perception in their third experiment: house
parts did not show any advantage when displayed in a whole house image over
individual house part displays, either. In other words, spatial organization of facial
features is as important as the features themselves.
2.1.3. Neurobiology of Face Perception
Faces contain more personal information than any other body part and are
important for us in several ways: 1) they are complex stimuli, in geometrical
means, compared to other visual objects we encounter in everyday life. 2)
Information reflected by a face is more than geometrical visual signals, they are
crucial for communicating emotions and intentions between people. 3) Verbal
communication is highly dependent on visual information acquired from the face;
complementary roles of lip movements, eye gaze and facial gestures are
indispensable for social communication. With all these data our faces convey,
undoubtedly, brain functions underlying face recognition are complex.
Face perception has been central to visual cognition research for decades. Recent
theories in functional neuroanatomy concerning perception of faces do not
coincide: While some researchers argue that there is a brain region specifically
attributed to faces, namely the fusiform face area, others reject this modularity
hypothesis and depict that the process is an expertise for faces in object
recognition. Still ongoing debate follows mainly two branches of research groups:
Kanwisher et al. (1997), in their functional magnetic resonance imaging (fMRI)
experiments, challenge the face responsive area in the brain with diverse
experimental manipulations and conclude that the area is specific to face
processing. On the other hand, Gauthier and Tarr (1997) object to previous
9
studies` experimental designs and they find a similar activation in this putative
face area even when they use non-face stimuli. They further expand this result to
an expertise framework, replicate their findings with car and bird experts (2000),
and finally suggest that this so called face area is in fact involved in subordinate
level object recognition. Since we are exposed to faces so often, we have been
face experts, they suggest; faces are perceived and processed in a subordinate
level despite the complexity they possess.
Face perception is a very complex cognitive function to be localized at a restricted
domain in the cortex. Hence models suggested for face perception recruit more
than a single cortical domain. Moreover, thorough models for face perception
include cortical mechanisms, as well as subcortical structures such as amygdala,
superior colliculus and pulvinar. A widely distributed neural model for face
perception was proposed by Haxby, Hoffmann and Gobbini (2000) which involve
a continuous large area in the brain along with previously mentioned face
responsive areas. Low spatial frequency information acquired from a face image
is often reported to be used for detection of a face, which at the same time
provides emotional information (such as fear), or direction for the eye gaze; and
this kind of information is rapidly processed by a subcortical face processing
system (See Johnson, 2005 for a review). Recognizing the identity of a face, on
the other hand, entertains high spatial frequency information, and is related to
cortical processing of faces. These two routes for face processing are not
dissociated; but it is suggested that subcortical pathway modulates cortical
domains when perceiving faces.
In addition, there exist distinctive neurological cases such as deficits specific to
face recognition coexisting with intact object recognition (prosopagnosia,
Damasio, 1982), or lack of learning novel faces when object learning is preserved
(prosopamnesia, Tipplett, Miller, Farah, 2000). Examples of these neurological
10
cases set further evidence for the distinctiveness of faces in object perception for
human.
2.1.4. Face recognition algorithms
Data projecting to computer science help computer models of face recognition to
rely on human perceptual system. For instance, perception of facial symmetry in
humans' face processing is supported by studies from Carnegie Mellon Robotics
Laboratory. The lack of quantitative studies for facial asymmetry motivated Liu et
al. (2003) to conduct a study where they considered facial asymmetry as “a
continuous multidimensional statistical feature” (Lui et al., 2001, p.3). They
found that specific facial asymmetry measures which are stable to expression
variations affect identification of faces by humans. With this new biometric they
define, it is shown that distinct facial asymmetries provide complementary
information for automatic face identification tools.
2.2. SYMMETRY IN BIOLOGY AND EVOLUTIONARY PSYCHOLOGY
Physical appearance of many biological creatures is symmetrical. Paired body
parts such as limbs, wings, sensory organs are equally distributed at each side of
the body. In evolutionary science, this trend in phenotypes is considered as a
reflection of organism's genotypic characteristics. Here, genotype is considered as
all genetic characteristics of animate organisms; however phenotype frames
directly observable physical appearance unlike its broad sense including blood
type, fingerprints, behavior, etc. When we consider a scale of human perception
the symmetric trend in phenotypes is never perfect; deviations from symmetry, i.e.
asymmetries, are always present. Occurrences of asymmetry are thought to be due
to the environment's developmental effects on creatures' gene characteristics, or
results of different functionality. Symmetry is intriguing for many research fields
11
such as mathematics (see Section 2.2.1), but human morphology directs to two
types of asymmetry found in nature: It may occur consistently towards one
direction throughout the population, such as human body normally having heart
on the left side. There may also be inconsistent asymmetries specific to
individuals, implicating small and random differences within a single organism,
moreover, normally distributed in the population. The former notion is referred to
as directional asymmetry whereas the latter is called fluctuating asymmetry.
Fluctuating asymmetry (FA), is central to this thesis and it is considered as an
indicator of developmental, genetic, environmental instability. In other words, FA
is thought to arise in the presence of environmental stress and/or genetic factors
which keep the organism from stable development. Hence the perfection in
genetic quality is thought to be reflected in more symmetrical phenotype.
Together with this, many animal species are consistently thought to perceive
symmetry in their potential sexual mates. Functionally, human visual system is
believed to involve mechanisms finely tuned to detect deviations from symmetry
which imply bad genes thus poor health (Swaddle, 1999).
2.2.1. The Definition of Symmetry
Symmetry notion has been appealing to scientists, philosophers and artists for
millennia. Interestingly, before its modern definition was made during 19th
century, symmetry had a different understanding in Greek antiquity (Gr.
summetria), basically it meant proportionate. Hon and Goldstein (2008) elaborate
this difference in meaning in their recent review:
“Its [symmetry's] usage can be distinguished by the contexts in which it was
invoked: (1) in a mathematical context it means that two quantities share a
common measure (i.e. they are commensurable), and (2) in an evaluative context
(e.g., appraising the beautiful), it means well proportioned. [...] The coherence of
12
these two trajectories corresponds to two distinct senses of the concept of
symmetry: (1) a relation between two entities, and (2) a property of a unified
whole, respectively. (p.2)”
In the 19th century, the circumstantial notion of symmetry took its significant
place to shed light in physics, chemistry, biology and other sciences. It was after
French mathematician Legendre's (1752-1833) symmetry definition, the modern
world acquired recent usage of symmetry, which, then brought E.P. Wigner
(1902-1995) the Nobel Prize in physics for his contributions to particle physics
with an application of fundamental symmetry principles.
Together with all sciences, symmetry notion takes its essential place in the
branches of mathematics, not to mention that these branches accommodate the
most concrete definitions of symmetry. Along with geometry, functional analysis,
algebra, differential equations, etc. every field in mathematics has an essential use
of symmetry notion, such as to understand equations or matrices, to define
algebraic group structures, or to position around coordinate systems. Accordingly,
many kinds of symmetry definitions exist in mathematics; however, in the scope
of this study, it is conventional to dismiss many other types but to concentrate on
the geometrical interpretation.
In spatial concern, symmetry of a function f with respect to y-axis may be defined
as follows:
, , Eqn. 1
13
With this equation, points in f come in pairs and their distances to y-axis, the
symmetry axis, are always equal.
Definitions in visual symmetry detection literature also refer to mathematical
notions:
“Informally, symmetry means self-similarity under a class of transformations,
usually the group of Euclidean transformations in the plane, that is, translations,
rotations, and reflections (also collectively denoted by 'isometries'). (Wagemans,
1996, p.26)”
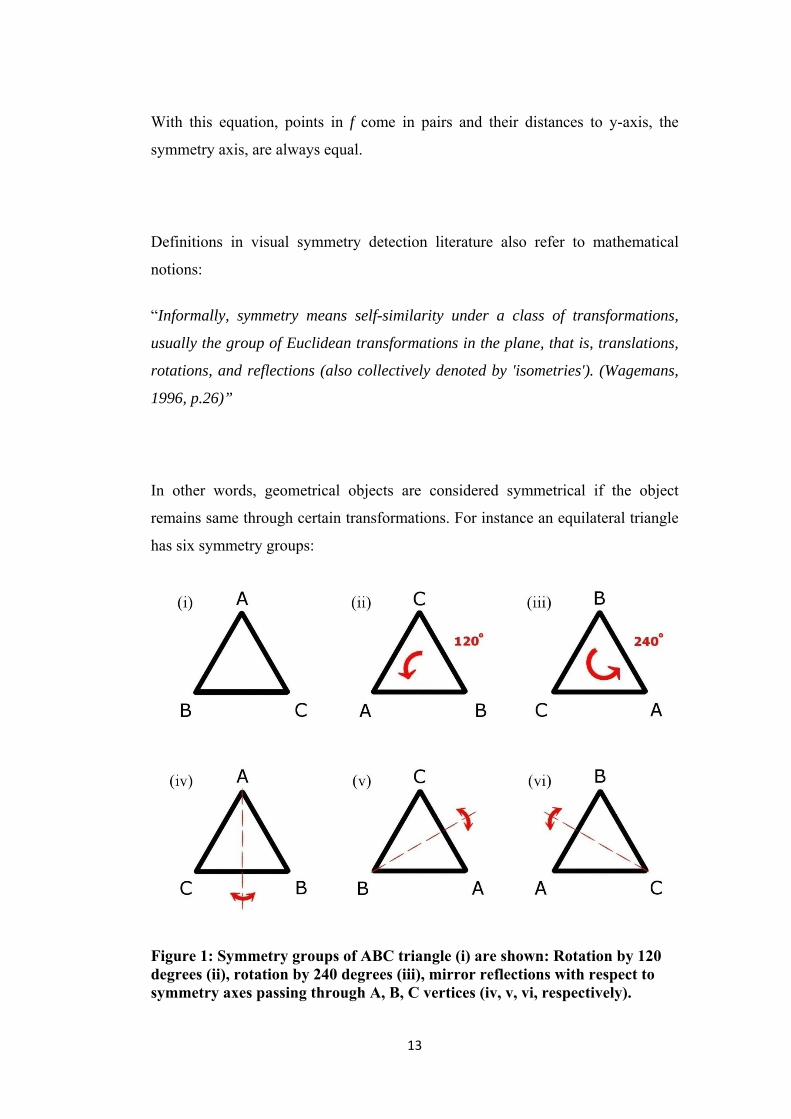
In other words, geometrical objects are considered symmetrical if the object
remains same through certain transformations. For instance an equilateral triangle
has six symmetry groups:
Figure 1: Symmetry groups of ABC triangle (i) are shown: Rotation by 120 degrees (ii), rotation by 240 degrees (iii), mirror reflections with respect to symmetry axes passing through A, B, C vertices (iv, v, vi, respectively).
14
On the other hand, objects need not necessarily be wholly symmetrical, but they
might contain symmetrical parts, which is better emphasized in the following
definition:
"Symmetry is a general concept that refers to any manner in which part of a
pattern may be mapped on to another part (or the whole pattern onto
itself)."(Tyler 2002, p.3)
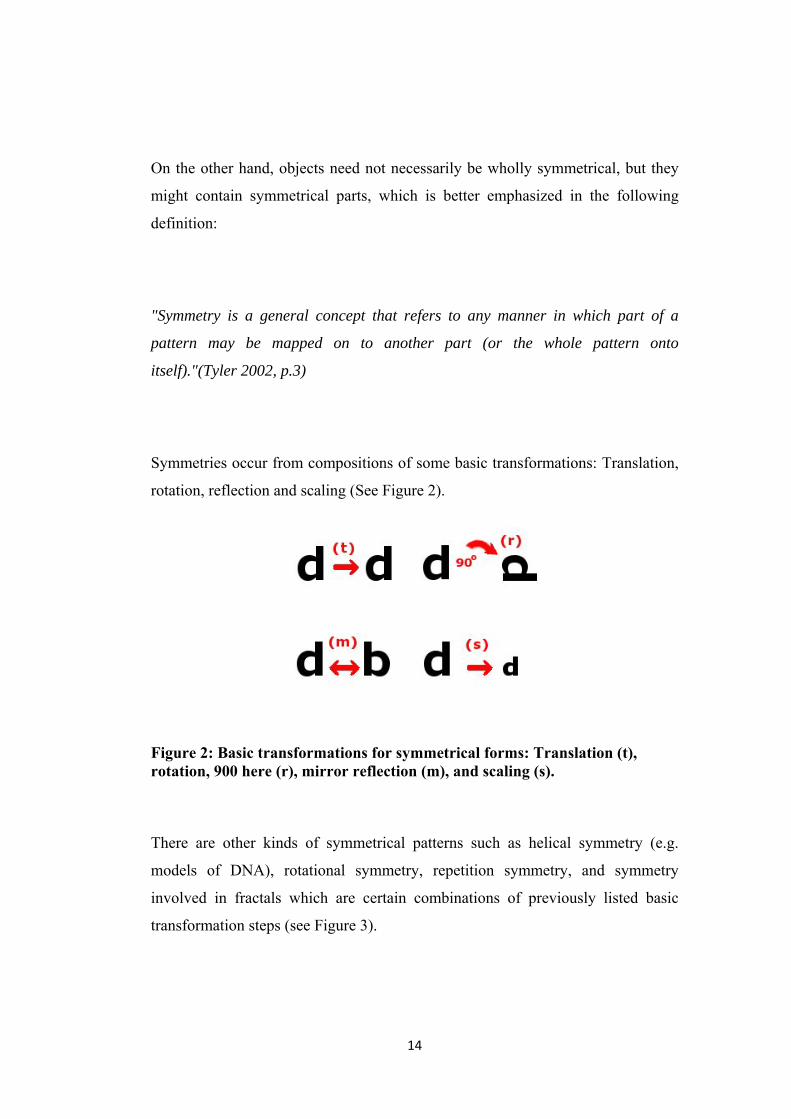
Symmetries occur from compositions of some basic transformations: Translation,
rotation, reflection and scaling (See Figure 2).
Figure 2: Basic transformations for symmetrical forms: Translation (t), rotation, 900 here (r), mirror reflection (m), and scaling (s).
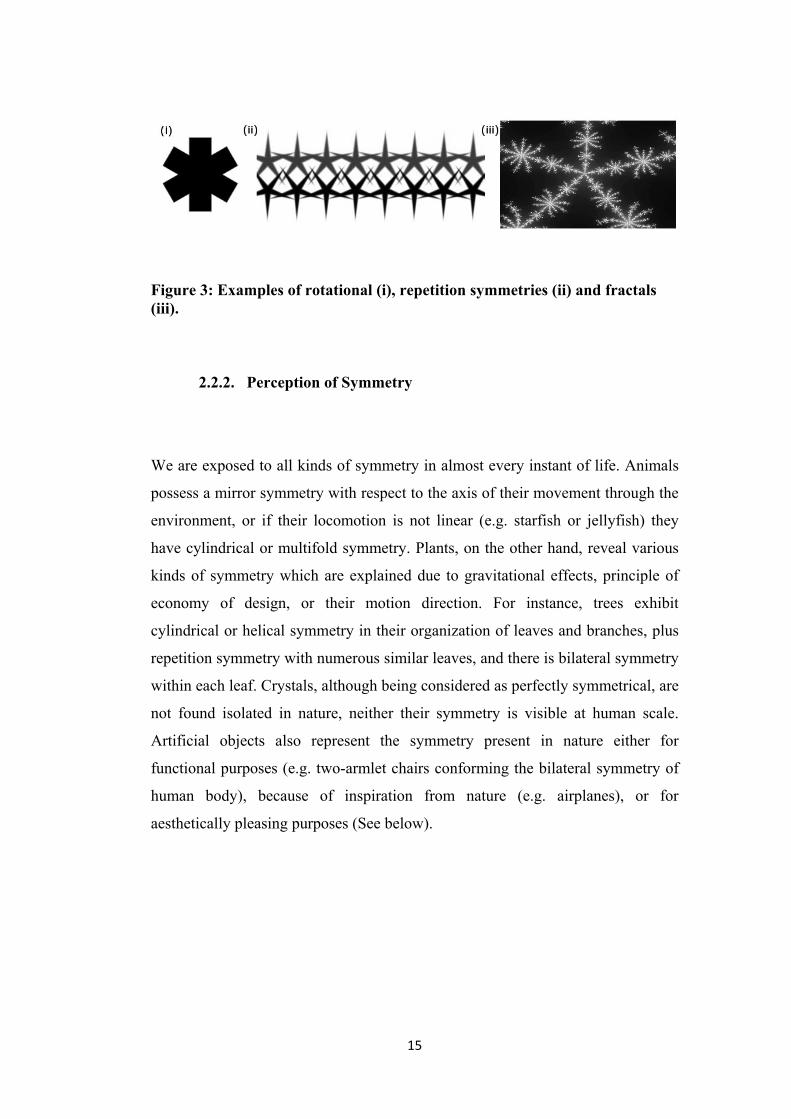
There are other kinds of symmetrical patterns such as helical symmetry (e.g.
models of DNA), rotational symmetry, repetition symmetry, and symmetry
involved in fractals which are certain combinations of previously listed basic
transformation steps (see Figure 3).
15
Figure 3: Examples of rotational (i), repetition symmetries (ii) and fractals (iii).
2.2.2. Perception of Symmetry
We are exposed to all kinds of symmetry in almost every instant of life. Animals
possess a mirror symmetry with respect to the axis of their movement through the
environment, or if their locomotion is not linear (e.g. starfish or jellyfish) they
have cylindrical or multifold symmetry. Plants, on the other hand, reveal various
kinds of symmetry which are explained due to gravitational effects, principle of
economy of design, or their motion direction. For instance, trees exhibit
cylindrical or helical symmetry in their organization of leaves and branches, plus
repetition symmetry with numerous similar leaves, and there is bilateral symmetry
within each leaf. Crystals, although being considered as perfectly symmetrical, are
not found isolated in nature, neither their symmetry is visible at human scale.
Artificial objects also represent the symmetry present in nature either for
functional purposes (e.g. two-armlet chairs conforming the bilateral symmetry of
human body), because of inspiration from nature (e.g. airplanes), or for
aesthetically pleasing purposes (See below).
16
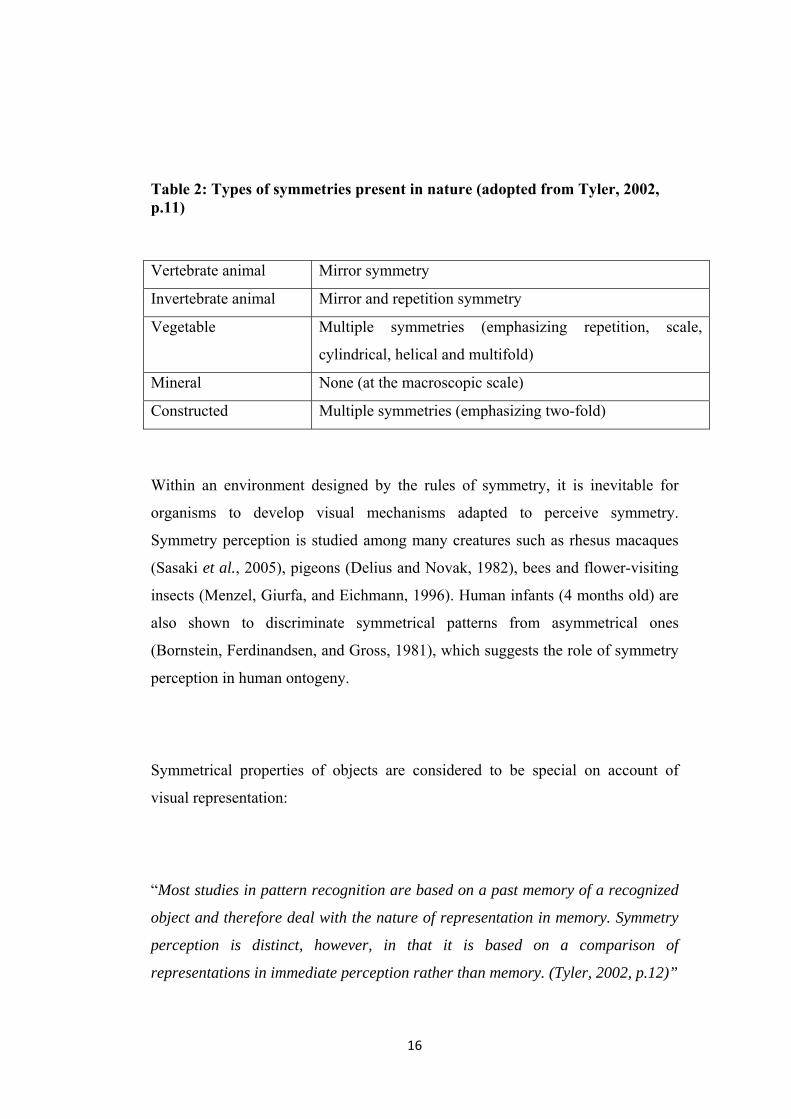
Table 2: Types of symmetries present in nature (adopted from Tyler, 2002, p.11)
Within an environment designed by the rules of symmetry, it is inevitable for
organisms to develop visual mechanisms adapted to perceive symmetry.
Symmetry perception is studied among many creatures such as rhesus macaques
(Sasaki et al., 2005), pigeons (Delius and Novak, 1982), bees and flower-visiting
insects (Menzel, Giurfa, and Eichmann, 1996). Human infants (4 months old) are
also shown to discriminate symmetrical patterns from asymmetrical ones
(Bornstein, Ferdinandsen, and Gross, 1981), which suggests the role of symmetry
perception in human ontogeny.
Symmetrical properties of objects are considered to be special on account of
visual representation:
“Most studies in pattern recognition are based on a past memory of a recognized
object and therefore deal with the nature of representation in memory. Symmetry
perception is distinct, however, in that it is based on a comparison of
representations in immediate perception rather than memory. (Tyler, 2002, p.12)”
Vertebrate animal Mirror symmetry
Invertebrate animal Mirror and repetition symmetry
Vegetable Multiple symmetries (emphasizing repetition, scale,
cylindrical, helical and multifold)
Mineral None (at the macroscopic scale)
Constructed Multiple symmetries (emphasizing two-fold)
17
Among various types of symmetrical structures, mirror symmetry is paid special
attention in visual perception literature. It is experimentally demonstrated that
mirror symmetry is a salient visual property (Cohen & Zaidi 2007). Salience of
mirror symmetry is challenged in psychophysical experiments by manipulating
stimulus size and complexity and analyzing reaction times; where latencies
indicate serial or parallel visual search mechanisms.
In a study by Baylis and Driver (1994), stimuli consisting of (mirror) symmetric
and repetition symmetric boundaries were used in two experiments. In their first
experiment, rectangular like block shaped stimuli differed both with respect to
their symmetry axes (vertical and horizontal) and their boundary asymmetries
(mirror symmetric and asymmetric). In the second experiment, they used similarly
organized types of stimuli, but shapes with repetition symmetrical boundaries
were used instead of mirror symmetrical boundaries. The task was to judge
whether a shape has symmetrical contour in the first experiment, and to judge
whether it has a repeated contour in the second. Stimuli were manipulated with
respect to the complex of boundary properties (steps changing from 4-8 to 16
discontinuities in the boundary), symmetry conditions, and orientation of the
symmetry axis. As a result of data collected from both experiments, it is found
that repetition symmetry judgments were affected from the complexity of the
stimulus significantly, whereas (mirror) symmetry judgments did not show
significant delays for stimulus complexity. Authors concluded that symmetry
perception was preattentive providing evidence for the salience of mirror
symmetry: “We found that [mirror] symmetry perception appears to operate in
parallel for single shapes, but repetition is apparently detected by serial checking.
(p.398)”
18
Along with behavioral results, brain imaging data also show specialized cortical
domains for symmetry perception; moreover there is ongoing fMRI research to
demonstrate distinctive activation for facial symmetry rather than object
symmetry.
In an imaging study investigating symmetry perception with random dot and line
stimuli, authors located several areas in both human and macaque visual cortex
specific to symmetry perception (Sasaki et al., 2005). Random patterns were
sparse white dots on a black background, and symmetry was controlled with the
percentage of randomly placed dots. Highly significant activation in the human
extrastriate cortex, especially in the areas V3A, V4v/d, V7 and lateral occipital
was reported. Contrary to these higher level visual areas, there was no specific
activation in the primary visual cortex, namely in V1 and V2. Functional MRI
data obtained from macaque visual cortex was also present but with relatively
weaker sensitivity to symmetry than humans. In relation to previously mentioned
psychophysical study (Baylis and Driver, 1994), Sasaki and others, in one of their
experiments, compared symmetrical patterns with tilings and repetitions; the
cortical regions which showed symmetry sensitivity were neither activated by
repetition patterns nor tilings. In addition to cortical activation, authors also
collected judgments from the subjects by asking whether the same stimuli are
symmetric outside the scanner; and they have reported high correlation between
fMRI activity and percept. This correlation result and weakness of monkey
response to symmetry were together suggested to demonstrate that symmetry
perception needs cortical calculation, i.e. it is not at a neuronal level.
Yet another thorough study that requires special attention was conducted by Chen
and others (2006). Authors investigated how humans process facial configurations
throughout several fMRI experiments and they used various types of visual
stimuli: 2D frontal face images from FERET database (see Chapter 3), inverted
faces, ¾-view faces together with symmetrical and asymmetrical scrambled
19
images derived from a frontal face image set (see Section 2.3.2 for methods used).
Symmetry was considered in two fashions: Image symmetry (2D) and object
symmetry (3D, challenged by using ¾ -view images compared to frontal faces).
Authors first found face sensitive areas convenient with previous literature
(fusiform, inferior and middle occipital gyri, superior temporal and intraoccipital
sulci); and symmetry sensitive areas (mainly middle occipital gyrus and
intraoccipital sulcus but not fusiform or occipital face areas). Activity related to
facial configuration was observed with upright versus inverted face images in the
fusiform, inferior and middle occipital gyri, around the intraoccipital sulcus and
precuneus. It was deduced that occipital face area might be involved in symmetry
processing specific to faces. Finally, contrasting face sets for 2D and 3D
symmetry perception to understand viewpoint dependence revealed activation in
middle occipital gyrus and intraoccipital sulcus. Together with the evidence they
provide for facial symmetry perception literature; these results also contribute the
theory of holistic face perception and they suggest that humans process faces
independent of the viewpoint.
2.3. SUBJECTIVE JUDGEMENTS ON FACES
Faces serve as the controlling information for interaction between people, while
communities reflect our species' adeptness in social interaction. In evolutionary
perspective, bodily, particularly facial symmetry has been appealing to explore
mate choices in humans, and subjective judgments for unfamiliar faces have been
central to evolutionary psychology research regarding how we process faces. In a
study done with normal and symmetrical face images (see Section 4), different
characteristics of faces are thought to exist in either halves of the face (Zaidel,
Chen, German, 1995). Symmetrical images of women consisting of two right half-
faces were found to be more attractive than left-left composites. In the same
study, a second experiment revealed that smile is more salient on the left-left
composite images of both men and women. The latter finding is consistent with
20
the literature suggesting that facial expressions are more salient on the left side;
which may be explained facial muscles being dominated by both ipsilateral and
contralateral hemispheres.
The relation between perceived health and attractiveness on faces led to another
field of research investigating healthiness extracted from faces. In a different
study by the same group of researchers women's faces were rated healthier in
right-right composite images where no face side difference arose for men (Reis,
Zaidel, 2001). Comparing these results with their previous findings (Zaidel, Chen,
German, 1995) authors also reported correlated ratings for perceived
attractiveness and healthiness in faces. In women's faces a correlation between
trustworthiness and attractiveness is also reported (Zaidel, Bava, Reis, 2003),
suggesting that symmetry is connected to trustworthiness as well in a remote
fashion.
Several experiments reported correlations between symmetry levels and perceived
attractiveness of a face. Within these studies the symmetry possessed by the face
has been referred to as an attribute of facial attractiveness (see Thornhill,
Gangestad, 1999 for a review). Direct effect of symmetry on facial attractiveness
is hard to isolate because Thornhill and Gangestad (1999), in their review,
combine two important confounds of facial attractiveness to symmetry:
averageness and sexual traits. Average faces can be constructed by compositing
individual faces over each other, and they are shown to be more attractive than
individual faces. Averageness of a face can also be metrically measured by its
features, and the preference for average facial features may be shown in individual
faces (Grammer, Thornhill, 1994). Sexual traits are considered to be
dimorphisms1, i.e. hormone markers in facial characteristics of male and female
faces. In puberty, testosterone levels affect the growth of the cheekbones,
1 Differences for men and women
21
mandibles and chin, together with the lengthening of the lower facial bones of
male faces. Similarly, in pubertal females, estrogen levels cause fat deposition, i.e.
enlargement of the lips and upper cheek area, and prevent growth of the bony
structures typical to male faces. These characteristics determined by sex-
hormones are also reported to be perceived as more attractive. These studies have
shown that facial configurations other than symmetry also play an important role
in our subjective judgments about a person.
In the literature, the role of symmetry as a positive or a negative effect on facial
attractiveness (Grammer, Thornhill, 1994; Swaddle, Cuthill, 1995) remains
equivocal. While some results suggest that symmetry implies facial attractiveness;
others report evidence for symmetric faces being perceived less attractive.
There are various examples which attempt to evaluate the effect of symmetry on
the subjective perception of faces, implicated by 'attractiveness'. In a study by
Swaddle and Cuthill (1995), symmetric faces were created from composites of the
original face and the whole mirror image of it. Intermediate level faces, namely
nearly symmetric and nearly asymmetric, were also used as stimuli. Stimuli are
also prepared such that the hair, ears and neck are excluded by placing a black
ellipse around faces creating an unnatural background. Thirty-seven male and 45
female subjects were instructed to rate images from 1 (least attractive) to 10 (most
attractive). No effect of sex on facial attractiveness ratings was found, i.e. female
and male raters were almost equally generous to images when rating, but images
that belong to female individuals were rated as more attractive. Authors reported
that attractiveness rating of a face decreased as its symmetry level increase, most
importantly, this was due to an overall effect of manipulation on images.
Although the composite faces used in this study come up with averageness effect,
which is previously considered as a part of facial attractiveness, average faces
(symmetric face images, here) are not rated as the most attractive ones. Another
objection would be that the exclusion of facial features, such as ears, withdraws a
22
face from its natural view. Hence, results might be dependent on the unnatural
face images, and reflect defectiveness of techniques used in constructing face
stimuli instead of showing the genuine connection between original FA and
perceived attractiveness of a face.
Contradicting findings are reported in a later study: Mealey et al. (1999), used
photographs of monozygotic twin pairs as stimuli. This study is crucial, in the
sense that even though twins are identical in their genetic conditions, their
appearance differ as a result of environmental development factors. Two half
faces were morphed into a symmetric face (see below for details) resulting two
types of symmetric faces for each individual: left-left and right-right symmetric
images. First set of raters (25 male and 38 female) were shown the symmetric
faces and asked to choose which pair looked more similar to each other, i.e.
observers saw 4 images in each trial, left-left and right-right for each twin brother.
So if left-left and right-right composite of a twin is rated as more similar, then he
would be regarded as more symmetric. To another group of raters (32 male 43
female), the original photographs were shown, and asked first to decide on which
twin was more attractive and then rate him on a scale of 7 ranging from extremely
attractive to not attractive at all. Between subjects results indicated that, the more
symmetric a twin is perceived, the more attractive s/he is rated. Moreover, there
was no sex effect but groups of ratings from both female and male raters were
almost equally affected from the FA of face images. This was pointed to be a
counterexample for evolutionary psychology theories of symmetry relating to
mate choice, as the authors explained, not only possible mates but also rating of
an "unsuitable individual" might as well be affected from facial symmetry.
Gender difference was remarkable in attractiveness ratings results; male raters
were reported to give significantly lower ratings to other males, and this was
explained by an intrinsic psychological mechanism suggesting that "males
derogating other males, both in the eyes of potential mates and in their own
thoughts".
23
Unlike previous studies using morphing techniques, Simmons et al. (2004) used
only original images of faces. First they measured distances between 15 points
they marked on original face photographs. Their statistical descriptive revealed
that directional asymmetry is present in both sexes, i.e. right side of the face is
reported to be larger. After statistical evaluations of these measures, from a pool
of 111 raters (54 males and 57 females), experimenters randomly separated this
into two groups; they asked first group of raters to rate how symmetric and the
second group how attractive each face was. As a result, more symmetric looking
faces were also the ones which are rated as more attractive. More importantly,
they found that people's perception of symmetry is dependent on small deviations
from symmetry (FA) but not on directional asymmetry. In their study, authors
have not identified levels of symmetry for the stimuli they used, nor did they
make a comment on asymmetry scores.
2.4. QUANTIFICATION OF SYMMETRY AND CONSTRUCTION OF SYMMETRIC FACES
Visually perceiving an object gains us two kinds of information about its form:
shape and size. While the former is invariant throughout species, size may differ
for each individual sample. In systematic study of biological morphology, the
definition of shape is given as follows: “The geometric properties of a
configuration of points that are invariant to changes in translation, rotation, and
scale. (Slice et al., 1996)”
To study an organism's morphology, data acquisition is an essential first step in
quantification. Unlike three dimensional (3D) studies, one cannot obtain data
directly from the sample in a two dimensional (2D) study, but devices such as
24
digital cameras, scanners, photocopying, etc. are used to acquire representations
of samples. From digitized 2D images, special landmark points are extracted, and
individual samples are compared on the basis of this landmark set. A set of points
gives coordinates, and from these points distances and angles can be derived.
Quantification of form is important because resulting data is reliable, universal
and comparable to previously done research.
In facial attractiveness literature, qualitative results without remarks on
quantifications are adapted more commonly; these studies use dichotomous
stimuli sets, i.e. symmetric and asymmetric face images. There are also several
studies using a third level of face images consisting of intermediate value
symmetrical faces (see below). These distinct sets were acquired by morphing
techniques; methods that involve changing the shape (and sometimes size) of face
images, i.e. morphing faces. Results from these poorly controlled stimuli,
however, fall short for reasoning for scattered and dense sets of numerical
subjective ratings on faces.
Using landmark techniques provides more intense quantification for face images.
Rather than classifying face images into symmetric or asymmetric sets, one can
represent the amount of asymmetry of an image with distances and angles derived
from featural (e.g. eyes, nose, mouth) landmarks. This method obviously offers
better comparison between stimuli presented and data collected in an experiment,
but it is still limited with landmark points selected: Texture of the face (such as
skeletal asymmetries apparent from fluctuations of skin surface), outside the
landmarks are left non-quantified.
With current techniques in image processing software such as Matlab Image
Processing Toolbox (version 5.1), we can quantify the image wholesomely,
25
beyond a limited set of points. Specifically, a built-in image entropy function
evaluates the amount of information an image contains, by taking into account
every single pixel in the image and giving the result after a logarithmic calculation
of pixel intensities. Quantification of facial symmetry with such an algorithm
allows us to represent image quantification results in a continuum, instead of
dichotomous or discreet sets; providing a better environment for interpreting
subjective ratings. In addition, by reporting facial symmetry based on the points
embodied by the whole face, holistic interpretation of face perception is supported
as well.
Similar experimental settings described in the previous section diverge to
equivocal findings, and this diversity in their results might be explained by further
investigating the stimulus preparation stages.
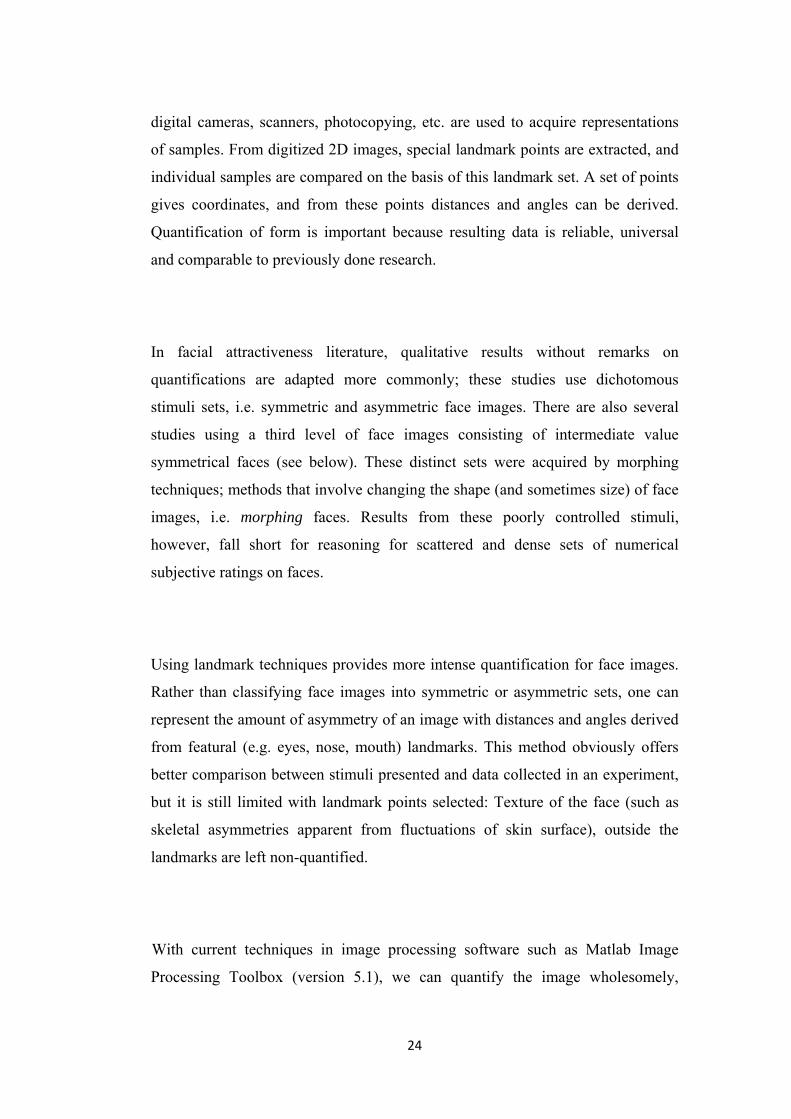
In Mealey et al. (1999), faces are cut vertically along a facial midline using Adobe
Photoshop, Ver 3.05(1994). Then, symmetric version of each face was derived by
aligning a half face with its mirror image, which resulted in two full symmetric
faces: a left-left and a right-right face (Figure 4).
Figure 4: Two symmetrical face images derived from each twin: Left-left and right-right compositions.
26
Here, the detection of facial midline is ambiguous. The base of the nose is used as
a reference point as reported, but there is no further comment whether this midline
passes through the center of the mouth, or the midpoint between the eyes. Even if
this midline is adopted, then aligned half faces would result in different mean
sizes than the original face. Directional asymmetry of faces would cause larger
right-right composites than left-left. In addition to this size issue, it is hard to
establish a smooth facial plane with two aligned half faces, and resulting face,
even though being symmetrical, would contain sharp discontinuities along the
midline.
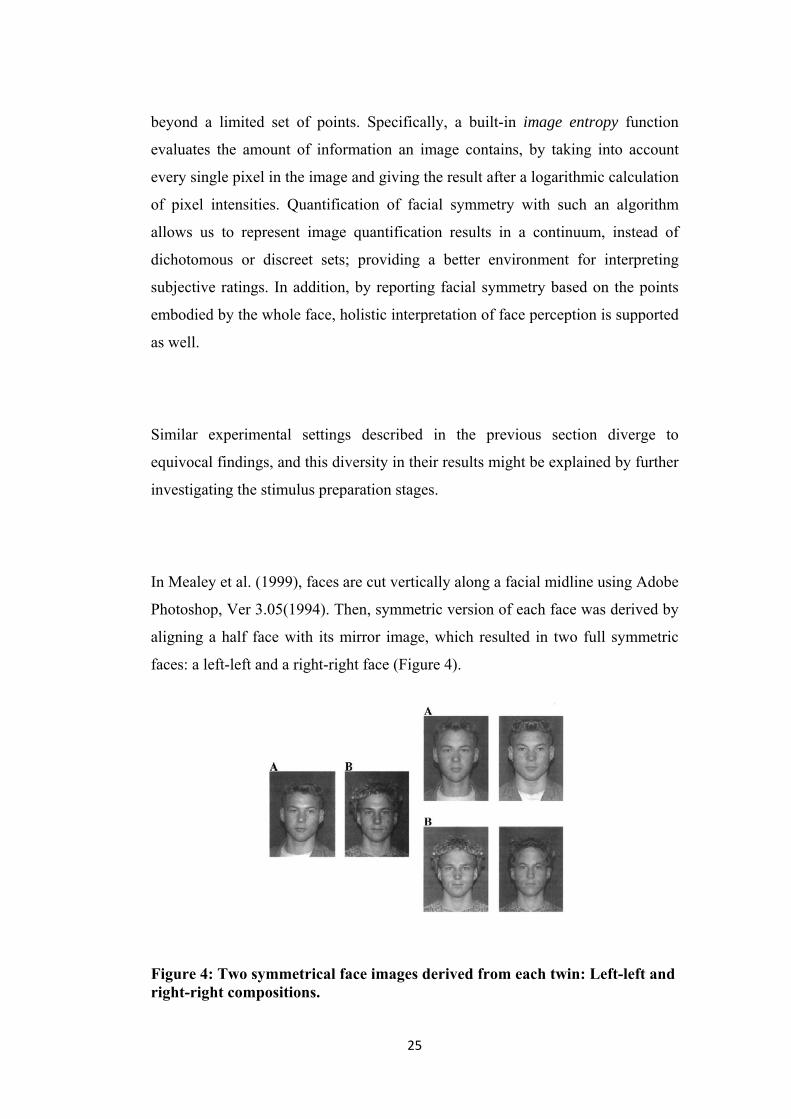
In a study by Swaddle & Cuthill (1995), Gryphon Software Corporation's Morph
program was used to create a spatially warped cross fade between the original face
and its mirror counterpart. Roughly, resulting face is a composite of a left and a
right half face on each side. Images were also masked by severe black ellipses
framing each face which cause an abruptness along the face border. The software
morphs a blend of two images by replacing the elements of each image to an
intermediate position between them. Intermediate morphs (25% and 75%) were
captured during morphing an original face and the mirror image (Figure 5).
Figure 5: Five classes of symmetrical images generated with Gryphon Software: Original (i), 25% symmetrical (ii), Full symmetrical (iii), 75% symmetrical (iv), and mirror (v).
This technique, although preserving characteristics of facial plane, should be
approached critically; for morphing software generates composite images with
27
lower resolutions than their originals. Images with different resolutions violate the
homogeneity of a stimulus set, hence are hard to be analyzed as a comparable set
of stimuli.
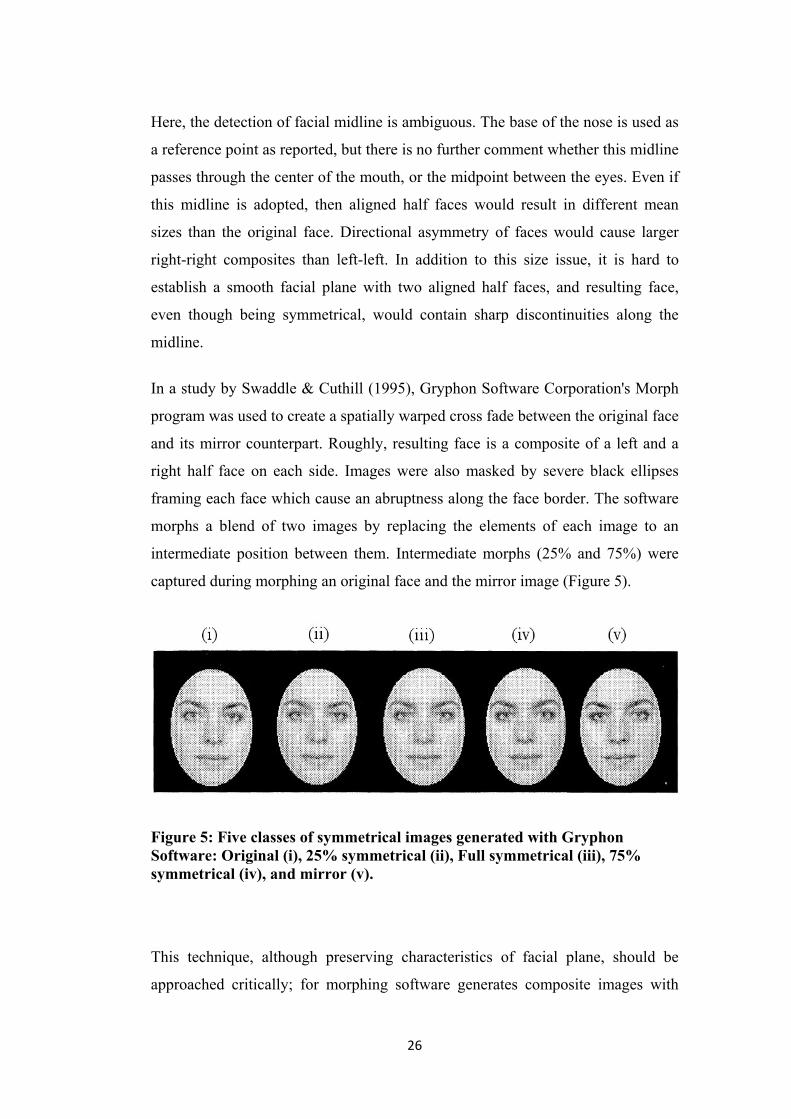
Tjan and Liu (2005), on the other hand, used three dimensional face models, and
represented each model, O, as an 512 512 array of 3D surface position , ,
and pigmentation. Then by swapping these shape and color values, they created
the mirror twin, O', of each face. They manipulated different levels of asymmetry
by taking a weighted vector average of O and O', but keeping surface
pigmentation same as the perfectly symmetric face.
12 1 1 Eqn. 2
As seen from the above equation, each individual has a specific asymmetry scale.
For 1 the synthetic face model represents the original face, and for 0,
is the perfectly symmetric version (Figure 6). Clearly, this translation
handles the continuity of the facial plane along with averaging intensity values
between corresponding pixels of the half faces.
Figure 6: Resulting face morphs from Equation 2: Starts with an original image (i), symmetrical image in the middle of the figure (ii), and the mirror version at the end (iii).
28
In addition to these morphing methods, Chen et al. (2006) computed the
symmetry index for each face with an intricate algorithm as follows:
"The symmetry index is computed based on the power spectrum of the Fourier
transform of the face images. Here we were only interested in the horizontal
symmetry. Hence, we computed the difference of the power at the points ,
and – , , where kx and ky are horizontal and vertical spatial frequencies of
the images (in the upper halfplane, excluding the horizontal axis). The symmetry
index is computed as a function of the root mean square difference of the power
between corresponding frequencies summed over the spectrum." (p. 2, Chen, Kao,
Tyler, 2006)
Although being an elaborative approach to quantify symmetry, Chen et al.'s
method is not the most convenient quantification algorithm to adopt in current
thesis, due to lack of documentation of its relationship with subjective judgments.
2.5. MOTIVATION FOR THE PRESENT THESIS
Faces have been focus of attention in perception studies, for evolutionary,
developmental, and social psychological research for decades. The amount of
information they possess will keep researchers continue investigating what a face
means to us. Our perceiving of faces may be judged qualitatively with respect to
subjective ratings reported by the viewer. However, quantifying the amount of
information an image represents needs a thorough practice.
Subjective judgments on faces have been analyzed in detail by numerous studies,
and the role of facial symmetry is emphasized in almost all of them. Healthiness,
attractiveness, trustworthiness have been related to symmetry. These results also
29
reveal qualitative facts, without suggesting any quantitative interpretation between
the image presented and subjective data collected.
Realizing the role of symmetry in face perception, to determine a quantitative
measure for facial asymmetry becomes an issue of ultimate importance. However,
quantifying symmetry in face images has not been well defined as it is in
mathematical sense. Previously mentioned methods are either insufficient for
controlling face stimuli, or when they sophisticatedly quantify images with
complicated algorithms they lack comparisons with subjective data.
Hence, there is an obvious need in the face perception research for comparison of
sophisticated quantifications and controlled face stimuli with subjective
judgments on faces.
30
CHAPTER 3
3. EXPERIMENTS
Evidence provided in the previous chapter demonstrates that there is a relationship
between perceived symmetry and subjective judgments on faces. However,
qualitative results from such research leave a gap in literature about quantifying
the effect of symmetry perception. Previously reported studies also imply
conflicting results on whether symmetric faces are attractive or not; which in part,
may be explained by variant techniques used for symmetrizing face images.
There are two behavioral experiments covered in this chapter. For both
experiments, we used computer-manipulated and natural looking face images
which are quantified in terms of symmetry they possess with two different
methods: landmark-based quantification and entropy-based quantification as a
novel approach. The techniques used to quantify face images are explained in
detail in the next section. In the first experiment, the goal is to correlate quantified
31
symmetry levels of face images with attractiveness ratings to find the main effect
of symmetry on facial attractiveness. In the second experiment, subjective reports
of participants on perceived symmetry is tested against previously quantified
symmetry levels.
3.1. CONSTRUCTION OF STIMULUS SET
The stimuli used in both experiments are chosen from the METU Face Database,
which are a set of face images, especially prepared for this study. Except for the
specific purpose of preparation, this database may serve as stimuli for future
behavioral research as well as imaging studies. In this section, preparation of
database is explained in detail.
3.1.1. METU-Face Database
METU Face Database consists of two parts. The first part is a collection of 50
colored face photographs (DBC). Faces in the DBC database are in upright frontal
pose and they are neutral, i.e. they do not express emotion. The pictures in this
collection are raw material, the images are not manipulated. Second part of the
database includes normalized black/white photographs, acquired by processing
the pictures in the first part. It consists of 250 frontal face photographs, which are
grouped into five subsets: 1) Original Database (DBO), 2) Mirror Database
(DBM), 3) Symmetric Database (DBS), 4) Intermediate Original Database
(DBIO), and 5) Intermediate Mirror Database (DBIM). Subsets are defined
according to gradual differences in asymmetry of faces. Original face
photographs, located in the DBO, are obtained from the DBC database after
several normalization steps involving gray scale standardization, face-size
rescaling and head-tilt adjustments. The remaining databases, DBM, DBS, DBIO
and DBIM are obtained from DBO by using image morphing techniques to
32
produce several different levels of symmetry. As an important contribution, on
each face picture, asymmetry is quantified using both landmark-based and
entropy-based methods.
3.1.1.1. Physical Adjustments and Acquisition of Pictures
Appropriate physical conditions are provided in the computer laboratory of
Informatics Institute, METU, using two halogen lamps with 250W, a shelf
mounted on the background wall where the participants sat, and an HP R706
digital camera attached to a tripod. Lamps are located 90 centimeters away from
subjects with 300 of eccentricity. Tripod, hence the camera was 130 centimeters
away from the wall, and was positioned on the center line perpendicular to the
wall. Participants were seated upright in front of the wall with their heads located
under the shelf. The shelf was used to minimize head tilts. In addition to this shelf,
a grid with 2x2 centimeter squares was stuck on the wall so that the photographer
sees and corrects the models’ body postures while shooting. Models were
instructed to look directly into the camera and pose in neutral expression.
In this configuration, mug shots of 75 people were taken. 22 photographs were
excluded from the database due to the extremeness of some features such as
eyebrows, facial wrinkles and unacceptable widening effects in the eyes while
filming. Overall, 53 pictures are collected as JPEG files in dimensions 2208x1664
or 2256x1696 pixels. After the pilot studies on subjective ratings of these images,
three more images were excluded because they were outliers according to the
ratings. We used these excluded images for practice sessions in part one and two.
33
3.1.1.1.1. Digital Pre-Processing Procedures
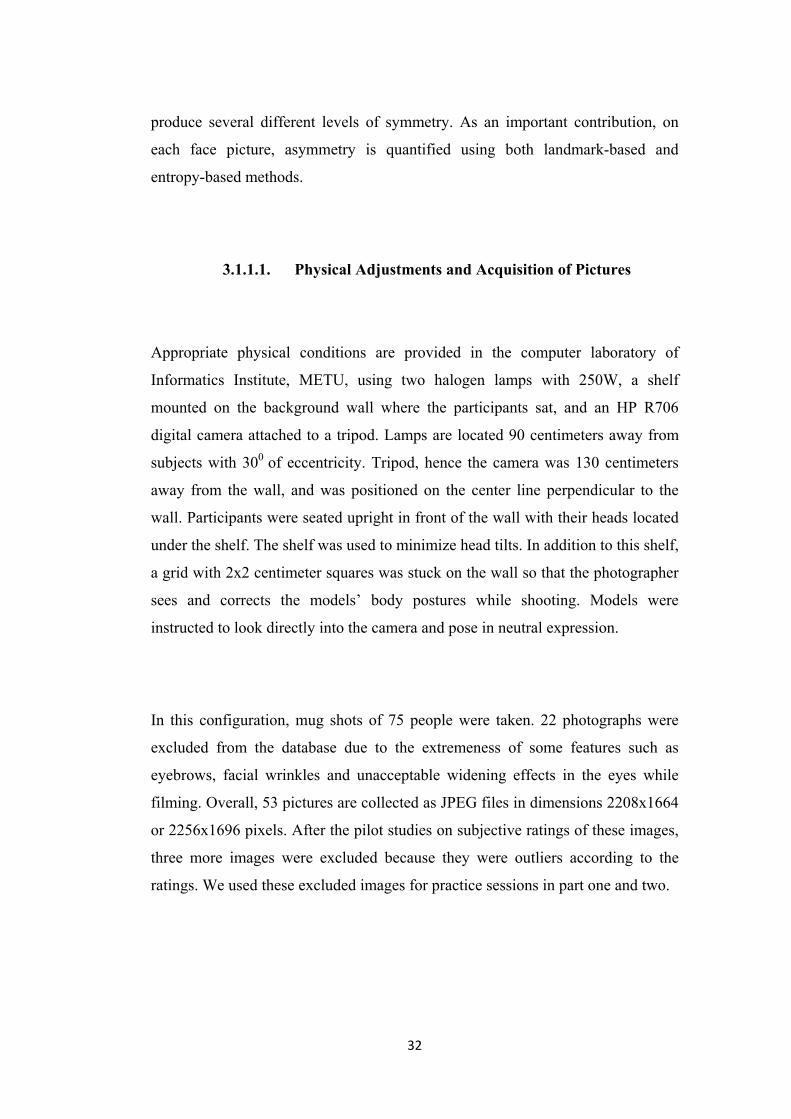
In the raw set of 50 photographs, faces of the models show subtle variations in
head orientation, head size, texture quality and skin color. As illustrated in Figure
7, several processes are run in order to minimize these variations and normalize
photographs to produce the DBO.
Figure 7: Steps of pre-processing and morphing procedures, with input and output databases.
34
RGB to Gray:
Using GNU Image Manipulation Program (GIMP), colored images in DBC are
first converted to gray scale images. As a result, each pixel's value was reduced
from three layer (red-green-blue) values to single intensity values.
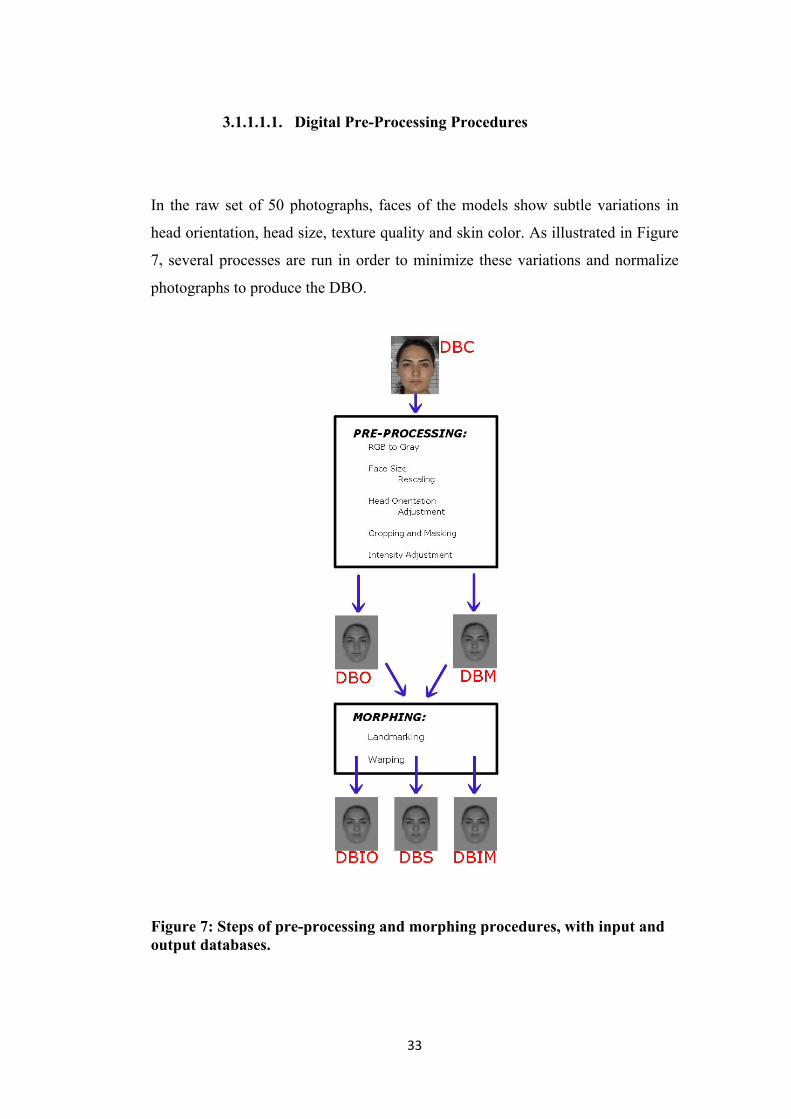
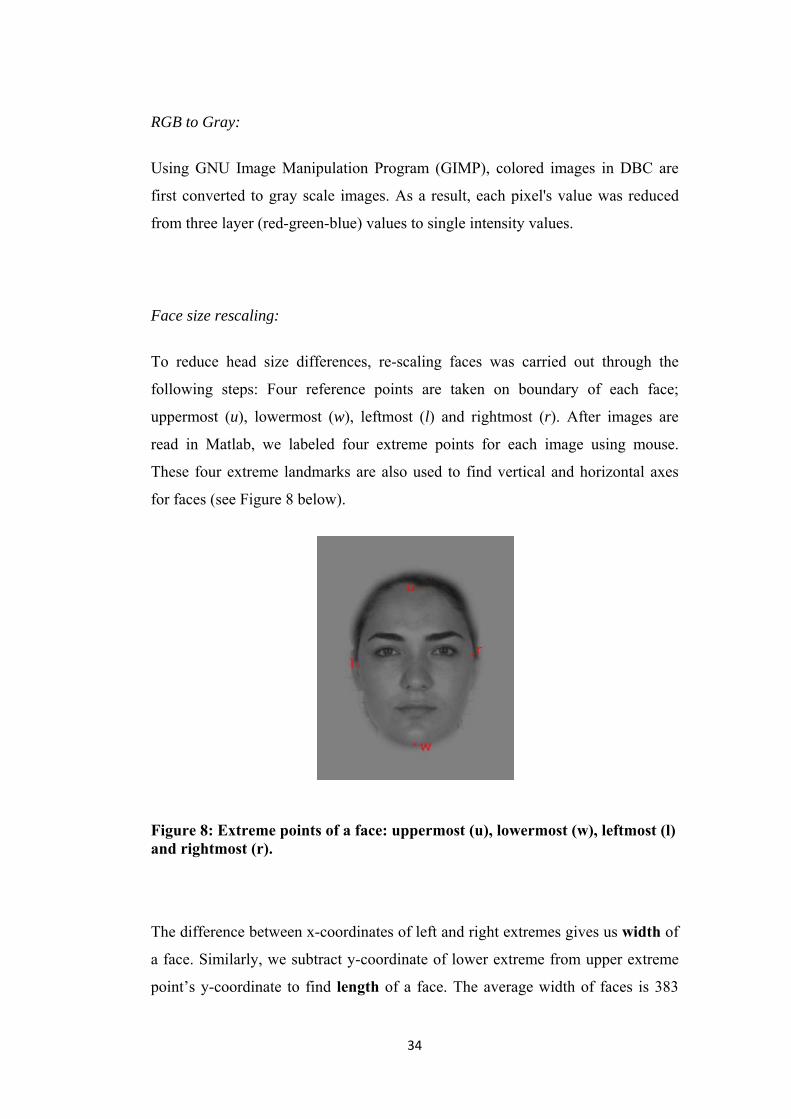
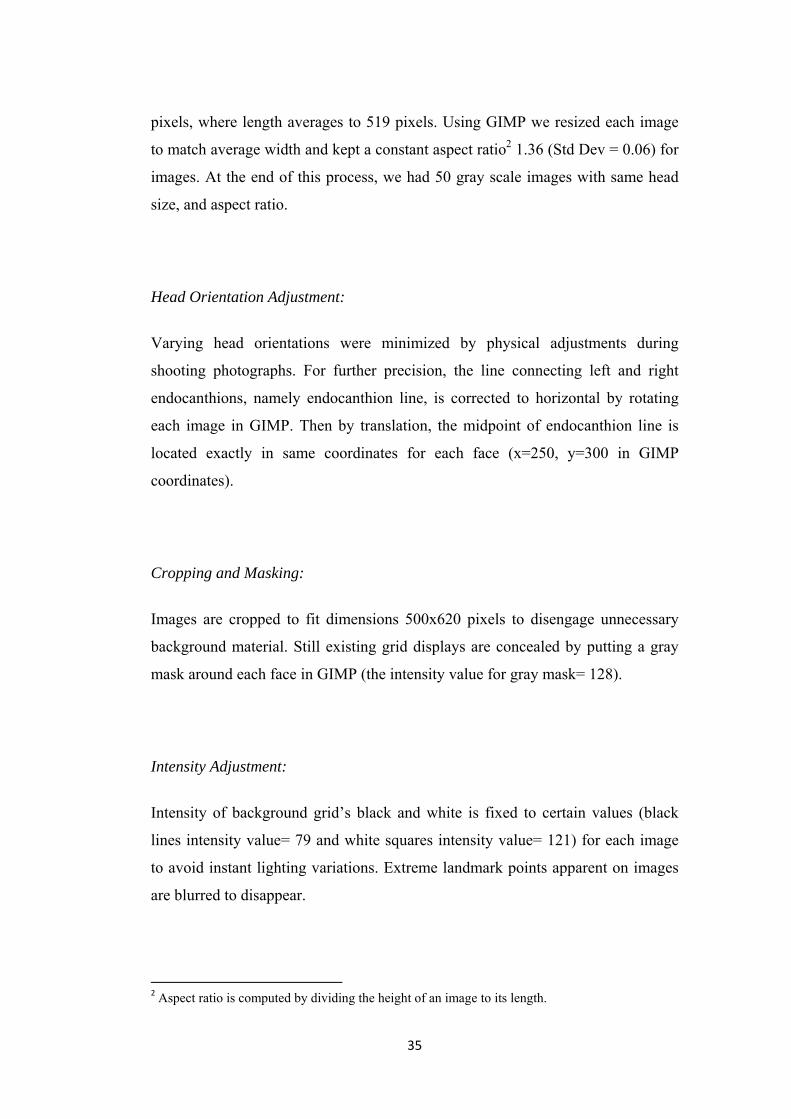
Face size rescaling:
To reduce head size differences, re-scaling faces was carried out through the
following steps: Four reference points are taken on boundary of each face;
uppermost (u), lowermost (w), leftmost (l) and rightmost (r). After images are
read in Matlab, we labeled four extreme points for each image using mouse.
These four extreme landmarks are also used to find vertical and horizontal axes
for faces (see Figure 8 below).
Figure 8: Extreme points of a face: uppermost (u), lowermost (w), leftmost (l) and rightmost (r).
The difference between x-coordinates of left and right extremes gives us width of
a face. Similarly, we subtract y-coordinate of lower extreme from upper extreme
point’s y-coordinate to find length of a face. The average width of faces is 383
35
pixels, where length averages to 519 pixels. Using GIMP we resized each image
to match average width and kept a constant aspect ratio2 1.36 (Std Dev = 0.06) for
images. At the end of this process, we had 50 gray scale images with same head
size, and aspect ratio.
Head Orientation Adjustment:
Varying head orientations were minimized by physical adjustments during
shooting photographs. For further precision, the line connecting left and right
endocanthions, namely endocanthion line, is corrected to horizontal by rotating
each image in GIMP. Then by translation, the midpoint of endocanthion line is
located exactly in same coordinates for each face (x=250, y=300 in GIMP
coordinates).
Cropping and Masking:
Images are cropped to fit dimensions 500x620 pixels to disengage unnecessary
background material. Still existing grid displays are concealed by putting a gray
mask around each face in GIMP (the intensity value for gray mask= 128).
Intensity Adjustment:
Intensity of background grid’s black and white is fixed to certain values (black
lines intensity value= 79 and white squares intensity value= 121) for each image
to avoid instant lighting variations. Extreme landmark points apparent on images
are blurred to disappear.
2 Aspect ratio is computed by dividing the height of an image to its length.
36
Blurring:
Final process was to smooth images with a Gaussian blur filter3 (3 pixels radius),
and it was only applied to databases pre-DBO and pre-DBM. This was done to
equalize the texture of original and mirror images with other images' texture,
which are already blurred as a result of morphing.
After all, normalized images regarding to orientation, size and texture constitute
the original database (DBO). In other words, DBO includes 50 black and white
images of identical dimensions (500x620 pixels), with the same gray level
intensity; where each face has equivalent width and height; and eyes are located in
the middle of each image.
3.1.1.2. Creation of Faces with Variable Asymmetry
Once original images are prepared, it is rather straightforward to derive mirror
images from them. By using the GIMP software, we flip images in DBO with
respect to the middle vertical axis of the frame (please note that this is not the
same as the vertical axis defined above) to build DBM. As a result, DBM consists
of mirror-reversed displays of the images in DBO; in other words, left in DBO
goes to right in DBM and vice versa.
3A Gaussian blur filter is a built-in function of GIMP; it blurs regions with low contrast, and results in a dimmer image.
37
3.1.1.2.1. Morphing
For the remaining three databases, Fantamorph4 software is utilized using the
DBO and DBM datasets. With Fantamorph, we created a morphing video between
two corresponding source images taken from DBO and DBM. While morphing a
certain image to its mirror version, we extracted the middle frame (50%) during
the course of movie. This frame is the half way through original to mirror, thus it
displays a symmetrical face. By extracting the middle frames from all movies, 50
symmetric faces are acquired and they make up the symmetric database (DBS).
In a similar fashion, the frame at a 25 per cent instant of the morphing movie
course gives us an intermediate original face; i.e. resulting face is a composite of
the original and symmetric versions of the same face. Likewise, to obtain the face
between symmetric and mirror-image face, we extracted the frame in 75% of
movie. These extracted frames in 25% and 75% of the each movie form pictures
in the intermediate original (DBIO) and intermediate mirror (DBIM) databases
respectively. The main difference between 25% morphed and 75% morphed
images is that 25% is the composite of an original and a symmetrical image,
where 75% is composed of a symmetrical image and a mirror image; hence these
two kinds of images are flipped versions of each other. Substantially, 25% and
75% images have the same level of asymmetry; however they are not identical
since they are derived from original and mirror images, respectively. The purpose
of using two sets of stimuli with the same level of asymmetry is to examine
whether symmetry processing is different with respect to left and right half faces.
4 Available from website URL: http://www.fantamorph.com/
38
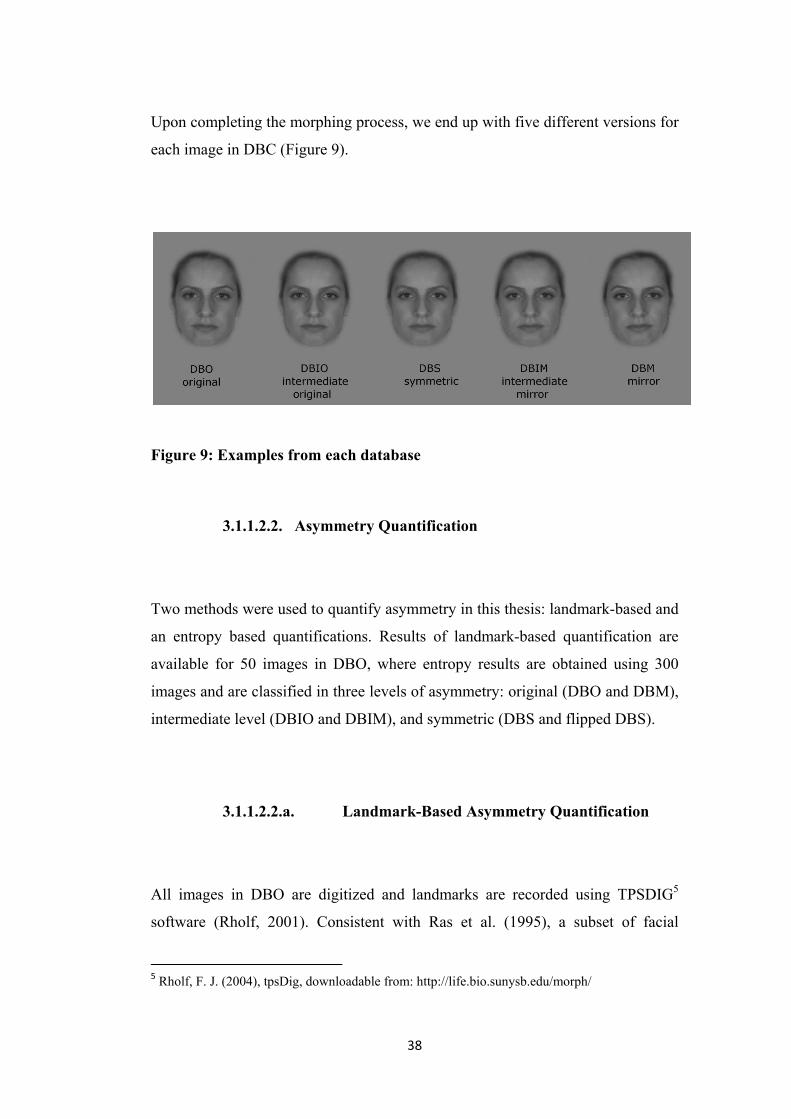
Upon completing the morphing process, we end up with five different versions for
each image in DBC (Figure 9).
Figure 9: Examples from each database
3.1.1.2.2. Asymmetry Quantification
Two methods were used to quantify asymmetry in this thesis: landmark-based and
an entropy based quantifications. Results of landmark-based quantification are
available for 50 images in DBO, where entropy results are obtained using 300
images and are classified in three levels of asymmetry: original (DBO and DBM),
intermediate level (DBIO and DBIM), and symmetric (DBS and flipped DBS).
3.1.1.2.2.a. Landmark-Based Asymmetry Quantification
All images in DBO are digitized and landmarks are recorded using TPSDIG5
software (Rholf, 2001). Consistent with Ras et al. (1995), a subset of facial
5 Rholf, F. J. (2004), tpsDig, downloadable from: http://life.bio.sunysb.edu/morph/
39
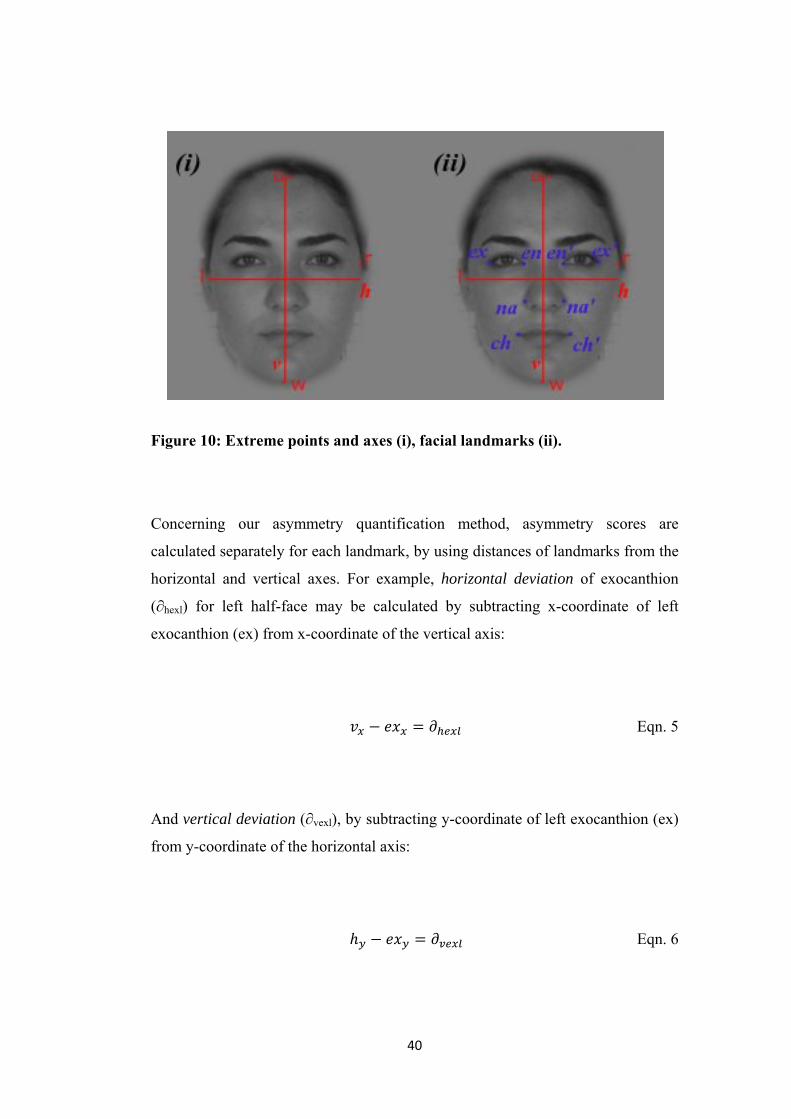
anatomical landmarks, such as, exocanthion (ex), endocanthion (en), nasalion
(na), and cheilion (ch) is used (Figure 10). There are two points for left and right
half faces, which brings about four bilateral landmarks (1: ex, ex'; 2: en, en'; 3: na,
na'; 4: ch, ch') for a face. After digitizing, every face has 24 coordinate values: 8
anatomical landmarks, 4 extreme landmarks; each having x and y-coordinates (see
Appendices G, H, and I).
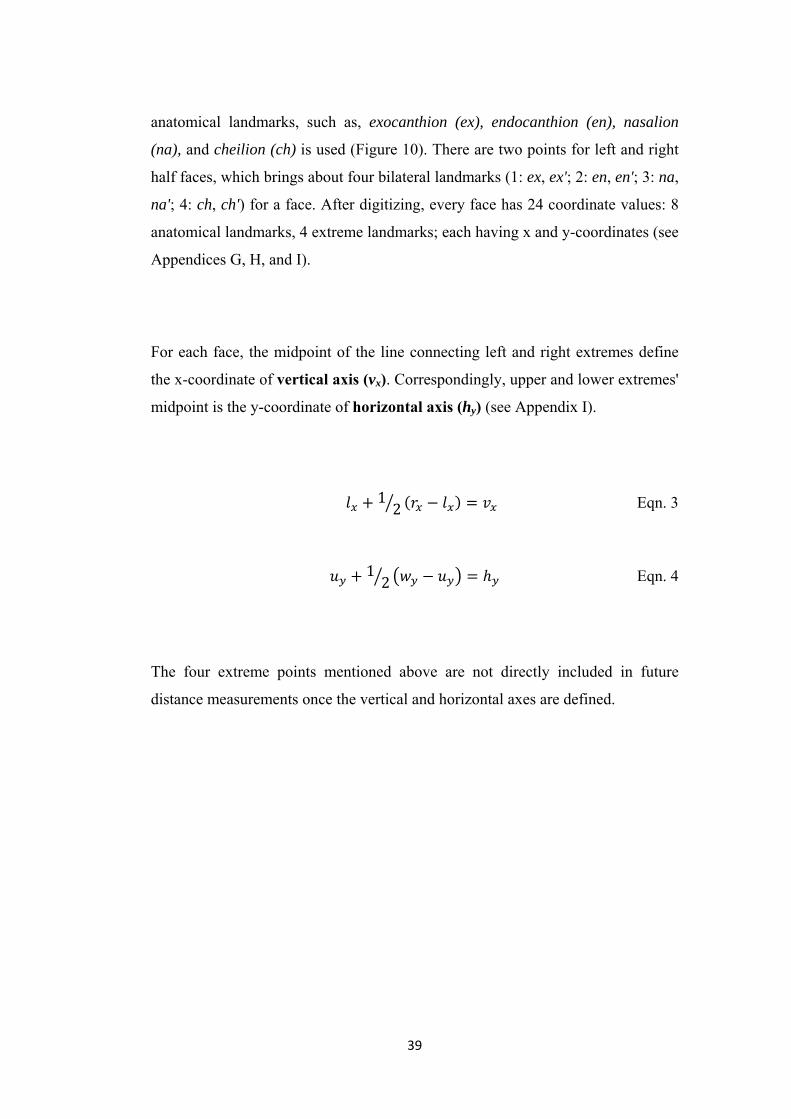
For each face, the midpoint of the line connecting left and right extremes define
the x-coordinate of vertical axis (vx). Correspondingly, upper and lower extremes'
midpoint is the y-coordinate of horizontal axis (hy) (see Appendix I).
12 Eqn. 3
12 Eqn. 4
The four extreme points mentioned above are not directly included in future
distance measurements once the vertical and horizontal axes are defined.
40
Figure 10: Extreme points and axes (i), facial landmarks (ii).
Concerning our asymmetry quantification method, asymmetry scores are
calculated separately for each landmark, by using distances of landmarks from the
horizontal and vertical axes. For example, horizontal deviation of exocanthion
(∂hexl) for left half-face may be calculated by subtracting x-coordinate of left
exocanthion (ex) from x-coordinate of the vertical axis:
Eqn. 5
And vertical deviation (∂vexl), by subtracting y-coordinate of left exocanthion (ex)
from y-coordinate of the horizontal axis:
Eqn. 6
41
Similarly, ∂hexr ∂vexr are calculated for the right exocanthion, and indicate the
horizontal and vertical deviations of the right exocanthion respectively:
Eqn. 7
Eqn. 8
In order to calculate asymmetry score of a specific landmark, for instance,
exocanthion, its distance to the vertical and horizontal axes on the L and R sides
must be compared. To illustrate, if we subtract right exocanthion’s distance to v
(denoted as ∂hexr) from left exocanthion’s distance to v (∂hexl) we get the first
asymmetry score EXv:
Eqn. 9
Please note that this shows the horizontal asymmetry of the exocanthion, but since
it is computed depending on the vertical axis, notation is EXv instead of EXh.
Similarly, the difference between left and right exocanthions’ distance to the
horizontal axis defines EXh :
Eqn. 10
As a result, for each face, there are four local scores dependent on the vertical axis
(EXv, NAv, CHv, ENv); and three local scores are dependent on the horizontal axis
(EXh, NAh, CHh)6. While vertical axis dependent scores reveal mostly the
6 As mentioned before, in order to normalize head orientations we changed coordinates of
endocanthions. Their y-coordinates are relocated to be on the same line for each image; hence do
not represent individual information any more, as being the cost of head justification. For this
reason, we omitted two landmarks (en, en’) while measuring vertical distances.
42
directional asymmetry to the sides; vertically based scores show fluctuating
asymmetry along upright direction (See Appendix K).
Other than individual vertical and horizontal asymmetry scores for the landmarks,
we also calculated two global asymmetry scores for each face:
Eqn. 11
Eqn. 12
3.1.1.2.2.b. Entropy-Based Asymmetry Quantification
Apart from facial landmarks, we also checked asymmetry of the whole face.
Considering images, bilateral symmetry notion is re-defined with respect to the
middle vertical axis of the image frame. Asymmetry is quantified by evaluating
the image entropy (the amount of information the image carries) as follows.
We registered the original and flipped images in Matlab, which in this case means
original (from DBO) and mirror (from DBM) images of the same face. First we
subtract the mirror image from the original with ‘imsubtract’ function which
is a built-in function of Matlab library. This algorithm handles images pixel by
pixel; hence each pixel of the left half is subtracted from corresponding pixel on
the right. As a result, we have a matrix for every pair, displaying the difference
between right half of the image and left half of the image. After subtraction,
‘entropy’ function is run for each matrix, and we end up with an entropy value
(a scalar value) for each original and mirror image pair, these line of processes
gave us entropy values for original level symmetrical images. Same steps are
followed for pairs of one image from DBIO and corresponding image from DBIM
43
to establish entropy values of intermediate level symmetrical images. For fully
symmetric images, we created a new image set by flipping the symmetric image
vertically (DBSf). Image differences of pairs from DBS and DBSf were
quantified, and entropy values for symmetrical images were found. As a result of
entropy based quantification, five classes (DBO, DBIO, DBS, DBIM, and DBM)
of symmetry were reduced to three levels: 1) asymmetrical, 2) intermediate level
symmetrical, and 3) symmetrical.
3.1.1.3. Participants for the METU Face Database
Participants are chosen from the Middle East Technical University graduate
student body (29 women, 24 men, Age = 25.3 ±2.7). All participants signed a
consent form expressing their agreement for the pictures to be used in relevant
studies and their publication for academic purposes. Male participants with beard
and/or mustache are excluded from the study, female participants are asked to
remove make-up when necessary. Both male and female participants are asked to
take off their glasses, ear-rings, and other facial accessories before photographing.
3.1.1.4. Results
Results from the entropy based quantifications revealed the amount of information
between image pairs; in other words, if the images of a pair were highly different,
then their entropy value was also larger (demonstrated in Figure 11). As expected,
mean entropy value for original images was the largest ( 1.7259 0.12).
Entropy values for intermediate level symmetrical images were relatively lower
( 1.4791 0.10), because their asymmetries were reduced during
morphing into intermediate levels. Finally, lowest entropy values were acquired
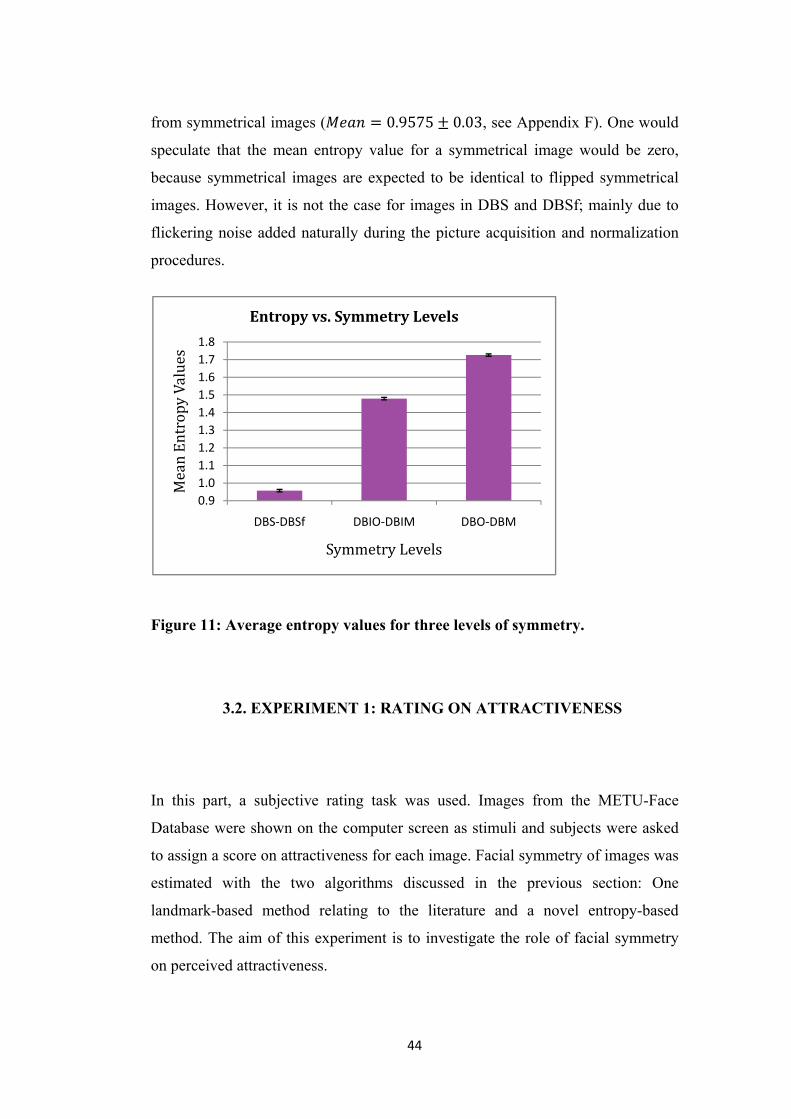
44
from symmetrical images ( 0.9575 0.03, see Appendix F). One would
speculate that the mean entropy value for a symmetrical image would be zero,
because symmetrical images are expected to be identical to flipped symmetrical
images. However, it is not the case for images in DBS and DBSf; mainly due to
flickering noise added naturally during the picture acquisition and normalization
procedures.
Figure 11: Average entropy values for three levels of symmetry.
3.2. EXPERIMENT 1: RATING ON ATTRACTIVENESS
In this part, a subjective rating task was used. Images from the METU-Face
Database were shown on the computer screen as stimuli and subjects were asked
to assign a score on attractiveness for each image. Facial symmetry of images was
estimated with the two algorithms discussed in the previous section: One
landmark-based method relating to the literature and a novel entropy-based
method. The aim of this experiment is to investigate the role of facial symmetry
on perceived attractiveness.
0.91.01.11.21.31.41.51.61.71.8
DBS‐DBSf DBIO‐DBIM DBO‐DBM
Mea
n En
trop
y Va
lues
Symmetry Levels
Entropy vs. Symmetry Levels
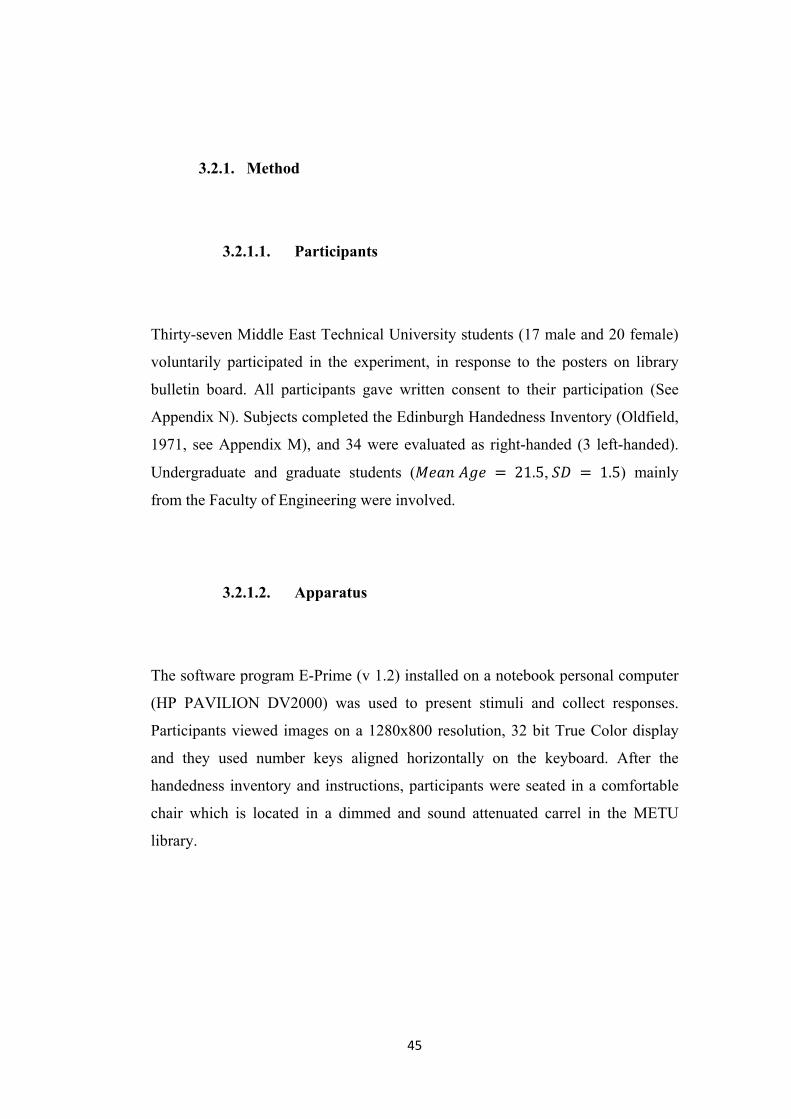
45
3.2.1. Method
3.2.1.1. Participants
Thirty-seven Middle East Technical University students (17 male and 20 female)
voluntarily participated in the experiment, in response to the posters on library
bulletin board. All participants gave written consent to their participation (See
Appendix N). Subjects completed the Edinburgh Handedness Inventory (Oldfield,
1971, see Appendix M), and 34 were evaluated as right-handed (3 left-handed).
Undergraduate and graduate students ( 21.5, 1.5) mainly
from the Faculty of Engineering were involved.
3.2.1.2. Apparatus
The software program E-Prime (v 1.2) installed on a notebook personal computer
(HP PAVILION DV2000) was used to present stimuli and collect responses.
Participants viewed images on a 1280x800 resolution, 32 bit True Color display
and they used number keys aligned horizontally on the keyboard. After the
handedness inventory and instructions, participants were seated in a comfortable
chair which is located in a dimmed and sound attenuated carrel in the METU
library.
46
3.2.1.3. Procedure
Participants were instructed both verbally and with a detailed handout (see
Appendix N) to rate each image -not each face- on attractiveness as quickly as
possible. They were also informed that this is a two-part study, and they will be
rating images for second experiment as well, but this time on a different criterion.
Until the second experiment, no mentioning of symmetry was made; neither in the
call for participation nor in the instructions. Hence participants were impartial to
facial symmetry in the first part.
A practice session was run before the experiment, where participants rated 10
images different from the ones in test session. In the test session, each participant
rated 250 images from the METU-Face database in a randomized sequence.
Randomization was achieved through E-Prime software options. Images were
presented in five sets of 50 images; every 50-image-sets consisted of 50 different
individuals and five different symmetry groups (10 from each database: DBO,
DBIO, DBS, DBIM, and DBM).
A fixation cross slide preceded every image slide, and the participant had the
liberty to rest before stimulus onset, where s/he could terminate the fixation
period anytime by pressing space bar. Face stimuli were displayed one by one in
the center of the screen with a scale from 1 to 9 (1=not attractive at all, 9=very
attractive, Figure 12) at the bottom.
Figure 12: Each face image appeared with a rating scale at the bottom.
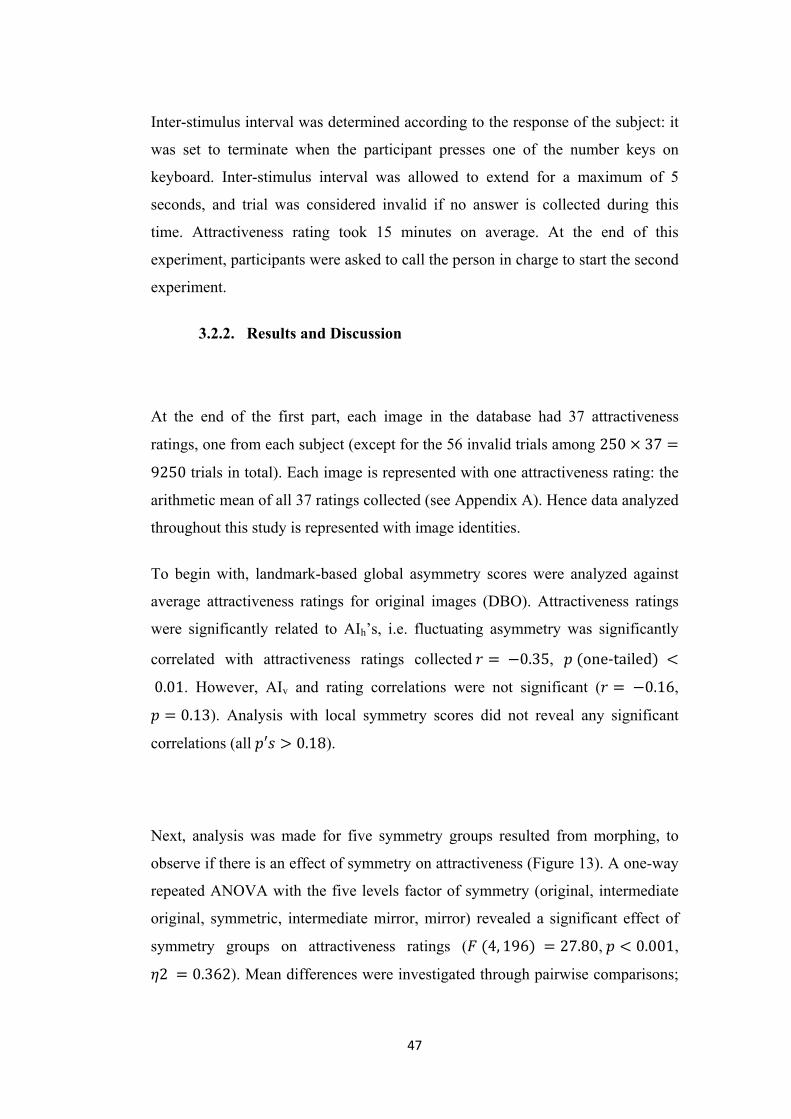
47
Inter-stimulus interval was determined according to the response of the subject: it
was set to terminate when the participant presses one of the number keys on
keyboard. Inter-stimulus interval was allowed to extend for a maximum of 5
seconds, and trial was considered invalid if no answer is collected during this
time. Attractiveness rating took 15 minutes on average. At the end of this
experiment, participants were asked to call the person in charge to start the second
experiment.
3.2.2. Results and Discussion
At the end of the first part, each image in the database had 37 attractiveness
ratings, one from each subject (except for the 56 invalid trials among 250 37
9250 trials in total). Each image is represented with one attractiveness rating: the
arithmetic mean of all 37 ratings collected (see Appendix A). Hence data analyzed
throughout this study is represented with image identities.
To begin with, landmark-based global asymmetry scores were analyzed against
average attractiveness ratings for original images (DBO). Attractiveness ratings
were significantly related to AIh’s, i.e. fluctuating asymmetry was significantly
correlated with attractiveness ratings collected 0.35, one‐tailed
0.01. However, AIv and rating correlations were not significant ( 0.16,
0.13). Analysis with local symmetry scores did not reveal any significant
correlations (all 0.18).
Next, analysis was made for five symmetry groups resulted from morphing, to
observe if there is an effect of symmetry on attractiveness (Figure 13). A one-way
repeated ANOVA with the five levels factor of symmetry (original, intermediate
original, symmetric, intermediate mirror, mirror) revealed a significant effect of
symmetry groups on attractiveness ratings ( 4, 196 27.80, 0.001,
2 0.362). Mean differences were investigated through pairwise comparisons;
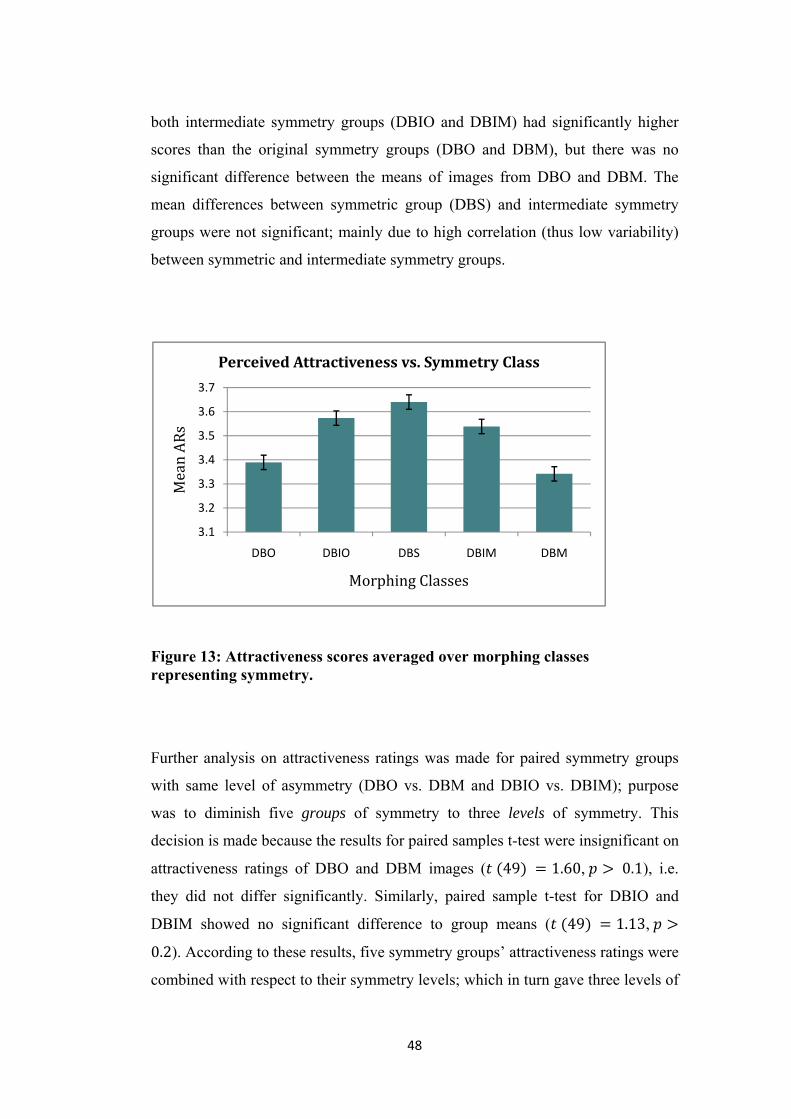
48
both intermediate symmetry groups (DBIO and DBIM) had significantly higher
scores than the original symmetry groups (DBO and DBM), but there was no
significant difference between the means of images from DBO and DBM. The
mean differences between symmetric group (DBS) and intermediate symmetry
groups were not significant; mainly due to high correlation (thus low variability)
between symmetric and intermediate symmetry groups.
Figure 13: Attractiveness scores averaged over morphing classes representing symmetry.
Further analysis on attractiveness ratings was made for paired symmetry groups
with same level of asymmetry (DBO vs. DBM and DBIO vs. DBIM); purpose
was to diminish five groups of symmetry to three levels of symmetry. This
decision is made because the results for paired samples t-test were insignificant on
attractiveness ratings of DBO and DBM images ( 49 1.60, 0.1), i.e.
they did not differ significantly. Similarly, paired sample t-test for DBIO and
DBIM showed no significant difference to group means ( 49 1.13,
0.2). According to these results, five symmetry groups’ attractiveness ratings were
combined with respect to their symmetry levels; which in turn gave three levels of
3.1
3.2
3.3
3.4
3.5
3.6
3.7
DBO DBIO DBS DBIM DBM
Mea
n AR
s
Morphing Classes
Perceived Attractiveness vs. Symmetry Class
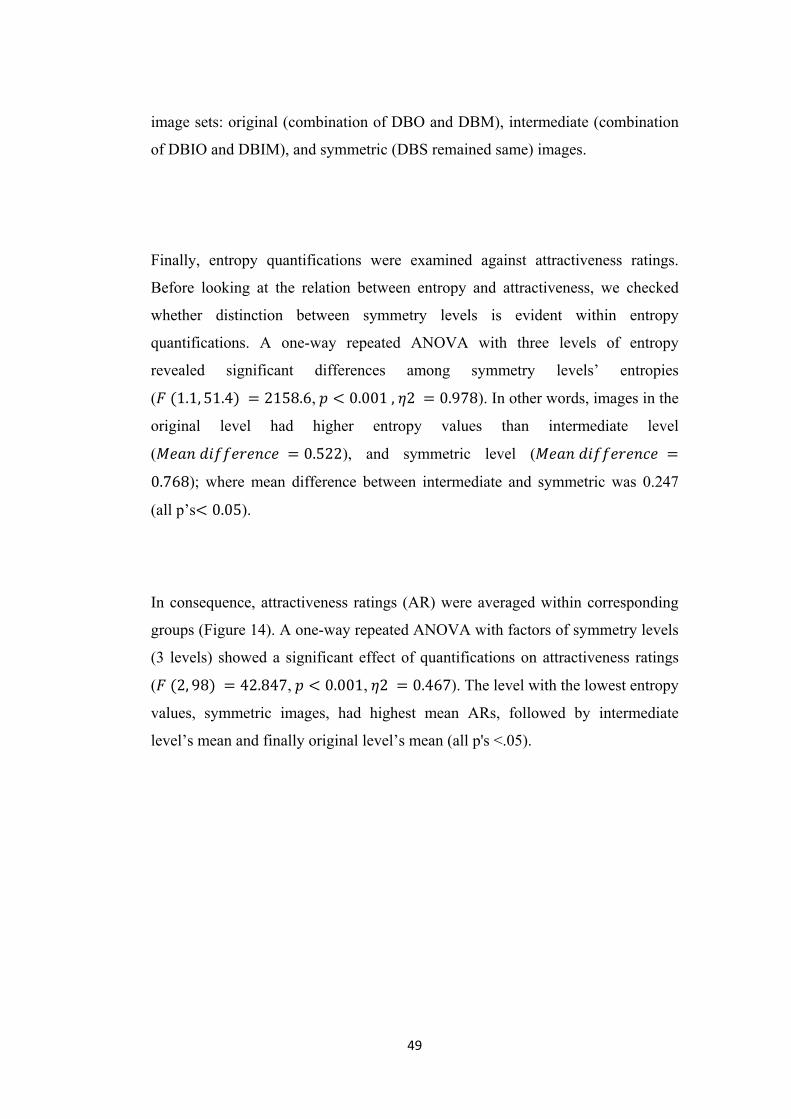
49
image sets: original (combination of DBO and DBM), intermediate (combination
of DBIO and DBIM), and symmetric (DBS remained same) images.
Finally, entropy quantifications were examined against attractiveness ratings.
Before looking at the relation between entropy and attractiveness, we checked
whether distinction between symmetry levels is evident within entropy
quantifications. A one-way repeated ANOVA with three levels of entropy
revealed significant differences among symmetry levels’ entropies
( 1.1, 51.4 2158.6, 0.001 , 2 0.978). In other words, images in the
original level had higher entropy values than intermediate level
( 0.522), and symmetric level (
0.768); where mean difference between intermediate and symmetric was 0.247
(all p’s 0.05).
In consequence, attractiveness ratings (AR) were averaged within corresponding
groups (Figure 14). A one-way repeated ANOVA with factors of symmetry levels
(3 levels) showed a significant effect of quantifications on attractiveness ratings
( 2, 98 42.847, 0.001, 2 0.467). The level with the lowest entropy
values, symmetric images, had highest mean ARs, followed by intermediate
level’s mean and finally original level’s mean (all p's <.05).
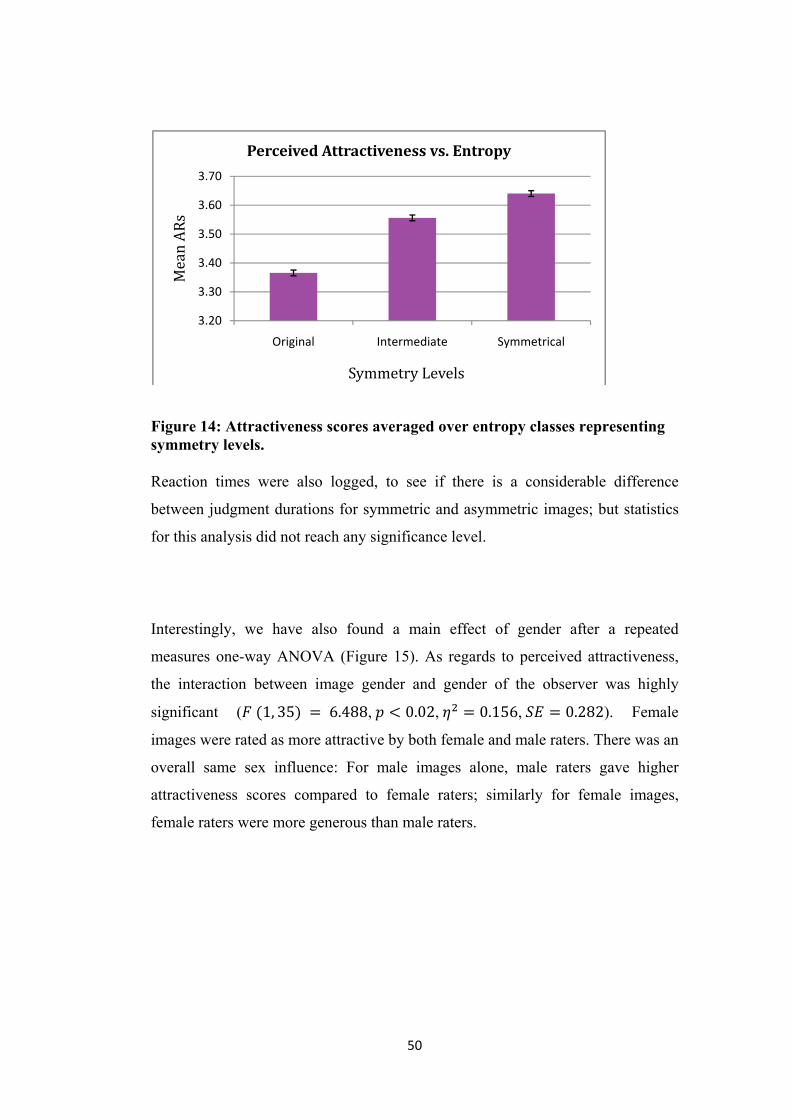
50
Figure 14: Attractiveness scores averaged over entropy classes representing symmetry levels.
Reaction times were also logged, to see if there is a considerable difference
between judgment durations for symmetric and asymmetric images; but statistics
for this analysis did not reach any significance level.
Interestingly, we have also found a main effect of gender after a repeated
measures one-way ANOVA (Figure 15). As regards to perceived attractiveness,
the interaction between image gender and gender of the observer was highly
significant ( 1, 35 6.488, 0.02, 0.156, 0.282). Female
images were rated as more attractive by both female and male raters. There was an
overall same sex influence: For male images alone, male raters gave higher
attractiveness scores compared to female raters; similarly for female images,
female raters were more generous than male raters.
3.20
3.30
3.40
3.50
3.60
3.70
Original Intermediate Symmetrical
Mea
n AR
s
Symmetry Levels
Perceived Attractiveness vs. Entropy
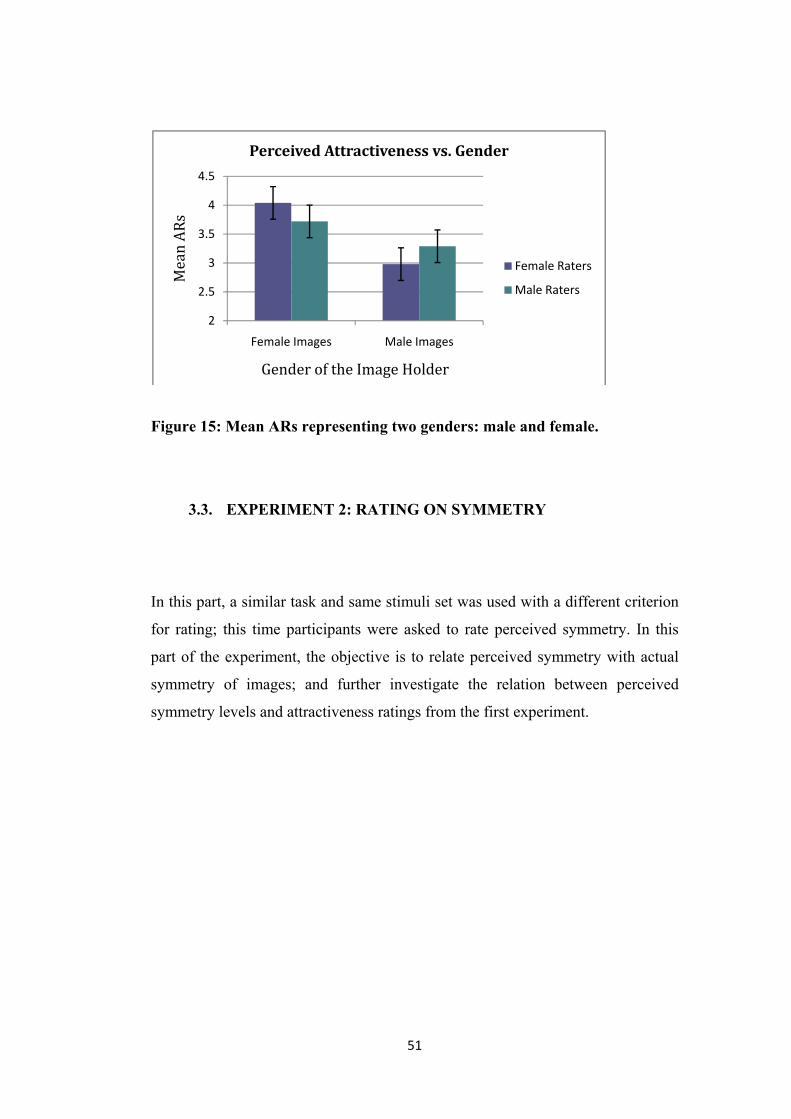
51
Figure 15: Mean ARs representing two genders: male and female.
3.3. EXPERIMENT 2: RATING ON SYMMETRY
In this part, a similar task and same stimuli set was used with a different criterion
for rating; this time participants were asked to rate perceived symmetry. In this
part of the experiment, the objective is to relate perceived symmetry with actual
symmetry of images; and further investigate the relation between perceived
symmetry levels and attractiveness ratings from the first experiment.
2
2.5
3
3.5
4
4.5
Female Images Male Images
Mea
n AR
s
Gender of the Image Holder
Perceived Attractiveness vs. Gender
Female Raters
Male Raters
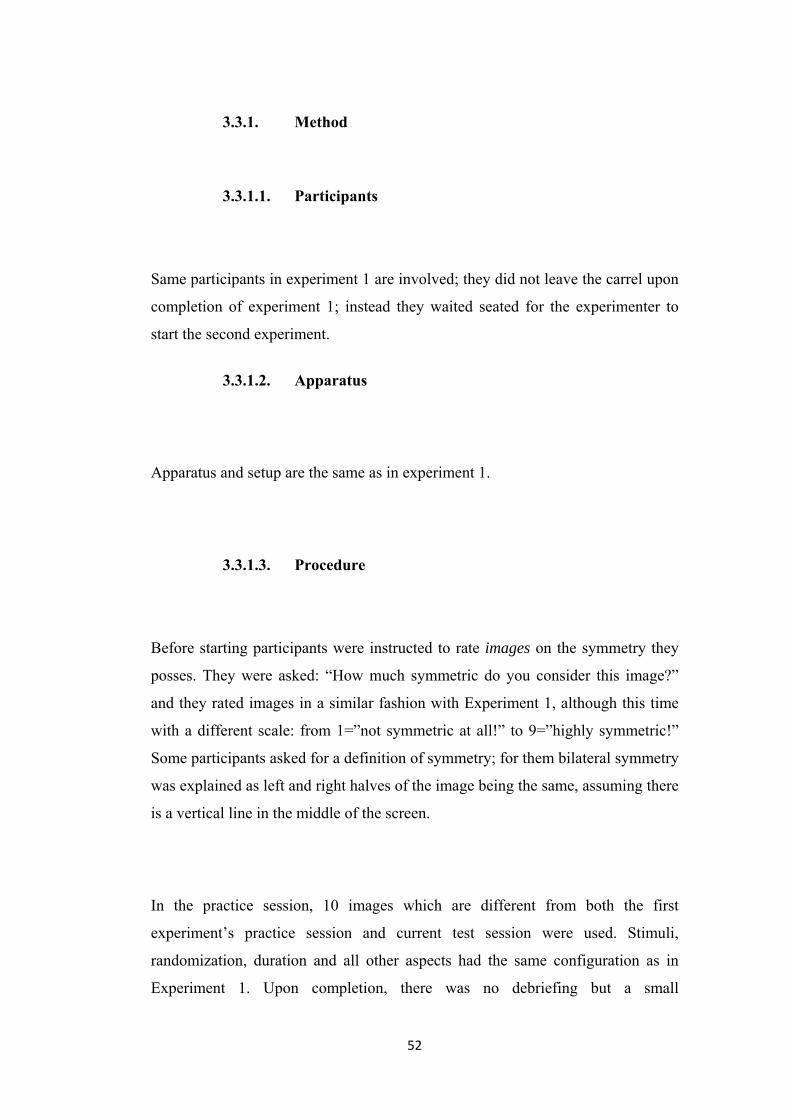
52
3.3.1. Method
3.3.1.1. Participants
Same participants in experiment 1 are involved; they did not leave the carrel upon
completion of experiment 1; instead they waited seated for the experimenter to
start the second experiment.
3.3.1.2. Apparatus
Apparatus and setup are the same as in experiment 1.
3.3.1.3. Procedure
Before starting participants were instructed to rate images on the symmetry they
posses. They were asked: “How much symmetric do you consider this image?”
and they rated images in a similar fashion with Experiment 1, although this time
with a different scale: from 1=”not symmetric at all!” to 9=”highly symmetric!”
Some participants asked for a definition of symmetry; for them bilateral symmetry
was explained as left and right halves of the image being the same, assuming there
is a vertical line in the middle of the screen.
In the practice session, 10 images which are different from both the first
experiment’s practice session and current test session were used. Stimuli,
randomization, duration and all other aspects had the same configuration as in
Experiment 1. Upon completion, there was no debriefing but a small
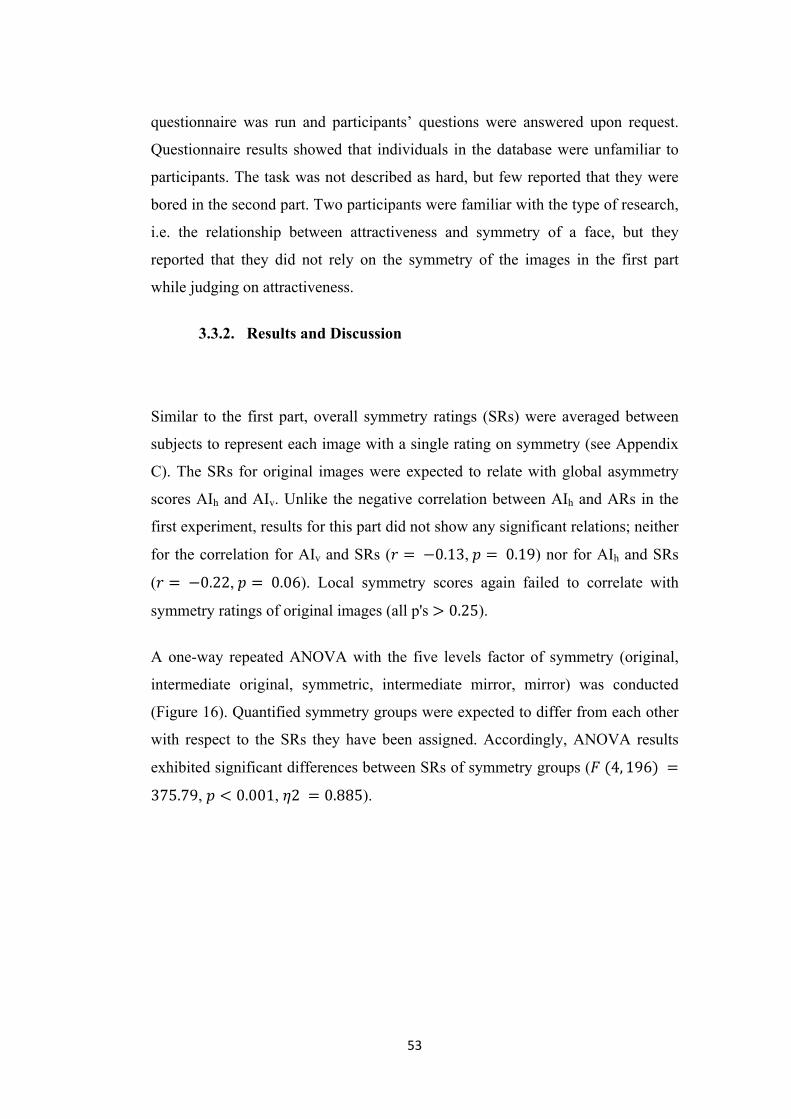
53
questionnaire was run and participants’ questions were answered upon request.
Questionnaire results showed that individuals in the database were unfamiliar to
participants. The task was not described as hard, but few reported that they were
bored in the second part. Two participants were familiar with the type of research,
i.e. the relationship between attractiveness and symmetry of a face, but they
reported that they did not rely on the symmetry of the images in the first part
while judging on attractiveness.
3.3.2. Results and Discussion
Similar to the first part, overall symmetry ratings (SRs) were averaged between
subjects to represent each image with a single rating on symmetry (see Appendix
C). The SRs for original images were expected to relate with global asymmetry
scores AIh and AIv. Unlike the negative correlation between AIh and ARs in the
first experiment, results for this part did not show any significant relations; neither
for the correlation for AIv and SRs ( 0.13, 0.19) nor for AIh and SRs
( 0.22, 0.06). Local symmetry scores again failed to correlate with
symmetry ratings of original images (all p's 0.25).
A one-way repeated ANOVA with the five levels factor of symmetry (original,
intermediate original, symmetric, intermediate mirror, mirror) was conducted
(Figure 16). Quantified symmetry groups were expected to differ from each other
with respect to the SRs they have been assigned. Accordingly, ANOVA results
exhibited significant differences between SRs of symmetry groups ( 4, 196
375.79, 0.001, 2 0.885).
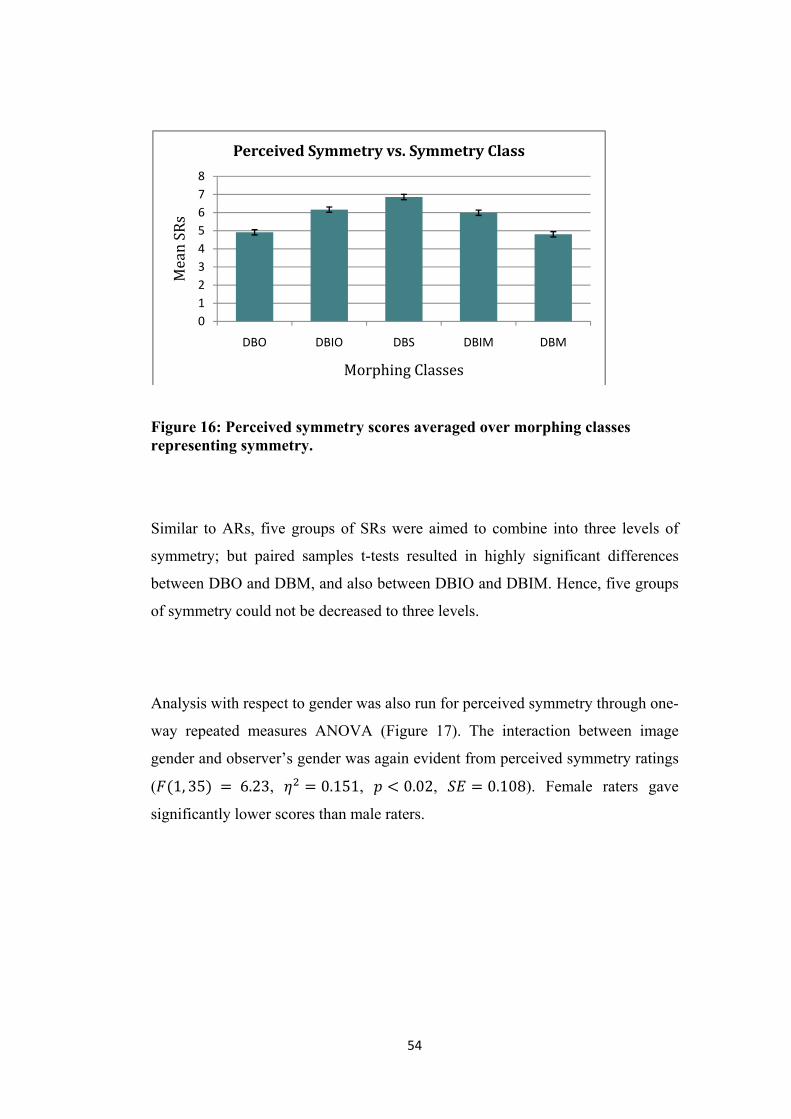
54
Figure 16: Perceived symmetry scores averaged over morphing classes representing symmetry.
Similar to ARs, five groups of SRs were aimed to combine into three levels of
symmetry; but paired samples t-tests resulted in highly significant differences
between DBO and DBM, and also between DBIO and DBIM. Hence, five groups
of symmetry could not be decreased to three levels.
Analysis with respect to gender was also run for perceived symmetry through one-
way repeated measures ANOVA (Figure 17). The interaction between image
gender and observer’s gender was again evident from perceived symmetry ratings
( 1, 35 6.23, 0.151, 0.02, 0.108). Female raters gave
significantly lower scores than male raters.
012345678
DBO DBIO DBS DBIM DBM
Mea
n SR
s
Morphing Classes
Perceived Symmetry vs. Symmetry Class
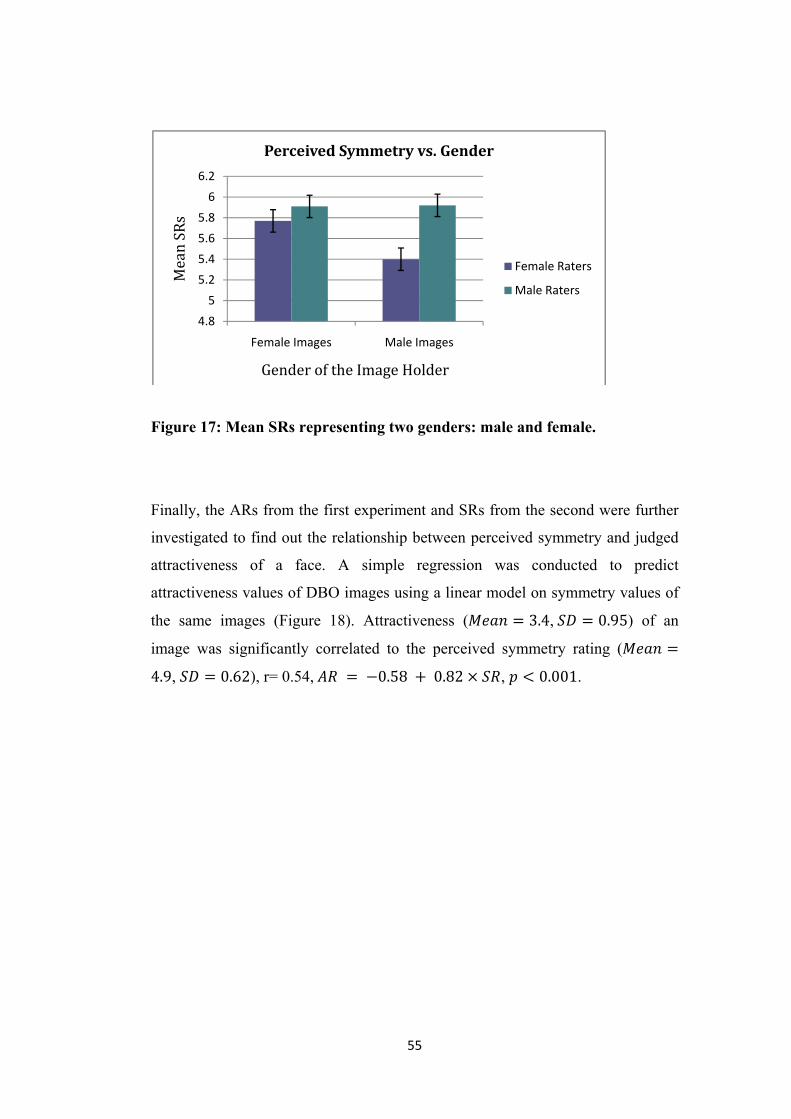
55
Figure 17: Mean SRs representing two genders: male and female.
Finally, the ARs from the first experiment and SRs from the second were further
investigated to find out the relationship between perceived symmetry and judged
attractiveness of a face. A simple regression was conducted to predict
attractiveness values of DBO images using a linear model on symmetry values of
the same images (Figure 18). Attractiveness ( 3.4, 0.95) of an
image was significantly correlated to the perceived symmetry rating (
4.9, 0.62), r= 0.54, 0.58 0.82 , 0.001.
4.8
5
5.2
5.4
5.6
5.8
6
6.2
Female Images Male Images
Mea
n SR
s
Gender of the Image Holder
Perceived Symmetry vs. Gender
Female Raters
Male Raters
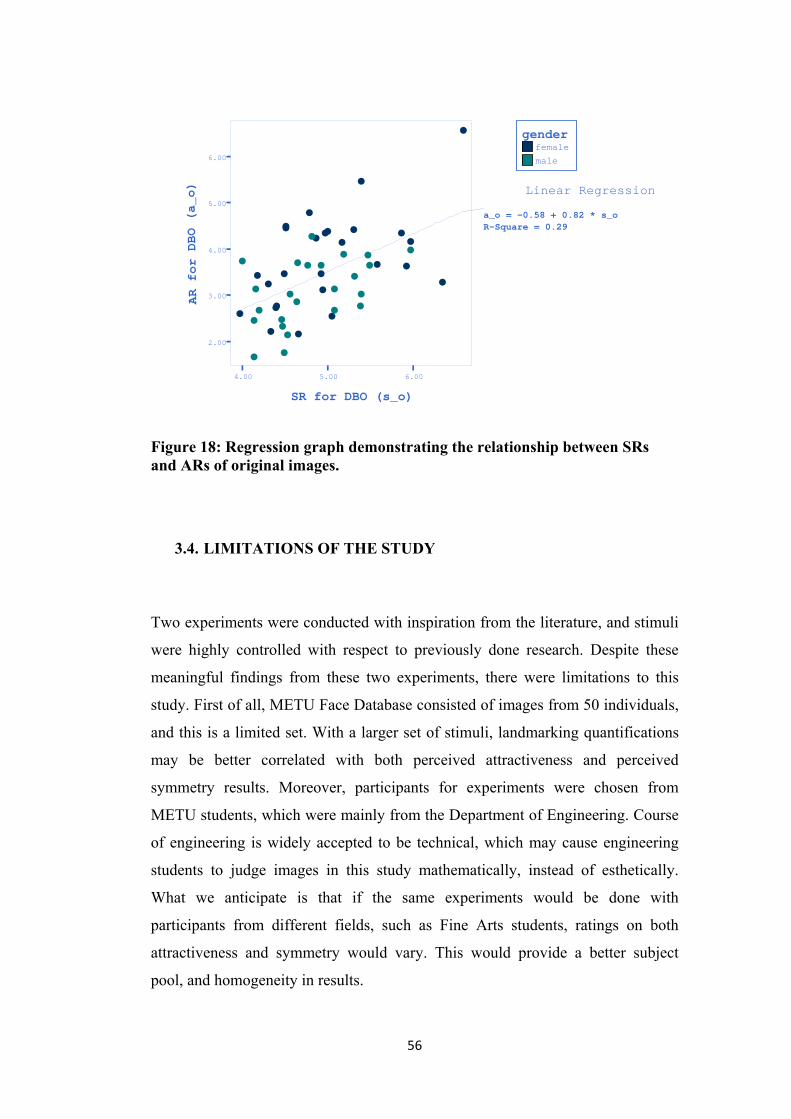
56
Figure 18: Regression graph demonstrating the relationship between SRs and ARs of original images.
3.4. LIMITATIONS OF THE STUDY
Two experiments were conducted with inspiration from the literature, and stimuli
were highly controlled with respect to previously done research. Despite these
meaningful findings from these two experiments, there were limitations to this
study. First of all, METU Face Database consisted of images from 50 individuals,
and this is a limited set. With a larger set of stimuli, landmarking quantifications
may be better correlated with both perceived attractiveness and perceived
symmetry results. Moreover, participants for experiments were chosen from
METU students, which were mainly from the Department of Engineering. Course
of engineering is widely accepted to be technical, which may cause engineering
students to judge images in this study mathematically, instead of esthetically.
What we anticipate is that if the same experiments would be done with
participants from different fields, such as Fine Arts students, ratings on both
attractiveness and symmetry would vary. This would provide a better subject
pool, and homogeneity in results.
female
male
gender
Linear Regression
4.00 5.00 6.00
SR for DBO (s_o)
2.00
3.00
4.00
5.00
6.00
AR for DBO (a_o)
W
W
W
WW
W
W
W
W
W
W
WW
WWW
WW
W
W
W
W
W
WW
W
WW
W
W W
W
W
WW
W
W
W
W
W
W
W
WW
WW W
W
W
W
a_o = -0.58 + 0.82 * s_oR-Square = 0.29
57
CHAPTER 4
4. DISCUSSION AND CONCLUSION
The effect of symmetry on face perception was studied thoroughly in the
evolutionary psychology literature, and the relationship between facial symmetry
and attractiveness is a well established concept in the field (Thornhill, Gangestad,
1999). Symmetry is repeatedly shown to signal facial attractiveness, but
conflicting evidence is also present. One way to resolve this issue is to use similar
experimental designs with better controlled stimuli, and this inspires the first
motivation of current thesis. In the literature, quantification of symmetry in face
images has been handled via a multitude of methods such as morphing images or
landmarking facial features. Despite the fact that these methods could explain
some aspects of the relationship between subjective ratings and facial symmetry,
they were insufficient to quantify faces wholesomely, and correlate subjective
ratings with quantified symmetry measures numerically. Relying on the theories
of holistic face perception, the present study aimed to find a novel approach for
holistic face symmetry quantification and remain consistent with the subjective
58
face perception literature at the same time. In addition, the general goal was to
correlate quantified subjective judgments on faces with the proposed face
symmetry measures.
As a first step, natural looking images with varying symmetry levels were
constructed. As explained in Chapter 3, through several image processing and
morphing procedures, we established different symmetry classes for images with
continuous facial planes and natural looking skin textures. METU-Face Database
consists of 250 images clustered in five classes of symmetry: Original (DBO),
Intermediate-Original (DBIO), Symmetrical (DBS), Intermediate-Mirror (DBIM),
and Mirror (DBM). These distinct classes were challenged to receive different
attractiveness and symmetry ratings in Experiment 1 and Experiment 2,
respectively. As a result, the images in DBS were found to have the highest mean
ratings for both attractiveness and perceived symmetry. Once again, this result
demonstrated that symmetry and attractiveness vary along the same lines, even
when stimuli (images in DBO) were strictly controlled. In addition to this,
symmetry reports collected in the second experiment revealed that the five
morphing classes were actually apparent to observers, because in observer’s
ratings, these classes were differentiated from each other significantly through the
analysis of the SRs. Regression analysis results showed a strong relationship
between ARs and SRs considered on these five morphing classes. As this result
indicates, it is possible to account for the attractiveness of a face with the
symmetry level it conveys.
Specifically, we have found exactly the opposite result of Swaddle and Cuthill
study (1995) with using a similar experimental setting. Morphing process was
almost same with theirs, except that we used Fantamorph software instead of
Gryphon software they have used. They have reported a main effect of image
manipulation, and concluded that symmetric images were the least attractive
found set. Contrary to their result, images in DBS were found to be the most
attractive. In our face images, the degree of manipulation has been minimized.
59
Due to this, we believe that we have eliminated the effect of manipulation which
repotedly effects perceived attractiveness. Thereby showing the relation between
symmetry and attractiveness with natural looking but also quantified images. And
hence eliminating the manipulation aftereffects might be the cause for the
mismatch in our results and Swaddle and Cuthill’s results.
We also observed that the interaction between image gender and observer’s
gender was significant. Female images were found more attractive regardless of
the observer’s gender. Females gave higher ARs for female images than male
raters; but it was not the case for male images. For male images, male raters gave
higher ARs than female raters. This result can be summarized as each gender was
in favor of his/her own sex; females supported female images, where males’
preferences were towards males. This finding is conflicting with the results of
Mealey et al. They have accounted for males rating male images lower by
suggesting an evolutionary approach; our results do not indicate any devaluation
approach for males. For symmetry ratings, males rated both types of images
similarly symmetrical, where female raters showed a difference for the gender of
the image. They rated female images more symmetrical than male images. This
result can be explained by female observers’ more elaborative perceptual skills
compared to males. While female raters closely examined each image before they
rated; male observers might have expected a more salient asymmetry in images,
hence could not differentiate subtle deviations. This is just an intuitive reasoning,
mostly depending on post-experimental communications with raters, where males
reported that image repetition was more frequent than it actually was.
Generation of five classes of symmetry was only one method through which we
tried to quantify facial symmetry and its correlation with subjective ratings. The
other two methods were: 1. Quantification of facial symmetry with landmarks
based on facial features, and 2. Quantification of facial symmetry through a
holistic measure, entropy.
60
For landmark-based symmetry quantification, we used the first set of images
(DBO). Landmark-based quantification was efficient to account for perceived
attractiveness; as expected, images with lower scores of facial asymmetry on the
vertical direction (AIh) received higher ARs in Experiment 1. However, horizontal
deviations (AIv) did not show any correlation with the perceived attractiveness of
a face. As a conclusion from this finding, it can be said that observers' perception
of facial symmetry appears to be more sensitive to vertical deviations than
horizontal deviations of the face. Landmark-based scores were also used to
investigate perceived symmetry in Experiment 2, but they were not correlated
with each other. Therefore, it can be said that observers' reports on the symmetry
they perceived are not sensitive to facial landmarks. Even though different classes
of images was adequate to explain subjects' reports on symmetry levels of
morphed images, their perception of symmetry in the original faces could not be
explained with the landmarking scores. Together with the previous result, one
could deduce that, although observers' ratings relied on their sensation of vertical
deviations of faces, they were not strong enough to be reported; hence were not
evident in SRs.
Through the other method, entropy-based symmetry quantification, the five
classes of symmetry were successfully differentiated. Since this type of holistic
quantification was insensitive to the display of the face as original or mirror; we
joined DBO with DBM and DBIO with DBIM. Hence, entropy-based
quantification let us investigate the five symmetry groups as three.
These three symmetry levels, however, is consistent with our finding that within
morphing classes, there was no difference for DBM and DBO, and for DBIO and
DBIM regarding to ARs as revealed by the t-tests in Experiment 1. These pairs of
classes possess same levels of symmetry, as acquired with entropy-based
61
quantification, they are more like mirror reflections of each other. Hence,
overlapping ARs suggest that there is no left-right difference when we consider
observers' perception of attractiveness: left half of the face is perceived as equally
attractive as the right half. Consequently, in analysis done with three levels of
symmetry, it is demonstrated that our entropy scores were highly sufficient to
elaborate on the ARs they were given. Images with lower entropy scores (less
asymmetry) received higher ARs.
On the other hand, in Experiment 2, significant t-test results showed that SRs for
DBO and DBM images are not the same, neither is it true for DBIO and DBIM
image pairs. In this case, we were not able to join two classes of symmetry; hence
it was impossible to examine the perception of symmetry against entropy scores.
Significant results in this part clearly points out a difference for symmetry
perception for the right and left of a face. This outcome may bear important
contingencies for research involving left-left and right-right symmetrical face
construction. Besides disturbing the facial plane, building face images with two
half faces is not plausible since symmetry perception is not the same for left and
right. To sum up, we found that L-R differences do not change attractiveness
judgments, but carry importance in perceived symmetry of a face.
To conclude, our efforts to quantify perceived symmetry with morphing classes as
well as entropy quantifications produced results consistent with the literature.
Landmark scores were correlated with attractiveness ratings, as hypothesized.
However, the landmark scores failed to rationalize symmetry ratings. This failure
may be due to discontinuous approach of landmarking, where only facial feature
points are quantified; instead of quantifying the whole face. Morphing classes
were speculated to represent differences in both symmetry and attractiveness
ratings, and this conjecture was also verified. All of our findings were consistent
with previous literature, as the symmetry of a face increased, the chance of it
being perceived more attractive increased as well.
62
In addition to these, we have introduced a novel measure to quantify facial
symmetry: entropy. Attractiveness rating of a face increased as its entropy score
(hence asymmetry) decreased. Entropy-based quantifications of symmetry were
more accurate than splitting faces into symmetry groups; hence correlation of
subjective judgments with this type of facial symmetry measure increased the
precision of findings in the literature.
In our study, we present a set of stimuli with well-defined quantifications of
symmetry; and these data might be used in various fields concerning symmetry
research. For further study, current database should be upgraded to include at least
twice as many images so that the results are more definite. After this process is
done, database would provide a better stimulus set for experimental settings that
require longer stimulus presentation. With current 250 images, we have shown
expressive behavioral results; these results may be challenged with brain imaging
research in the future, and examined to see whether entropy measures can also be
used to account for brain activity. Furthermore, entropy quantifications may also
be used in computer face recognition algorithms to extend the already available
biometric data to increase the precision of automatic face recognition.
63
5. REFERENCES
Adobe Photoshop (Version 3.05). (1994). San Jose, CA: Adobe Systems.
Baylis,G.C., Driver,J. (1995). Parallel computation of symmetry but not repetition within single visual shapes. Visual Cognition 1, 377-400.
Bornstein, M. H., Ferdinandsen, K., & Gross, C. G. (1981). Perception of symmetry in infancy. Developmental Psychology, 17, 82 – 86.
Carey, S., Diamond, R. (1977). From piecemeal to configurational representation of faces. Science, 195(4275), 312-314.
Chen, A. C., German, C., Zaidel, D. W. (1997). Brain asymmetry and facial attractiveness: Facial beauty is not simply in the eye of the beholder. Neuropsychologia, 35(4), 471-476.
Chen, C. C., Kao, K. C., & Tyler, C. W. (2006). Face Configuration Processing in the Human Brain: The Role of Symmetry. Cerebral Cortex.
Cohen, E., & Zaidi, Q. (2007). Salience of mirror symmetry in natural patterns. Journal of Vision, 7(9), 970, 970a.
Damasio, A. R., Damasio, H., & Van Hoesen, G. W. (1982). Prosopagnosia: Anatomic basis and behavioral mechanisms. Neurology, 32(4), 331-341.
Delius, J. D., & Novak, B. (1982). Visual symmetry recognition by pigeons. Psychological Research, 44, 199-212.
Gauthier, I., & Tarr, M. J. (1997). Becoming a "Greeble" expert: Exploring mechanisms for face recognition. Vision Research, 37(12), 1673-1682.
Giurfa, M., Eichmann, B., & Menzel, R. (1996). Symmetry perception in an insect. Nature, 382, 458-461.
64
Haxby, J. V., Hoffman, E. A., & Gobbini, M. I. (2000). The distributed human neural system for face perception. Trends in Cognitive Sciences, 4(6), 223-233.
Hon, G., & Goldstein, B. R. (2008). From Summetria to Symmetry: The Making of a Revolutionary Scientific Concept (Vol. XVI): Springer.
Johnston, J. C., & McClelland, J. L. (1973). Visual factors in word perception. Perception and Psychophysics, 14, 365-370.
Johnston, M. H. (2005). Subcortical Face Processing. Nature Reviews Neuroscience. 6(10), 766-774.
Kanwisher, N., McDermott, J., Chun, M. (1997) The Fusiform Face Area: A Module in Human Extrastriate Cortex Specialized for the Perception of Faces. Journal of Neuroscience. 17, 4302-4311.
Liu, Y., Schmidt, K., Cohn, J., Mitra, S. (2003). Facial asymmetry quantification for expression invariant human identification. Computer Vision and Image Understanding, 91, 138-159.
Liu, Y., Weaver, R. L., Schmidt, K., Serban, N., Cohn, J. (2001). Facial Asymmetry: A New Biometric (No. CMU-RI-TR-01-23). Pittsburgh: The Robotics Institute, Carnegie Mellon University.
Marcus, L. F., M. Corti, A. Loy, G. J. P. Naylor, D. E. Slice, Eds. (1996). Advances in Morphometrics. NATO Advanced Science Institute Series A: Life Sciences, vol. 284. New York, Plenum Press.
Mealey, L., Bridgstock, R., Townsend, G. C. (1999). Symmetry and Perceived Facial Attractiveness: A Monozygotic Co-Twin Comparison. Journal of Personality and Social Psychology, 76(1), 151-158.
Pinker, S. (1997). How the mind works. New York: W. W. Norton & Company.
Purcell, D. G., Stewart, A. L. (1988). The face detection effect: Configuration enhances detection. Perception & Psychophysics, 43(4), 355-366.
Reis, V. A., Zaidel, D. W. (2001). Functional asymmetry in the human face: Perception of health in the left and right sides of the face. Laterality, 6(3), 225-231.
Sai F. Z. (1990) The origins of human face perception by very young infants. Ph.D. Thesis, University of Glasgow, Scotland, UK, submitted.
Sai, F. Z. (2005). The role of the mother's voice in developing mother's face preference: Evidence for intermodal perception at birth. Infant & Child Development, 14(1), 29-50.
65
Sasaki, Y., Vanduffel, W., Knutsen, T., Tyler, C. W., Tootell, R. (2005). Symmetry activates extrastriate visual cortex in human and nonhuman primates. PNAS, 102(8), 3159-3163.
Shannon, C. E. (1948). A Mathematical Theory of Communication. The Bell System Technical Journal, 27, 379-423, 623-656.
Simmons, L. W., Rhodes, G., Peters, M., & Koehler, N. (2004). Are human preferences for facial symmetry focused on signals of developmental instability? Behav. Ecol., 15(5), 864-871.
Swaddle, J. P., & Cuthill, I. C. (1995). Asymmetry and Human Facial Attractiveness: Symmetry May not Always be Beautiful. Proceedings: Biological Sciences, 261(1360), 111-116.
Tanaka, J. W., Farah, M. J. (1991). Second-order relational properties and the inversion effect: Testing a theory of face perception. Perception & Psychophysics, 50(4), 367-372.
Tarr, M. J., Gauthier, I. (2000). FFA: A flexible fusiform area for subordinate-level visual processing automatized by expertise. Nature Neuroscience, 3(8): 764769.
Thornhill, R., Gangestad, S. W. (2006). Facial sexual dimorphism, developmental stability, and susceptability to disease in men and women. Evolution and Human Behavior, 27, 131-144.
Tippett, L. J., Miller, L. A., Farah, M. J. (2000). Prosopamnesia: A selective impairment in face learning. Cognitive Neuropsychology, 17(1-3), 241-255.
Tjan, B. S., Liu, Z. (2005). Symmetry impedes symmetry discrimination. Journal of Vision, 5(10):10
Tyler, C. W. (2002). Human Symmetry Perception and Its Computational Analysis. London: Lawrence Erlbaum Associates, Publishers.
Valentine, T. (1988). Upside-down faces: A review of the effect of inversion upon face. British Journal of Psychology, 79(4), 471.
Wagemans, J. (2002). Detection of Visual Symmetries. In C. W. Tyler (Ed.), Human Symmetry Perception and its Computational Analysis (pp. 393): Lawrence Erlbaum Associates.
Zaidel, D. W., Chen, A. C., & German, C. (1995). She is not a beauty even when she smiles. Neuropsychologia, 33(5), 649-655.
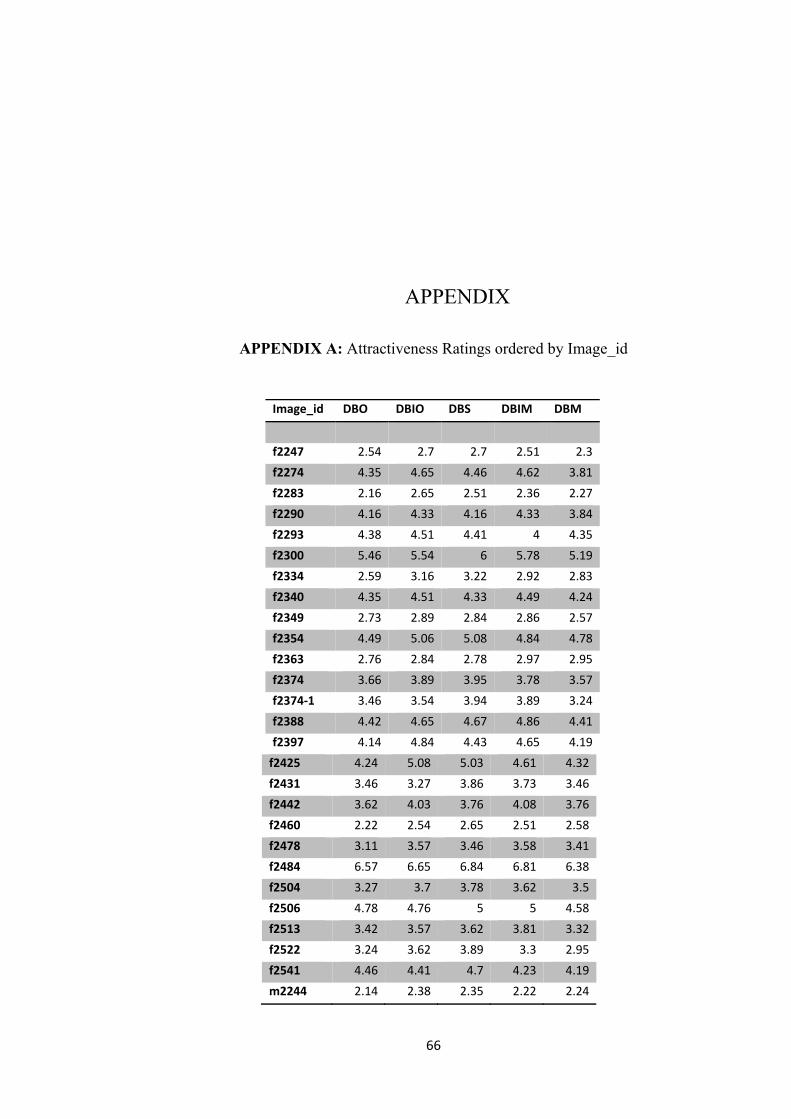
66
6. APPENDIX
APPENDIX A: Attractiveness Ratings ordered by Image_id
Image_id DBO DBIO DBS DBIM DBM
f2247 2.54 2.7 2.7 2.51 2.3
f2274 4.35 4.65 4.46 4.62 3.81
f2283 2.16 2.65 2.51 2.36 2.27
f2290 4.16 4.33 4.16 4.33 3.84
f2293 4.38 4.51 4.41 4 4.35
f2300 5.46 5.54 6 5.78 5.19
f2334 2.59 3.16 3.22 2.92 2.83
f2340 4.35 4.51 4.33 4.49 4.24
f2349 2.73 2.89 2.84 2.86 2.57
f2354 4.49 5.06 5.08 4.84 4.78
f2363 2.76 2.84 2.78 2.97 2.95
f2374 3.66 3.89 3.95 3.78 3.57
f2374‐1 3.46 3.54 3.94 3.89 3.24
f2388 4.42 4.65 4.67 4.86 4.41
f2397 4.14 4.84 4.43 4.65 4.19
f2425 4.24 5.08 5.03 4.61 4.32
f2431 3.46 3.27 3.86 3.73 3.46
f2442 3.62 4.03 3.76 4.08 3.76
f2460 2.22 2.54 2.65 2.51 2.58
f2478 3.11 3.57 3.46 3.58 3.41
f2484 6.57 6.65 6.84 6.81 6.38
f2504 3.27 3.7 3.78 3.62 3.5
f2506 4.78 4.76 5 5 4.58
f2513 3.42 3.57 3.62 3.81 3.32
f2522 3.24 3.62 3.89 3.3 2.95
f2541 4.46 4.41 4.7 4.23 4.19
m2244 2.14 2.38 2.35 2.22 2.24
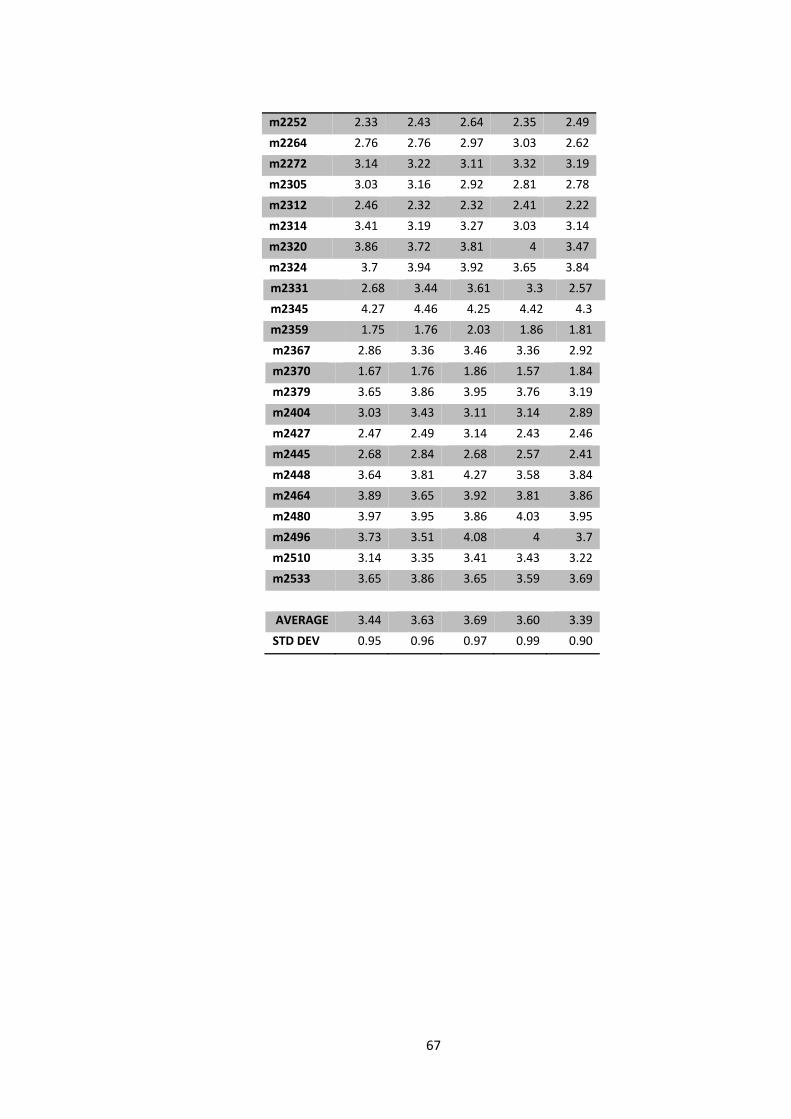
67
m2252 2.33 2.43 2.64 2.35 2.49
m2264 2.76 2.76 2.97 3.03 2.62
m2272 3.14 3.22 3.11 3.32 3.19
m2305 3.03 3.16 2.92 2.81 2.78
m2312 2.46 2.32 2.32 2.41 2.22
m2314 3.41 3.19 3.27 3.03 3.14
m2320 3.86 3.72 3.81 4 3.47
m2324 3.7 3.94 3.92 3.65 3.84
m2331 2.68 3.44 3.61 3.3 2.57
m2345 4.27 4.46 4.25 4.42 4.3
m2359 1.75 1.76 2.03 1.86 1.81
m2367 2.86 3.36 3.46 3.36 2.92
m2370 1.67 1.76 1.86 1.57 1.84
m2379 3.65 3.86 3.95 3.76 3.19
m2404 3.03 3.43 3.11 3.14 2.89
m2427 2.47 2.49 3.14 2.43 2.46
m2445 2.68 2.84 2.68 2.57 2.41
m2448 3.64 3.81 4.27 3.58 3.84
m2464 3.89 3.65 3.92 3.81 3.86
m2480 3.97 3.95 3.86 4.03 3.95
m2496 3.73 3.51 4.08 4 3.7
m2510 3.14 3.35 3.41 3.43 3.22
m2533 3.65 3.86 3.65 3.59 3.69
AVERAGE 3.44 3.63 3.69 3.60 3.39
STD DEV 0.95 0.96 0.97 0.99 0.90
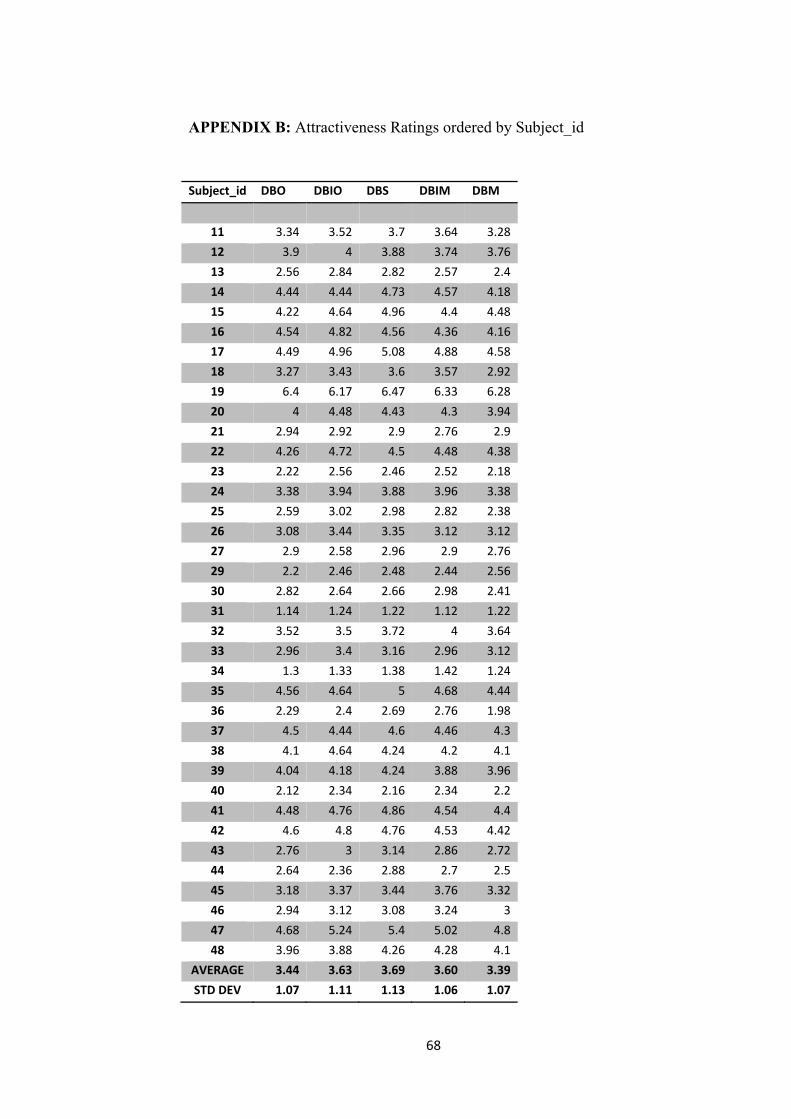
68
APPENDIX B: Attractiveness Ratings ordered by Subject_id
Subject_id DBO DBIO DBS DBIM DBM
11 3.34 3.52 3.7 3.64 3.28
12 3.9 4 3.88 3.74 3.76
13 2.56 2.84 2.82 2.57 2.4
14 4.44 4.44 4.73 4.57 4.18
15 4.22 4.64 4.96 4.4 4.48
16 4.54 4.82 4.56 4.36 4.16
17 4.49 4.96 5.08 4.88 4.58
18 3.27 3.43 3.6 3.57 2.92
19 6.4 6.17 6.47 6.33 6.28
20 4 4.48 4.43 4.3 3.94
21 2.94 2.92 2.9 2.76 2.9
22 4.26 4.72 4.5 4.48 4.38
23 2.22 2.56 2.46 2.52 2.18
24 3.38 3.94 3.88 3.96 3.38
25 2.59 3.02 2.98 2.82 2.38
26 3.08 3.44 3.35 3.12 3.12
27 2.9 2.58 2.96 2.9 2.76
29 2.2 2.46 2.48 2.44 2.56
30 2.82 2.64 2.66 2.98 2.41
31 1.14 1.24 1.22 1.12 1.22
32 3.52 3.5 3.72 4 3.64
33 2.96 3.4 3.16 2.96 3.12
34 1.3 1.33 1.38 1.42 1.24
35 4.56 4.64 5 4.68 4.44
36 2.29 2.4 2.69 2.76 1.98
37 4.5 4.44 4.6 4.46 4.3
38 4.1 4.64 4.24 4.2 4.1
39 4.04 4.18 4.24 3.88 3.96
40 2.12 2.34 2.16 2.34 2.2
41 4.48 4.76 4.86 4.54 4.4
42 4.6 4.8 4.76 4.53 4.42
43 2.76 3 3.14 2.86 2.72
44 2.64 2.36 2.88 2.7 2.5
45 3.18 3.37 3.44 3.76 3.32
46 2.94 3.12 3.08 3.24 3
47 4.68 5.24 5.4 5.02 4.8
48 3.96 3.88 4.26 4.28 4.1
AVERAGE 3.44 3.63 3.69 3.60 3.39
STD DEV 1.07 1.11 1.13 1.06 1.07
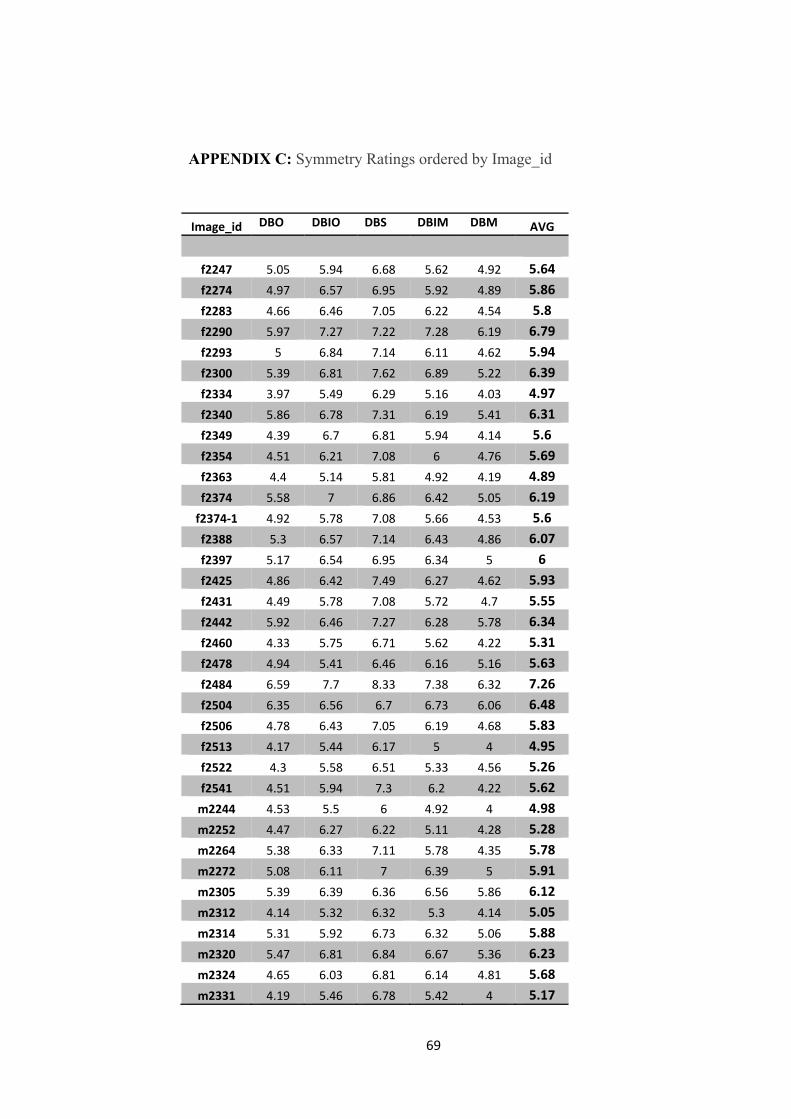
69
APPENDIX C: Symmetry Ratings ordered by Image_id
Image_id DBO DBIO DBS DBIM DBM AVG
f2247 5.05 5.94 6.68 5.62 4.92 5.64
f2274 4.97 6.57 6.95 5.92 4.89 5.86
f2283 4.66 6.46 7.05 6.22 4.54 5.8
f2290 5.97 7.27 7.22 7.28 6.19 6.79
f2293 5 6.84 7.14 6.11 4.62 5.94
f2300 5.39 6.81 7.62 6.89 5.22 6.39
f2334 3.97 5.49 6.29 5.16 4.03 4.97
f2340 5.86 6.78 7.31 6.19 5.41 6.31
f2349 4.39 6.7 6.81 5.94 4.14 5.6
f2354 4.51 6.21 7.08 6 4.76 5.69
f2363 4.4 5.14 5.81 4.92 4.19 4.89
f2374 5.58 7 6.86 6.42 5.05 6.19
f2374‐1 4.92 5.78 7.08 5.66 4.53 5.6
f2388 5.3 6.57 7.14 6.43 4.86 6.07
f2397 5.17 6.54 6.95 6.34 5 6
f2425 4.86 6.42 7.49 6.27 4.62 5.93
f2431 4.49 5.78 7.08 5.72 4.7 5.55
f2442 5.92 6.46 7.27 6.28 5.78 6.34
f2460 4.33 5.75 6.71 5.62 4.22 5.31
f2478 4.94 5.41 6.46 6.16 5.16 5.63
f2484 6.59 7.7 8.33 7.38 6.32 7.26
f2504 6.35 6.56 6.7 6.73 6.06 6.48
f2506 4.78 6.43 7.05 6.19 4.68 5.83
f2513 4.17 5.44 6.17 5 4 4.95
f2522 4.3 5.58 6.51 5.33 4.56 5.26
f2541 4.51 5.94 7.3 6.2 4.22 5.62
m2244 4.53 5.5 6 4.92 4 4.98
m2252 4.47 6.27 6.22 5.11 4.28 5.28
m2264 5.38 6.33 7.11 5.78 4.35 5.78
m2272 5.08 6.11 7 6.39 5 5.91
m2305 5.39 6.39 6.36 6.56 5.86 6.12
m2312 4.14 5.32 6.32 5.3 4.14 5.05
m2314 5.31 5.92 6.73 6.32 5.06 5.88
m2320 5.47 6.81 6.84 6.67 5.36 6.23
m2324 4.65 6.03 6.81 6.14 4.81 5.68
m2331 4.19 5.46 6.78 5.42 4 5.17
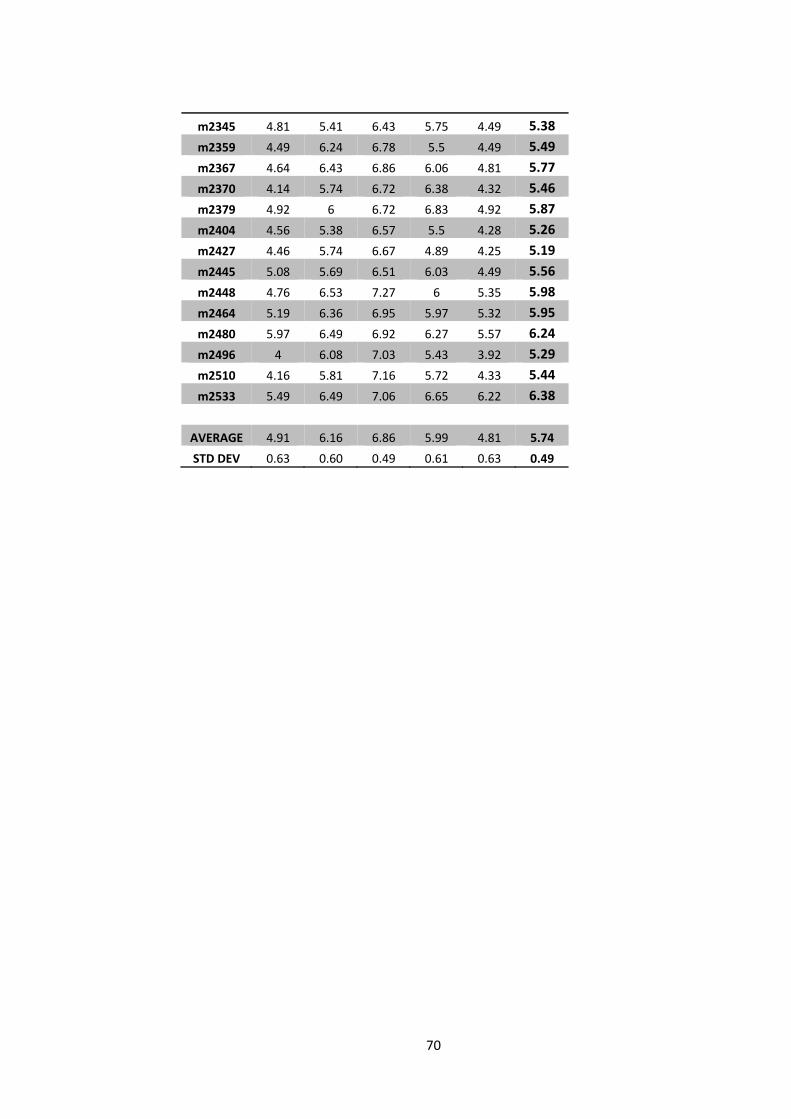
70
m2345 4.81 5.41 6.43 5.75 4.49 5.38
m2359 4.49 6.24 6.78 5.5 4.49 5.49
m2367 4.64 6.43 6.86 6.06 4.81 5.77
m2370 4.14 5.74 6.72 6.38 4.32 5.46
m2379 4.92 6 6.72 6.83 4.92 5.87
m2404 4.56 5.38 6.57 5.5 4.28 5.26
m2427 4.46 5.74 6.67 4.89 4.25 5.19
m2445 5.08 5.69 6.51 6.03 4.49 5.56
m2448 4.76 6.53 7.27 6 5.35 5.98
m2464 5.19 6.36 6.95 5.97 5.32 5.95
m2480 5.97 6.49 6.92 6.27 5.57 6.24
m2496 4 6.08 7.03 5.43 3.92 5.29
m2510 4.16 5.81 7.16 5.72 4.33 5.44
m2533 5.49 6.49 7.06 6.65 6.22 6.38
AVERAGE 4.91 6.16 6.86 5.99 4.81 5.74
STD DEV 0.63 0.60 0.49 0.61 0.63 0.49
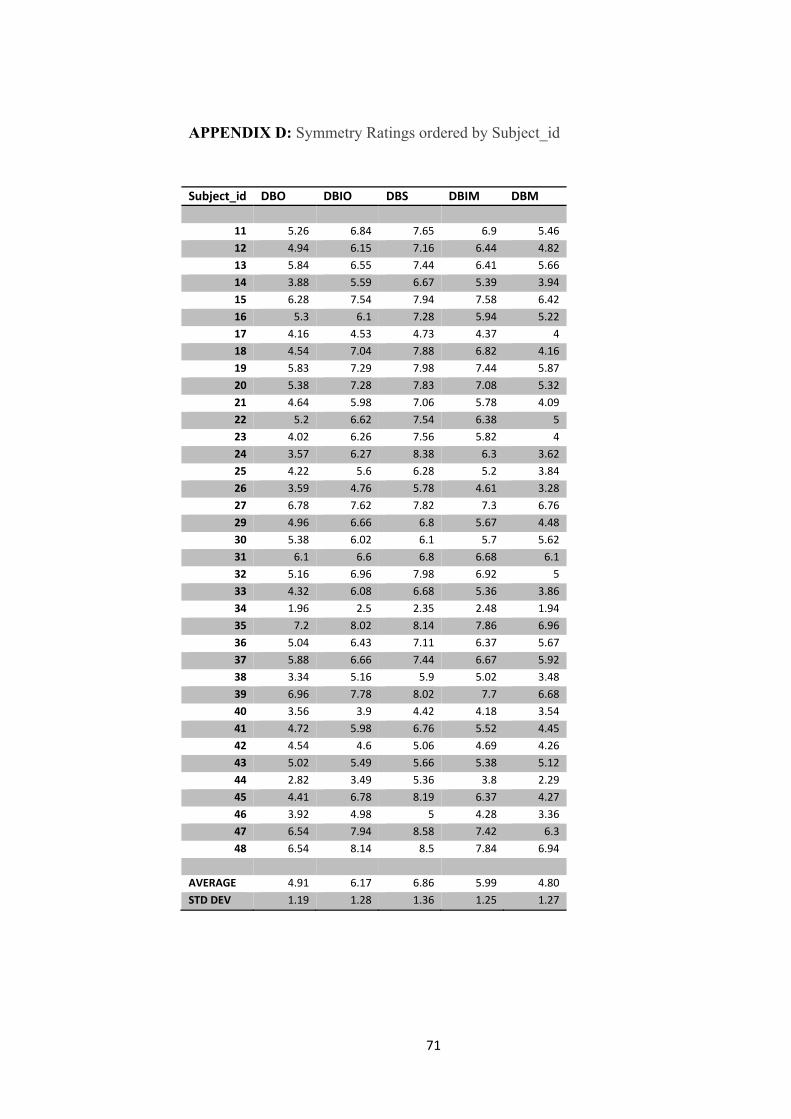
71
APPENDIX D: Symmetry Ratings ordered by Subject_id
Subject_id DBO DBIO DBS DBIM DBM
11 5.26 6.84 7.65 6.9 5.46
12 4.94 6.15 7.16 6.44 4.82
13 5.84 6.55 7.44 6.41 5.66
14 3.88 5.59 6.67 5.39 3.94
15 6.28 7.54 7.94 7.58 6.42
16 5.3 6.1 7.28 5.94 5.22
17 4.16 4.53 4.73 4.37 4
18 4.54 7.04 7.88 6.82 4.16
19 5.83 7.29 7.98 7.44 5.87
20 5.38 7.28 7.83 7.08 5.32
21 4.64 5.98 7.06 5.78 4.09
22 5.2 6.62 7.54 6.38 5
23 4.02 6.26 7.56 5.82 4
24 3.57 6.27 8.38 6.3 3.62
25 4.22 5.6 6.28 5.2 3.84
26 3.59 4.76 5.78 4.61 3.28
27 6.78 7.62 7.82 7.3 6.76
29 4.96 6.66 6.8 5.67 4.48
30 5.38 6.02 6.1 5.7 5.62
31 6.1 6.6 6.8 6.68 6.1
32 5.16 6.96 7.98 6.92 5
33 4.32 6.08 6.68 5.36 3.86
34 1.96 2.5 2.35 2.48 1.94
35 7.2 8.02 8.14 7.86 6.96
36 5.04 6.43 7.11 6.37 5.67
37 5.88 6.66 7.44 6.67 5.92
38 3.34 5.16 5.9 5.02 3.48
39 6.96 7.78 8.02 7.7 6.68
40 3.56 3.9 4.42 4.18 3.54
41 4.72 5.98 6.76 5.52 4.45
42 4.54 4.6 5.06 4.69 4.26
43 5.02 5.49 5.66 5.38 5.12
44 2.82 3.49 5.36 3.8 2.29
45 4.41 6.78 8.19 6.37 4.27
46 3.92 4.98 5 4.28 3.36
47 6.54 7.94 8.58 7.42 6.3
48 6.54 8.14 8.5 7.84 6.94
AVERAGE 4.91 6.17 6.86 5.99 4.80
STD DEV 1.19 1.28 1.36 1.25 1.27
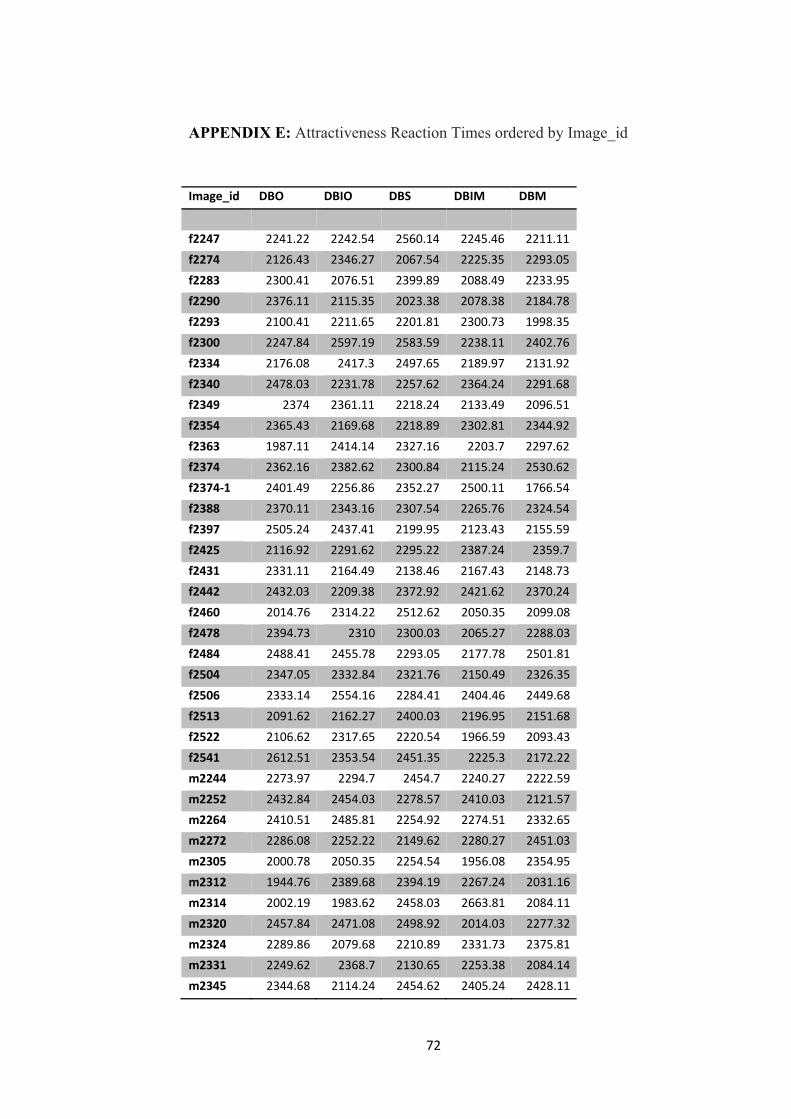
72
APPENDIX E: Attractiveness Reaction Times ordered by Image_id
Image_id DBO DBIO DBS DBIM DBM
f2247 2241.22 2242.54 2560.14 2245.46 2211.11
f2274 2126.43 2346.27 2067.54 2225.35 2293.05
f2283 2300.41 2076.51 2399.89 2088.49 2233.95
f2290 2376.11 2115.35 2023.38 2078.38 2184.78
f2293 2100.41 2211.65 2201.81 2300.73 1998.35
f2300 2247.84 2597.19 2583.59 2238.11 2402.76
f2334 2176.08 2417.3 2497.65 2189.97 2131.92
f2340 2478.03 2231.78 2257.62 2364.24 2291.68
f2349 2374 2361.11 2218.24 2133.49 2096.51
f2354 2365.43 2169.68 2218.89 2302.81 2344.92
f2363 1987.11 2414.14 2327.16 2203.7 2297.62
f2374 2362.16 2382.62 2300.84 2115.24 2530.62
f2374‐1 2401.49 2256.86 2352.27 2500.11 1766.54
f2388 2370.11 2343.16 2307.54 2265.76 2324.54
f2397 2505.24 2437.41 2199.95 2123.43 2155.59
f2425 2116.92 2291.62 2295.22 2387.24 2359.7
f2431 2331.11 2164.49 2138.46 2167.43 2148.73
f2442 2432.03 2209.38 2372.92 2421.62 2370.24
f2460 2014.76 2314.22 2512.62 2050.35 2099.08
f2478 2394.73 2310 2300.03 2065.27 2288.03
f2484 2488.41 2455.78 2293.05 2177.78 2501.81
f2504 2347.05 2332.84 2321.76 2150.49 2326.35
f2506 2333.14 2554.16 2284.41 2404.46 2449.68
f2513 2091.62 2162.27 2400.03 2196.95 2151.68
f2522 2106.62 2317.65 2220.54 1966.59 2093.43
f2541 2612.51 2353.54 2451.35 2225.3 2172.22
m2244 2273.97 2294.7 2454.7 2240.27 2222.59
m2252 2432.84 2454.03 2278.57 2410.03 2121.57
m2264 2410.51 2485.81 2254.92 2274.51 2332.65
m2272 2286.08 2252.22 2149.62 2280.27 2451.03
m2305 2000.78 2050.35 2254.54 1956.08 2354.95
m2312 1944.76 2389.68 2394.19 2267.24 2031.16
m2314 2002.19 1983.62 2458.03 2663.81 2084.11
m2320 2457.84 2471.08 2498.92 2014.03 2277.32
m2324 2289.86 2079.68 2210.89 2331.73 2375.81
m2331 2249.62 2368.7 2130.65 2253.38 2084.14
m2345 2344.68 2114.24 2454.62 2405.24 2428.11
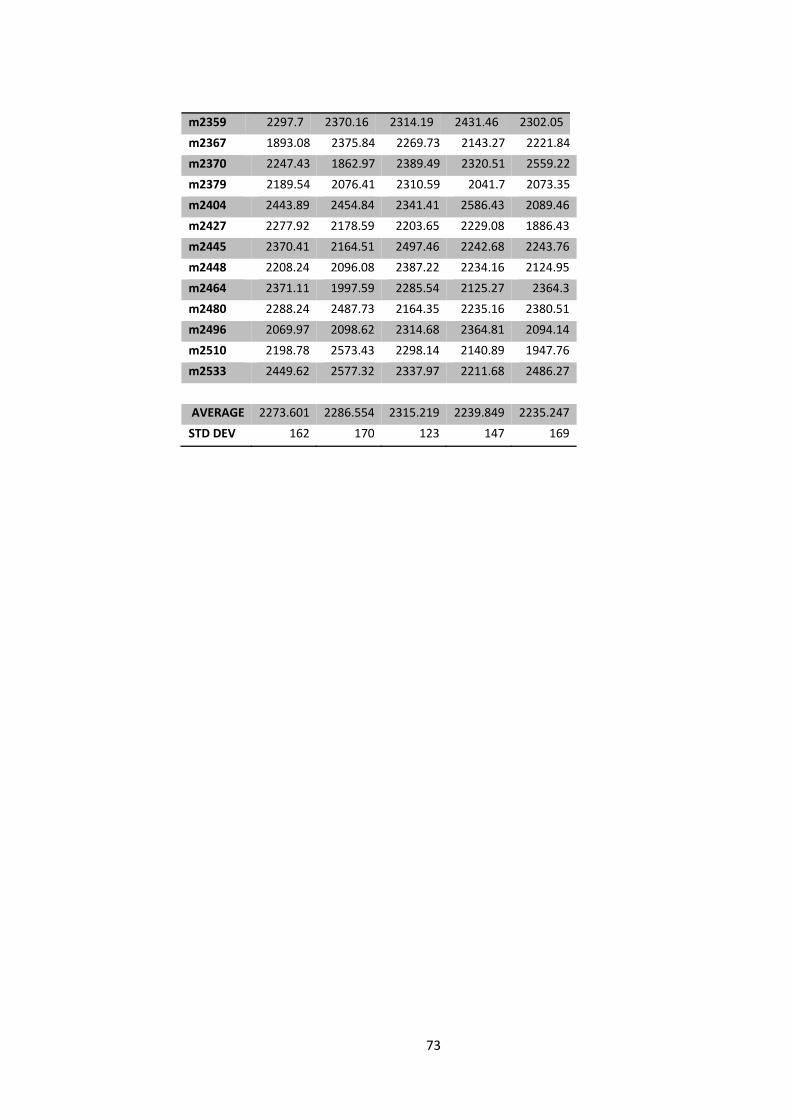
73
m2359 2297.7 2370.16 2314.19 2431.46 2302.05
m2367 1893.08 2375.84 2269.73 2143.27 2221.84
m2370 2247.43 1862.97 2389.49 2320.51 2559.22
m2379 2189.54 2076.41 2310.59 2041.7 2073.35
m2404 2443.89 2454.84 2341.41 2586.43 2089.46
m2427 2277.92 2178.59 2203.65 2229.08 1886.43
m2445 2370.41 2164.51 2497.46 2242.68 2243.76
m2448 2208.24 2096.08 2387.22 2234.16 2124.95
m2464 2371.11 1997.59 2285.54 2125.27 2364.3
m2480 2288.24 2487.73 2164.35 2235.16 2380.51
m2496 2069.97 2098.62 2314.68 2364.81 2094.14
m2510 2198.78 2573.43 2298.14 2140.89 1947.76
m2533 2449.62 2577.32 2337.97 2211.68 2486.27
AVERAGE 2273.601 2286.554 2315.219 2239.849 2235.247
STD DEV 162 170 123 147 169
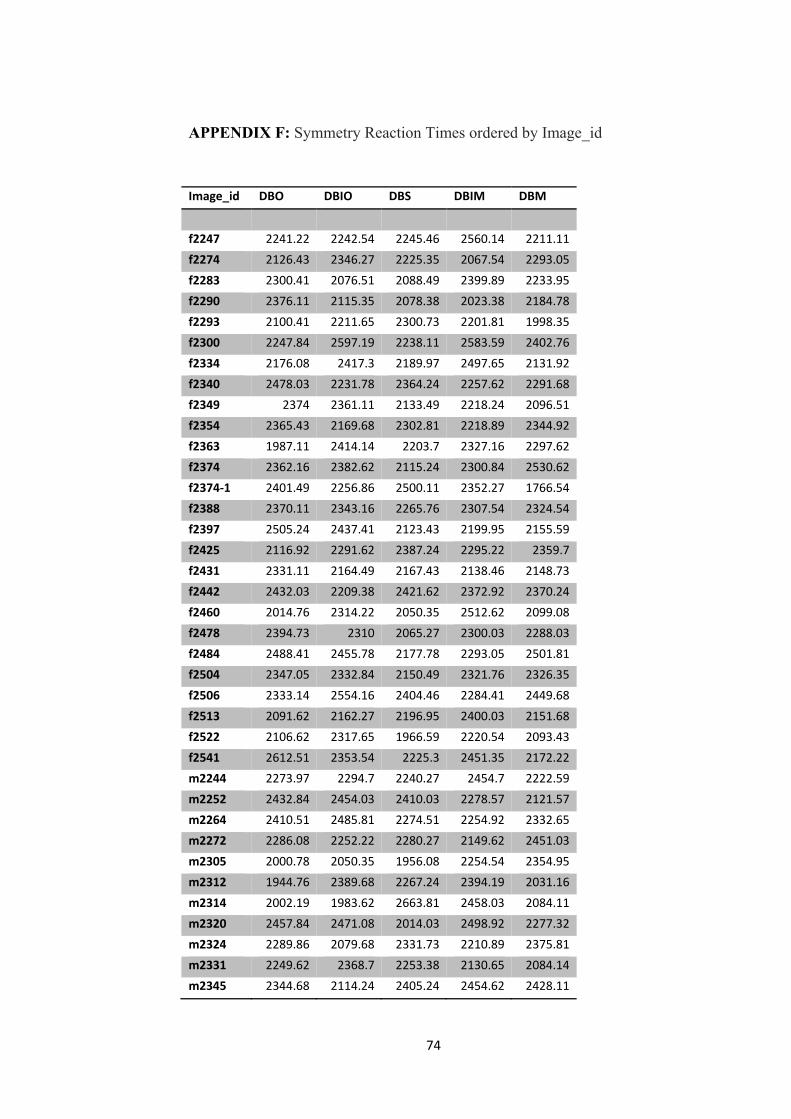
74
APPENDIX F: Symmetry Reaction Times ordered by Image_id
Image_id DBO DBIO DBS DBIM DBM
f2247 2241.22 2242.54 2245.46 2560.14 2211.11
f2274 2126.43 2346.27 2225.35 2067.54 2293.05
f2283 2300.41 2076.51 2088.49 2399.89 2233.95
f2290 2376.11 2115.35 2078.38 2023.38 2184.78
f2293 2100.41 2211.65 2300.73 2201.81 1998.35
f2300 2247.84 2597.19 2238.11 2583.59 2402.76
f2334 2176.08 2417.3 2189.97 2497.65 2131.92
f2340 2478.03 2231.78 2364.24 2257.62 2291.68
f2349 2374 2361.11 2133.49 2218.24 2096.51
f2354 2365.43 2169.68 2302.81 2218.89 2344.92
f2363 1987.11 2414.14 2203.7 2327.16 2297.62
f2374 2362.16 2382.62 2115.24 2300.84 2530.62
f2374‐1 2401.49 2256.86 2500.11 2352.27 1766.54
f2388 2370.11 2343.16 2265.76 2307.54 2324.54
f2397 2505.24 2437.41 2123.43 2199.95 2155.59
f2425 2116.92 2291.62 2387.24 2295.22 2359.7
f2431 2331.11 2164.49 2167.43 2138.46 2148.73
f2442 2432.03 2209.38 2421.62 2372.92 2370.24
f2460 2014.76 2314.22 2050.35 2512.62 2099.08
f2478 2394.73 2310 2065.27 2300.03 2288.03
f2484 2488.41 2455.78 2177.78 2293.05 2501.81
f2504 2347.05 2332.84 2150.49 2321.76 2326.35
f2506 2333.14 2554.16 2404.46 2284.41 2449.68
f2513 2091.62 2162.27 2196.95 2400.03 2151.68
f2522 2106.62 2317.65 1966.59 2220.54 2093.43
f2541 2612.51 2353.54 2225.3 2451.35 2172.22
m2244 2273.97 2294.7 2240.27 2454.7 2222.59
m2252 2432.84 2454.03 2410.03 2278.57 2121.57
m2264 2410.51 2485.81 2274.51 2254.92 2332.65
m2272 2286.08 2252.22 2280.27 2149.62 2451.03
m2305 2000.78 2050.35 1956.08 2254.54 2354.95
m2312 1944.76 2389.68 2267.24 2394.19 2031.16
m2314 2002.19 1983.62 2663.81 2458.03 2084.11
m2320 2457.84 2471.08 2014.03 2498.92 2277.32
m2324 2289.86 2079.68 2331.73 2210.89 2375.81
m2331 2249.62 2368.7 2253.38 2130.65 2084.14
m2345 2344.68 2114.24 2405.24 2454.62 2428.11
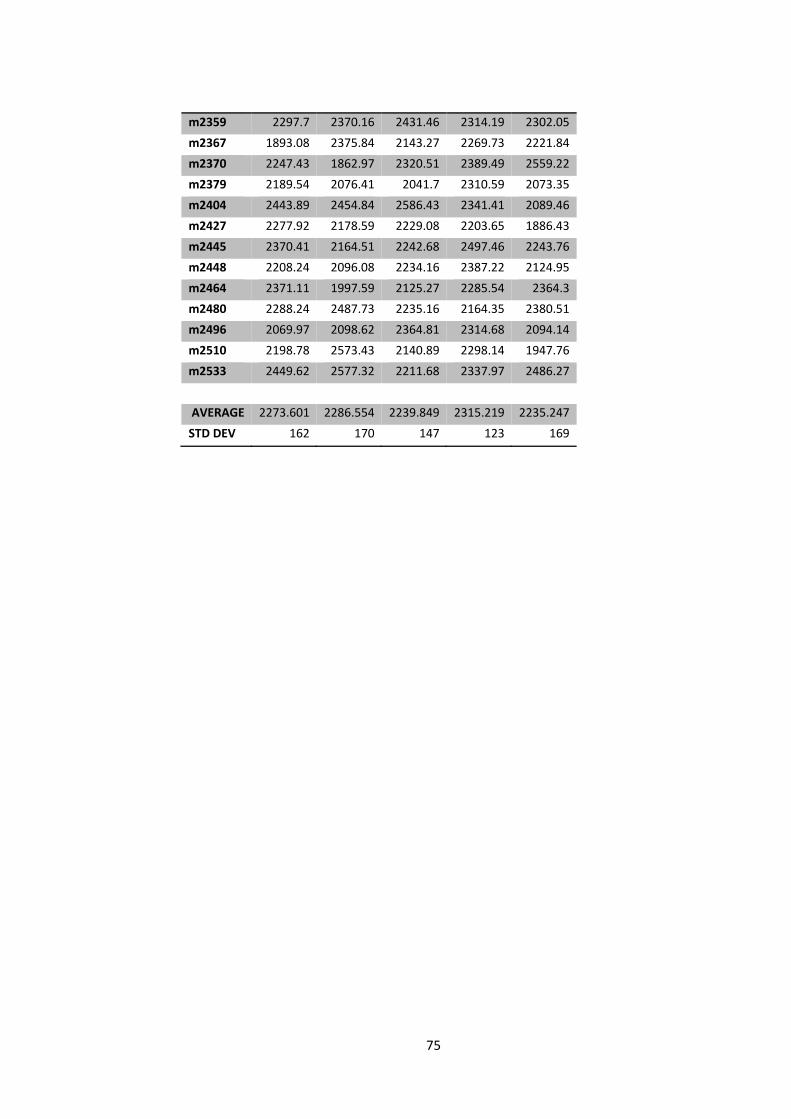
75
m2359 2297.7 2370.16 2431.46 2314.19 2302.05
m2367 1893.08 2375.84 2143.27 2269.73 2221.84
m2370 2247.43 1862.97 2320.51 2389.49 2559.22
m2379 2189.54 2076.41 2041.7 2310.59 2073.35
m2404 2443.89 2454.84 2586.43 2341.41 2089.46
m2427 2277.92 2178.59 2229.08 2203.65 1886.43
m2445 2370.41 2164.51 2242.68 2497.46 2243.76
m2448 2208.24 2096.08 2234.16 2387.22 2124.95
m2464 2371.11 1997.59 2125.27 2285.54 2364.3
m2480 2288.24 2487.73 2235.16 2164.35 2380.51
m2496 2069.97 2098.62 2364.81 2314.68 2094.14
m2510 2198.78 2573.43 2140.89 2298.14 1947.76
m2533 2449.62 2577.32 2211.68 2337.97 2486.27
AVERAGE 2273.601 2286.554 2239.849 2315.219 2235.247
STD DEV 162 170 147 123 169
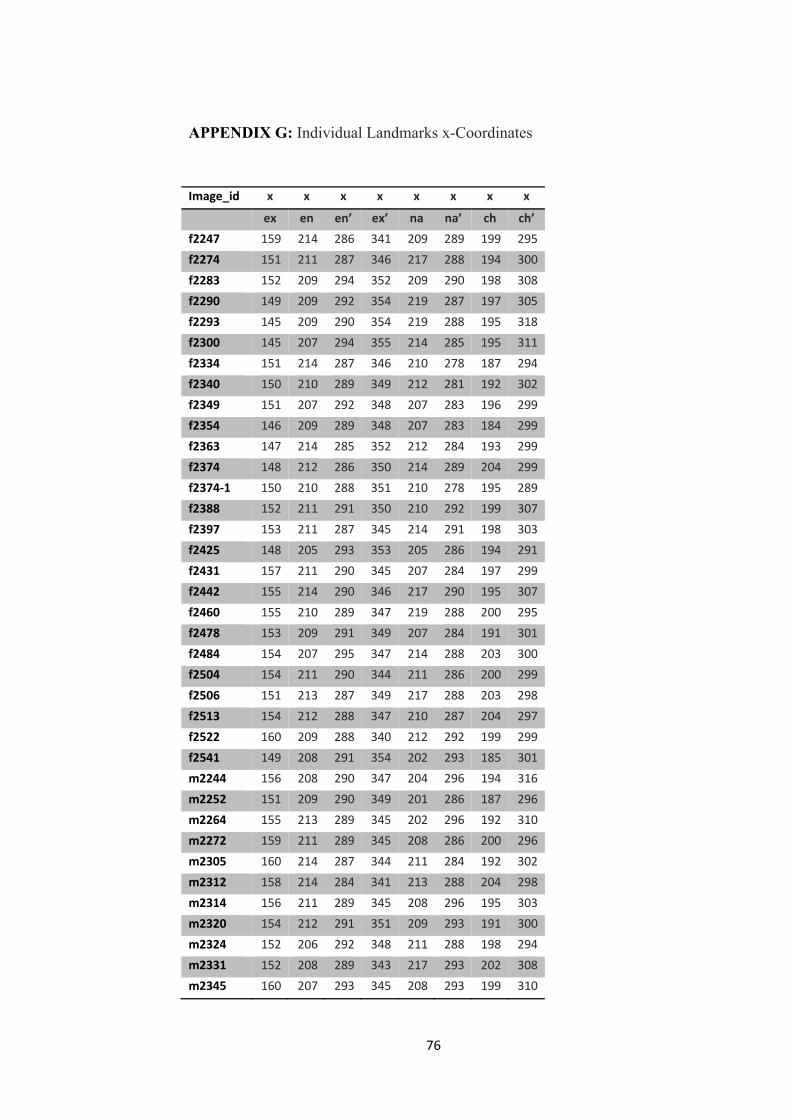
76
APPENDIX G: Individual Landmarks x-Coordinates
Image_id x x x x x x x x
ex en en’ ex’ na na’ ch ch’
f2247 159 214 286 341 209 289 199 295
f2274 151 211 287 346 217 288 194 300
f2283 152 209 294 352 209 290 198 308
f2290 149 209 292 354 219 287 197 305
f2293 145 209 290 354 219 288 195 318
f2300 145 207 294 355 214 285 195 311
f2334 151 214 287 346 210 278 187 294
f2340 150 210 289 349 212 281 192 302
f2349 151 207 292 348 207 283 196 299
f2354 146 209 289 348 207 283 184 299
f2363 147 214 285 352 212 284 193 299
f2374 148 212 286 350 214 289 204 299
f2374‐1 150 210 288 351 210 278 195 289
f2388 152 211 291 350 210 292 199 307
f2397 153 211 287 345 214 291 198 303
f2425 148 205 293 353 205 286 194 291
f2431 157 211 290 345 207 284 197 299
f2442 155 214 290 346 217 290 195 307
f2460 155 210 289 347 219 288 200 295
f2478 153 209 291 349 207 284 191 301
f2484 154 207 295 347 214 288 203 300
f2504 154 211 290 344 211 286 200 299
f2506 151 213 287 349 217 288 203 298
f2513 154 212 288 347 210 287 204 297
f2522 160 209 288 340 212 292 199 299
f2541 149 208 291 354 202 293 185 301
m2244 156 208 290 347 204 296 194 316
m2252 151 209 290 349 201 286 187 296
m2264 155 213 289 345 202 296 192 310
m2272 159 211 289 345 208 286 200 296
m2305 160 214 287 344 211 284 192 302
m2312 158 214 284 341 213 288 204 298
m2314 156 211 289 345 208 296 195 303
m2320 154 212 291 351 209 293 191 300
m2324 152 206 292 348 211 288 198 294
m2331 152 208 289 343 217 293 202 308
m2345 160 207 293 345 208 293 199 310

77
m2359 161 212 288 336 216 284 206 292
m2367 163 213 285 340 214 289 211 302
m2370 156 212 289 340 213 290 204 293
m2379 156 210 289 341 213 293 200 309
m2404 149 208 293 350 207 294 198 311
m2427 160 212 286 339 209 292 201 303
m2445 159 208 290 344 209 300 199 311
m2448 151 206 291 350 215 292 206 303
m2464 161 210 292 343 210 294 200 309
m2480 157 215 287 346 217 293 203 297
m2496 162 211 287 340 204 285 188 298
m2510 159 215 286 343 209 289 192 295
m2533 158 209 289 344 204 296 197 298
AVERAGE 154 210 289 346 211 289 197 301
STD DEV 4.7 2.5 2.5 4.4 4.6 4.7 5.7 6.5

78
APPENDIX H: Individual Landmarks y-Coordinates
Image_id y y y y y y y y
ex en en’ ex’ na na’ ch ch’
f2247 328 319 321 323 247 242 176 175
f2274 326 322 323 326 243 237 179 173
f2283 323 322 321 321 246 249 184 186
f2290 321 321 321 324 234 230 166 168
f2293 323 320 321 326 232 235 179 182
f2300 324 320 320 328 236 241 179 183
f2334 324 322 321 317 241 243 170 168
f2340 320 322 321 320 247 250 174 172
f2349 324 321 320 324 235 239 177 176
f2354 324 321 321 320 243 245 187 180
f2363 327 320 320 324 237 241 178 178
f2374 323 321 321 326 241 244 181 182
f2374‐1 326 322 322 317 239 240 176 172
f2388 319 319 319 322 244 246 176 179
f2397 322 321 320 321 237 240 172 171
f2425 328 319 318 322 244 244 174 170
f2431 325 321 321 322 241 241 181 182
f2442 328 322 320 327 238 239 180 179
f2460 324 320 319 320 238 240 178 178
f2478 327 321 320 324 237 242 175 175
f2484 323 321 322 325 248 250 184 184
f2504 326 320 321 325 241 244 180 176
f2506 318 322 321 321 248 249 183 181
f2513 322 322 322 320 234 239 173 175
f2522 327 323 321 324 239 245 179 177
f2541 327 322 321 327 249 246 187 180
m2244 321 321 321 325 240 248 176 183
m2252 323 323 321 319 244 245 169 170
m2264 322 321 322 320 250 249 177 174
m2272 319 322 322 323 238 243 170 169
m2305 323 321 321 322 251 254 183 185
m2312 322 322 322 320 251 251 182 180
m2314 327 323 322 325 244 244 175 176
m2320 323 322 322 319 248 247 177 181
m2324 324 321 321 322 241 244 174 172
m2331 323 322 323 325 246 249 178 184
m2345 325 321 321 326 239 239 179 181
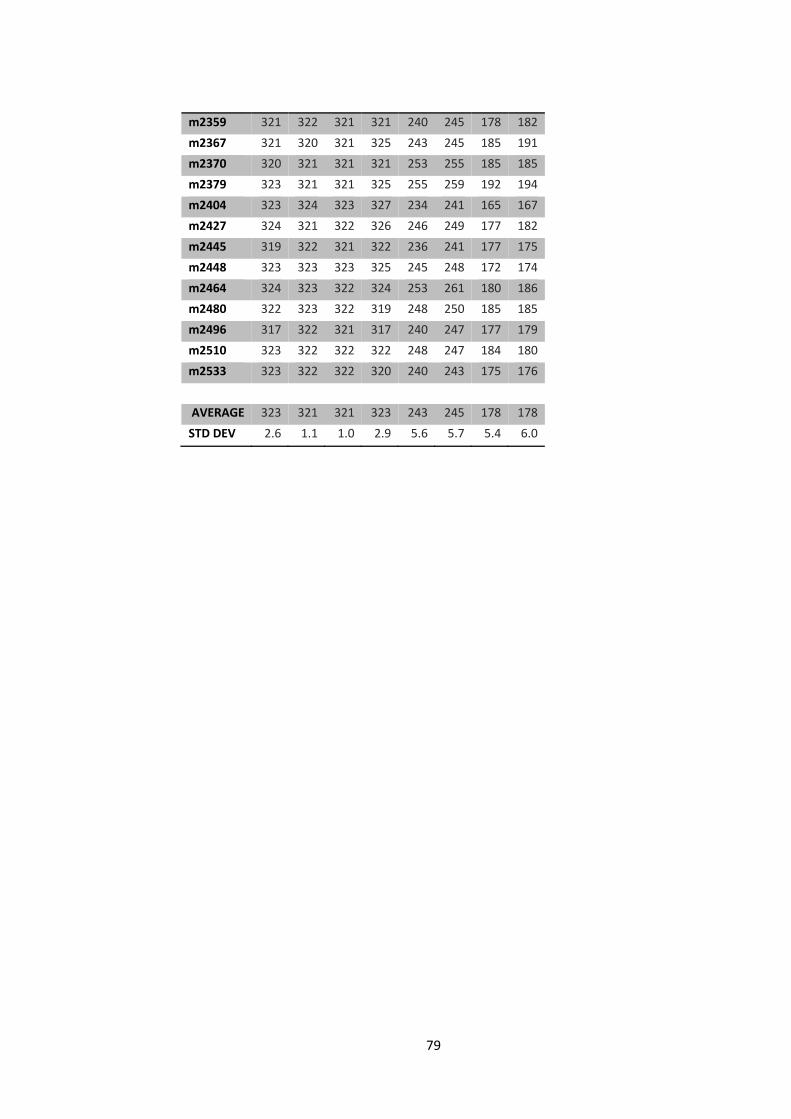
79
m2359 321 322 321 321 240 245 178 182
m2367 321 320 321 325 243 245 185 191
m2370 320 321 321 321 253 255 185 185
m2379 323 321 321 325 255 259 192 194
m2404 323 324 323 327 234 241 165 167
m2427 324 321 322 326 246 249 177 182
m2445 319 322 321 322 236 241 177 175
m2448 323 323 323 325 245 248 172 174
m2464 324 323 322 324 253 261 180 186
m2480 322 323 322 319 248 250 185 185
m2496 317 322 321 317 240 247 177 179
m2510 323 322 322 322 248 247 184 180
m2533 323 322 322 320 240 243 175 176
AVERAGE 323 321 321 323 243 245 178 178
STD DEV 2.6 1.1 1.0 2.9 5.6 5.7 5.4 6.0
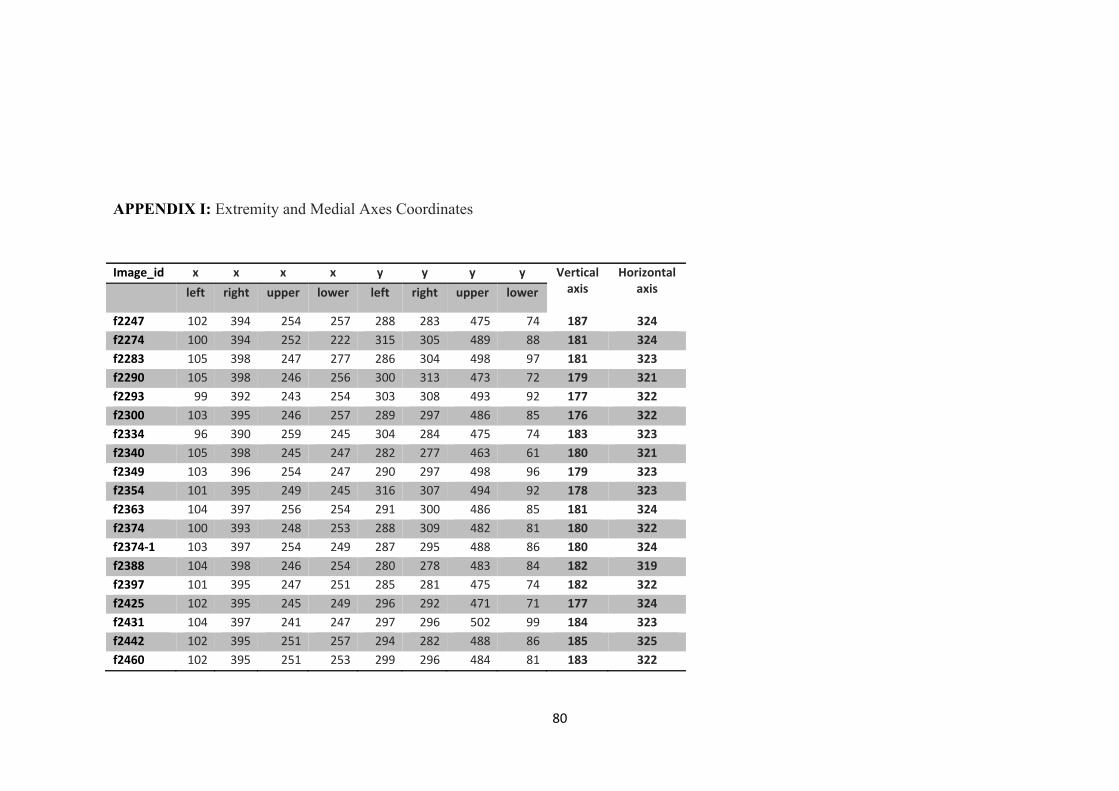
80
APPENDIX I: Extremity and Medial Axes Coordinates
Image_id x x x x y y y y Vertical
axis
Horizontal axis
left right upper lower left right upper lower
f2247 102 394 254 257 288 283 475 74 187 324f2274 100 394 252 222 315 305 489 88 181 324f2283 105 398 247 277 286 304 498 97 181 323f2290 105 398 246 256 300 313 473 72 179 321f2293 99 392 243 254 303 308 493 92 177 322f2300 103 395 246 257 289 297 486 85 176 322f2334 96 390 259 245 304 284 475 74 183 323f2340 105 398 245 247 282 277 463 61 180 321f2349 103 396 254 247 290 297 498 96 179 323f2354 101 395 249 245 316 307 494 92 178 323f2363 104 397 256 254 291 300 486 85 181 324f2374 100 393 248 253 288 309 482 81 180 322f2374‐1 103 397 254 249 287 295 488 86 180 324f2388 104 398 246 254 280 278 483 84 182 319f2397 101 395 247 251 285 281 475 74 182 322f2425 102 395 245 249 296 292 471 71 177 324f2431 104 397 241 247 297 296 502 99 184 323f2442 102 395 251 257 294 282 488 86 185 325f2460 102 395 251 253 299 296 484 81 183 322
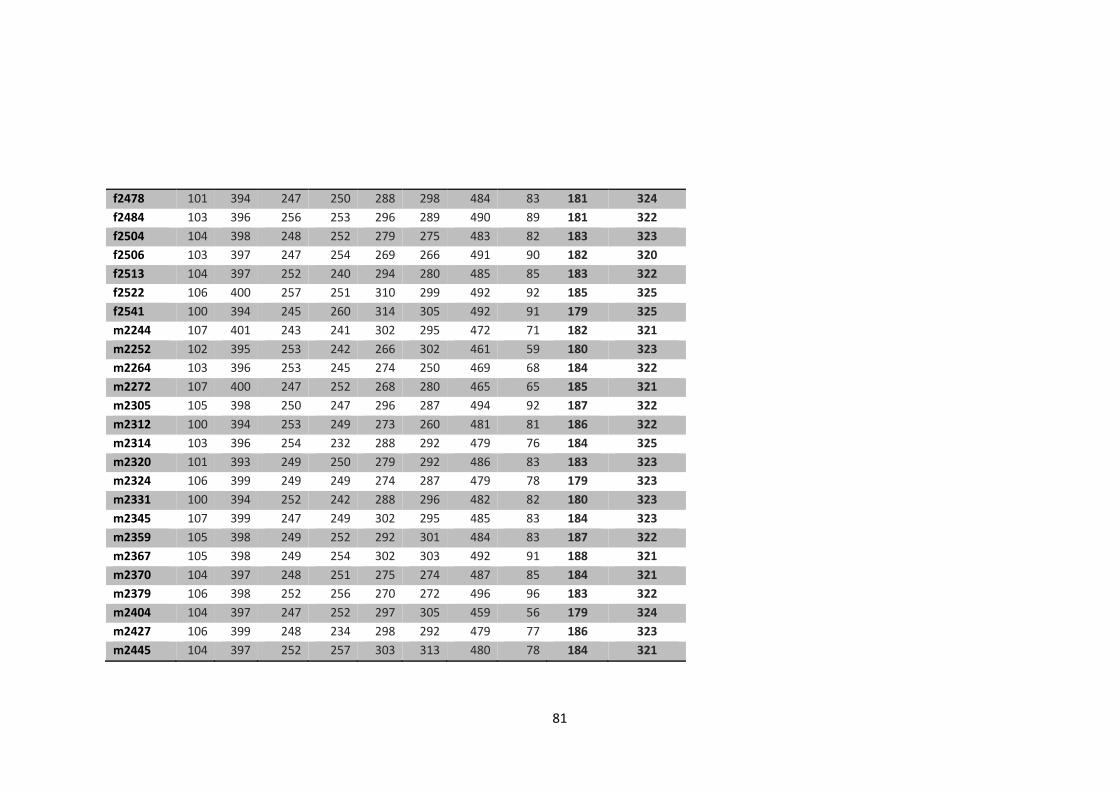
81
f2478 101 394 247 250 288 298 484 83 181 324f2484 103 396 256 253 296 289 490 89 181 322f2504 104 398 248 252 279 275 483 82 183 323f2506 103 397 247 254 269 266 491 90 182 320f2513 104 397 252 240 294 280 485 85 183 322f2522 106 400 257 251 310 299 492 92 185 325f2541 100 394 245 260 314 305 492 91 179 325m2244 107 401 243 241 302 295 472 71 182 321m2252 102 395 253 242 266 302 461 59 180 323m2264 103 396 253 245 274 250 469 68 184 322m2272 107 400 247 252 268 280 465 65 185 321m2305 105 398 250 247 296 287 494 92 187 322m2312 100 394 253 249 273 260 481 81 186 322m2314 103 396 254 232 288 292 479 76 184 325m2320 101 393 249 250 279 292 486 83 183 323m2324 106 399 249 249 274 287 479 78 179 323m2331 100 394 252 242 288 296 482 82 180 323m2345 107 399 247 249 302 295 485 83 184 323m2359 105 398 249 252 292 301 484 83 187 322m2367 105 398 249 254 302 303 492 91 188 321m2370 104 397 248 251 275 274 487 85 184 321m2379 106 398 252 256 270 272 496 96 183 322m2404 104 397 247 252 297 305 459 56 179 324m2427 106 399 248 234 298 292 479 77 186 323m2445 104 397 252 257 303 313 480 78 184 321
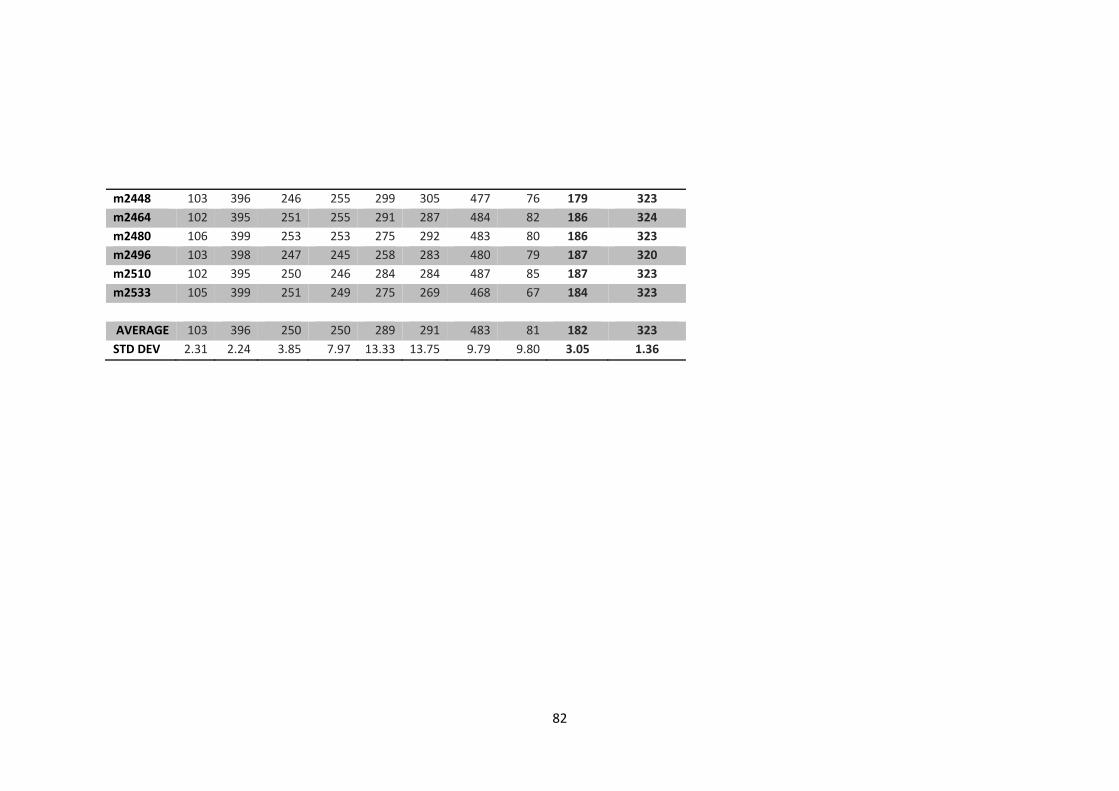
82
m2448 103 396 246 255 299 305 477 76 179 323m2464 102 395 251 255 291 287 484 82 186 324m2480 106 399 253 253 275 292 483 80 186 323m2496 103 398 247 245 258 283 480 79 187 320m2510 102 395 250 246 284 284 487 85 187 323m2533 105 399 251 249 275 269 468 67 184 323 AVERAGE 103 396 250 250 289 291 483 81 182 323STD DEV 2.31 2.24 3.85 7.97 13.33 13.75 9.79 9.80 3.05 1.36
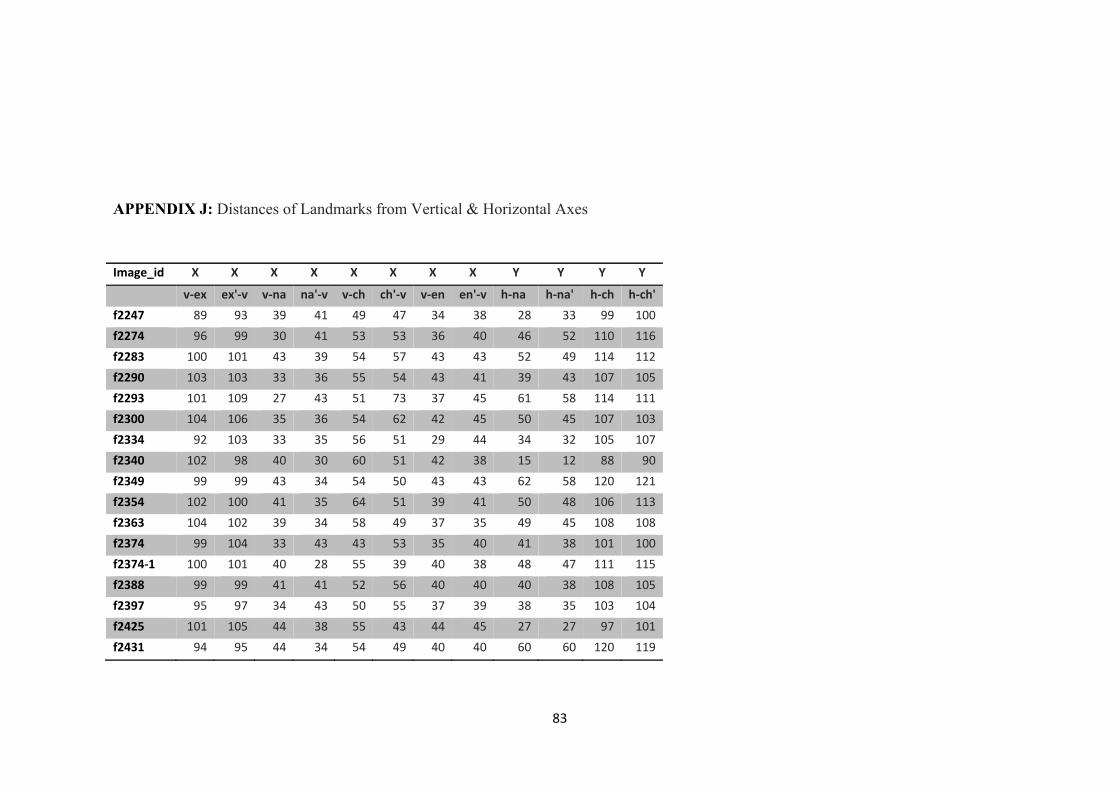
83
APPENDIX J: Distances of Landmarks from Vertical & Horizontal Axes
Image_id X X X X X X X X Y Y Y Y
v‐ex ex'‐v v‐na na'‐v v‐ch ch'‐v v‐en en'‐v h‐na h‐na' h‐ch h‐ch'
f2247 89 93 39 41 49 47 34 38 28 33 99 100
f2274 96 99 30 41 53 53 36 40 46 52 110 116
f2283 100 101 43 39 54 57 43 43 52 49 114 112
f2290 103 103 33 36 55 54 43 41 39 43 107 105
f2293 101 109 27 43 51 73 37 45 61 58 114 111
f2300 104 106 35 36 54 62 42 45 50 45 107 103
f2334 92 103 33 35 56 51 29 44 34 32 105 107
f2340 102 98 40 30 60 51 42 38 15 12 88 90
f2349 99 99 43 34 54 50 43 43 62 58 120 121
f2354 102 100 41 35 64 51 39 41 50 48 106 113
f2363 104 102 39 34 58 49 37 35 49 45 108 108
f2374 99 104 33 43 43 53 35 40 41 38 101 100
f2374‐1 100 101 40 28 55 39 40 38 48 47 111 115
f2388 99 99 41 41 52 56 40 40 40 38 108 105
f2397 95 97 34 43 50 55 37 39 38 35 103 104
f2425 101 105 44 38 55 43 44 45 27 27 97 101
f2431 94 95 44 34 54 49 40 40 60 60 120 119
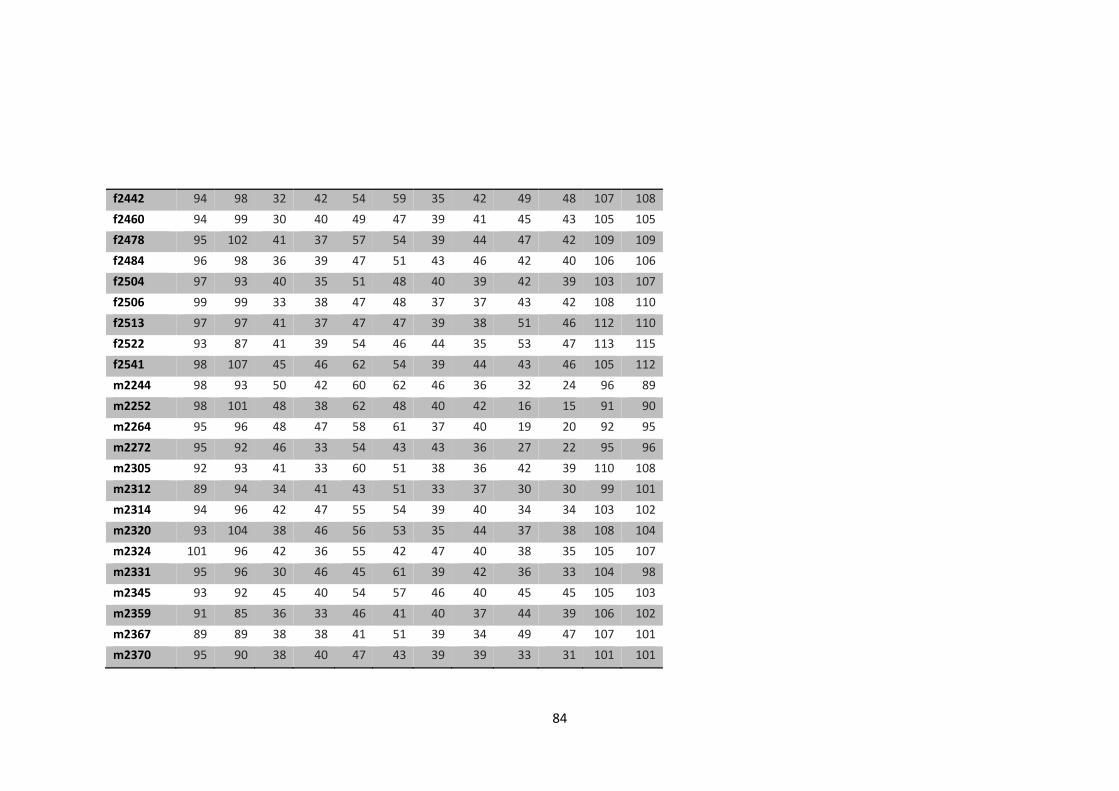
84
f2442 94 98 32 42 54 59 35 42 49 48 107 108
f2460 94 99 30 40 49 47 39 41 45 43 105 105
f2478 95 102 41 37 57 54 39 44 47 42 109 109
f2484 96 98 36 39 47 51 43 46 42 40 106 106
f2504 97 93 40 35 51 48 40 39 42 39 103 107
f2506 99 99 33 38 47 48 37 37 43 42 108 110
f2513 97 97 41 37 47 47 39 38 51 46 112 110
f2522 93 87 41 39 54 46 44 35 53 47 113 115
f2541 98 107 45 46 62 54 39 44 43 46 105 112
m2244 98 93 50 42 60 62 46 36 32 24 96 89
m2252 98 101 48 38 62 48 40 42 16 15 91 90
m2264 95 96 48 47 58 61 37 40 19 20 92 95
m2272 95 92 46 33 54 43 43 36 27 22 95 96
m2305 92 93 41 33 60 51 38 36 42 39 110 108
m2312 89 94 34 41 43 51 33 37 30 30 99 101
m2314 94 96 42 47 55 54 39 40 34 34 103 102
m2320 93 104 38 46 56 53 35 44 37 38 108 104
m2324 101 96 42 36 55 42 47 40 38 35 105 107
m2331 95 96 30 46 45 61 39 42 36 33 104 98
m2345 93 92 45 40 54 57 46 40 45 45 105 103
m2359 91 85 36 33 46 41 40 37 44 39 106 102
m2367 89 89 38 38 41 51 39 34 49 47 107 101
m2370 95 90 38 40 47 43 39 39 33 31 101 101
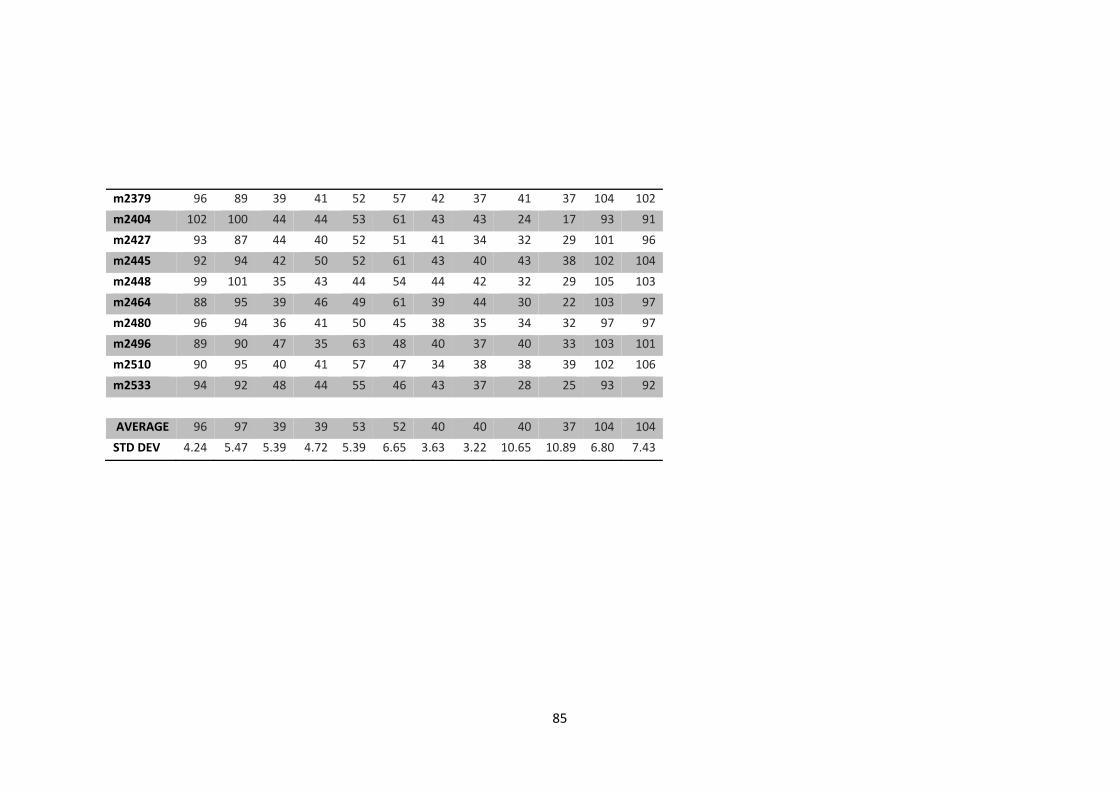
85
m2379 96 89 39 41 52 57 42 37 41 37 104 102
m2404 102 100 44 44 53 61 43 43 24 17 93 91
m2427 93 87 44 40 52 51 41 34 32 29 101 96
m2445 92 94 42 50 52 61 43 40 43 38 102 104
m2448 99 101 35 43 44 54 44 42 32 29 105 103
m2464 88 95 39 46 49 61 39 44 30 22 103 97
m2480 96 94 36 41 50 45 38 35 34 32 97 97
m2496 89 90 47 35 63 48 40 37 40 33 103 101
m2510 90 95 40 41 57 47 34 38 38 39 102 106
m2533 94 92 48 44 55 46 43 37 28 25 93 92
AVERAGE 96 97 39 39 53 52 40 40 40 37 104 104
STD DEV 4.24 5.47 5.39 4.72 5.39 6.65 3.63 3.22 10.65 10.89 6.80 7.43
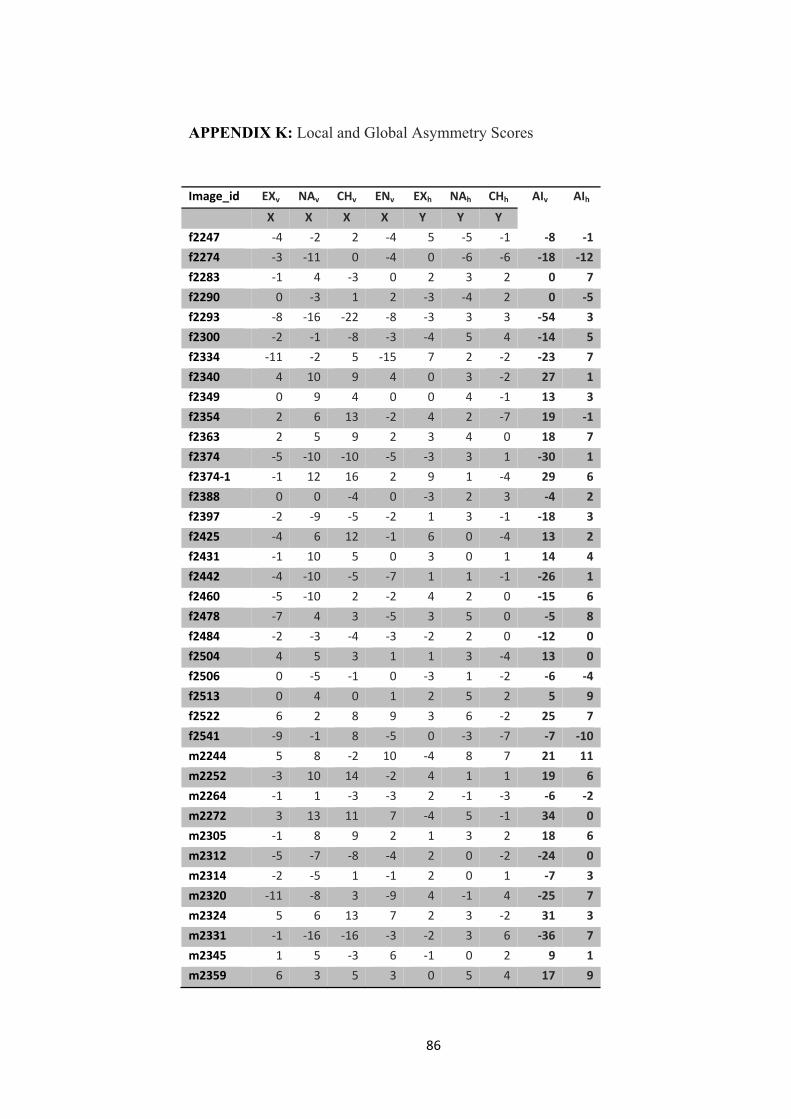
86
APPENDIX K: Local and Global Asymmetry Scores
Image_id EXv NAv CHv ENv EXh NAh CHh AIv
AIh X X X X Y Y Y
f2247 ‐4 ‐2 2 ‐4 5 ‐5 ‐1 ‐8 ‐1
f2274 ‐3 ‐11 0 ‐4 0 ‐6 ‐6 ‐18 ‐12
f2283 ‐1 4 ‐3 0 2 3 2 0 7
f2290 0 ‐3 1 2 ‐3 ‐4 2 0 ‐5
f2293 ‐8 ‐16 ‐22 ‐8 ‐3 3 3 ‐54 3
f2300 ‐2 ‐1 ‐8 ‐3 ‐4 5 4 ‐14 5
f2334 ‐11 ‐2 5 ‐15 7 2 ‐2 ‐23 7
f2340 4 10 9 4 0 3 ‐2 27 1
f2349 0 9 4 0 0 4 ‐1 13 3
f2354 2 6 13 ‐2 4 2 ‐7 19 ‐1
f2363 2 5 9 2 3 4 0 18 7
f2374 ‐5 ‐10 ‐10 ‐5 ‐3 3 1 ‐30 1
f2374‐1 ‐1 12 16 2 9 1 ‐4 29 6
f2388 0 0 ‐4 0 ‐3 2 3 ‐4 2
f2397 ‐2 ‐9 ‐5 ‐2 1 3 ‐1 ‐18 3
f2425 ‐4 6 12 ‐1 6 0 ‐4 13 2
f2431 ‐1 10 5 0 3 0 1 14 4
f2442 ‐4 ‐10 ‐5 ‐7 1 1 ‐1 ‐26 1
f2460 ‐5 ‐10 2 ‐2 4 2 0 ‐15 6
f2478 ‐7 4 3 ‐5 3 5 0 ‐5 8
f2484 ‐2 ‐3 ‐4 ‐3 ‐2 2 0 ‐12 0
f2504 4 5 3 1 1 3 ‐4 13 0
f2506 0 ‐5 ‐1 0 ‐3 1 ‐2 ‐6 ‐4
f2513 0 4 0 1 2 5 2 5 9
f2522 6 2 8 9 3 6 ‐2 25 7
f2541 ‐9 ‐1 8 ‐5 0 ‐3 ‐7 ‐7 ‐10
m2244 5 8 ‐2 10 ‐4 8 7 21 11
m2252 ‐3 10 14 ‐2 4 1 1 19 6
m2264 ‐1 1 ‐3 ‐3 2 ‐1 ‐3 ‐6 ‐2
m2272 3 13 11 7 ‐4 5 ‐1 34 0
m2305 ‐1 8 9 2 1 3 2 18 6
m2312 ‐5 ‐7 ‐8 ‐4 2 0 ‐2 ‐24 0
m2314 ‐2 ‐5 1 ‐1 2 0 1 ‐7 3
m2320 ‐11 ‐8 3 ‐9 4 ‐1 4 ‐25 7
m2324 5 6 13 7 2 3 ‐2 31 3
m2331 ‐1 ‐16 ‐16 ‐3 ‐2 3 6 ‐36 7
m2345 1 5 ‐3 6 ‐1 0 2 9 1
m2359 6 3 5 3 0 5 4 17 9
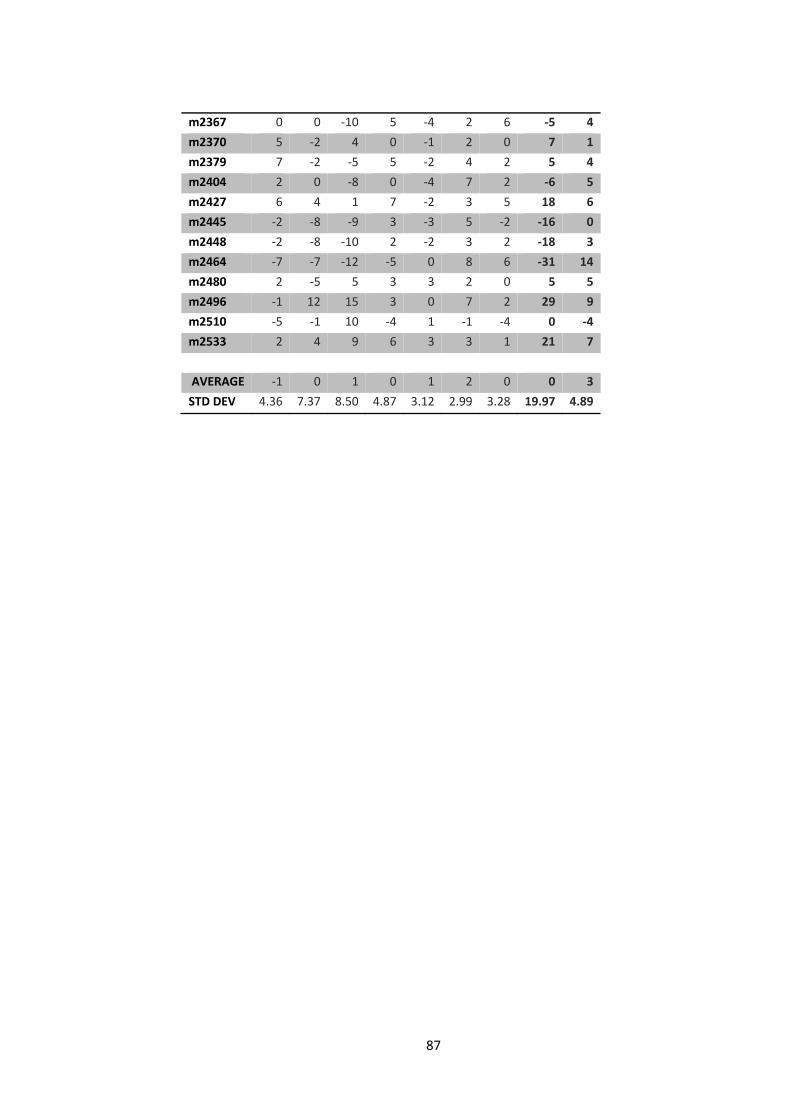
87
m2367 0 0 ‐10 5 ‐4 2 6 ‐5 4
m2370 5 ‐2 4 0 ‐1 2 0 7 1
m2379 7 ‐2 ‐5 5 ‐2 4 2 5 4
m2404 2 0 ‐8 0 ‐4 7 2 ‐6 5
m2427 6 4 1 7 ‐2 3 5 18 6
m2445 ‐2 ‐8 ‐9 3 ‐3 5 ‐2 ‐16 0
m2448 ‐2 ‐8 ‐10 2 ‐2 3 2 ‐18 3
m2464 ‐7 ‐7 ‐12 ‐5 0 8 6 ‐31 14
m2480 2 ‐5 5 3 3 2 0 5 5
m2496 ‐1 12 15 3 0 7 2 29 9
m2510 ‐5 ‐1 10 ‐4 1 ‐1 ‐4 0 ‐4
m2533 2 4 9 6 3 3 1 21 7
AVERAGE ‐1 0 1 0 1 2 0 0 3
STD DEV 4.36 7.37 8.50 4.87 3.12 2.99 3.28 19.97 4.89
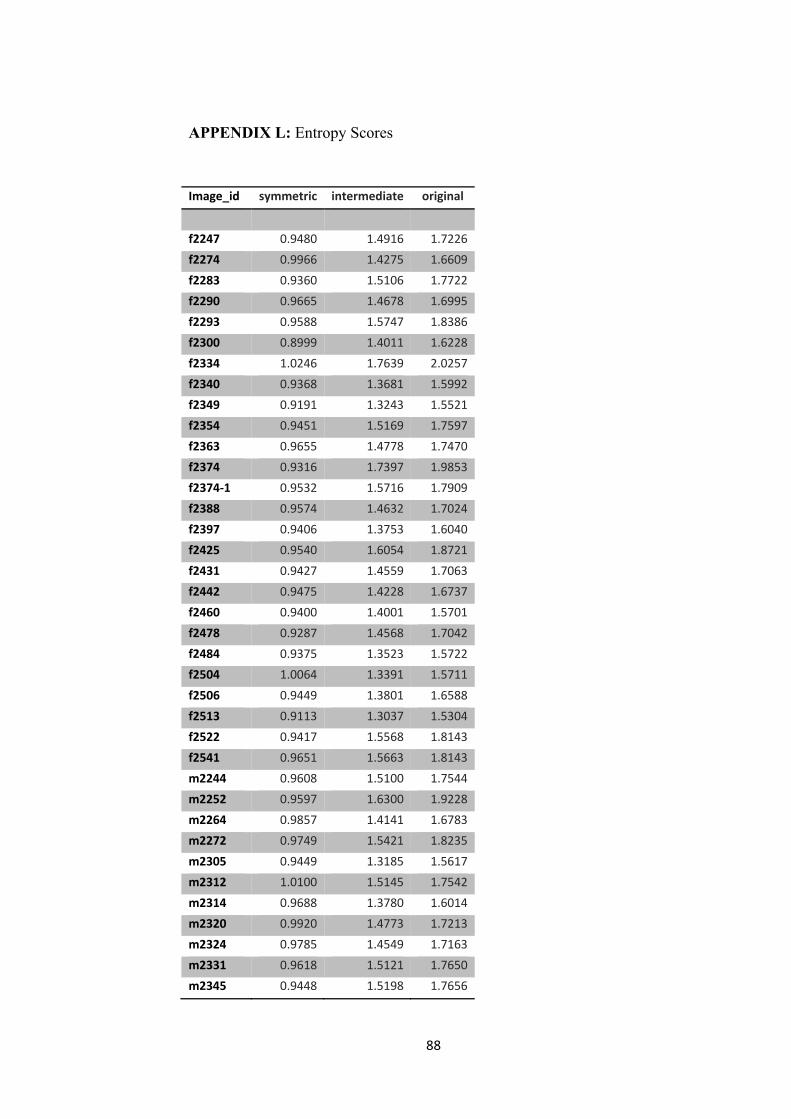
88
APPENDIX L: Entropy Scores
Image_id symmetric intermediate original
f2247 0.9480 1.4916 1.7226
f2274 0.9966 1.4275 1.6609
f2283 0.9360 1.5106 1.7722
f2290 0.9665 1.4678 1.6995
f2293 0.9588 1.5747 1.8386
f2300 0.8999 1.4011 1.6228
f2334 1.0246 1.7639 2.0257
f2340 0.9368 1.3681 1.5992
f2349 0.9191 1.3243 1.5521
f2354 0.9451 1.5169 1.7597
f2363 0.9655 1.4778 1.7470
f2374 0.9316 1.7397 1.9853
f2374‐1 0.9532 1.5716 1.7909
f2388 0.9574 1.4632 1.7024
f2397 0.9406 1.3753 1.6040
f2425 0.9540 1.6054 1.8721
f2431 0.9427 1.4559 1.7063
f2442 0.9475 1.4228 1.6737
f2460 0.9400 1.4001 1.5701
f2478 0.9287 1.4568 1.7042
f2484 0.9375 1.3523 1.5722
f2504 1.0064 1.3391 1.5711
f2506 0.9449 1.3801 1.6588
f2513 0.9113 1.3037 1.5304
f2522 0.9417 1.5568 1.8143
f2541 0.9651 1.5663 1.8143
m2244 0.9608 1.5100 1.7544
m2252 0.9597 1.6300 1.9228
m2264 0.9857 1.4141 1.6783
m2272 0.9749 1.5421 1.8235
m2305 0.9449 1.3185 1.5617
m2312 1.0100 1.5145 1.7542
m2314 0.9688 1.3780 1.6014
m2320 0.9920 1.4773 1.7213
m2324 0.9785 1.4549 1.7163
m2331 0.9618 1.5121 1.7650
m2345 0.9448 1.5198 1.7656
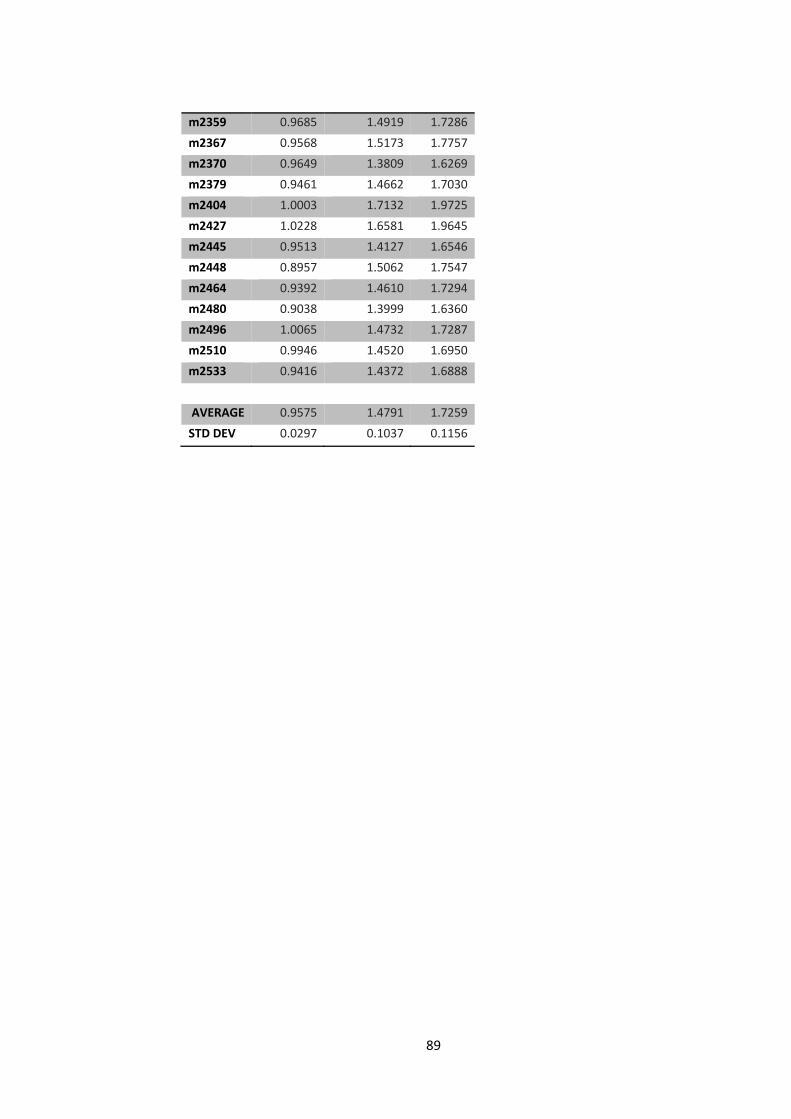
89
m2359 0.9685 1.4919 1.7286
m2367 0.9568 1.5173 1.7757
m2370 0.9649 1.3809 1.6269
m2379 0.9461 1.4662 1.7030
m2404 1.0003 1.7132 1.9725
m2427 1.0228 1.6581 1.9645
m2445 0.9513 1.4127 1.6546
m2448 0.8957 1.5062 1.7547
m2464 0.9392 1.4610 1.7294
m2480 0.9038 1.3999 1.6360
m2496 1.0065 1.4732 1.7287
m2510 0.9946 1.4520 1.6950
m2533 0.9416 1.4372 1.6888
AVERAGE 0.9575 1.4791 1.7259
STD DEV 0.0297 0.1037 0.1156

90
APPENDIX M: Edinburgh Handedness Inventory
Left Right
Writing
Drawing
Throwing
Scissors
Toothbrush
Knife (without a fork)
Spoon
Broom (upper hand)
Striking match
Opening box (lid)
Which foot do you prefer to kick with?
Which eye do you use when using only one eye?
91
APPENDIX N: Gönüllü Katılım Formu
Öncelikle katıldığınız için teşekkürler. Dr. Didem Gökçay danışmanlığında Dicle Dövencioğlu tarafından yapılan bu çalışma yüz algısıyla ilgilidir. Çalışmada insanların çeşitli yüz resimlerine nasıl tepki verdiklerini ölçüyoruz. Ekranda siyah‐beyaz ve rötuşlanmış yüz resimleri göreceksiniz. Fotoğraflar Enformatik Enstitüsü’de oluşturulmuş ODTÜ Yüz Veritabanı’ndan alınmıştır. Sizden istediğimiz, bir resme bakarken sizde ilk uyandırdığı etkiyi derecelendirmeniz. Çalışmaya katılım tamimiyle gönüllülük temelindedir. Ankette, sizden kimlik belirleyici hiçbir bilgi istenmemektedir. Cevaplarınız tamimiyle gizli tutulacak ve sadece araştırmacılar tarafından değerlendirilecektir; elde edilecek bilgiler bilimsel yayımlarda kullanılacaktır.
Çalışmamız iki kısımdan oluşmaktadır. Her ikisinde de beş saniye boyunca ekranda bir yüz resmi görünecektir. Bu süre içinde klavyeden 1’den 9’a kadar bir tuşa basarak cevap vermeniz bekleniyor. Deney yapısında bir önceki resme geri dönmek mümkün değil, bu yüzden eğer beş saniye içinde cevap vermediyseniz o resim değerlendirilmeyecek ve bir sonraki resme geçilecek. Çalışmanın ilk kısmında derecelendirmeyi şu soruya göre yapmanız isteniyor: “Gördüğünüz resim ne kadar çekici?” Eğer çok çekici olduğunu düşünüyorsanız 9’a; hiç çekici olmadığını düşünüyorsanız 1’e basın. Bu iki ölçütün arasında bir değer vermek için aradaki sayıları kullanabilirsiniz. Değerlendirmenizi en iyi şekilde yapabilmeniz için 1 ve 9 arasındaki değerleri kullanmanız önemlidir. Çalışmanin ikinci kısmında yine 5 saniye süreyle yüz resimlerine bakarken bu resimleri değerlendirmeniz isteniyor. Birinci kısmı bitirdiğinizde, ikinciye geçmeden önce bu kısımda size puanları neye göre vermeniz gerektiği söylenecek.
Lütfen her resmi çok fazla düşünmeden değerlendirin; resmi ilk gördüğünüzdeki tepkinize göre bir cevap vermeye çalışın.
Katılım sırasında sorulardan ya da herhangi başka bir nedenden ötürü kendinizi rahatsız hissederseniz cevaplama işini yarıda bırakıp çıkmakta serbestsiniz. Böyle bir durumda anketi uygulayan kişiye, anketi tamamlamadığınızı söylemek yeterli olacaktır.Çalışma ile ilgili daha fazla bilgi almak için Bilişsel Bilimler yüksek lisans öğrencisi Dicle Dövencioğlu’yla iletişim kurabilirsiniz (MM binası 4. Kat oda: MM‐410, e‐mail: [email protected] tlf: 532 4053400).
Bu çalışmaya tamamen gönüllü olarak katılıyorum ve istediğim zaman yarıda kesip çıkabileceğimi biliyorum. Verdiğim bilgilerin bilimsel amaçlı yayımlarda kullanılmasını kabul ediyorum. (Formu doldurup imzaladıktan sonra uygulayıcıya geri veriniz).
İsim Soyad Tarih İmza
‐‐‐‐/‐‐‐‐/‐‐‐‐‐