Embed Size (px)
Citation preview
Fluorescence of riboflavin in energy drinks
How much riboflavin (vitamin B2) is present in energy drinks? You will use fluorescence
spectroscopy to determine the concentration of a riboflavin both Rockstar (a common energy
drink) and an energy drink of your choice. This requires that you understand how light is emitted
by molecules. You will first create riboflavin standards and use fluorescence spectroscopy to
construct a calibration curve. You will then use Beer’s law to quantify the amount of riboflavin in
energy drinks. You will use your results to determine how many energy drinks you would need to
consume to reach your recommended dietary allowance of riboflavin.
Quantification of Riboflavin in Energy Drinks 3
Fluorescence Spectroscopy
STELLARNET 1
Experiment 3: Analysis of Riboflavin in Energy Drinks
INTRODUCTION
Learning Goals Riboflavin is a common component in many different brands of energy drinks. Riboflavin, also known as vitamin B2, is a water-soluble B vitamin and an integral component of several coenzymes needed for cellular respiration. Riboflavin is also a fluorescent compound, which means that it emits light. In this experiment, you will exploit the fluorescence properties of riboflavin to quantify the amount of this compound in Rockstar and another energy drink of your choice. Riboflavin Riboflavin is needed for normal bodily functions. It found in many common foods including milk, eggs, chicken, and spinach (see Table 1). It is an important precursor to two coenzymes (flavin adenine dinucleotide and flavin mononucleotide) that are involved in energy production and many other metabolic pathways. Riboflavin deficiency detrimentally effects these metabolic pathways and can even lead to preeclampsia in pregnant women.1 Table 1: Amount of riboflavin in common foods2
Food Serving Riboflavin (mg)
Fortified, wheat, puffed cereal 1 cup 0.22
Milk (nonfat) 1 cup (8 ounces) 0.45
Cheddar cheese 1 ounce 0.11
Egg (cooked, hard-boiled) 1 large 0.26
Almonds 1 ounce 0.29
Salmon (cooked) 3 ounces 0.13
Halibut (cooked, dry-heat) 3 ounces 0.09
Chicken, light meat (roasted) 3 ounces 0.08
Chicken, dark meat (roasted) 3 ounces 0.16
Beef (ground, cooked) 3 ounces 0.15
Broccoli (boiled) ½ cup chopped 0.10
Asparagus (boiled) 6 spears 0.13
Spinach (boiled) ½ cup 0.21
Bread, whole-wheat 1 slice 0.06
Bread, white (enriched) 1 slice 0.09
1 Wacker J, Fruhauf J, Schulz M, Chiwora FM, Volz J, Becker K. Riboflavin deficiency and preeclampsia. Obstet Gynecol. 2000; 96(1):38-44. 2 http://lpi.oregonstate.edu/mic/vitamins/riboflavin#sources
Fluorescence Spectroscopy
STELLARNET 1
Experiment 3: Analysis of Riboflavin in Energy Drinks
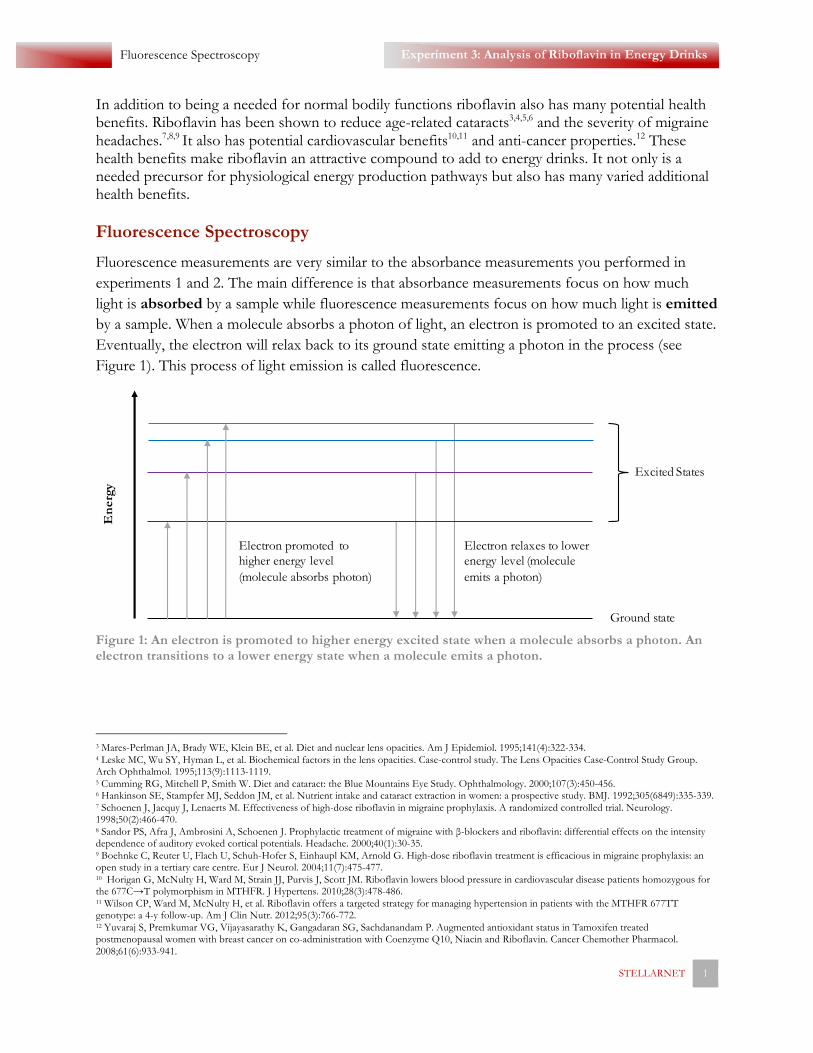
In addition to being a needed for normal bodily functions riboflavin also has many potential health benefits. Riboflavin has been shown to reduce age-related cataracts3,4,5,6 and the severity of migraine headaches.7,8,9 It also has potential cardiovascular benefits10,11 and anti-cancer properties.12 These health benefits make riboflavin an attractive compound to add to energy drinks. It not only is a needed precursor for physiological energy production pathways but also has many varied additional health benefits. Fluorescence Spectroscopy Fluorescence measurements are very similar to the absorbance measurements you performed in experiments 1 and 2. The main difference is that absorbance measurements focus on how much light is absorbed by a sample while fluorescence measurements focus on how much light is emitted by a sample. When a molecule absorbs a photon of light, an electron is promoted to an excited state. Eventually, the electron will relax back to its ground state emitting a photon in the process (see Figure 1). This process of light emission is called fluorescence.
Figure 1: An electron is promoted to higher energy excited state when a molecule absorbs a photon. An electron transitions to a lower energy state when a molecule emits a photon.
3 Mares-Perlman JA, Brady WE, Klein BE, et al. Diet and nuclear lens opacities. Am J Epidemiol. 1995;141(4):322-334. 4 Leske MC, Wu SY, Hyman L, et al. Biochemical factors in the lens opacities. Case-control study. The Lens Opacities Case-Control Study Group. Arch Ophthalmol. 1995;113(9):1113-1119. 5 Cumming RG, Mitchell P, Smith W. Diet and cataract: the Blue Mountains Eye Study. Ophthalmology. 2000;107(3):450-456. 6 Hankinson SE, Stampfer MJ, Seddon JM, et al. Nutrient intake and cataract extraction in women: a prospective study. BMJ. 1992;305(6849):335-339. 7 Schoenen J, Jacquy J, Lenaerts M. Effectiveness of high-dose riboflavin in migraine prophylaxis. A randomized controlled trial. Neurology. 1998;50(2):466-470. 8 Sandor PS, Afra J, Ambrosini A, Schoenen J. Prophylactic treatment of migraine with β-blockers and riboflavin: differential effects on the intensity dependence of auditory evoked cortical potentials. Headache. 2000;40(1):30-35. 9 Boehnke C, Reuter U, Flach U, Schuh-Hofer S, Einhaupl KM, Arnold G. High-dose riboflavin treatment is efficacious in migraine prophylaxis: an open study in a tertiary care centre. Eur J Neurol. 2004;11(7):475-477. 10 Horigan G, McNulty H, Ward M, Strain JJ, Purvis J, Scott JM. Riboflavin lowers blood pressure in cardiovascular disease patients homozygous for the 677C→T polymorphism in MTHFR. J Hypertens. 2010;28(3):478-486. 11 Wilson CP, Ward M, McNulty H, et al. Riboflavin offers a targeted strategy for managing hypertension in patients with the MTHFR 677TT genotype: a 4-y follow-up. Am J Clin Nutr. 2012;95(3):766-772. 12 Yuvaraj S, Premkumar VG, Vijayasarathy K, Gangadaran SG, Sachdanandam P. Augmented antioxidant status in Tamoxifen treated postmenopausal women with breast cancer on co-administration with Coenzyme Q10, Niacin and Riboflavin. Cancer Chemother Pharmacol. 2008;61(6):933-941.
Excited States
Ground state
Energy
Electron promoted to higher energy level (molecule absorbs photon)
Electron relaxes to lower energy level (molecule emits a photon)
Fluorescence Spectroscopy
STELLARNET 2
Experiment 3: Analysis of Riboflavin in Energy Drinks
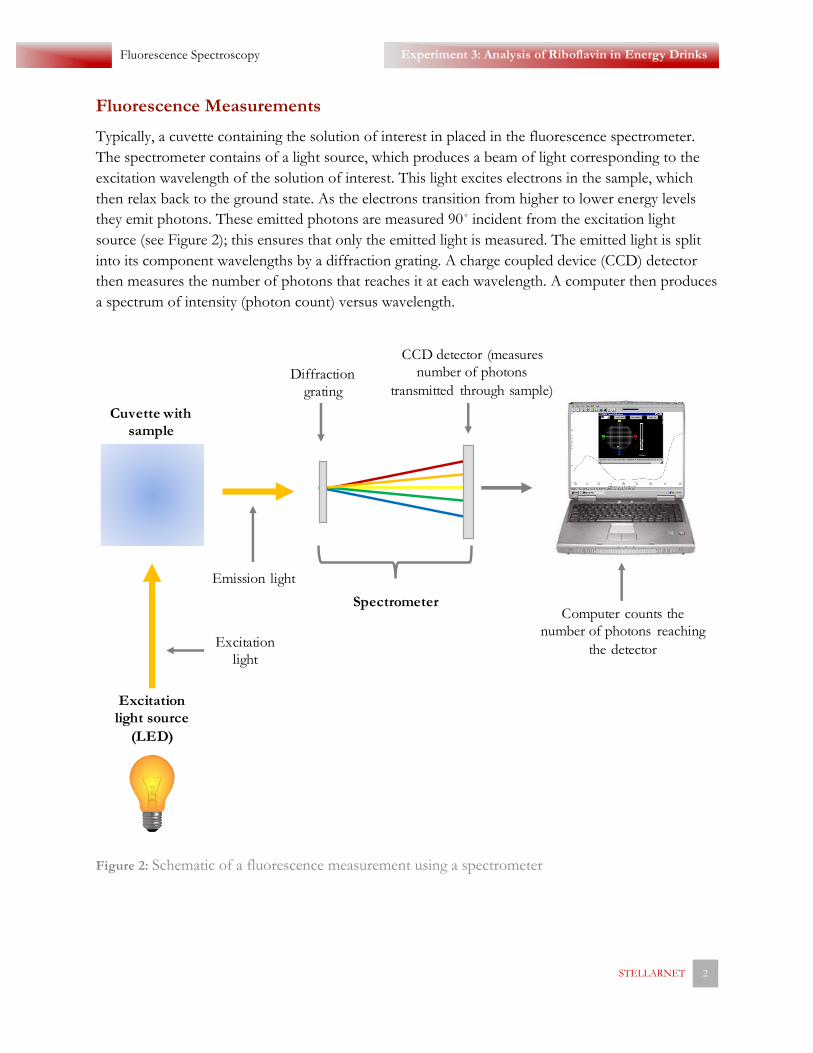
Fluorescence Measurements Typically, a cuvette containing the solution of interest in placed in the fluorescence spectrometer. The spectrometer contains of a light source, which produces a beam of light corresponding to the excitation wavelength of the solution of interest. This light excites electrons in the sample, which then relax back to the ground state. As the electrons transition from higher to lower energy levels they emit photons. These emitted photons are measured 90˚ incident from the excitation light source (see Figure 2); this ensures that only the emitted light is measured. The emitted light is split into its component wavelengths by a diffraction grating. A charge coupled device (CCD) detector then measures the number of photons that reaches it at each wavelength. A computer then produces a spectrum of intensity (photon count) versus wavelength.
Figure 2: Schematic of a fluorescence measurement using a spectrometer
Excitation light source
(LED)
Cuvette with sample
SpectrometerComputer counts the
number of photons reaching the detector
Diffraction grating
CCD detector (measures number of photons
transmitted through sample)
Excitation light
Emission light
Fluorescence Spectroscopy
STELLARNET 3
Experiment 3: Analysis of Riboflavin in Energy Drinks
Beer’s Law for Fluorescence As with absorbance measurements, Beer’s Law can be used for fluorescence measurements. The intensity of emitted light, 𝐼, is directly proportional to the concentration, 𝑐, of the light emitting species in the sample.
𝐼 = 𝑘𝐼%𝑐 (Beer’s Law for fluorescence)
The intensity of light emitted depends on the intensity of light supplied for excitation, I0, and the concentration, c, of the sample. The term k includes both the extinction coefficient (or molar absorptivity) at the excitation wavelength and the pathlength the beam of light travels through the sample. The pathlength is usually 1.000 cm – in this experiment you will use cuvettes that have a pathlength of 1.000 cm. As with absorbance spectroscopy, you must calibrate your fluorescence spectrometer using a set of known standard solutions. By measuring the fluorescence of a set of standard solutions of known concentrations, you can create a calibration curve that shows how the instrument (photon intensity) responds to concentration changes. You can then compare the spectrometer response for those known solutions with the spectrometer response for an unknown solution. Beer’s law then allows you to determine the concentration of your unknown solution.
Fluorescence Spectroscopy
STELLARNET 4
Experiment 3: Analysis of Riboflavin in Energy Drinks
EXPERIMENT PREPARATION
Before you come to lab
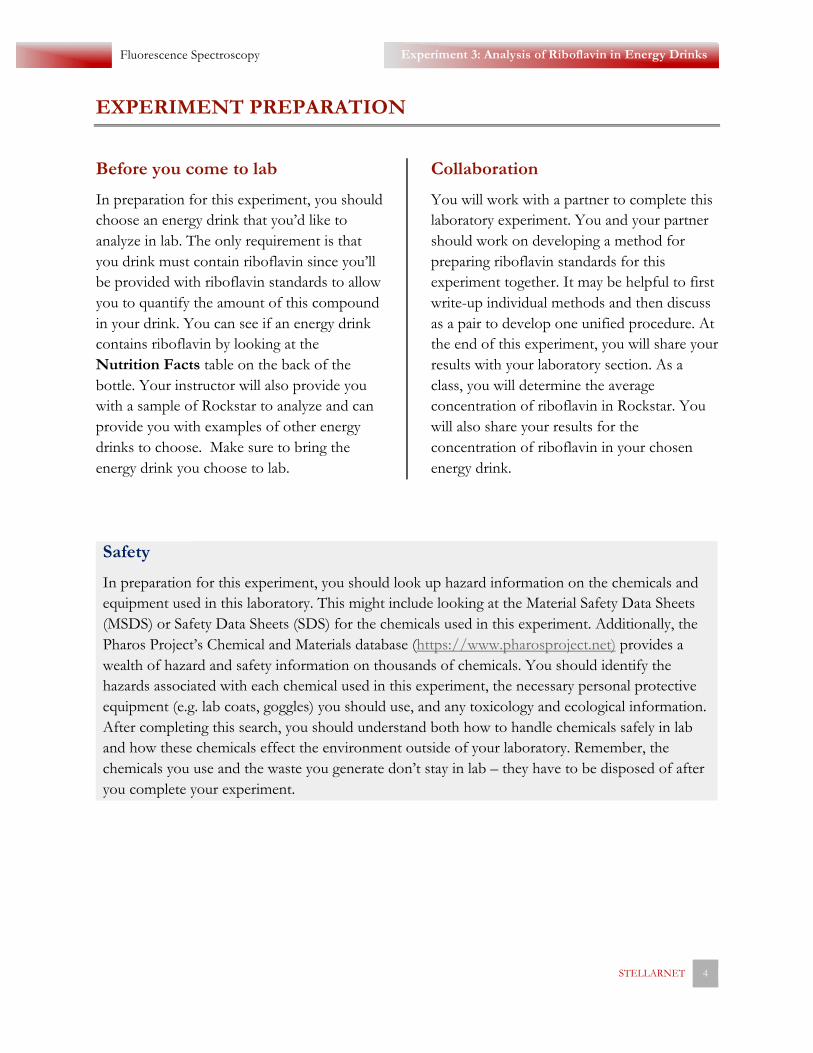
In preparation for this experiment, you should choose an energy drink that you’d like to analyze in lab. The only requirement is that you drink must contain riboflavin since you’ll be provided with riboflavin standards to allow you to quantify the amount of this compound in your drink. You can see if an energy drink contains riboflavin by looking at the Nutrition Facts table on the back of the bottle. Your instructor will also provide you with a sample of Rockstar to analyze and can provide you with examples of other energy drinks to choose. Make sure to bring the energy drink you choose to lab.
Collaboration
You will work with a partner to complete this laboratory experiment. You and your partner should work on developing a method for preparing riboflavin standards for this experiment together. It may be helpful to first write-up individual methods and then discuss as a pair to develop one unified procedure. At the end of this experiment, you will share your results with your laboratory section. As a class, you will determine the average concentration of riboflavin in Rockstar. You will also share your results for the concentration of riboflavin in your chosen energy drink.
Safety
In preparation for this experiment, you should look up hazard information on the chemicals and equipment used in this laboratory. This might include looking at the Material Safety Data Sheets (MSDS) or Safety Data Sheets (SDS) for the chemicals used in this experiment. Additionally, the Pharos Project’s Chemical and Materials database (https://www.pharosproject.net) provides a wealth of hazard and safety information on thousands of chemicals. You should identify the hazards associated with each chemical used in this experiment, the necessary personal protective equipment (e.g. lab coats, goggles) you should use, and any toxicology and ecological information. After completing this search, you should understand both how to handle chemicals safely in lab and how these chemicals effect the environment outside of your laboratory. Remember, the chemicals you use and the waste you generate don’t stay in lab – they have to be disposed of after you complete your experiment.
Fluorescence Spectroscopy
STELLARNET 5
Experiment 3: Analysis of Riboflavin in Energy Drinks
PRELAB QUESTIONS
1. Why do you use acetic acid instead of
water to create your standard riboflavin solutions?
2. Read through the first part of the procedure (Creating Standard Solutions). How will you prepare you standard solutions? Describe the glassware you plan to use and the volumes of solution you will need for each standard. Calculate the final concentration of each standard assuming you add the exact planned volume for each solution.
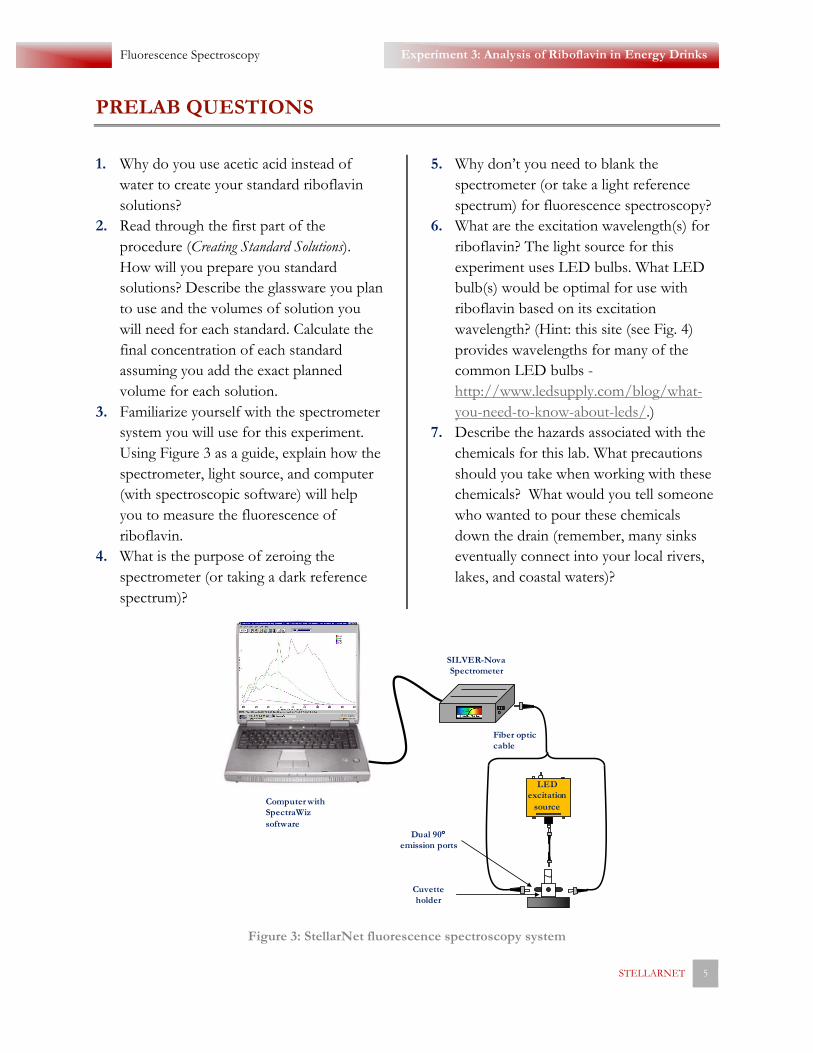
3. Familiarize yourself with the spectrometer system you will use for this experiment. Using Figure 3 as a guide, explain how the spectrometer, light source, and computer (with spectroscopic software) will help you to measure the fluorescence of riboflavin.
4. What is the purpose of zeroing the spectrometer (or taking a dark reference spectrum)?
5. Why don’t you need to blank the spectrometer (or take a light reference spectrum) for fluorescence spectroscopy?
6. What are the excitation wavelength(s) for riboflavin? The light source for this experiment uses LED bulbs. What LED bulb(s) would be optimal for use with riboflavin based on its excitation wavelength? (Hint: this site (see Fig. 4) provides wavelengths for many of the common LED bulbs - http://www.ledsupply.com/blog/what-you-need-to-know-about-leds/.)
7. Describe the hazards associated with the chemicals for this lab. What precautions should you take when working with these chemicals? What would you tell someone who wanted to pour these chemicals down the drain (remember, many sinks eventually connect into your local rivers, lakes, and coastal waters)?
Figure 3: StellarNet fluorescence spectroscopy system
Fiber optic cable
Cuvette holder
LEDexcitation
sourceComputer with SpectraWizsoftware
SILVER-Nova Spectrometer
Dual 90°emission ports
Fluorescence Spectroscopy
STELLARNET 6
Experiment 3: Analysis of Riboflavin in Energy Drinks
PROCEDURE
Material and Equipment
Chemicals
ü 8.00 × 10⁻⁵ M Riboflavin stock solution
ü Rockstar Original Energy Drink
ü Other energy drink (provided by students)
ü 1% Acetic acid
Equipment
ü Glassware for standard solution preparation
ü Cuvettes with caps
ü Lint free wipes
ü Spectrometer (SILVER-Nova)
ü Light source (LED bulbs) and cuvette holder
ü Computer or tablet
ü Fiber optic cable
ü USB cable
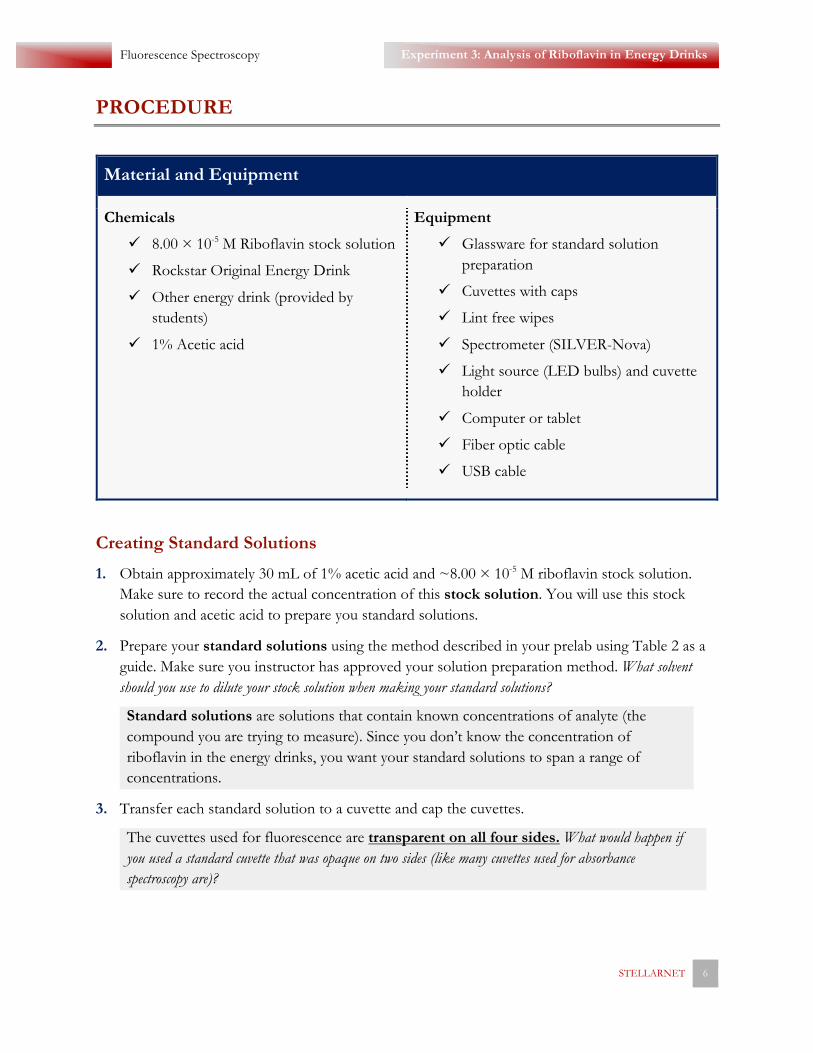
Creating Standard Solutions
1. Obtain approximately 30 mL of 1% acetic acid and ~8.00 × 10⁻⁵ M riboflavin stock solution. Make sure to record the actual concentration of this stock solution. You will use this stock solution and acetic acid to prepare you standard solutions.
2. Prepare your standard solutions using the method described in your prelab using Table 2 as a guide. Make sure you instructor has approved your solution preparation method. What solvent should you use to dilute your stock solution when making your standard solutions?
Standard solutions are solutions that contain known concentrations of analyte (the compound you are trying to measure). Since you don’t know the concentration of riboflavin in the energy drinks, you want your standard solutions to span a range of concentrations.
3. Transfer each standard solution to a cuvette and cap the cuvettes.
The cuvettes used for fluorescence are transparent on all four sides. What would happen if you used a standard cuvette that was opaque on two sides (like many cuvettes used for absorbance spectroscopy are)?
Fluorescence Spectroscopy
STELLARNET 7
Experiment 3: Analysis of Riboflavin in Energy Drinks
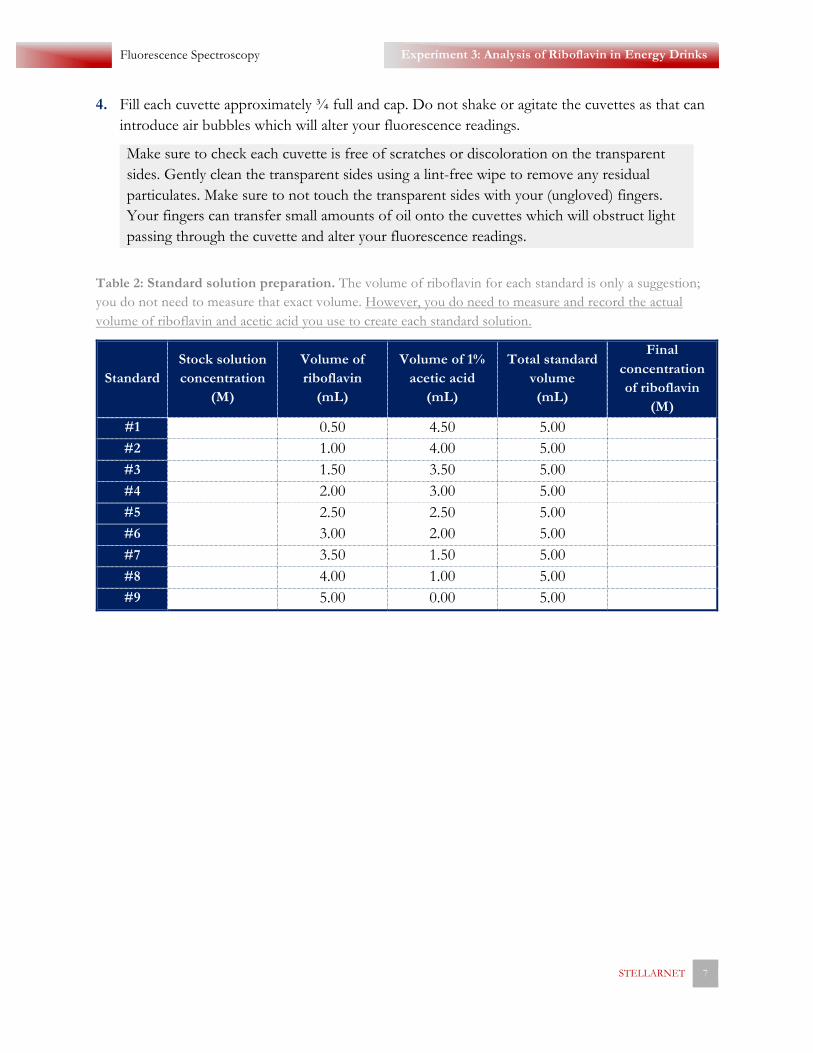
4. Fill each cuvette approximately ¾ full and cap. Do not shake or agitate the cuvettes as that can introduce air bubbles which will alter your fluorescence readings.
Make sure to check each cuvette is free of scratches or discoloration on the transparent sides. Gently clean the transparent sides using a lint-free wipe to remove any residual particulates. Make sure to not touch the transparent sides with your (ungloved) fingers. Your fingers can transfer small amounts of oil onto the cuvettes which will obstruct light passing through the cuvette and alter your fluorescence readings.
Table 2: Standard solution preparation. The volume of riboflavin for each standard is only a suggestion; you do not need to measure that exact volume. However, you do need to measure and record the actual volume of riboflavin and acetic acid you use to create each standard solution.
Standard Stock solution concentration
(M)
Volume of riboflavin
(mL)
Volume of 1% acetic acid
(mL)
Total standard volume (mL)
Final concentration of riboflavin
(M) #1 0.50 4.50 5.00 #2 1.00 4.00 5.00 #3 1.50 3.50 5.00 #4 2.00 3.00 5.00 #5 2.50 2.50 5.00 #6 3.00 2.00 5.00 #7 3.50 1.50 5.00 #8 4.00 1.00 5.00 #9 5.00 0.00 5.00
Fluorescence Spectroscopy
STELLARNET 8
Experiment 3: Analysis of Riboflavin in Energy Drinks
Spectrometer Setup 1. Transfer your standard cuvettes to the spectrometer. Make sure that your cuvettes are capped so
you don’t accidently spill solution on or near the spectrometer.
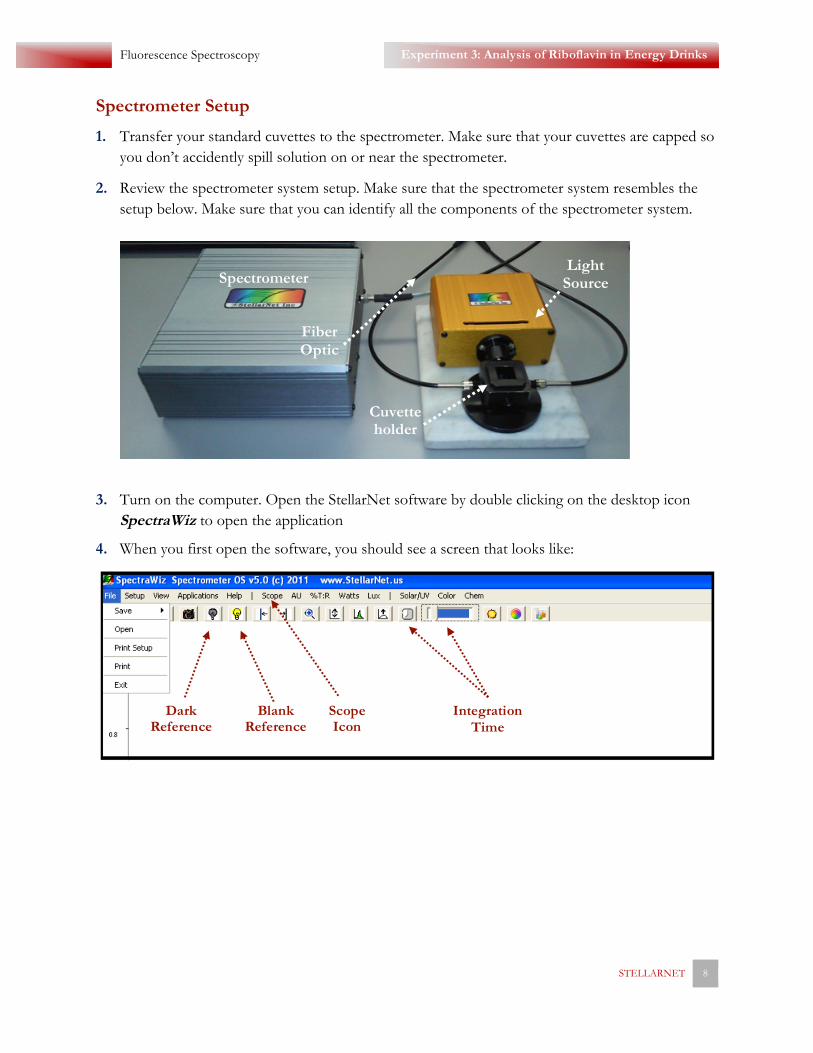
2. Review the spectrometer system setup. Make sure that the spectrometer system resembles the setup below. Make sure that you can identify all the components of the spectrometer system.
3. Turn on the computer. Open the StellarNet software by double clicking on the desktop icon SpectraWiz to open the application
4. When you first open the software, you should see a screen that looks like:
Spectrometer Light
Source
Fiber Optic
Cuvette holder
Scope Icon
Integration Time
Dark Reference
Blank Reference
Fluorescence Spectroscopy
STELLARNET 9
Experiment 3: Analysis of Riboflavin in Energy Drinks
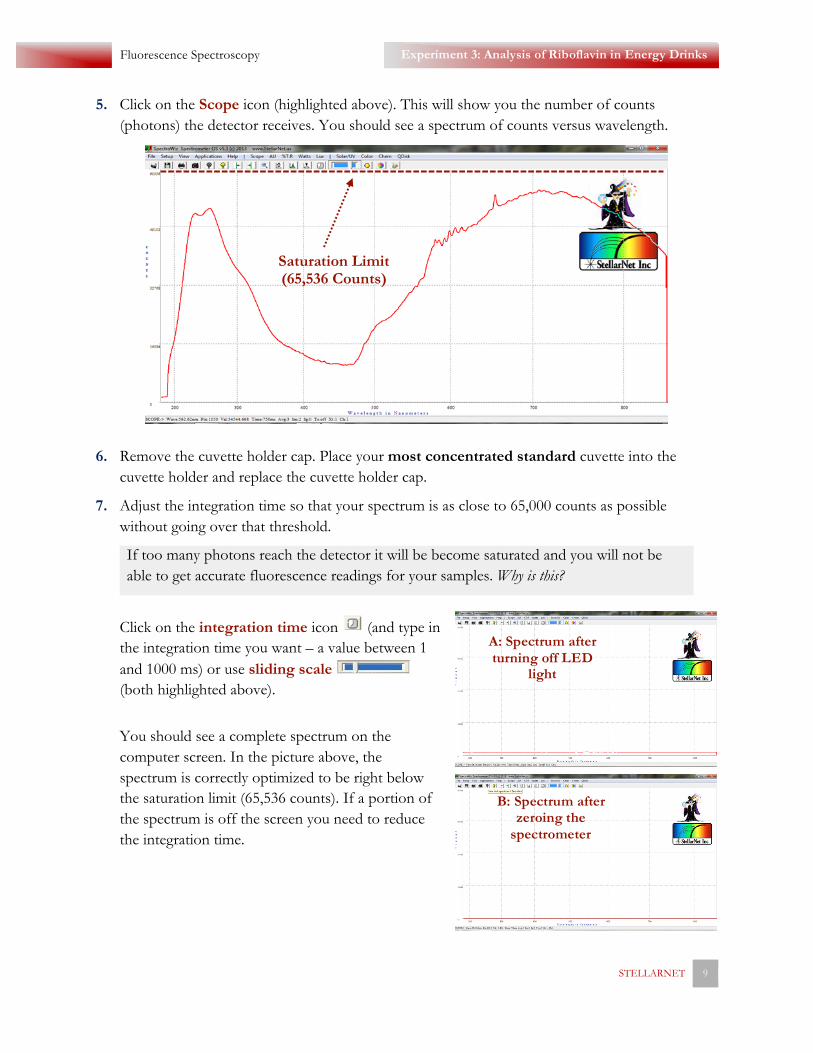
5. Click on the Scope icon (highlighted above). This will show you the number of counts (photons) the detector receives. You should see a spectrum of counts versus wavelength.
6. Remove the cuvette holder cap. Place your most concentrated standard cuvette into the
cuvette holder and replace the cuvette holder cap.
7. Adjust the integration time so that your spectrum is as close to 65,000 counts as possible without going over that threshold.
If too many photons reach the detector it will be become saturated and you will not be able to get accurate fluorescence readings for your samples. Why is this?
Click on the integration time icon (and type in the integration time you want – a value between 1 and 1000 ms) or use sliding scale (both highlighted above).
You should see a complete spectrum on the computer screen. In the picture above, the spectrum is correctly optimized to be right below the saturation limit (65,536 counts). If a portion of the spectrum is off the screen you need to reduce the integration time.
Saturation Limit (65,536 Counts)
A: Spectrum after turning off LED
light
B: Spectrum after zeroing the
spectrometer
Fluorescence Spectroscopy
STELLARNET 10
Experiment 3: Analysis of Riboflavin in Energy Drinks
Zeroing the Spectrometer 1. Zero the spectrometer. Press the red button on the back of the light source (orange box). The
button will be pressed in if the LED light is on. If the button is not pressed in then the LED light is off. After several minutes the baseline will settle (A).
2. Once the baseline has settled, click on the dark light bulb icon in the toolbar at the top of the screen. The baseline will drop to zero (B).
You do not have a blank sample for fluorescence spectroscopy. Why is this?
Taking Fluorescence Measurements 1. Turn LED light on. Press the red button on the back of the light source (orange box). The
button will be pressed in if the LED light is on. If the button is not pressed in then the LED light is off.
2. Remove the cuvette holder cap. Place the most concentrated standard cuvette in the cuvette holder and replace the cuvette holder cap.
3. Remain in Scope mode. The instrument will now display the photon count (intensity) versus wavelength in real time.
4. Look at the spectrum and select the wavelength of that has the maximum photon count. Sketch this spectrum in your lab notebook. Make sure to label your axes. Use this wavelength for subsequent fluorescence measurements.
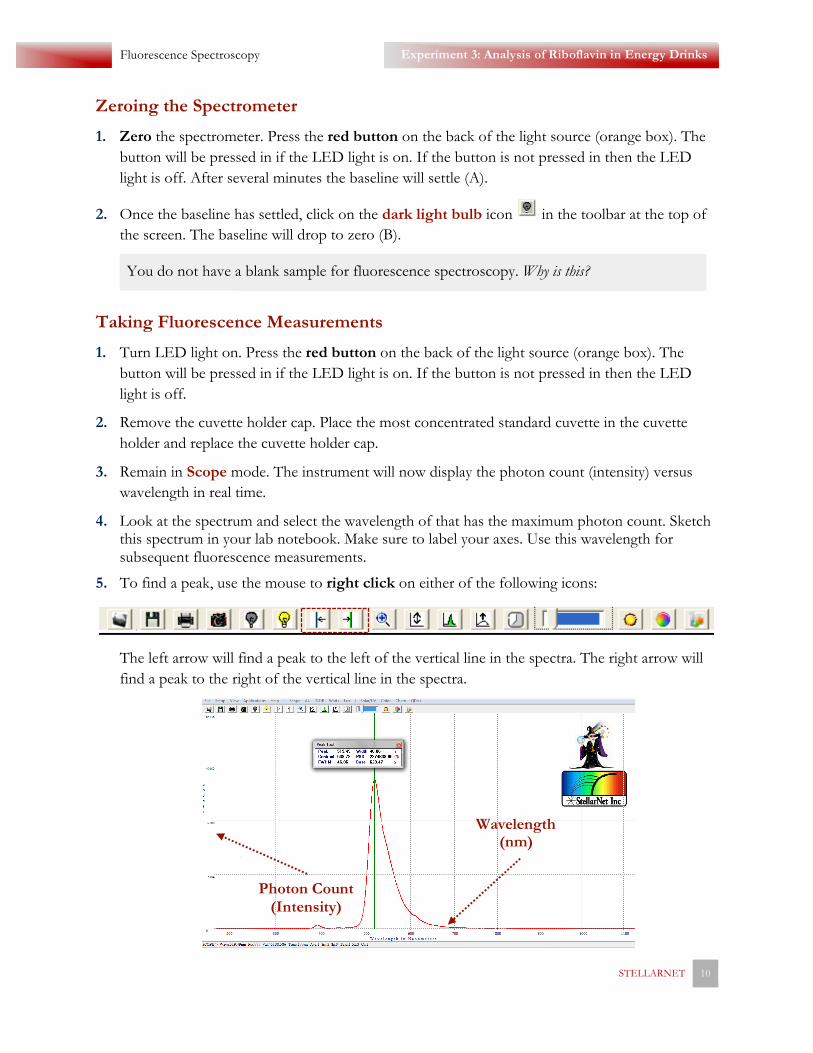
5. To find a peak, use the mouse to right click on either of the following icons:
The left arrow will find a peak to the left of the vertical line in the spectra. The right arrow will find a peak to the right of the vertical line in the spectra.
Photon Count (Intensity)
Wavelength (nm)
Fluorescence Spectroscopy
STELLARNET 11
Experiment 3: Analysis of Riboflavin in Energy Drinks
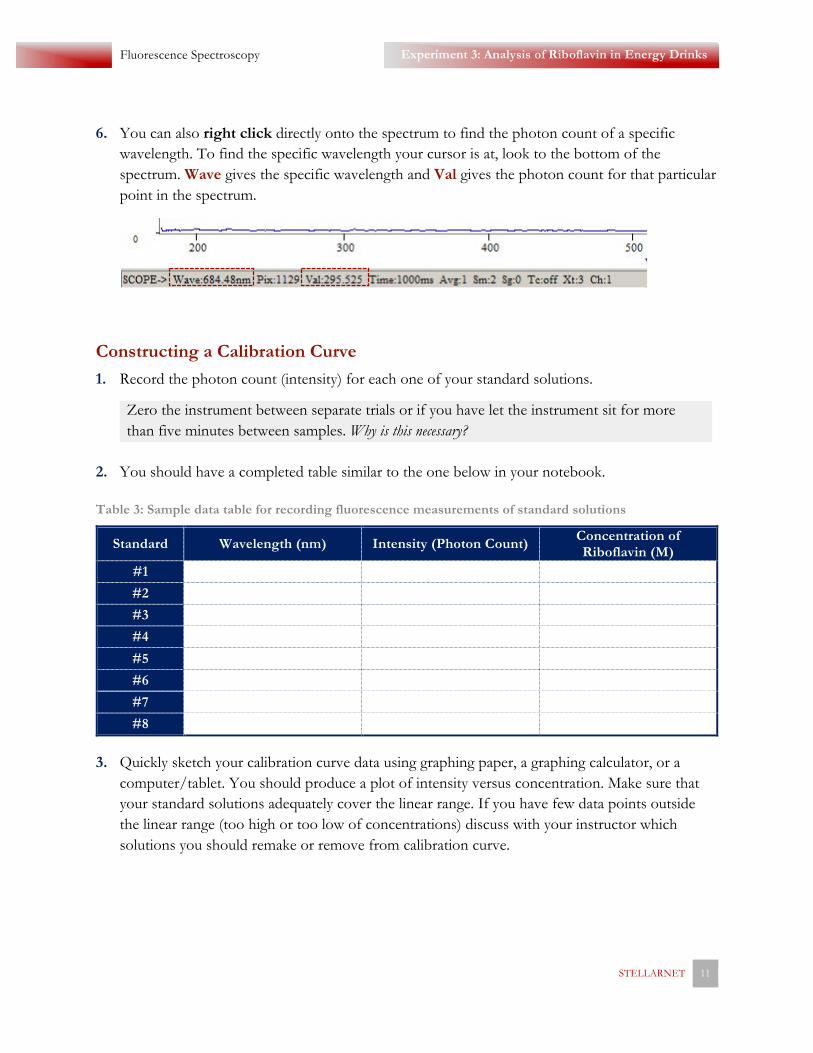
6. You can also right click directly onto the spectrum to find the photon count of a specific wavelength. To find the specific wavelength your cursor is at, look to the bottom of the spectrum. Wave gives the specific wavelength and Val gives the photon count for that particular point in the spectrum.
Constructing a Calibration Curve 1. Record the photon count (intensity) for each one of your standard solutions.
Zero the instrument between separate trials or if you have let the instrument sit for more than five minutes between samples. Why is this necessary?
2. You should have a completed table similar to the one below in your notebook.
Table 3: Sample data table for recording fluorescence measurements of standard solutions
Standard Wavelength (nm) Intensity (Photon Count) Concentration of Riboflavin (M)
#1 #2 #3 #4 #5 #6 #7 #8
3. Quickly sketch your calibration curve data using graphing paper, a graphing calculator, or a computer/tablet. You should produce a plot of intensity versus concentration. Make sure that your standard solutions adequately cover the linear range. If you have few data points outside the linear range (too high or too low of concentrations) discuss with your instructor which solutions you should remake or remove from calibration curve.
Fluorescence Spectroscopy
STELLARNET 12
Experiment 3: Analysis of Riboflavin in Energy Drinks
Analysis of Rockstar and Your Energy Drink 1. Fill a cuvette ¾ full with the provided Rockstar and cap the cuvette.
2. View the emission spectrum of the sample (see the previous section for spectrometer operating instructions). Note the photon count (intensity) at the chosen wavelength (determine in the previous section). Dilute you sample quantitatively if the photon count is above the linear range for your standards.
3. In your lab notebook, record the photon count (intensity) of your (diluted) sample at the chosen wavelength. Use this data and Beer’s Law to calculate the concentration of riboflavin in Rockstar.
4. Repeat this procedure for the energy drink you brought lab this week. What is the concentration of riboflavin in this energy drink? How does it compare to Rockstar?
Sharing Data
1. Share your data with your laboratory class. See the Data Analysis section on the next page for help with these calculations.
a. Report your riboflavin concentration and intensity values (photon counts) for your standard solutions. Indicate which standards you used for your final calibration curve along with the equation for the best-fit line of the data.
b. Report the intensity value (photon count) of Rockstar and your chosen energy drink at with your emission wavelength.
c. Report your calculated concentrations of riboflavin in Rockstar and your chosen energy drink.
Fluorescence Spectroscopy
STELLARNET 13
Experiment 3: Analysis of Riboflavin in Energy Drinks
DATA ANALYSIS
1. Calculate the actual concentrations of all your riboflavin standards you made.
2. Construct calibration curves of intensity (photon count) versus concentration for the riboflavin standards.
a. Use linear regression to determine the slope of this curve. What does the slope represent?
b. What is the R2 value for your linear regression? What does this value tell you?
3. Are any of your standards too concentrated or too dilute?
a. Make an argument for why you should exclude certain data points from your calibration curve.
b. If you excluded certain data points, redo the analysis from 2a – 2c. Does your slope or R2 value change? Why or why not?
4. Using Beer’s Law, determine the concentration of riboflavin in Rockstar and in your chosen energy drink.
DISCUSSION QUESTIONS
1. Comment on the accuracy and precision of your riboflavin data.
a. If did not use volumetric glassware to prepare you standards, what assumptions were you making about the total volume of your standard solutions?
b. How many significant figures should you use to report your riboflavin concentrations? Why?
c. What sources of error were present during your experiment? Is there anything you could do to prevent this in the future?
2. Examine the class data set for the concentration of riboflavin in Rockstar. What trends do you notice? Are there any data points that stand out to you?
3. For the class data set, calculate the mean concentration and standard deviation of riboflavin in Rockstar. What do these two value tell you about the class data set?
4. Use Grubb’s test to determine if there is an outlier in your class data set for Rockstar. Speculate on why or why not there are outliers in the class data set.
5. Summarize the class data on all the tested energy drinks. Which energy drinks contained the most riboflavin? Which ones contained the least? Did any of the energy drink have no detectable amounts of riboflavin?
Fluorescence Spectroscopy
STELLARNET 14
Experiment 3: Analysis of Riboflavin in Energy Drinks
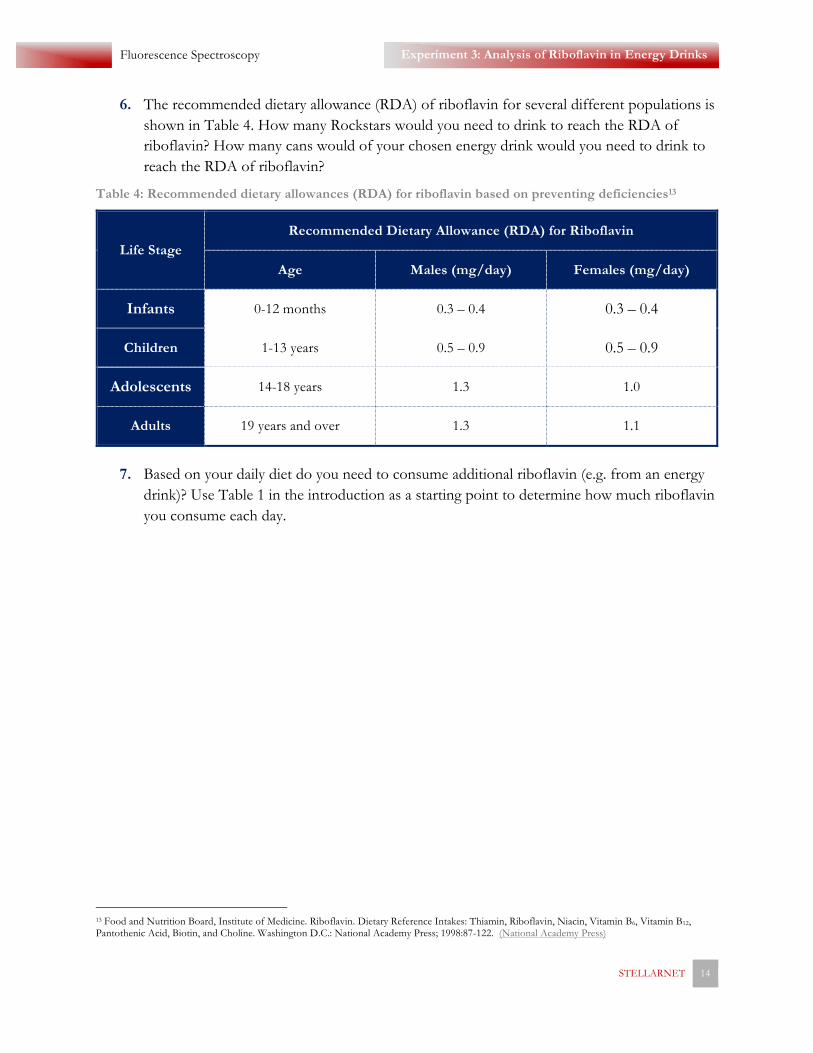
6. The recommended dietary allowance (RDA) of riboflavin for several different populations is shown in Table 4. How many Rockstars would you need to drink to reach the RDA of riboflavin? How many cans would of your chosen energy drink would you need to drink to reach the RDA of riboflavin?
Table 4: Recommended dietary allowances (RDA) for riboflavin based on preventing deficiencies13
Life Stage Recommended Dietary Allowance (RDA) for Riboflavin
Age Males (mg/day) Females (mg/day)
Infants 0-12 months 0.3 – 0.4 0.3 – 0.4
Children 1-13 years 0.5 – 0.9 0.5 – 0.9
Adolescents 14-18 years 1.3 1.0
Adults 19 years and over 1.3 1.1
7. Based on your daily diet do you need to consume additional riboflavin (e.g. from an energy drink)? Use Table 1 in the introduction as a starting point to determine how much riboflavin you consume each day.
13 Food and Nutrition Board, Institute of Medicine. Riboflavin. Dietary Reference Intakes: Thiamin, Riboflavin, Niacin, Vitamin B6, Vitamin B12, Pantothenic Acid, Biotin, and Choline. Washington D.C.: National Academy Press; 1998:87-122. (National Academy Press)