Embed Size (px)
Citation preview
lable at ScienceDirect
Atmospheric Environment 98 (2014) 607e619
Contents lists avai
Atmospheric Environment
journal homepage: www.elsevier .com/locate/atmosenv
Quantification of aerosol type, and sources of aerosols over the Indo-Gangetic Plain
Sumita Kedia a, *, S. Ramachandran b, B.N. Holben c, S.N. Tripathi d
a Computational Earth Sciences Group, Centre for Development of Advanced Computing, Pune, Maharashtra 411007, Indiab Space and Atmospheric Sciences Division, Physical Research Laboratory, Ahmedabad 380009, Indiac Biospheric Science Laboratory, NASA Goddard Space Flight Center, Greenbelt, MD 20771, USAd Department of Civil Engineering, Indian Institute of Technology, Kanpur 208016, India
h i g h l i g h t s
� AODs exhibit prominent seasonal variation over Kanpur and Gandhi College in IGP.� Coarse mode aerosol concentration is always higher over Kanpur than Gandhi College.� Fine mode aerosols dominate IGP during winter and postmonsoon.� Absorbing aerosols over IGP are Mostly BC, and Mixed BC and Dust.� Enhanced absorption due to OC aerosols may be negligible over IGP.
a r t i c l e i n f o
Article history:Received 13 June 2014Received in revised form5 September 2014Accepted 6 September 2014Available online 16 September 2014
Keywords:Aerosol optical depthÅngstr€om parametersSingle scattering albedoIndo Gangetic plainFine mode fractionAbsorbing aerosol typeOrganic carbon
* Corresponding author.E-mail addresses: [email protected], physumi@gma
in (S. Ramachandran), [email protected] ((S.N. Tripathi).
http://dx.doi.org/10.1016/j.atmosenv.2014.09.0221352-2310/© 2014 Elsevier Ltd. All rights reserved.
a b s t r a c t
Differences and similarities in aerosol characteristics, for the first time, over two environmentally distinctlocations in Indo-Gangetic plain (IGP) e Kanpur (KPR) (urban location) and Gandhi College (GC) (ruralsite) are examined. Aerosol optical depths (AODs) exhibit pronounced seasonal variability with highervalues during winter and premonsoon. Aerosol fine mode fraction (FMF) and Ångstr€om exponent (a) arehigher over GC than KPR indicating relatively higher fine mode aerosol concentration over GC. HigherFMF over GC is attributed to local biomass burning activities. Analysis of AOD spectra revealed thataerosol size distribution is dominated by wide range of fine mode fractions or mixture of modes duringwinter and postmonsoon, while during premonsoon and monsoon coarse mode aerosols are moreabundant. Single scattering albedo (SSA) is lower over GC than KPR. SSA spectra reveals the abundance offine mode (coarse mode) absorbing (scattering) aerosols during winter and postmonsoon (premonsoonand monsoon). Spectral SSA features reveal that OC contribution to enhanced absorption is negligible.Analysis shows that absorbing aerosols can be classified as Mostly Black Carbon (BC), and Mixed BC andDust over IGP. Mixed BC and dust is always higher over KPR, while Mostly BC is higher over GCthroughout the year. The amount of long range transported dust exhibits a gradient between KPR(higher) and GC (lower). Results on seasonally varying aerosol types, and absorbing aerosol types andtheir gradients over an aerosol hotspot are important to tune models and to reduce the uncertainty inradiative and climate impact of aerosols.
© 2014 Elsevier Ltd. All rights reserved.
1. Introduction
Indo-Gangetic plain (IGP) is one of the largest river basins in theworld. It is densely populated (population density of 500e1000 ormore per sq. km., based on 2001 census) and is one of the most
il.com (S. Kedia), [email protected]. Holben), [email protected]
highly polluted regions in theworld (Singh et al., 2004; Di Girolamoet al., 2004; Ramana et al., 2004; Tripathi et al., 2005; Dey and DiGirolamo, 2010; Srivastava et al., 2011). This region is bordered bythe Himalayas to the north, Vindhyan Satpura ranges to the south,Thar desert and the Arabian Sea in thewest and the Bay of Bengal inthe east. Due to its unique topography and diverse aerosol emis-sions (e.g., dust, black carbon, nitrate, sulfate and organics) fromdensely populated and industrialized areas over IGP, this region hasbecome a hot spot for environmental research. Several studies us-ing ground based measurements and satellite data have shown
S. Kedia et al. / Atmospheric Environment 98 (2014) 607e619608
persistent heavy aerosol loading over the IGP region throughoutthe year (Singh et al., 2004; Di Girolamo et al., 2004; Ramana et al.,2004; Prasad et al., 2006; Badarinath et al., 2009; Eck et al., 2010;Giles et al., 2011). High aerosol loading over this region not onlyresults in poor air quality leading to adverse health effects (Jai Deviet al., 2009) but also perturbs the climate significantly (Bollasinaet al., 2011, and references therein). During winter at several loca-tions in the IGP, large aerosol concentrations near the surface aswell as in the vertical column were reported due to lower tem-perature and shallow boundary layer (Singh et al., 2004; Tripathiet al., 2005; Prasad et al., 2006; Ramachandran et al., 2006; Tareet al., 2006; Eck et al., 2012; Choudhry et al., 2012). This feature isseen during winter because inversion layer remains at low altitudesdue to lower temperature, and the development of boundary layeris weak which aids in trapping the particles within this layer(Komppula et al., 2012). In addition, formation of fog and visibilitydegradation is a consistent feature during winter over many loca-tions in IGP, which occurs due to favorable meteorological condi-tions aided by high aerosol concentration over IGP (Ramachandranet al., 2006; Tare et al., 2006; Eck et al., 2012). IGP is highly influ-enced by mineral dust during premonsoon and sea salt duringmonsoon, while during postmonsoon fine mode aerosols dominate(Dey et al., 2004; Tare et al., 2006; Chinnam et al., 2006; Badarinathet al., 2009; Srivastava et al., 2012).
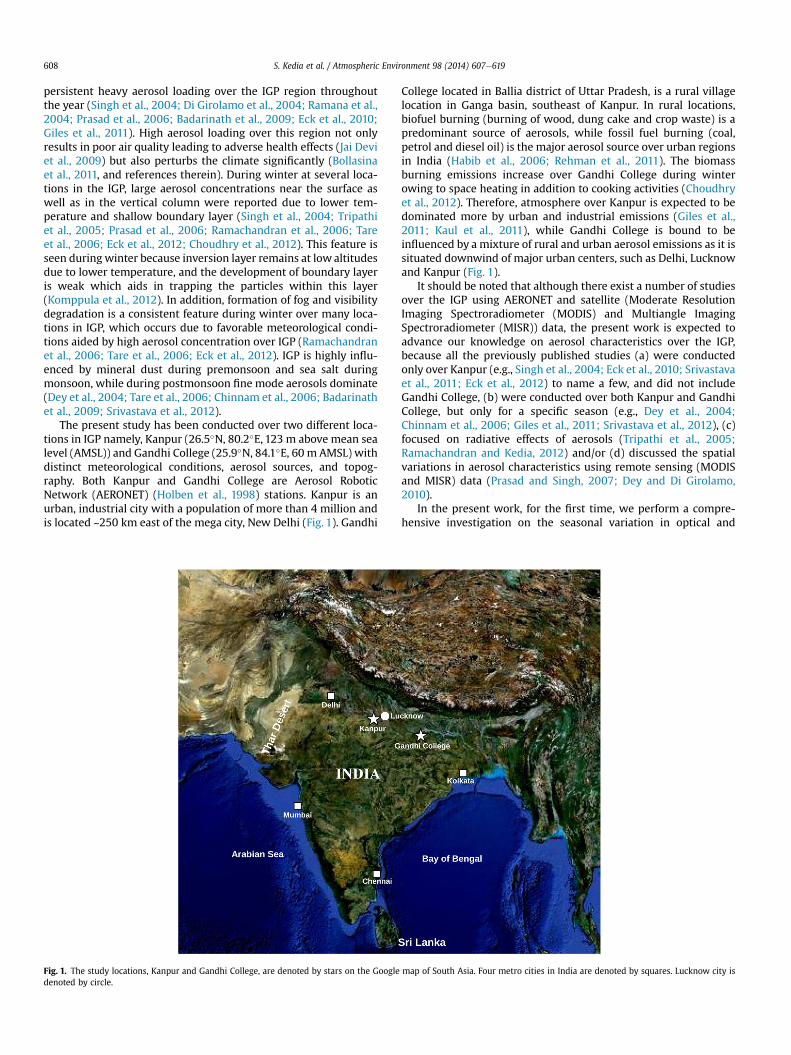
The present study has been conducted over two different loca-tions in IGP namely, Kanpur (26.5�N, 80.2�E, 123 m above mean sealevel (AMSL)) and Gandhi College (25.9�N, 84.1�E, 60 m AMSL) withdistinct meteorological conditions, aerosol sources, and topog-raphy. Both Kanpur and Gandhi College are Aerosol RoboticNetwork (AERONET) (Holben et al., 1998) stations. Kanpur is anurban, industrial city with a population of more than 4 million andis located ~250 km east of the mega city, New Delhi (Fig. 1). Gandhi
Fig. 1. The study locations, Kanpur and Gandhi College, are denoted by stars on the Googledenoted by circle.
College located in Ballia district of Uttar Pradesh, is a rural villagelocation in Ganga basin, southeast of Kanpur. In rural locations,biofuel burning (burning of wood, dung cake and crop waste) is apredominant source of aerosols, while fossil fuel burning (coal,petrol and diesel oil) is the major aerosol source over urban regionsin India (Habib et al., 2006; Rehman et al., 2011). The biomassburning emissions increase over Gandhi College during winterowing to space heating in addition to cooking activities (Choudhryet al., 2012). Therefore, atmosphere over Kanpur is expected to bedominated more by urban and industrial emissions (Giles et al.,2011; Kaul et al., 2011), while Gandhi College is bound to beinfluenced by a mixture of rural and urban aerosol emissions as it issituated downwind of major urban centers, such as Delhi, Lucknowand Kanpur (Fig. 1).
It should be noted that although there exist a number of studiesover the IGP using AERONET and satellite (Moderate ResolutionImaging Spectroradiometer (MODIS) and Multiangle ImagingSpectroradiometer (MISR)) data, the present work is expected toadvance our knowledge on aerosol characteristics over the IGP,because all the previously published studies (a) were conductedonly over Kanpur (e.g., Singh et al., 2004; Eck et al., 2010; Srivastavaet al., 2011; Eck et al., 2012) to name a few, and did not includeGandhi College, (b) were conducted over both Kanpur and GandhiCollege, but only for a specific season (e.g., Dey et al., 2004;Chinnam et al., 2006; Giles et al., 2011; Srivastava et al., 2012), (c)focused on radiative effects of aerosols (Tripathi et al., 2005;Ramachandran and Kedia, 2012) and/or (d) discussed the spatialvariations in aerosol characteristics using remote sensing (MODISand MISR) data (Prasad and Singh, 2007; Dey and Di Girolamo,2010).
In the present work, for the first time, we perform a compre-hensive investigation on the seasonal variation in optical and
map of South Asia. Four metro cities in India are denoted by squares. Lucknow city is
S. Kedia et al. / Atmospheric Environment 98 (2014) 607e619 609
physical properties of aerosols using a relatively long term(2006e2010) coincident ground based measurements of aerosolproperties with AERONET sun/sky radiometers over two distinctlydifferent (urban vs. rural) environments to construct a climatologyof aerosol features over the IGP. The present study attempts todelineate the seasonally varying contribution of natural (coarsemode) and anthropogenic (fine mode) aerosols emitted fromvarious sources based on the spectral distribution of optical char-acteristics of aerosols. Results on spatiotemporal variability ofaerosol size distribution, source regions, aerosol types, and theiroptical and physical characteristics over two distinctly differentenvironments in the same region will be useful inputs to regionaland global aerosol models when assessing regional radiative forc-ing and climate impacts.
2. Wind patterns and meteorological conditions
Surface level daily mean temperature, relative humidity (RH)and wind speed are obtained from National Center for Environ-mental Prediction (http://www.cdc.noaa.gov/) reanalysis at2.5� � 2.5� resolution, and daily rainfall data are obtained fromTropical Rainfall Measuring Mission (http://disc2.nascom. nasa.gov/Giovanni/tovas/) at 1� � 1 resolution during 2006e2010.These data are further used to calculate the seasonal averages andgiven in Table 1. Both Kanpur and Gandhi College exhibit similarmeteorological conditions (Table 1). During winter temperatureand wind speed are lower, and the atmosphere is dry (low RH) overboth the locations as compared to other seasons (Table 1). In pre-monsoon temperature and wind speed increase over both loca-tions. RH is higher while temperature is lower over Gandhi Collegethan Kanpur throughout the year. During monsoon RH is highest,and both the locations receive maximum rainfall (>95% of totalannual rainfall). However, Gandhi College receives comparativelyhigher rainfall than Kanpur during the study period. During post-monsoon temperature, wind speed and RH reduce over both thelocations. Depending on the prevailing meteorological conditionover IGP, an year can be broadly divided into four distinct seasons,namely winter (December, January, February, DJF), premonsoon(March, April, May, MAM), monsoon (June, July, August, September,JJAS), and postmonsoon (October, November, ON) (Singh et al.,2004; Dey et al., 2004). Therefore, on the basis of meteorology,aerosol properties are grouped into four major seasons of winter,premonsoon, monsoon and postmonsoon, and presented.
2.1. Air backward trajectory analysis
Air back trajectory analysis has been conducted to identify thepossible source regions and the transport pathways of pollutantsbefore they reach the measurement locations. 5-day back
Table 1Seasonal mean surface level meteorological parameters over Kanpur and GandhiCollege during 2006e2010 along with ±1s variation from the mean.
Location Seasons Temperature(�C)
Relativehumidity(%)
Windspeed (m s�1)
Rainfall(mm)
Kanpur Winter 23.8 ± 2.9 32 ± 11 2.4 ± 1.3 24 ± 26Premonsoon 33.1 ± 3.8 27 ± 9 3.2 ± 1.3 31 ± 14Monsoon 29.3 ± 3.4 80 ± 21 2.9 ± 1.6 732 ± 197Postmonsoon 25.8 ± 1.6 57 ± 16 1.9 ± 1.1 46 ± 64
GandhiCollege
Winter 22.7 ± 2.4 43 ± 12 2.1 ± 1.0 19 ± 16Premonsoon 29.8 ± 2.2 52 ± 17 2.2 ± 1.1 71 ± 45Monsoon 27.1 ± 1.5 92 ± 8 2.4 ± 1.1 1023 ± 255Postmonsoon 24.7 ± 1.6 73 ± 14 2.2 ± 1.1 41 ± 39
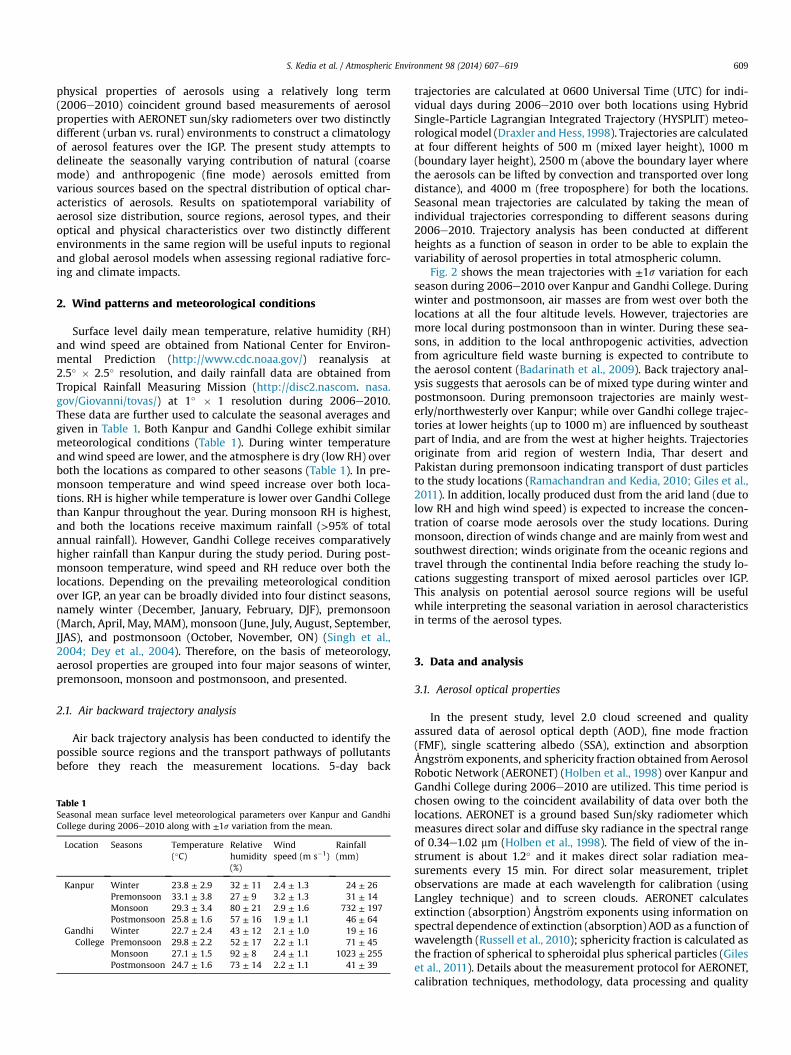
trajectories are calculated at 0600 Universal Time (UTC) for indi-vidual days during 2006e2010 over both locations using HybridSingle-Particle Lagrangian Integrated Trajectory (HYSPLIT) meteo-rological model (Draxler and Hess,1998). Trajectories are calculatedat four different heights of 500 m (mixed layer height), 1000 m(boundary layer height), 2500 m (above the boundary layer wherethe aerosols can be lifted by convection and transported over longdistance), and 4000 m (free troposphere) for both the locations.Seasonal mean trajectories are calculated by taking the mean ofindividual trajectories corresponding to different seasons during2006e2010. Trajectory analysis has been conducted at differentheights as a function of season in order to be able to explain thevariability of aerosol properties in total atmospheric column.
Fig. 2 shows the mean trajectories with ±1s variation for eachseason during 2006e2010 over Kanpur and Gandhi College. Duringwinter and postmonsoon, air masses are from west over both thelocations at all the four altitude levels. However, trajectories aremore local during postmonsoon than in winter. During these sea-sons, in addition to the local anthropogenic activities, advectionfrom agriculture field waste burning is expected to contribute tothe aerosol content (Badarinath et al., 2009). Back trajectory anal-ysis suggests that aerosols can be of mixed type during winter andpostmonsoon. During premonsoon trajectories are mainly west-erly/northwesterly over Kanpur; while over Gandhi college trajec-tories at lower heights (up to 1000 m) are influenced by southeastpart of India, and are from the west at higher heights. Trajectoriesoriginate from arid region of western India, Thar desert andPakistan during premonsoon indicating transport of dust particlesto the study locations (Ramachandran and Kedia, 2010; Giles et al.,2011). In addition, locally produced dust from the arid land (due tolow RH and high wind speed) is expected to increase the concen-tration of coarse mode aerosols over the study locations. Duringmonsoon, direction of winds change and are mainly fromwest andsouthwest direction; winds originate from the oceanic regions andtravel through the continental India before reaching the study lo-cations suggesting transport of mixed aerosol particles over IGP.This analysis on potential aerosol source regions will be usefulwhile interpreting the seasonal variation in aerosol characteristicsin terms of the aerosol types.
3. Data and analysis
3.1. Aerosol optical properties
In the present study, level 2.0 cloud screened and qualityassured data of aerosol optical depth (AOD), fine mode fraction(FMF), single scattering albedo (SSA), extinction and absorptionÅngstr€om exponents, and sphericity fraction obtained fromAerosolRobotic Network (AERONET) (Holben et al., 1998) over Kanpur andGandhi College during 2006e2010 are utilized. This time period ischosen owing to the coincident availability of data over both thelocations. AERONET is a ground based Sun/sky radiometer whichmeasures direct solar and diffuse sky radiance in the spectral rangeof 0.34e1.02 mm (Holben et al., 1998). The field of view of the in-strument is about 1.2� and it makes direct solar radiation mea-surements every 15 min. For direct solar measurement, tripletobservations are made at each wavelength for calibration (usingLangley technique) and to screen clouds. AERONET calculatesextinction (absorption) Ångstr€om exponents using information onspectral dependence of extinction (absorption) AOD as a function ofwavelength (Russell et al., 2010); sphericity fraction is calculated asthe fraction of spherical to spheroidal plus spherical particles (Gileset al., 2011). Details about the measurement protocol for AERONET,calibration techniques, methodology, data processing and quality
10
20
30
40
Latit
ude
(o N)
500m1000m2500m4000m
10
20
30
40
10
20
30
40
10
20
30
40
Latit
ude
(o N)
10
20
30
40
Latit
ude
(o N)
10
20
30
40
30 40 50 60 70 80 90 100
10
20
30
40
30 40 50 60 70 80 90 100
10
20
30
40
Latit
ude
(o N)
IndiaIndia
India
Sri Lanka
India
India
India
(c) Monsoon
(e) Winter
(d) Postmonsoon
(f) Premonsoon
Kanpur Gandhi College(a) Winter
(h) Postmonsoon
(b) Premonsoon
(g) Monsoon
Sri Lanka
Arabia
Yemen
Saudi
Paki
stan
Afgh
anist
an
Iran
Iran
Bay of Bengal
Saudi Arabia
Saudi Arabia
Arabia
ArabiaSaudi
Yemen
Yemen
Yemen
Sri Lanka Sri Lanka
Saudi
Arabian Sea
Arabian Sea
ArabiaSaudi
Iran
Iran
IranIran
Oman
OmanOman
Oman
Oman
OmanOman
Yemen Oman
Iran
Sri Lanka
Bay of Bengal
Fig. 2. Seasonal averages of 5-day air back trajectories at 500 m, 1000 m, 2500 m and 4000 m corresponding to 0600 UTC during 2006e2010 over Kanpur (a, b, c, d) and GandhiCollege (e, f, g, h). Stippling represent variation from the mean pathway during each season for 2006e2010.
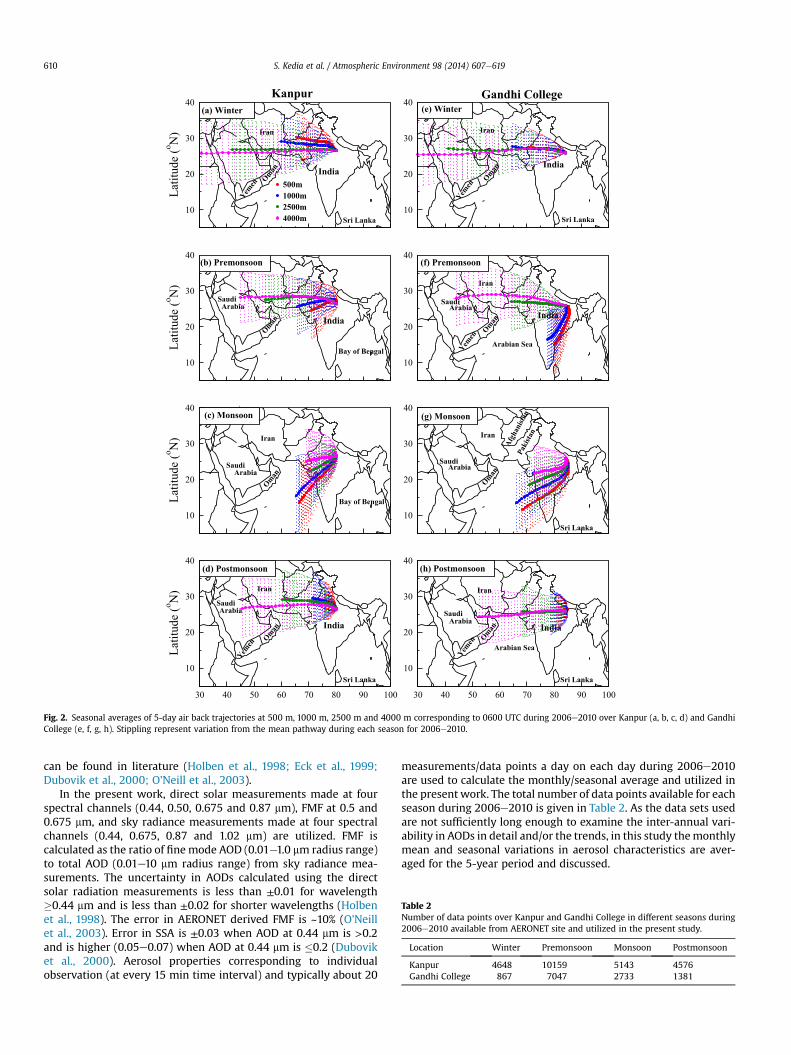
Table 2Number of data points over Kanpur and Gandhi College in different seasons during2006e2010 available from AERONET site and utilized in the present study.
Location Winter Premonsoon Monsoon Postmonsoon
Kanpur 4648 10159 5143 4576Gandhi College 867 7047 2733 1381
S. Kedia et al. / Atmospheric Environment 98 (2014) 607e619610
can be found in literature (Holben et al., 1998; Eck et al., 1999;Dubovik et al., 2000; O'Neill et al., 2003).
In the present work, direct solar measurements made at fourspectral channels (0.44, 0.50, 0.675 and 0.87 mm), FMF at 0.5 and0.675 mm, and sky radiance measurements made at four spectralchannels (0.44, 0.675, 0.87 and 1.02 mm) are utilized. FMF iscalculated as the ratio of finemode AOD (0.01e1.0 mm radius range)to total AOD (0.01e10 mm radius range) from sky radiance mea-surements. The uncertainty in AODs calculated using the directsolar radiation measurements is less than ±0.01 for wavelength�0.44 mm and is less than ±0.02 for shorter wavelengths (Holbenet al., 1998). The error in AERONET derived FMF is ~10% (O'Neillet al., 2003). Error in SSA is ±0.03 when AOD at 0.44 mm is >0.2and is higher (0.05e0.07) when AOD at 0.44 mm is �0.2 (Duboviket al., 2000). Aerosol properties corresponding to individualobservation (at every 15 min time interval) and typically about 20
measurements/data points a day on each day during 2006e2010are used to calculate the monthly/seasonal average and utilized inthe present work. The total number of data points available for eachseason during 2006e2010 is given in Table 2. As the data sets usedare not sufficiently long enough to examine the inter-annual vari-ability in AODs in detail and/or the trends, in this study themonthlymean and seasonal variations in aerosol characteristics are aver-aged for the 5-year period and discussed.
S. Kedia et al. / Atmospheric Environment 98 (2014) 607e619 611
3.2. Ångstr€om exponent and its derivative
Spectral variation in AODs can be represented by Ångstr€ompower law (t¼ bl�a, where t is AOD, l is thewavelength in mm, anda and b are Ångstr€om parameters). a is calculated from the linear fitof ln t versus ln l data and is known as the wavelength exponent. bis the turbidity coefficient which is equal to the AOD at 1 mm. The a
value depends on aerosol size distribution and varies from 1 to 3 forfresh and aged smoke (Nicolae et al., 2013), and for urban aerosolparticles, while a is nearly zero for coarse mode aerosols such asdust and sea salt (Eck et al., 1999). b ranges between 0 and 1, and isan indicator of the amount of aerosols present in the atmosphericcolumn. In the ambient atmosphere aerosol size distribution ismultimodal with contribution from both fine and coarse modeaerosols. Therefore, Ångstr€om power law can introduce significanterrors in the determination of aerosol size distribution (Eck et al.,1999). Under these conditions deviation from linear behavior ofln t versus ln l data occurs, which can be quantified by fitting asecond order polynomial of the form.
ln t ¼ a2 ðln lÞ2 þ a1 ln lþ a0; (1)
where a0, a1 and a2 are the coefficients of the polynomial fit, whichcan be utilized to get information on the dominant type of aerosols(whether fine or coarse) in the size distribution. Schuster et al.(2006) showed that though different aerosol size distributionscan produce the same value of a, the coefficients of polynomial fitcan be distinctly different. AODs measured in the wavelength re-gion of 0.44e0.87 mm during 2006e2010 over Kanpur and GandhiCollege are used for the calculation of a, a0, a1 and a2 by applying apolynomial fit to ln t versus ln l data, and monthly/seasonal meansare obtained. AODs in the 0.44e0.87 mm range have been chosenbecause AERONET channels in the 0.44e0.87 mmwavelength rangeare more accurate (Holben et al., 1998; Eck et al., 1999).
4. Results and discussion
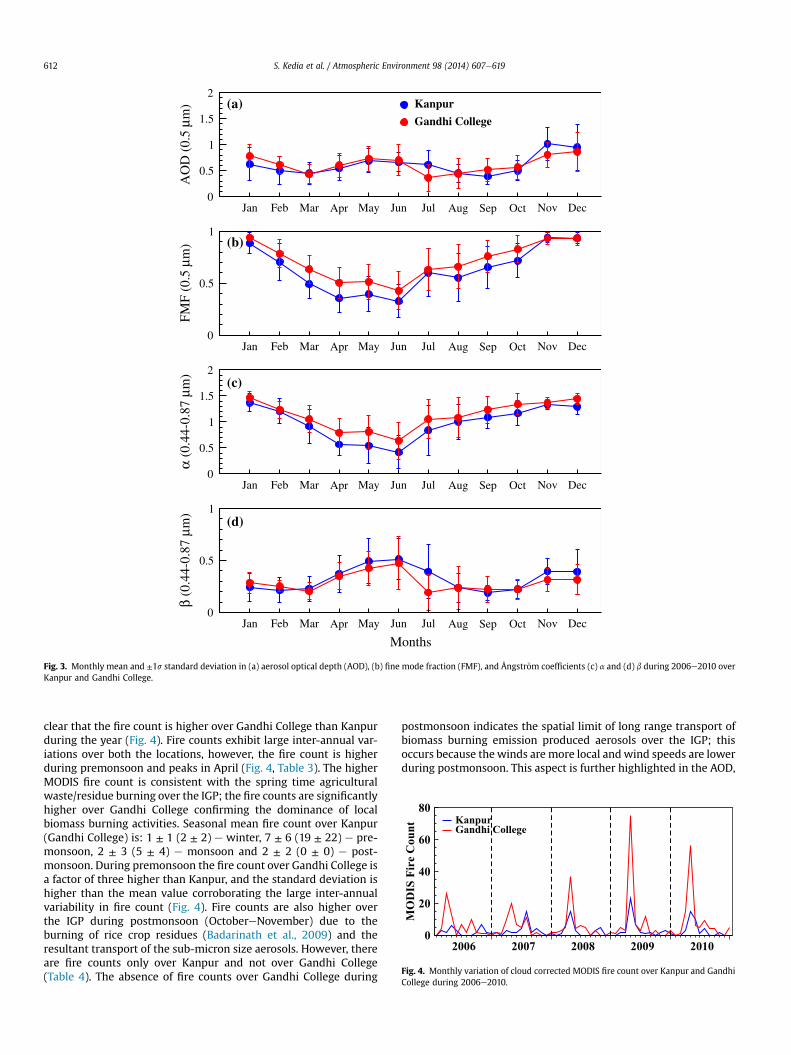
4.1. Aerosol optical depths, fine mode fraction and Ångstr€omcoefficients
The gradual increase in AOD from March to May over both thelocations in IGP (Fig. 3a) can be ascribed to the increase in dustparticle concentration as the southwesterly winds (Fig. 2) are fromthe arid, and semiarid regions. AODs decrease during monsoonover both the locations which is consistent with the earlier resultsobtained over Kanpur only as in Eck et al. (2010). This decrease isattributed to wet deposition and change in the origin of the airparcels (originating from the Arabian Sea (Fig. 2). The decrease inAOD, however, is not significant as the air parcels travel acrosswestern India and the Thar desert before reaching the study loca-tions (Figs. 2 and 3a). During winter and postmonsoon, air massesare from west and the wind speeds are lower (Table 1); the tra-jectories and winds are more local during postmonsoon than inwinter. Therefore, in these seasons fine mode aerosols emitted bythe local anthropogenic activities such as fossil fuel and biomasscombustionwill dominate. Aerosols advected from agriculture fieldwaste burning emissions in the fine mode (Fig. 2) will alsocontribute to the aerosol content over the IGP during these seasons.These results show that during the year the IGP is influenced byaerosol emissions in the fine mode from coal fire plants, vehicles,industries, biomass and domestic biofuel burning, and transport ofmineral dust and sea salt in coarse mode (Fig. 3). Therefore, it isimportant to examine and quantify whether fine and coarse modeaerosol population remain the same throughout the year, or aero-sols in a particular mode decrease (increase) to compensate for the
increase (decrease) in the other mode. This is an important infor-mation as anthropogenic aerosols, which contribute about 20e40%to the global AOD, are smaller in size and more absorbing thannatural aerosols (Myhre et al., 2009).
The FMF value can vary from 0 (single coarse mode aerosol) to 1(single fine mode aerosol), and provides quantitative informationon the nature of the aerosol size distribution. Seasonal mean FMFfor Kanpur (Gandhi College) are: 0.84 ± 0.12 (0.89 ± 0.08) ewinter,0.42 ± 0.07 (0.55 ± 0.07) e premonsoon, 0.49 ± 0.14 (0.57 ± 0.12) emonsoon and 0.77 ± 0.15 (0.84 ± 0.08) e postmonsoon. Over boththe locations the highest value of FMF is observed during Novem-bereJanuary when fine mode aerosols dominate the IGP (Fig. 3b).This is due to (i) the influence of high anthropogenic emissions overthe entire IGP during winter (Singh et al., 2004; Di Girolamo et al.,2004; Prasad et al., 2006; Eck et al., 2010; Dey and Di Girolamo,2010; Giles et al., 2011), (ii) the trapping of aerosols which gettransported fromwest to east due to northwesterly winds becauseof a lower boundary layer height (Dey and Di Girolamo, 2010) and(iii) the intense crop residue burning (Badarinath et al., 2009). FMFis minimum during AprileJune when coarse mode aerosols areabundant in the atmosphere (mean FMF values are 0.36 in Kanpurand 0.48 in Gandhi College (Fig. 3b) due to increase in the con-centration of dust particles (Fig. 2) (Eck et al., 2010; Giles et al.,2011).
During the entire study period and for all the months a is foundto be higher over Gandhi College (varies between 0.64 and 1.46,annual mean 1.13 ± 0.27) than Kanpur (in the range of 0.41e1.37,annual mean 0.98 ± 0.32). This is in good agreement with featuresseen in FMF. An increase in the value of a occurs either due to in-crease in fine mode aerosol concentration or decrease in concen-tration of coarse mode aerosols in the atmosphere. However,comparatively higher FMF over Gandhi College than Kanpurconfirm that fine mode aerosol concentration remains higher overGandhi College. This could be attributed to the transport of finemode pollutants downwind, and higher amount of local biomass/biofuel burning (Badarinath et al., 2009; Dey and Di Girolamo,2010), as it is a rural location. Similar monthly variation in a witha maximum during OctobereFebruary and a minimum duringAprileJune has been earlier reported over Kanpur (Eck et al., 2010).
b is found to exhibit significant variation (Fig. 3d), similar to thevariation in AOD (Fig. 3a), indicating changing columnar aerosolloading during different months. Over both the locations a is higherwhile b is lower during winter and postmonsoon indicating higherfine mode aerosol concentration which is a characteristic feature ofthe locations in IGP (Singh et al., 2004; Dey et al., 2004; Tripathiet al., 2005; Eck et al., 2010). The dense population in this regionis associated with large sources of aerosols (due to fossil fuel con-sumption and biofuels used for domestic purposes) which producehigher fine mode aerosols (Fig. 6, Dey and Di Girolamo, 2010).Duringmonsoon a increases while b decreases because of relativelylower AOD values (Fig. 3a).
In summary, AODs are more or less similar in both the locations,however FMF and a are higher over Gandhi College confirming thedominance of fine mode aerosols throughout the year in GandhiCollege. It should be noted that Kanpur is also affected by pollutantsthat are transported from Delhi and western Uttar Pradesh (Fig. 1),yet it has lower FMF when compared to Gandhi College. It is,therefore, worth investigating whether it is the local dust emissionsor the biomass burning emissions that are more at the rural GandhiCollege that give rise to higher FMF than the urban Kanpur. Thisclassification becomes important over the IGP where the biomassand biofuel sources co-exist in close vicinity of fossil fuel burningsources. This aspect is examined by utilizing the MODIS cloudcorrected fire count version 5 monthly data available at 1� �1�lat-lon resolution corresponding to Kanpur and Gandhi College. It is
0
20
40
60
80
MO
DIS
Fir
e C
ount
KanpurGandhi College
2006 2007 2008 2009 2010
Fig. 4. Monthly variation of cloud corrected MODIS fire count over Kanpur and GandhiCollege during 2006e2010.
Jan Feb Mar Apr May Jun Jul Aug Sep Oct Nov Dec0
0.5
1
1.5
2
α (0
.44-
0.87
μm
)
Kanpur
Gandhi College
Jan Feb Mar Apr May Jun Jul Aug Sep Oct Nov Dec0
0.5
1
FMF
(0.5
μm
)
Jan Feb Mar Apr May Jun Jul Aug Sep Oct Nov Dec0
0.5
1
1.5
2
AO
D (
0.5
μm)
Jan Feb Mar Apr May Jun Jul Aug Sep Oct Nov Dec
Months
0
0.5
1
β (0
.44-
0.87
μm
)
(c)
(d)
(b)
(a)
Fig. 3. Monthly mean and ±1s standard deviation in (a) aerosol optical depth (AOD), (b) fine mode fraction (FMF), and Ångstr€om coefficients (c) a and (d) b during 2006e2010 overKanpur and Gandhi College.
S. Kedia et al. / Atmospheric Environment 98 (2014) 607e619612
clear that the fire count is higher over Gandhi College than Kanpurduring the year (Fig. 4). Fire counts exhibit large inter-annual var-iations over both the locations, however, the fire count is higherduring premonsoon and peaks in April (Fig. 4, Table 3). The higherMODIS fire count is consistent with the spring time agriculturalwaste/residue burning over the IGP; the fire counts are significantlyhigher over Gandhi College confirming the dominance of localbiomass burning activities. Seasonal mean fire count over Kanpur(Gandhi College) is: 1 ± 1 (2 ± 2) e winter, 7 ± 6 (19 ± 22) e pre-monsoon, 2 ± 3 (5 ± 4) e monsoon and 2 ± 2 (0 ± 0) e post-monsoon. During premonsoon the fire count over Gandhi College isa factor of three higher than Kanpur, and the standard deviation ishigher than the mean value corroborating the large inter-annualvariability in fire count (Fig. 4). Fire counts are also higher overthe IGP during postmonsoon (OctobereNovember) due to theburning of rice crop residues (Badarinath et al., 2009) and theresultant transport of the sub-micron size aerosols. However, thereare fire counts only over Kanpur and not over Gandhi College(Table 4). The absence of fire counts over Gandhi College during
postmonsoon indicates the spatial limit of long range transport ofbiomass burning emission produced aerosols over the IGP; thisoccurs because the winds are more local andwind speeds are lowerduring postmonsoon. This aspect is further highlighted in the AOD,
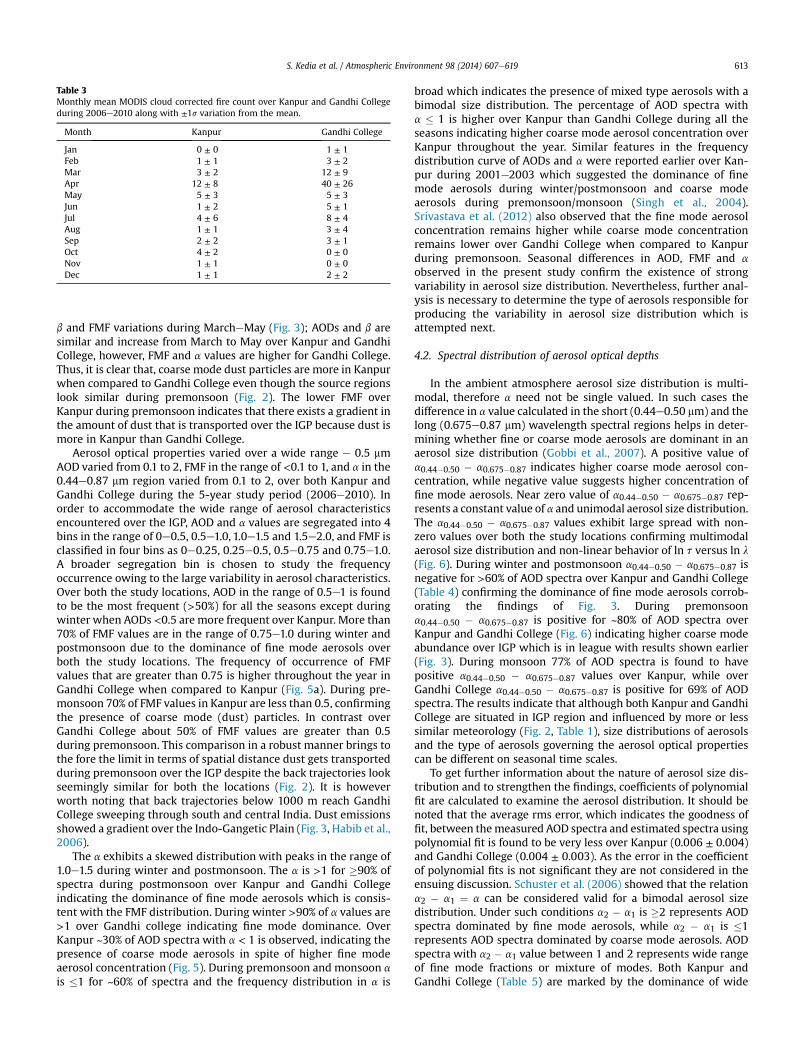
Table 3Monthly mean MODIS cloud corrected fire count over Kanpur and Gandhi Collegeduring 2006e2010 along with ±1s variation from the mean.
Month Kanpur Gandhi College
Jan 0 ± 0 1 ± 1Feb 1 ± 1 3 ± 2Mar 3 ± 2 12 ± 9Apr 12 ± 8 40 ± 26May 5 ± 3 5 ± 3Jun 1 ± 2 5 ± 1Jul 4 ± 6 8 ± 4Aug 1 ± 1 3 ± 4Sep 2 ± 2 3 ± 1Oct 4 ± 2 0 ± 0Nov 1 ± 1 0 ± 0Dec 1 ± 1 2 ± 2
S. Kedia et al. / Atmospheric Environment 98 (2014) 607e619 613
b and FMF variations during MarcheMay (Fig. 3); AODs and b aresimilar and increase from March to May over Kanpur and GandhiCollege, however, FMF and a values are higher for Gandhi College.Thus, it is clear that, coarse mode dust particles are more in Kanpurwhen compared to Gandhi College even though the source regionslook similar during premonsoon (Fig. 2). The lower FMF overKanpur during premonsoon indicates that there exists a gradient inthe amount of dust that is transported over the IGP because dust ismore in Kanpur than Gandhi College.
Aerosol optical properties varied over a wide range e 0.5 mmAOD varied from 0.1 to 2, FMF in the range of <0.1 to 1, and a in the0.44e0.87 mm region varied from 0.1 to 2, over both Kanpur andGandhi College during the 5-year study period (2006e2010). Inorder to accommodate the wide range of aerosol characteristicsencountered over the IGP, AOD and a values are segregated into 4bins in the range of 0e0.5, 0.5e1.0, 1.0e1.5 and 1.5e2.0, and FMF isclassified in four bins as 0e0.25, 0.25e0.5, 0.5e0.75 and 0.75e1.0.A broader segregation bin is chosen to study the frequencyoccurrence owing to the large variability in aerosol characteristics.Over both the study locations, AOD in the range of 0.5e1 is foundto be the most frequent (>50%) for all the seasons except duringwinter when AODs <0.5 are more frequent over Kanpur. More than70% of FMF values are in the range of 0.75e1.0 during winter andpostmonsoon due to the dominance of fine mode aerosols overboth the study locations. The frequency of occurrence of FMFvalues that are greater than 0.75 is higher throughout the year inGandhi College when compared to Kanpur (Fig. 5a). During pre-monsoon 70% of FMF values in Kanpur are less than 0.5, confirmingthe presence of coarse mode (dust) particles. In contrast overGandhi College about 50% of FMF values are greater than 0.5during premonsoon. This comparison in a robust manner brings tothe fore the limit in terms of spatial distance dust gets transportedduring premonsoon over the IGP despite the back trajectories lookseemingly similar for both the locations (Fig. 2). It is howeverworth noting that back trajectories below 1000 m reach GandhiCollege sweeping through south and central India. Dust emissionsshowed a gradient over the Indo-Gangetic Plain (Fig. 3, Habib et al.,2006).
The a exhibits a skewed distribution with peaks in the range of1.0e1.5 during winter and postmonsoon. The a is >1 for �90% ofspectra during postmonsoon over Kanpur and Gandhi Collegeindicating the dominance of fine mode aerosols which is consis-tent with the FMF distribution. During winter >90% of a values are>1 over Gandhi college indicating fine mode dominance. OverKanpur ~30% of AOD spectra with a < 1 is observed, indicating thepresence of coarse mode aerosols in spite of higher fine modeaerosol concentration (Fig. 5). During premonsoon and monsoon a
is �1 for ~60% of spectra and the frequency distribution in a is
broad which indicates the presence of mixed type aerosols with abimodal size distribution. The percentage of AOD spectra witha � 1 is higher over Kanpur than Gandhi College during all theseasons indicating higher coarse mode aerosol concentration overKanpur throughout the year. Similar features in the frequencydistribution curve of AODs and a were reported earlier over Kan-pur during 2001e2003 which suggested the dominance of finemode aerosols during winter/postmonsoon and coarse modeaerosols during premonsoon/monsoon (Singh et al., 2004).Srivastava et al. (2012) also observed that the fine mode aerosolconcentration remains higher while coarse mode concentrationremains lower over Gandhi College when compared to Kanpurduring premonsoon. Seasonal differences in AOD, FMF and a
observed in the present study confirm the existence of strongvariability in aerosol size distribution. Nevertheless, further anal-ysis is necessary to determine the type of aerosols responsible forproducing the variability in aerosol size distribution which isattempted next.
4.2. Spectral distribution of aerosol optical depths
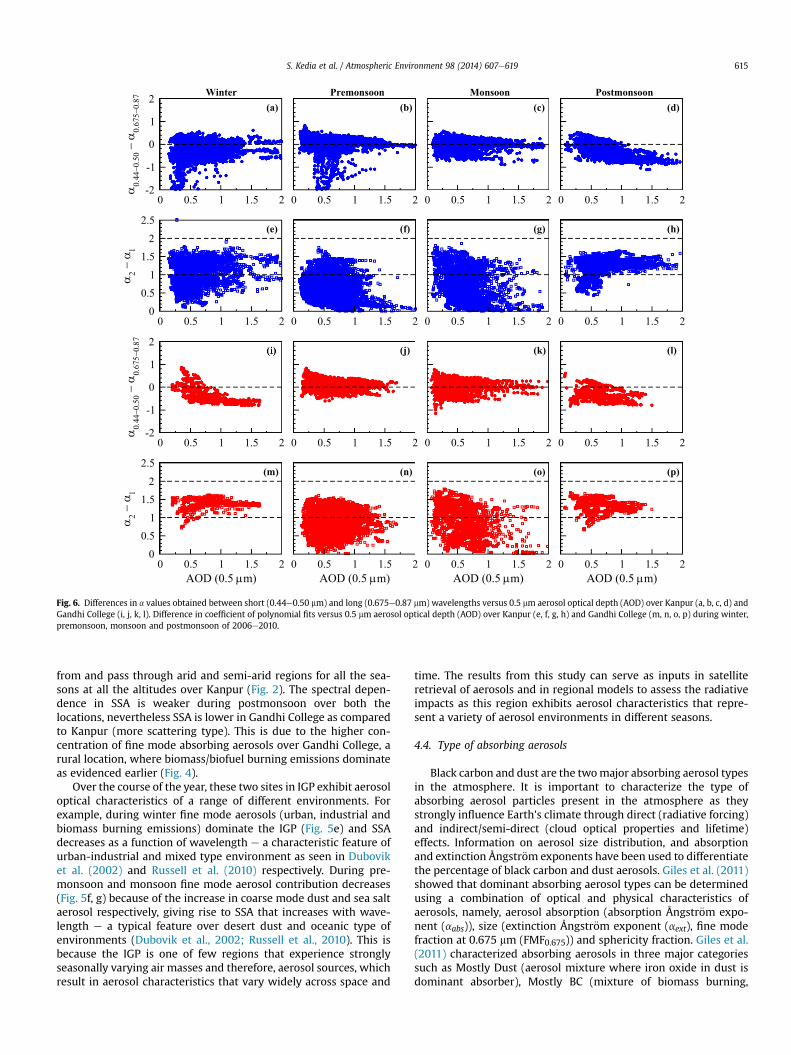
In the ambient atmosphere aerosol size distribution is multi-modal, therefore a need not be single valued. In such cases thedifference in a value calculated in the short (0.44e0.50 mm) and thelong (0.675e0.87 mm) wavelength spectral regions helps in deter-mining whether fine or coarse mode aerosols are dominant in anaerosol size distribution (Gobbi et al., 2007). A positive value ofa0.44�0.50 � a0.675�0.87 indicates higher coarse mode aerosol con-centration, while negative value suggests higher concentration offine mode aerosols. Near zero value of a0.44�0.50 � a0.675�0.87 rep-resents a constant value of a and unimodal aerosol size distribution.The a0.44�0.50 � a0.675�0.87 values exhibit large spread with non-zero values over both the study locations confirming multimodalaerosol size distribution and non-linear behavior of ln t versus ln l
(Fig. 6). During winter and postmonsoon a0.44�0.50 � a0.675�0.87 isnegative for >60% of AOD spectra over Kanpur and Gandhi College(Table 4) confirming the dominance of fine mode aerosols corrob-orating the findings of Fig. 3. During premonsoona0.44�0.50 � a0.675�0.87 is positive for ~80% of AOD spectra overKanpur and Gandhi College (Fig. 6) indicating higher coarse modeabundance over IGP which is in league with results shown earlier(Fig. 3). During monsoon 77% of AOD spectra is found to havepositive a0.44�0.50 � a0.675�0.87 values over Kanpur, while overGandhi College a0.44�0.50 � a0.675�0.87 is positive for 69% of AODspectra. The results indicate that although both Kanpur and GandhiCollege are situated in IGP region and influenced by more or lesssimilar meteorology (Fig. 2, Table 1), size distributions of aerosolsand the type of aerosols governing the aerosol optical propertiescan be different on seasonal time scales.
To get further information about the nature of aerosol size dis-tribution and to strengthen the findings, coefficients of polynomialfit are calculated to examine the aerosol distribution. It should benoted that the average rms error, which indicates the goodness offit, between themeasured AOD spectra and estimated spectra usingpolynomial fit is found to be very less over Kanpur (0.006 ± 0.004)and Gandhi College (0.004 ± 0.003). As the error in the coefficientof polynomial fits is not significant they are not considered in theensuing discussion. Schuster et al. (2006) showed that the relationa2 � a1 ¼ a can be considered valid for a bimodal aerosol sizedistribution. Under such conditions a2 � a1 is �2 represents AODspectra dominated by fine mode aerosols, while a2 � a1 is �1represents AOD spectra dominated by coarse mode aerosols. AODspectra with a2 � a1 value between 1 and 2 represents wide rangeof fine mode fractions or mixture of modes. Both Kanpur andGandhi College (Table 5) are marked by the dominance of wide
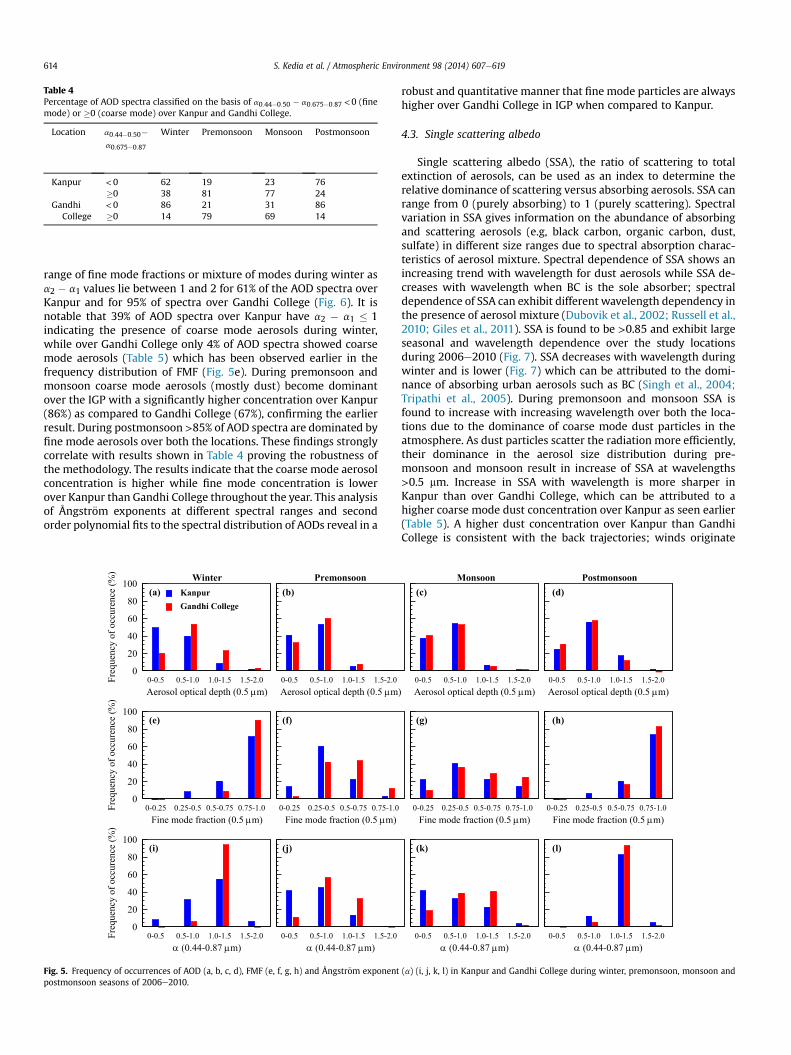
Table 4Percentage of AOD spectra classified on the basis of a0:44�0:50 � a0:675�0:87 <0 (finemode) or �0 (coarse mode) over Kanpur and Gandhi College.
Location a0:44�0:50�a0:675�0:87
Winter Premonsoon Monsoon Postmonsoon
Kanpur <0 62 19 23 76�0 38 81 77 24
GandhiCollege
<0 86 21 31 86�0 14 79 69 14
S. Kedia et al. / Atmospheric Environment 98 (2014) 607e619614
range of fine mode fractions or mixture of modes during winter asa2 � a1 values lie between 1 and 2 for 61% of the AOD spectra overKanpur and for 95% of spectra over Gandhi College (Fig. 6). It isnotable that 39% of AOD spectra over Kanpur have a2 � a1 � 1indicating the presence of coarse mode aerosols during winter,while over Gandhi College only 4% of AOD spectra showed coarsemode aerosols (Table 5) which has been observed earlier in thefrequency distribution of FMF (Fig. 5e). During premonsoon andmonsoon coarse mode aerosols (mostly dust) become dominantover the IGP with a significantly higher concentration over Kanpur(86%) as compared to Gandhi College (67%), confirming the earlierresult. During postmonsoon >85% of AOD spectra are dominated byfine mode aerosols over both the locations. These findings stronglycorrelate with results shown in Table 4 proving the robustness ofthe methodology. The results indicate that the coarse mode aerosolconcentration is higher while fine mode concentration is lowerover Kanpur than Gandhi College throughout the year. This analysisof Ångstr€om exponents at different spectral ranges and secondorder polynomial fits to the spectral distribution of AODs reveal in a
0-0.5 0.5-1.0 1.0-1.5 1.5-2.0Aerosol optical depth (0.5 μm
0-0.5 0.5-1.0 1.0-1.5 1.5-2.0α (0.44-0.87 μm)
0-0.5 0.5-1.0 1.0-1.5 1.5-2.0Aerosol optical depth (0.5 μm)
0
20
40
60
80
100
Freq
uenc
y of
occ
uren
ce (%
)
KanpurGandhi College
0-0.5 0.5-1.0 1.0-1.5 1.5-2.0α (0.44-0.87 μm)
0
20
40
60
80
100
Freq
uenc
y of
occ
uren
ce (%
)
0-0.25 0.25-0.5 0.5-0.75 0.75-1.0Fine mode fraction (0.5 μm)
0
20
40
60
80
100
Freq
uenc
y of
occ
uren
ce (%
)
0-0.25 0.25-0.5 0.5-0.75 0.75-1.0Fine mode fraction (0.5 μm)
Winter Premonsoon(a)
(f)
(b)
(e)
)j()i(
Fig. 5. Frequency of occurrences of AOD (a, b, c, d), FMF (e, f, g, h) and Ångstr€om exponentpostmonsoon seasons of 2006e2010.
robust and quantitative manner that fine mode particles are alwayshigher over Gandhi College in IGP when compared to Kanpur.
4.3. Single scattering albedo
Single scattering albedo (SSA), the ratio of scattering to totalextinction of aerosols, can be used as an index to determine therelative dominance of scattering versus absorbing aerosols. SSA canrange from 0 (purely absorbing) to 1 (purely scattering). Spectralvariation in SSA gives information on the abundance of absorbingand scattering aerosols (e.g, black carbon, organic carbon, dust,sulfate) in different size ranges due to spectral absorption charac-teristics of aerosol mixture. Spectral dependence of SSA shows anincreasing trend with wavelength for dust aerosols while SSA de-creases with wavelength when BC is the sole absorber; spectraldependence of SSA can exhibit different wavelength dependency inthe presence of aerosol mixture (Dubovik et al., 2002; Russell et al.,2010; Giles et al., 2011). SSA is found to be >0.85 and exhibit largeseasonal and wavelength dependence over the study locationsduring 2006e2010 (Fig. 7). SSA decreases with wavelength duringwinter and is lower (Fig. 7) which can be attributed to the domi-nance of absorbing urban aerosols such as BC (Singh et al., 2004;Tripathi et al., 2005). During premonsoon and monsoon SSA isfound to increase with increasing wavelength over both the loca-tions due to the dominance of coarse mode dust particles in theatmosphere. As dust particles scatter the radiation more efficiently,their dominance in the aerosol size distribution during pre-monsoon and monsoon result in increase of SSA at wavelengths>0.5 mm. Increase in SSA with wavelength is more sharper inKanpur than over Gandhi College, which can be attributed to ahigher coarse mode dust concentration over Kanpur as seen earlier(Table 5). A higher dust concentration over Kanpur than GandhiCollege is consistent with the back trajectories; winds originate
)0-0.5 0.5-1.0 1.0-1.5 1.5-2.0Aerosol optical depth (0.5 μm)
0-0.5 0.5-1.0 1.0-1.5 1.5-2.0α (0.44-0.87 μm)
0-0.5 0.5-1.0 1.0-1.5 1.5-2.0Aerosol optical depth (0.5 μm)
0-0.5 0.5-1.0 1.0-1.5 1.5-2.0α (0.44-0.87 μm)
0-0.25 0.25-0.5 0.5-0.75 0.75-1.0Fine mode fraction (0.5 μm)
0-0.25 0.25-0.5 0.5-0.75 0.75-1.0Fine mode fraction (0.5 μm)
Monsoon Postmonsoon)d()c(
(h)(g)
)l()k(
(a) (i, j, k, l) in Kanpur and Gandhi College during winter, premonsoon, monsoon and
0 0.5 1 1.5 2 0 0.5 1 1.5 2
0 0.5 1 1.5 2 0 0.5 1 1.5 2
0 0.5 1 1.5 2
0 0.5 1 1.5 2
0 0.5 1 1.5 2AOD (0.5 μm)
0 0.5 1 1.5 20 0.5 1 1.5 20
0.51
1.52
2.5
α2 −
α1
0 0.5 1 1.5 2-2
-1
0
1
2
α0.
44−0
.50 −
α0.
675−
0.87
0 0.5 1 1.5 2-2
-1
0
1
2
α0.
44−0
.50 −
α0.
675−
0.87
0 0.5 1 1.5 2 0 0.5 1 1.5 2
0 0.5 1 1.5 2AOD (0.5 μm)
0
0.51
1.52
2.5
α2 −
α1
0 0.5 1 1.5 2AOD (0.5 μm)
0 0.5 1 1.5 2AOD (0.5 μm)
Winter Premonsoon Monsoon Postmonsoon(a) )d()c(
(h)(g)(f)
(b)
(e)
)n()m(
)l()k()j(
(p)(o)
Fig. 6. Differences in a values obtained between short (0.44e0.50 mm) and long (0.675e0.87 mm) wavelengths versus 0.5 mm aerosol optical depth (AOD) over Kanpur (a, b, c, d) andGandhi College (i, j, k, l). Difference in coefficient of polynomial fits versus 0.5 mm aerosol optical depth (AOD) over Kanpur (e, f, g, h) and Gandhi College (m, n, o, p) during winter,premonsoon, monsoon and postmonsoon of 2006e2010.
S. Kedia et al. / Atmospheric Environment 98 (2014) 607e619 615
from and pass through arid and semi-arid regions for all the sea-sons at all the altitudes over Kanpur (Fig. 2). The spectral depen-dence in SSA is weaker during postmonsoon over both thelocations, nevertheless SSA is lower in Gandhi College as comparedto Kanpur (more scattering type). This is due to the higher con-centration of fine mode absorbing aerosols over Gandhi College, arural location, where biomass/biofuel burning emissions dominateas evidenced earlier (Fig. 4).
Over the course of the year, these two sites in IGP exhibit aerosoloptical characteristics of a range of different environments. Forexample, during winter fine mode aerosols (urban, industrial andbiomass burning emissions) dominate the IGP (Fig. 5e) and SSAdecreases as a function of wavelength e a characteristic feature ofurban-industrial and mixed type environment as seen in Duboviket al. (2002) and Russell et al. (2010) respectively. During pre-monsoon and monsoon fine mode aerosol contribution decreases(Fig. 5f, g) because of the increase in coarse mode dust and sea saltaerosol respectively, giving rise to SSA that increases with wave-length e a typical feature over desert dust and oceanic type ofenvironments (Dubovik et al., 2002; Russell et al., 2010). This isbecause the IGP is one of few regions that experience stronglyseasonally varying air masses and therefore, aerosol sources, whichresult in aerosol characteristics that vary widely across space and
time. The results from this study can serve as inputs in satelliteretrieval of aerosols and in regional models to assess the radiativeimpacts as this region exhibits aerosol characteristics that repre-sent a variety of aerosol environments in different seasons.
4.4. Type of absorbing aerosols
Black carbon and dust are the twomajor absorbing aerosol typesin the atmosphere. It is important to characterize the type ofabsorbing aerosol particles present in the atmosphere as theystrongly influence Earth's climate through direct (radiative forcing)and indirect/semi-direct (cloud optical properties and lifetime)effects. Information on aerosol size distribution, and absorptionand extinction Ångstr€om exponents have been used to differentiatethe percentage of black carbon and dust aerosols. Giles et al. (2011)showed that dominant absorbing aerosol types can be determinedusing a combination of optical and physical characteristics ofaerosols, namely, aerosol absorption (absorption Ångstr€om expo-nent (aabs)), size (extinction Ångstr€om exponent (aext), fine modefraction at 0.675 mm (FMF0.675)) and sphericity fraction. Giles et al.(2011) characterized absorbing aerosols in three major categoriessuch as Mostly Dust (aerosol mixture where iron oxide in dust isdominant absorber), Mostly BC (mixture of biomass burning,
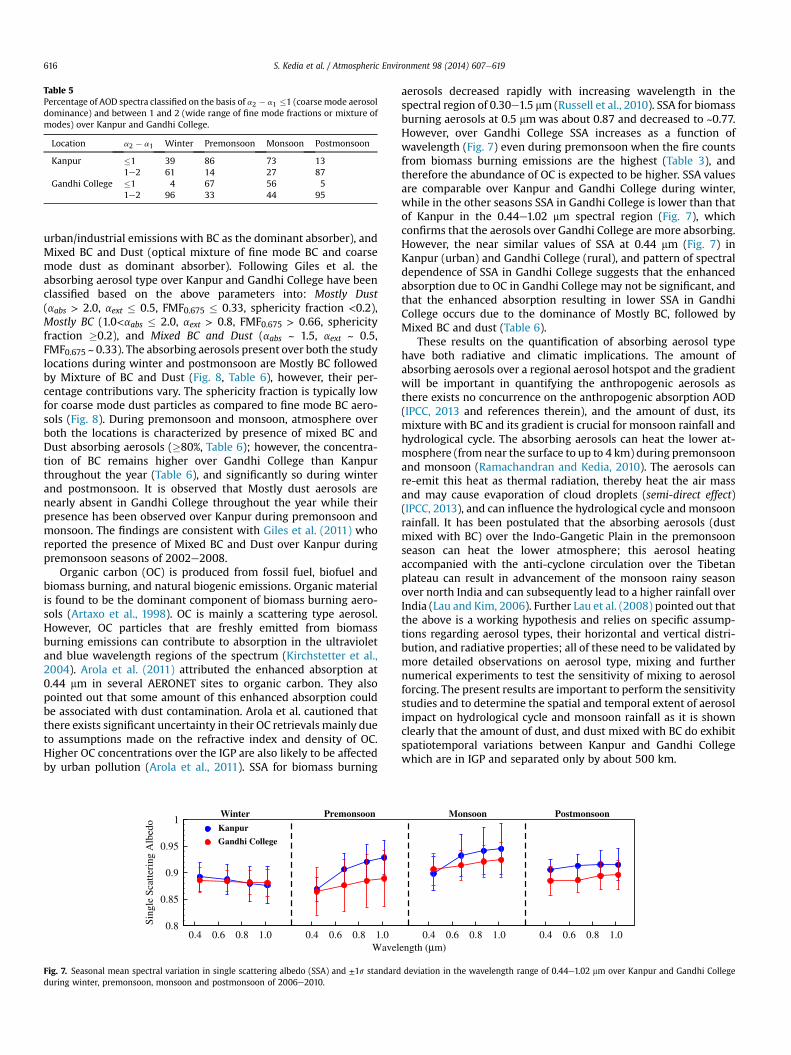
Table 5Percentage of AOD spectra classified on the basis of a2 � a1 �1 (coarse mode aerosoldominance) and between 1 and 2 (wide range of fine mode fractions or mixture ofmodes) over Kanpur and Gandhi College.
Location a2 � a1 Winter Premonsoon Monsoon Postmonsoon
Kanpur �1 39 86 73 131e2 61 14 27 87
Gandhi College �1 4 67 56 51e2 96 33 44 95
S. Kedia et al. / Atmospheric Environment 98 (2014) 607e619616
urban/industrial emissions with BC as the dominant absorber), andMixed BC and Dust (optical mixture of fine mode BC and coarsemode dust as dominant absorber). Following Giles et al. theabsorbing aerosol type over Kanpur and Gandhi College have beenclassified based on the above parameters into: Mostly Dust(aabs > 2.0, aext � 0.5, FMF0.675 � 0.33, sphericity fraction <0.2),Mostly BC (1.0<aabs � 2.0, aext > 0.8, FMF0.675 > 0.66, sphericityfraction �0.2), and Mixed BC and Dust (aabs ~ 1.5, aext ~ 0.5,FMF0.675 ~ 0.33). The absorbing aerosols present over both the studylocations during winter and postmonsoon are Mostly BC followedby Mixture of BC and Dust (Fig. 8, Table 6), however, their per-centage contributions vary. The sphericity fraction is typically lowfor coarse mode dust particles as compared to fine mode BC aero-sols (Fig. 8). During premonsoon and monsoon, atmosphere overboth the locations is characterized by presence of mixed BC andDust absorbing aerosols (�80%, Table 6); however, the concentra-tion of BC remains higher over Gandhi College than Kanpurthroughout the year (Table 6), and significantly so during winterand postmonsoon. It is observed that Mostly dust aerosols arenearly absent in Gandhi College throughout the year while theirpresence has been observed over Kanpur during premonsoon andmonsoon. The findings are consistent with Giles et al. (2011) whoreported the presence of Mixed BC and Dust over Kanpur duringpremonsoon seasons of 2002e2008.
Organic carbon (OC) is produced from fossil fuel, biofuel andbiomass burning, and natural biogenic emissions. Organic materialis found to be the dominant component of biomass burning aero-sols (Artaxo et al., 1998). OC is mainly a scattering type aerosol.However, OC particles that are freshly emitted from biomassburning emissions can contribute to absorption in the ultravioletand blue wavelength regions of the spectrum (Kirchstetter et al.,2004). Arola et al. (2011) attributed the enhanced absorption at0.44 mm in several AERONET sites to organic carbon. They alsopointed out that some amount of this enhanced absorption couldbe associated with dust contamination. Arola et al. cautioned thatthere exists significant uncertainty in their OC retrievals mainly dueto assumptions made on the refractive index and density of OC.Higher OC concentrations over the IGP are also likely to be affectedby urban pollution (Arola et al., 2011). SSA for biomass burning
0.4 0.6 0.8 1.0 0.4 0.6 0.8 1.0Wavel
0.8
0.85
0.9
0.95
1
Sing
le S
catte
ring
Alb
edo
Kanpur
Gandhi College
PremonsoonWinter
Fig. 7. Seasonal mean spectral variation in single scattering albedo (SSA) and ±1s standardduring winter, premonsoon, monsoon and postmonsoon of 2006e2010.
aerosols decreased rapidly with increasing wavelength in thespectral region of 0.30e1.5 mm (Russell et al., 2010). SSA for biomassburning aerosols at 0.5 mm was about 0.87 and decreased to ~0.77.However, over Gandhi College SSA increases as a function ofwavelength (Fig. 7) even during premonsoon when the fire countsfrom biomass burning emissions are the highest (Table 3), andtherefore the abundance of OC is expected to be higher. SSA valuesare comparable over Kanpur and Gandhi College during winter,while in the other seasons SSA in Gandhi College is lower than thatof Kanpur in the 0.44e1.02 mm spectral region (Fig. 7), whichconfirms that the aerosols over Gandhi College are more absorbing.However, the near similar values of SSA at 0.44 mm (Fig. 7) inKanpur (urban) and Gandhi College (rural), and pattern of spectraldependence of SSA in Gandhi College suggests that the enhancedabsorption due to OC in Gandhi College may not be significant, andthat the enhanced absorption resulting in lower SSA in GandhiCollege occurs due to the dominance of Mostly BC, followed byMixed BC and dust (Table 6).
These results on the quantification of absorbing aerosol typehave both radiative and climatic implications. The amount ofabsorbing aerosols over a regional aerosol hotspot and the gradientwill be important in quantifying the anthropogenic aerosols asthere exists no concurrence on the anthropogenic absorption AOD(IPCC, 2013 and references therein), and the amount of dust, itsmixture with BC and its gradient is crucial for monsoon rainfall andhydrological cycle. The absorbing aerosols can heat the lower at-mosphere (from near the surface to up to 4 km) during premonsoonand monsoon (Ramachandran and Kedia, 2010). The aerosols canre-emit this heat as thermal radiation, thereby heat the air massand may cause evaporation of cloud droplets (semi-direct effect)(IPCC, 2013), and can influence the hydrological cycle andmonsoonrainfall. It has been postulated that the absorbing aerosols (dustmixed with BC) over the Indo-Gangetic Plain in the premonsoonseason can heat the lower atmosphere; this aerosol heatingaccompanied with the anti-cyclone circulation over the Tibetanplateau can result in advancement of the monsoon rainy seasonover north India and can subsequently lead to a higher rainfall overIndia (Lau and Kim, 2006). Further Lau et al. (2008) pointed out thatthe above is a working hypothesis and relies on specific assump-tions regarding aerosol types, their horizontal and vertical distri-bution, and radiative properties; all of these need to be validated bymore detailed observations on aerosol type, mixing and furthernumerical experiments to test the sensitivity of mixing to aerosolforcing. The present results are important to perform the sensitivitystudies and to determine the spatial and temporal extent of aerosolimpact on hydrological cycle and monsoon rainfall as it is shownclearly that the amount of dust, and dust mixed with BC do exhibitspatiotemporal variations between Kanpur and Gandhi Collegewhich are in IGP and separated only by about 500 km.
0.4 0.6 0.8 1.00.4 0.6 0.8 1.0ength (μm)
Monsoon Postmonsoon
deviation in the wavelength range of 0.44e1.02 mm over Kanpur and Gandhi College
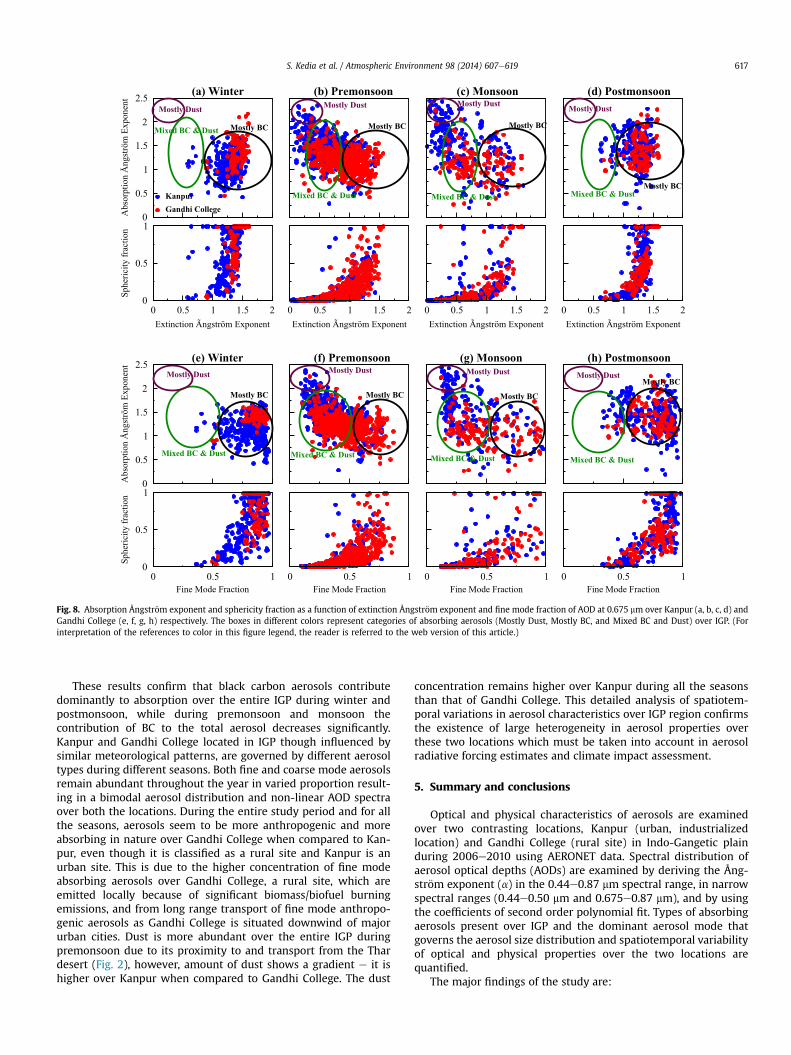
Fig. 8. Absorption Ångstr€om exponent and sphericity fraction as a function of extinction Ångstr€om exponent and fine mode fraction of AOD at 0.675 mm over Kanpur (a, b, c, d) andGandhi College (e, f, g, h) respectively. The boxes in different colors represent categories of absorbing aerosols (Mostly Dust, Mostly BC, and Mixed BC and Dust) over IGP. (Forinterpretation of the references to color in this figure legend, the reader is referred to the web version of this article.)
S. Kedia et al. / Atmospheric Environment 98 (2014) 607e619 617
These results confirm that black carbon aerosols contributedominantly to absorption over the entire IGP during winter andpostmonsoon, while during premonsoon and monsoon thecontribution of BC to the total aerosol decreases significantly.Kanpur and Gandhi College located in IGP though influenced bysimilar meteorological patterns, are governed by different aerosoltypes during different seasons. Both fine and coarse mode aerosolsremain abundant throughout the year in varied proportion result-ing in a bimodal aerosol distribution and non-linear AOD spectraover both the locations. During the entire study period and for allthe seasons, aerosols seem to be more anthropogenic and moreabsorbing in nature over Gandhi College when compared to Kan-pur, even though it is classified as a rural site and Kanpur is anurban site. This is due to the higher concentration of fine modeabsorbing aerosols over Gandhi College, a rural site, which areemitted locally because of significant biomass/biofuel burningemissions, and from long range transport of fine mode anthropo-genic aerosols as Gandhi College is situated downwind of majorurban cities. Dust is more abundant over the entire IGP duringpremonsoon due to its proximity to and transport from the Thardesert (Fig. 2), however, amount of dust shows a gradient e it ishigher over Kanpur when compared to Gandhi College. The dust
concentration remains higher over Kanpur during all the seasonsthan that of Gandhi College. This detailed analysis of spatiotem-poral variations in aerosol characteristics over IGP region confirmsthe existence of large heterogeneity in aerosol properties overthese two locations which must be taken into account in aerosolradiative forcing estimates and climate impact assessment.
5. Summary and conclusions
Optical and physical characteristics of aerosols are examinedover two contrasting locations, Kanpur (urban, industrializedlocation) and Gandhi College (rural site) in Indo-Gangetic plainduring 2006e2010 using AERONET data. Spectral distribution ofaerosol optical depths (AODs) are examined by deriving the Ång-str€om exponent (a) in the 0.44e0.87 mm spectral range, in narrowspectral ranges (0.44e0.50 mm and 0.675e0.87 mm), and by usingthe coefficients of second order polynomial fit. Types of absorbingaerosols present over IGP and the dominant aerosol mode thatgoverns the aerosol size distribution and spatiotemporal variabilityof optical and physical properties over the two locations arequantified.
The major findings of the study are:
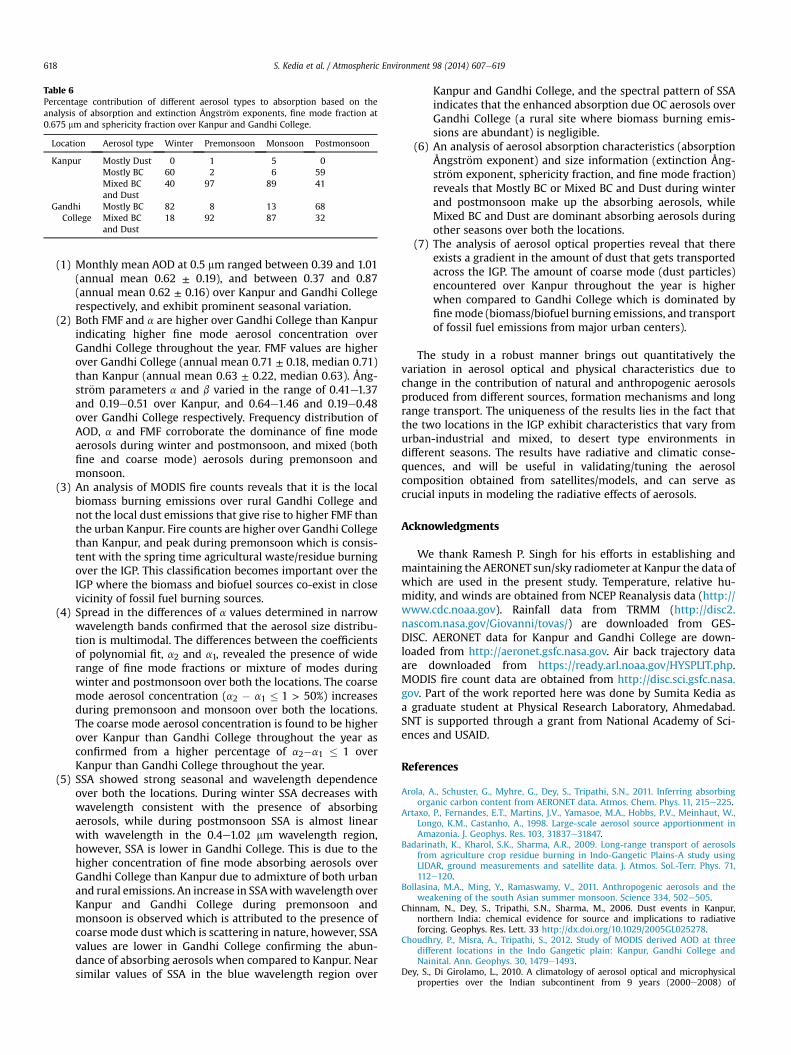
Table 6Percentage contribution of different aerosol types to absorption based on theanalysis of absorption and extinction Ångstr€om exponents, fine mode fraction at0.675 mm and sphericity fraction over Kanpur and Gandhi College.
Location Aerosol type Winter Premonsoon Monsoon Postmonsoon
Kanpur Mostly Dust 0 1 5 0Mostly BC 60 2 6 59Mixed BCand Dust
40 97 89 41
GandhiCollege
Mostly BC 82 8 13 68Mixed BCand Dust
18 92 87 32
S. Kedia et al. / Atmospheric Environment 98 (2014) 607e619618
(1) Monthly mean AOD at 0.5 mm ranged between 0.39 and 1.01(annual mean 0.62 ± 0.19), and between 0.37 and 0.87(annual mean 0.62 ± 0.16) over Kanpur and Gandhi Collegerespectively, and exhibit prominent seasonal variation.
(2) Both FMF and a are higher over Gandhi College than Kanpurindicating higher fine mode aerosol concentration overGandhi College throughout the year. FMF values are higherover Gandhi College (annual mean 0.71 ± 0.18, median 0.71)than Kanpur (annual mean 0.63 ± 0.22, median 0.63). Ång-str€om parameters a and b varied in the range of 0.41e1.37and 0.19e0.51 over Kanpur, and 0.64e1.46 and 0.19e0.48over Gandhi College respectively. Frequency distribution ofAOD, a and FMF corroborate the dominance of fine modeaerosols during winter and postmonsoon, and mixed (bothfine and coarse mode) aerosols during premonsoon andmonsoon.
(3) An analysis of MODIS fire counts reveals that it is the localbiomass burning emissions over rural Gandhi College andnot the local dust emissions that give rise to higher FMF thanthe urban Kanpur. Fire counts are higher over Gandhi Collegethan Kanpur, and peak during premonsoon which is consis-tent with the spring time agricultural waste/residue burningover the IGP. This classification becomes important over theIGP where the biomass and biofuel sources co-exist in closevicinity of fossil fuel burning sources.
(4) Spread in the differences of a values determined in narrowwavelength bands confirmed that the aerosol size distribu-tion is multimodal. The differences between the coefficientsof polynomial fit, a2 and a1, revealed the presence of widerange of fine mode fractions or mixture of modes duringwinter and postmonsoon over both the locations. The coarsemode aerosol concentration (a2 � a1 � 1 > 50%) increasesduring premonsoon and monsoon over both the locations.The coarse mode aerosol concentration is found to be higherover Kanpur than Gandhi College throughout the year asconfirmed from a higher percentage of a2�a1 � 1 overKanpur than Gandhi College throughout the year.
(5) SSA showed strong seasonal and wavelength dependenceover both the locations. During winter SSA decreases withwavelength consistent with the presence of absorbingaerosols, while during postmonsoon SSA is almost linearwith wavelength in the 0.4e1.02 mm wavelength region,however, SSA is lower in Gandhi College. This is due to thehigher concentration of fine mode absorbing aerosols overGandhi College than Kanpur due to admixture of both urbanand rural emissions. An increase in SSAwithwavelength overKanpur and Gandhi College during premonsoon andmonsoon is observed which is attributed to the presence ofcoarse mode dust which is scattering in nature, however, SSAvalues are lower in Gandhi College confirming the abun-dance of absorbing aerosols when compared to Kanpur. Nearsimilar values of SSA in the blue wavelength region over
Kanpur and Gandhi College, and the spectral pattern of SSAindicates that the enhanced absorption due OC aerosols overGandhi College (a rural site where biomass burning emis-sions are abundant) is negligible.
(6) An analysis of aerosol absorption characteristics (absorptionÅngstr€om exponent) and size information (extinction Ång-str€om exponent, sphericity fraction, and fine mode fraction)reveals that Mostly BC or Mixed BC and Dust during winterand postmonsoon make up the absorbing aerosols, whileMixed BC and Dust are dominant absorbing aerosols duringother seasons over both the locations.
(7) The analysis of aerosol optical properties reveal that thereexists a gradient in the amount of dust that gets transportedacross the IGP. The amount of coarse mode (dust particles)encountered over Kanpur throughout the year is higherwhen compared to Gandhi College which is dominated byfinemode (biomass/biofuel burning emissions, and transportof fossil fuel emissions from major urban centers).
The study in a robust manner brings out quantitatively thevariation in aerosol optical and physical characteristics due tochange in the contribution of natural and anthropogenic aerosolsproduced from different sources, formation mechanisms and longrange transport. The uniqueness of the results lies in the fact thatthe two locations in the IGP exhibit characteristics that vary fromurban-industrial and mixed, to desert type environments indifferent seasons. The results have radiative and climatic conse-quences, and will be useful in validating/tuning the aerosolcomposition obtained from satellites/models, and can serve ascrucial inputs in modeling the radiative effects of aerosols.
Acknowledgments
We thank Ramesh P. Singh for his efforts in establishing andmaintaining the AERONET sun/sky radiometer at Kanpur the data ofwhich are used in the present study. Temperature, relative hu-midity, and winds are obtained from NCEP Reanalysis data (http://www.cdc.noaa.gov). Rainfall data from TRMM (http://disc2.nascom.nasa.gov/Giovanni/tovas/) are downloaded from GES-DISC. AERONET data for Kanpur and Gandhi College are down-loaded from http://aeronet.gsfc.nasa.gov. Air back trajectory dataare downloaded from https://ready.arl.noaa.gov/HYSPLIT.php.MODIS fire count data are obtained from http://disc.sci.gsfc.nasa.gov. Part of the work reported here was done by Sumita Kedia asa graduate student at Physical Research Laboratory, Ahmedabad.SNT is supported through a grant from National Academy of Sci-ences and USAID.
References
Arola, A., Schuster, G., Myhre, G., Dey, S., Tripathi, S.N., 2011. Inferring absorbingorganic carbon content from AERONET data. Atmos. Chem. Phys. 11, 215e225.
Artaxo, P., Fernandes, E.T., Martins, J.V., Yamasoe, M.A., Hobbs, P.V., Meinhaut, W.,Longo, K.M., Castanho, A., 1998. Large-scale aerosol source apportionment inAmazonia. J. Geophys. Res. 103, 31837e31847.
Badarinath, K., Kharol, S.K., Sharma, A.R., 2009. Long-range transport of aerosolsfrom agriculture crop residue burning in Indo-Gangetic Plains-A study usingLIDAR, ground measurements and satellite data. J. Atmos. Sol.-Terr. Phys. 71,112e120.
Bollasina, M.A., Ming, Y., Ramaswamy, V., 2011. Anthropogenic aerosols and theweakening of the south Asian summer monsoon. Science 334, 502e505.
Chinnam, N., Dey, S., Tripathi, S.N., Sharma, M., 2006. Dust events in Kanpur,northern India: chemical evidence for source and implications to radiativeforcing. Geophys. Res. Lett. 33 http://dx.doi.org/10.1029/2005GL025278.
Choudhry, P., Misra, A., Tripathi, S., 2012. Study of MODIS derived AOD at threedifferent locations in the Indo Gangetic plain: Kanpur, Gandhi College andNainital. Ann. Geophys. 30, 1479e1493.
Dey, S., Di Girolamo, L., 2010. A climatology of aerosol optical and microphysicalproperties over the Indian subcontinent from 9 years (2000e2008) of
S. Kedia et al. / Atmospheric Environment 98 (2014) 607e619 619
Multiangle Imaging Spectroradiometer (MISR) data. J. Geophys. Res. 115 http://dx.doi.org/10.1029/2009JD013395.
Dey, S., Tripathi, S.N., Singh, R.P., Holben, B.N., 2004. Influence of dust storms on theaerosol optical properties over the Indo-Gangetic basin. J. Geophys. Res. 109http://dx.doi.org/10.1029/2004JD004924.
Di Girolamo, L., Bond, T.C., Bramer, D., Diner, D.J., Fettinger, F., Kahn, R.A.,Martonchik, J.V., Ramana, M.V., Ramanathan, V., Rasch, P.J., 2004. Analysis ofMulti-angle Imaging SpectroRadiometer (MISR) aerosol optical depths overgreater India during winter 2001e2004. Geophys. Res. Lett. 31 http://dx.doi.org/10.1029/2004GL021273.
Draxler, R.R., Hess, G.D., 1998. An overview of the HYSPLIT-4 modelling system fortrajectories, dispersion and deposition. Aust. Meteorol. Mag. 47, 295e308.
Dubovik, O., Holben, B., Eck, T.F., Smirnov, A., Kaufman, Y.J., King, M.D.,Tanr�e, D., Slutsker, I., 2002. Variability of absorption and optical propertiesof key aerosol types observed in worldwide locations. J. Atmos. Sci. 59,590e680.
Dubovik, O., Smirnov, A., Holben, B.N., King, M.D., Kaufman, Y.J., Eck, T.F., Schuster, I.,2000. Accuracy assessments aerosol optical properties retrieved of from AerosolRobotic Network (AERONET) Sun and sky radiance measurements. J. Geophys.Res. 105, 9791e9806.
Eck, T.F., Holben, B.N., Reid, J.S., Dubovik, O., Smirnov, A., O'Neill, N.T., Slutsker, I.,Kinne, S., 1999. Wavelength dependence of the optical depth of biomassburning, urban, and desert dust aerosols. J. Geophys. Res. 104 http://dx.doi.org/10.1029/1999JD900923.
Eck, T.F., Holben, B.N., Sinyuk, A., Pinker, R.T., Goloub, P., Chen, H., Chatenet, B., Li, Z.,Singh, R.P., Tripathi, S.N., Reid, J.S., Giles, D.M., Dubovik, O., O'Neill, N.T.,Smirnov, A., Wang, P., Xia, X., 2010. Climatological aspects of the optical prop-erties of fine/coarse mode aerosol mixtures. J. Geophys. Res. 115 http://dx.doi.org/10.1029/2010JD014002.
Eck, T.F., Holben, B.N., Reid, J.S., Giles, D.M., Rivas, M.A., Singh, R.P., Tripathi, S.N.,Bruegge, C.J., Platnick, S., Arnold, G.T., Krotkov, N.A., Carn, S.A., Sinyuk, A.,Dubovik, O., Arola, A., Schafer, J.S., Artaxo, P., Smirnov, A., Chen, H., Goloub, P.,2012. Fog- and cloud-induced aerosol modification observed by the AerosolRobotic Network (AERONET). J. Geophys. Res. 117 http://dx.doi.org/10.1029/2011JD016839.
Giles, D.M., Holben, B.N., Tripathi, S.N., Eck, T.F., Newcomb, W.W., Slutsker, I.,Dickerson, R.R., Thompson, A.M., Mattoo, S., Wang, S.H., Singh, R.P., Sinyuk, A.,Schafer, J.S., 2011. Aerosol properties over the Indo-Gangetic plain: a mesoscaleperspective from the TIGERZ experiment. J. Geophys. Res. 116 http://dx.doi.org/10.1029/2011JD015809.
Gobbi, G.P., Kaufman, Y.J., Koren, I., Eck, T.F., 2007. Classification of aerosol proper-ties derived from AERONET direct Sun data. Atmos. Chem. Phys. 7, 453e458.
Habib, G., Venkataraman, C., Chiapello, I., Ramachandran, S., Boucher, O.,Reddy, M.S., 2006. Seasonal and interannual variability in absorbing aerosolsover India derived from TOMS: relationship to regional meteorology andemissions. Atmos. Environ. 40, 1909e1921.
Holben, B.N., Eck, T.F., Slutsker, I., Tanr�e, D., Buis, J.P., Setzer, A., Vermote, E.,Reagan, J.A., Kaufman, Y.J., Nakajima, T., Lavenu, F., Jankowiak, I., Smirnov, A.,1998. AERONET e a federated instrument network and data archive for aerosolcharacterization. Remote Sens. Environ. 66, 1e16.
IPCC, 2013. Contribution of Working Group I to the Fifth Assessment Report of theIntergovernmental Panel on Climate Change. In: Stocker, T.F., Qin, D.,Plattner, G.-K., Tignor, M., Allen, S.K., Boschung, J., Nauels, A., Xia, Y., Bex, V.,Midgley, P.M. (Eds.), Summary for Policymakers in Climate Change 2013: thePhysical Science Basis. Cambridge University Press, Cambridge, United Kingdomand New York, NY, USA., 27 pp.
Jai Devi, J., Gupta, T., Tripathi, S.N., Ujinwal, K.K., 2009. Assessment of personalexposure to inhalable indoor and outdoor particulate matter for student resi-dents of an academic campus (IIT-Kanpur). Inhal. Toxicol. 21, 1208e1222.
Kaul, D.S., Gupta, T., Tripathi, S.N., Tare, V., Collett Jr., J.L., 2011. Secondary organicaerosol: a comparison between foggy and nonfoggy days. Environ. Sci. Technol.45, 7307e7313.
Komppula, M., Mielonen, T., Arola, A., Korhonen, K., Lihavainen, H., Hyv€arinen, A.P.,Baars, H., Engelmann, R., Althausen, D., Ansmann, A., Müller, D., Panwar, T.S.,Hooda, R.K., Sharma, V.P., Kerminen, V.M., Lehtinen, K.E.J., Viisanen, Y., 2012.One year of raman-lidar measurements in Gual Pahari EUCAARI site close toNew Delhi in India seasonal characteristics of the aerosol vertical structure.Atmos. Chem. Phys. 12, 4513e4524.
Kirchstetter, T.W., Novakov, T., Hobbs, P.V., 2004. Evidence that the spectraldependence of light absorption by aerosols is affected by organic carbon.J. Geophys. Res. 109 http://dx.doi.org/10.1029/2004JD004999.
Lau, K.M., Kim, K.M., 2006. Observational relationships between aerosol and Asianmonsoon rainfall, and circulation. Geophys. Res. Lett. 33 http://dx.doi.org/10.1029/2006GL027546.
Lau, K.M., Tsay, S.C., Hsu, C., Chin, M., Ramanathan, V., Wu, G.X., Li, Z., Sikka, R.,Holben, B., Lu, D., Chen, H., Tartari, G., Koudelova, P., Ma, Y., Huang, J.,Taniguchi, K., Zhang, R., 2008. The joint aerosolemonsoon experiment: a newchallenge for monsoon climate research. Bull. Am. Meteorol. Soc. 89, 369e383.
Myhre, G., Berglen, T.F., Johnsrud, M., Hoyle, C.R., Berntsen, T.K., Christopher, S.A.,Fahey, D.W., Isaksen, I.S.A., Jones, T.A., Kahn, R.A., Loeb, N., Quinn, P., Remer, L.,Schwarz, J.P., Yttri, K.E., 2009. Modelled radiative forcing of the direct aerosoleffect with multi-observation evaluation. Atmos. Chem. Phys. 9, 1365e1392.
Nicolae, D., Nemuc, A., Muller, D., Talianu, C., Vasilescu, J., Belegante, L., Kolgotin, A.,2013. Characterization of fresh and aged biomass burning events using multi-wavelength Raman lidar and mass spectrometry. J. Geophys. Res. 118,2956e2965. http://dx.doi.org/10.1002/jgrd.50324.
O'Neill, N.T., Eck, T.F., Smirnov, A., Holben, B.N., Thulasiraman, S., 2003. Spectraldiscrimination of coarse and fine mode optical depth. J. Geophys. Res. 108http://dx.doi.org/10.1029/2002JD002975.
Prasad, A.K., Singh, R.P., Kafatos, M., 2006. Influence of coal based thermal powerplants on aerosol optical properties in the Indo-Gangetic basin. Geophys. Res.Lett. 33 http://dx.doi.org/10.1029/2005GL023801.
Prasad, A.K., Singh, R.P., 2007. Comparison of MISR-MODIS aerosol optical depthover the Indo-Gangetic basin during the winter and summer seasons (2000-2005). Remote Sens. Environ. 107, 109e119.
Ramachandran, S., Rengarajan, R., Jayaraman, A., Sarin, M.M., Das, S.K., 2006.Aerosol radiative forcing during clear, hazy, and foggy conditions over a con-tinental polluted location in north India. J. Geophys. Res. 111 http://dx.doi.org/10.1029/2006JD007142.
Ramachandran, S., Kedia, S., 2010. Black carbon aerosols over an urban region:radiative forcing and climate impact. J. Geophys. Res. 115 http://dx.doi.org/10.1029/2009JD013560.
Ramachandran, S., Kedia, S., 2012. Radiative effects of aerosols over Indo-Gangeticplain: environmental (urban vs. rural) and seasonal variations. Environ. Sci.Pollut. Res. 19, 2159e2171.
Ramana, M.V., Ramanathan, V., Podgorny, I.A., 2004. The direct observations of largeaerosol radiative forcing in the Himalayan region. Geophys. Res. Lett. 31 http://dx.doi.org/10.1029/2003GL018824.
Rehman, I.H., Ahmed, T., Praveen, P.S., Kar, A., Ramanathan, V., 2011. Black carbonemissions from biomass and fossil fuels in rural india. Atmos. Chem. Phys. 11,7289e7299.
Russell, P.B., Bergstrom, R.W., Shinozuka, Y., Clarke, A.D., DeCarlo, P.F., Jimenez, J.L.,Livingston, J.M., Redemann, J., Dubovik, O., Strawa, A., 2010. AbsorptionAngstrom Exponent in AERONET and related data as an indicator of aerosolcomposition. Atmos. Chem. Phys. 10, 1155e1169.
Schuster, G.L., Dubovik, O., Holben, B.N., 2006. Angstrom exponent and bimodalaerosol size distributions. J. Geophys. Res. 111 http://dx.doi.org/10.1029/2005JD006328.
Singh, R.P., Dey, S., Tripathi, S.N., Tare, V., 2004. Variability of aerosol parametersover Kanpur, northern India. J. Geophys. Res. 109 http://dx.doi.org/10.1029/2004JD004966.
Srivastava, A., Tiwari, S., Devara, P., Bisht, D., Srivastava, M., Tripathi, S., Goloub, P.,Holben, B., 2011. Pre-monsoon aerosol characteristics over the Indo-GangeticBasin: implications to climatic impact. Ann. Geophys. 29, 789e804.
Srivastava, A., Tripathi, S., Dey, S., Kanawade, V., Tiwari, S., 2012. Inferring aerosoltypes over the Indo-Gangetic Basin from ground based sunphotometer mea-surements. Atmos. Res. 109e110, 64e75.
Tare, V., Tripathi, S.N., Chinnam, N., Srivastava, A.K., Dey, S., Manar, M.,Kanawade, V.P., Agarwal, A., Kishore, S., Lal, R.B., Sharma, M., 2006. Measure-ments of atmospheric parameters during Indian space research organizationGeosphere Biosphere Program land campaign ii at a typical location in theganga Basin: 2. Chemical properties. J. Geophys. Res. 111 http://dx.doi.org/10.1029/2006JD007279.
Tripathi, S.N., Dey, S., Tare, V., 2005. Aerosol black carbon radiative forcing at anindustrial city in northern India. Geophys. Res. Lett. 32 http://dx.doi.org/10.1029/2005GL022515.