Embed Size (px)
Citation preview
Quality Tools for Project Managers
PMI Honolulu ChapterJuly 18, 2007
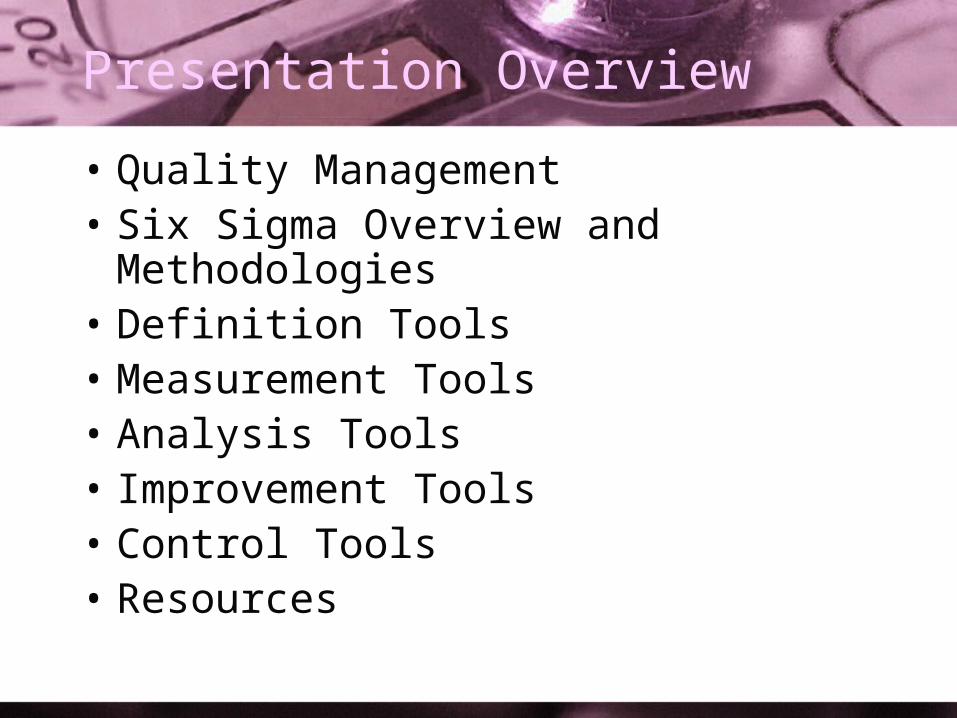
Presentation Overview
• Quality Management• Six Sigma Overview and Methodologies• Definition Tools• Measurement Tools• Analysis Tools• Improvement Tools• Control Tools• Resources
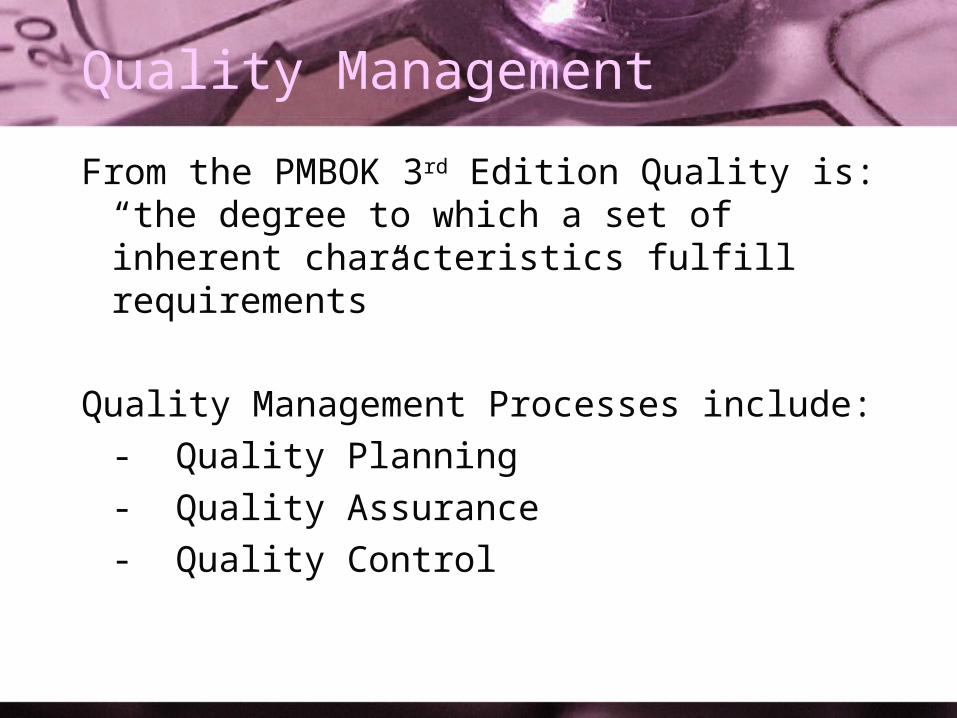
Quality Management
From the PMBOK 3rd Edition Quality is: “the degree to which a set of inherent characteristics fulfill requirements”
Quality Management Processes include:
- Quality Planning
- Quality Assurance
- Quality Control
Quality Management and PM
Quality Management and Project Management both recognize the importance of:
• Customer Satisfaction
• Prevention over Inspection
• Management Responsibility
• Continuous Improvement
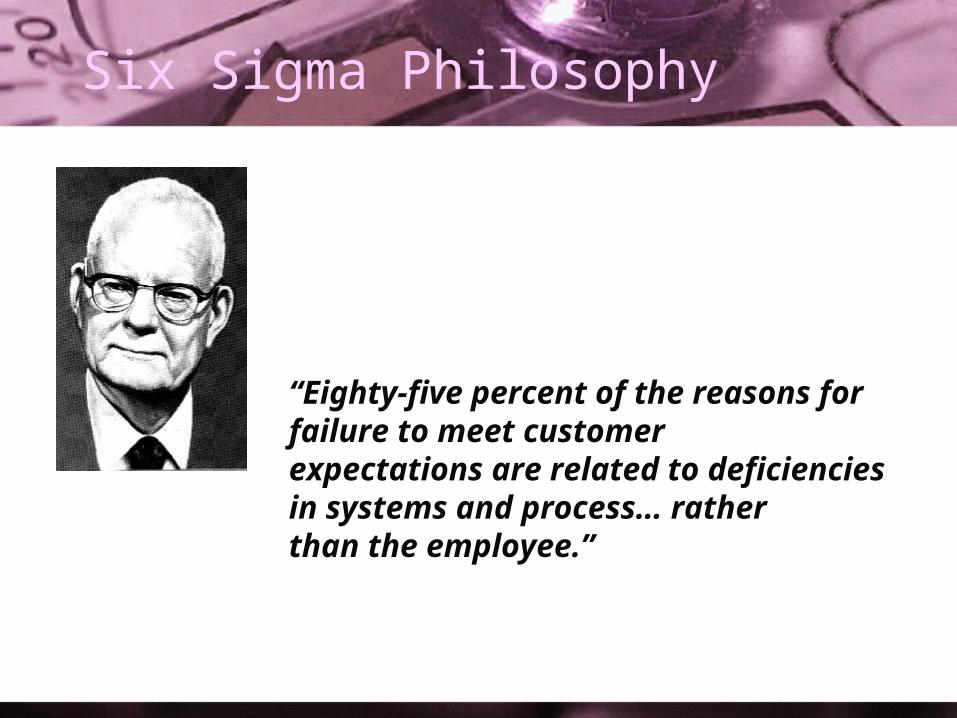
Six Sigma Philosophy
“Eighty-five percent of the reasons for failure to meet customer expectations are related to deficiencies in systems and process… rather than the employee.”
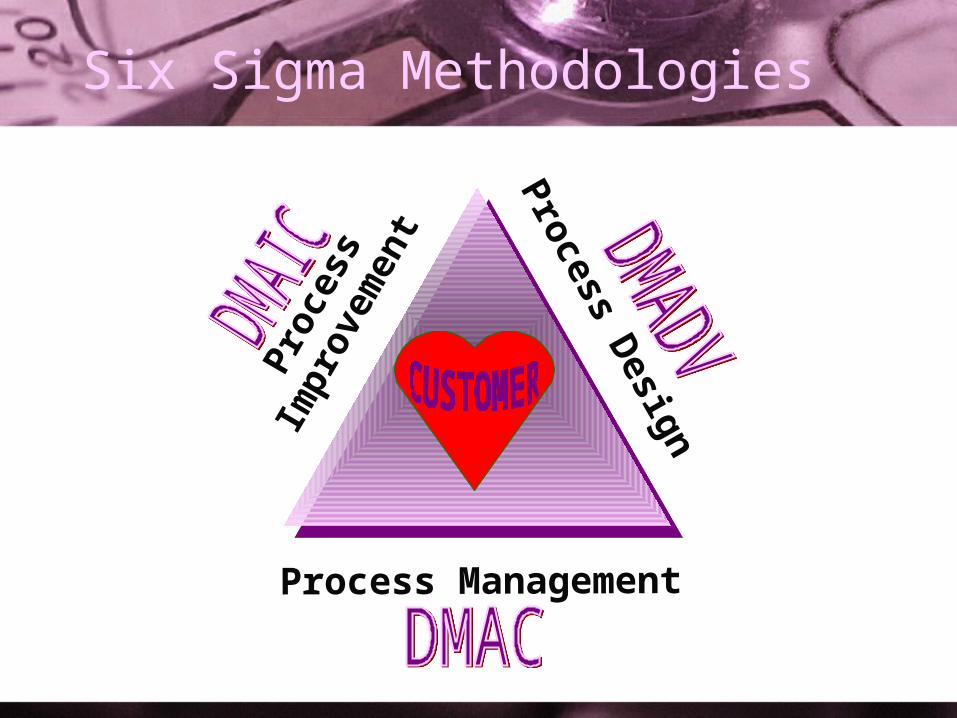
Six Sigma Methodologies
Pro
cess
Impr
ovem
ent
Process D
esign
Process Management
Commitment and Control
• Six Sigma is about– Commitment to the CUSTOMER
– Control of customer experience to meet expectations via:
• Continuous improvement• Process Focus
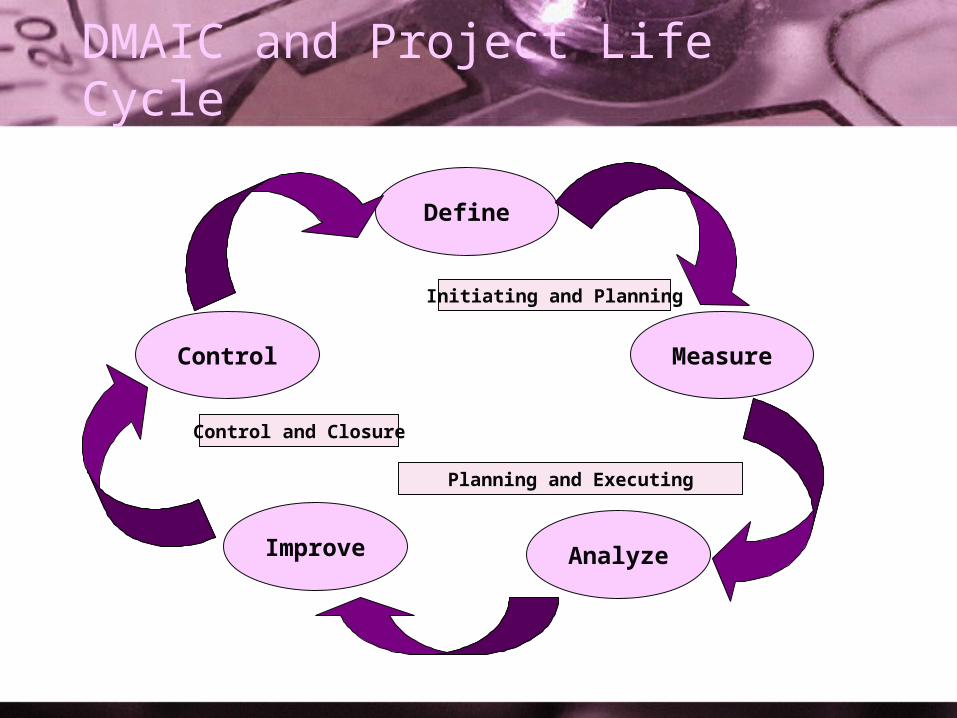
DMAIC and Project Life Cycle
Define
Measure
AnalyzeImprove
Control
Initiating and Planning
Planning and Executing
Control and Closure
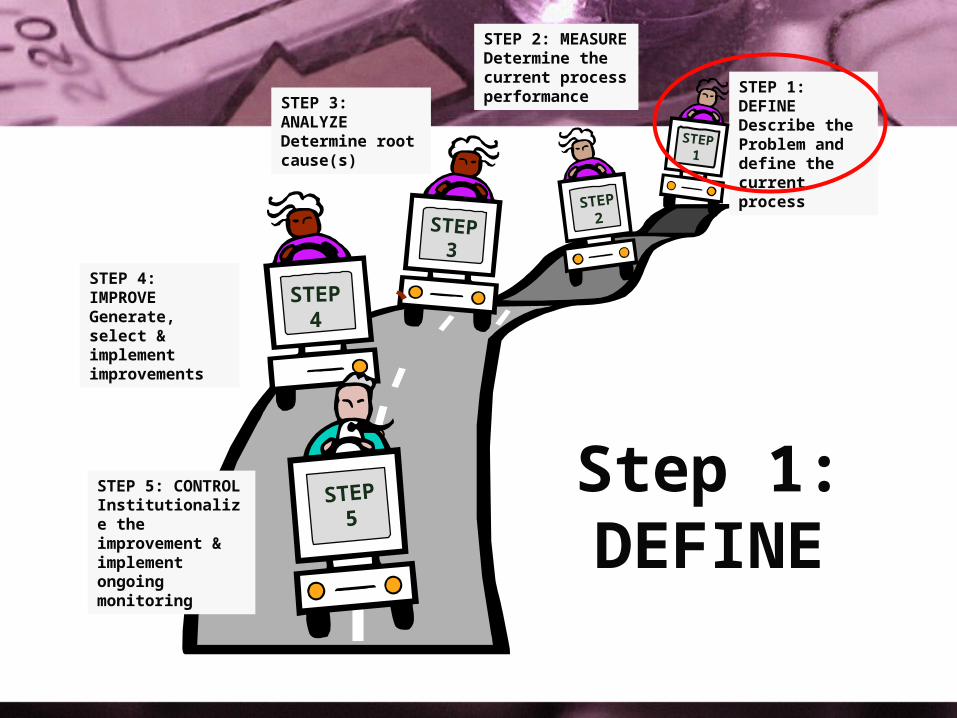
Step 1:DEFINE
STEP 2: MEASUREDetermine the current process performanceSTEP 3: ANALYZE
Determine root cause(s)
STEP 4: IMPROVEGenerate, select & implement improvements
STEP 5: CONTROLInstitutionalize the improvement & implement ongoing monitoring
STEP2STEP
3
STEP4
STEP5
STEP 1: DEFINEDescribe theProblem and define the current process
STEP1
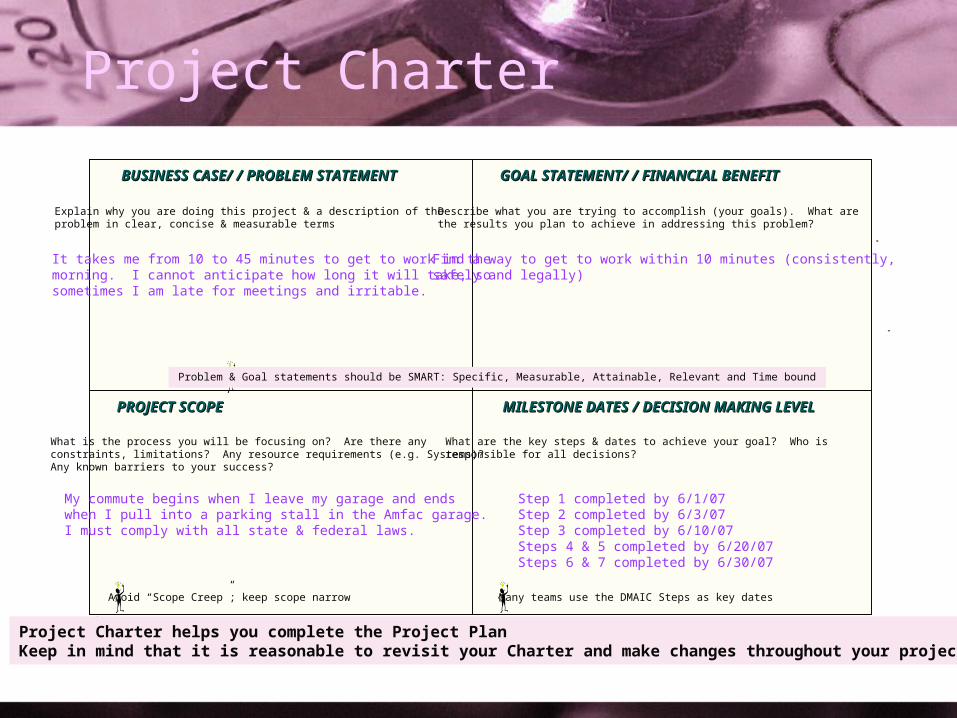
Project Charter
BUSINESS CASE/ / PROBLEM STATEMENTBUSINESS CASE/ / PROBLEM STATEMENT GOAL STATEMENT/ / FINANCIAL BENEFITGOAL STATEMENT/ / FINANCIAL BENEFIT
PROJECT SCOPEPROJECT SCOPE MILESTONE DATES / DECISION MAKING LEVELMILESTONE DATES / DECISION MAKING LEVEL
Explain why you are doing this project & a description of theproblem in clear, concise & measurable terms
Describe what you are trying to accomplish (your goals). What arethe results you plan to achieve in addressing this problem?
What is the process you will be focusing on? Are there anyconstraints, limitations? Any resource requirements (e.g. Systems)? Any known barriers to your success?
What are the key steps & dates to achieve your goal? Who isresponsible for all decisions?
Project Charter helps you complete the Project PlanKeep in mind that it is reasonable to revisit your Charter and make changes throughout your project.
Many teams use the DMAIC Steps as key dates
It takes me from 10 to 45 minutes to get to work in themorning. I cannot anticipate how long it will take, sosometimes I am late for meetings and irritable.
Find a way to get to work within 10 minutes (consistently,safely and legally)
My commute begins when I leave my garage and ends when I pull into a parking stall in the Amfac garage.I must comply with all state & federal laws.
Step 1 completed by 6/1/07Step 2 completed by 6/3/07Step 3 completed by 6/10/07Steps 4 & 5 completed by 6/20/07Steps 6 & 7 completed by 6/30/07
Avoid “Scope Creep”; keep scope narrow
Problem & Goal statements should be SMART: Specific, Measurable, Attainable, Relevant and Time bound
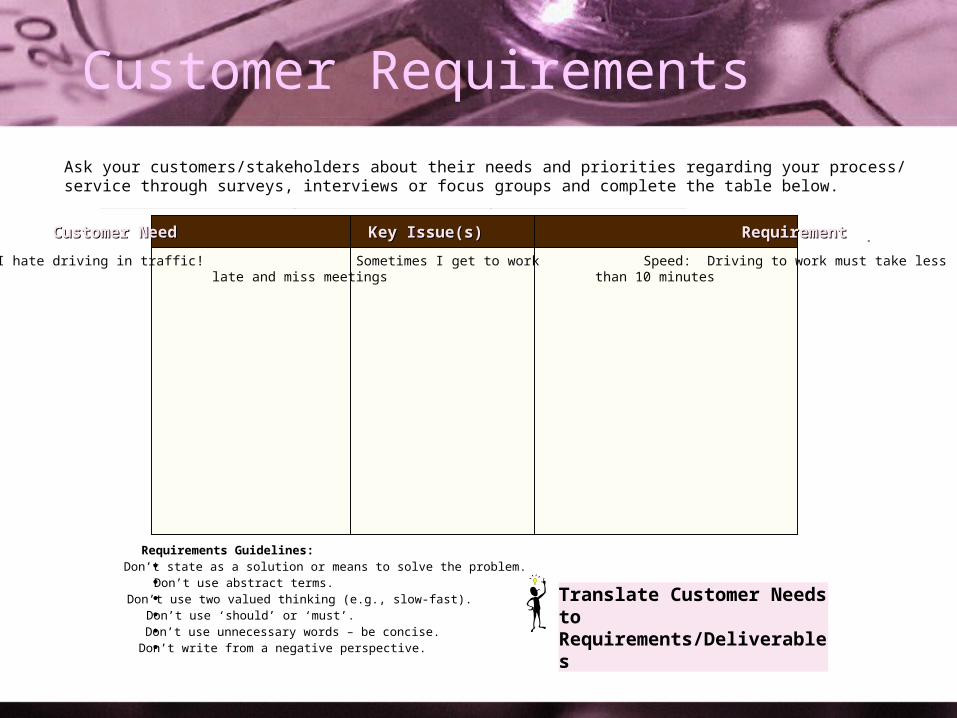
Customer Requirements
Requirements Guidelines: Don’t state as a solution or means to solve the problem. Don’t use abstract terms. Don’t use two valued thinking (e.g., slow-fast). Don’t use ‘should’ or ‘must’. Don’t use unnecessary words – be concise. Don’t write from a negative perspective.
Translate Customer Needs to Requirements/Deliverables
Ask your customers/stakeholders about their needs and priorities regarding your process/service through surveys, interviews or focus groups and complete the table below.
Customer Need Key Issue(s) RequirementCustomer Need Key Issue(s) Requirement
I hate driving in traffic! Sometimes I get to work Speed: Driving to work must take less late and miss meetings than 10 minutes
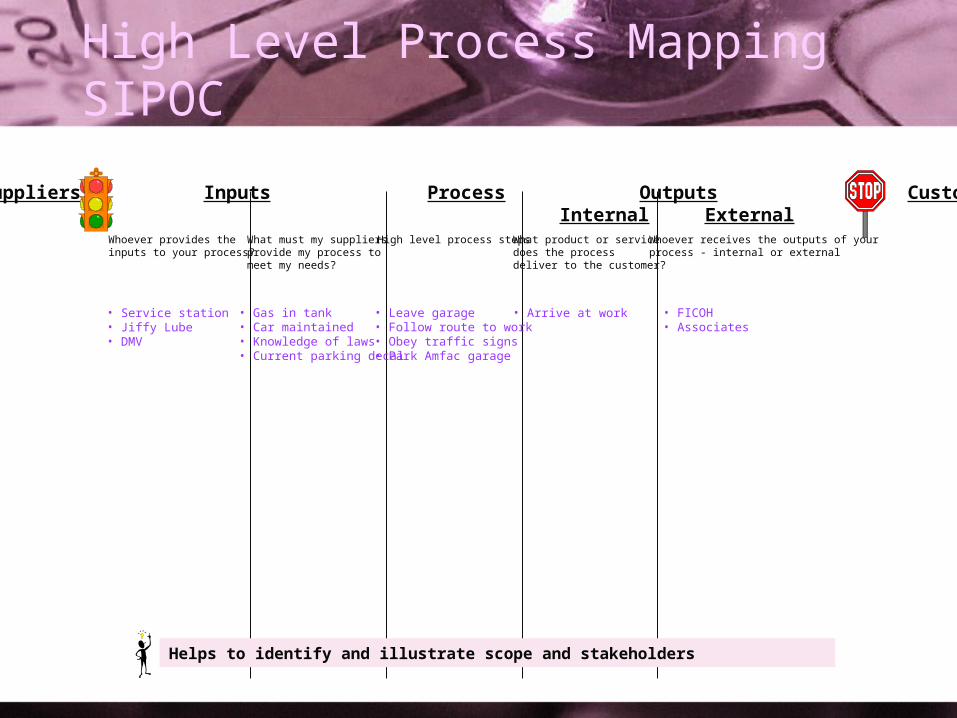
High Level Process MappingSIPOC
Suppliers Inputs Process Outputs Customers Internal External
What must my suppliersprovide my process tomeet my needs?
What product or service does the processdeliver to the customer?
High level process stepsWhoever provides theinputs to your process?
Whoever receives the outputs of yourprocess - internal or external
Helps to identify and illustrate scope and stakeholders
• Leave garage• Follow route to work• Obey traffic signs• Park Amfac garage
• Arrive at work • FICOH• Associates
• Gas in tank• Car maintained• Knowledge of laws• Current parking decal
• Service station• Jiffy Lube• DMV
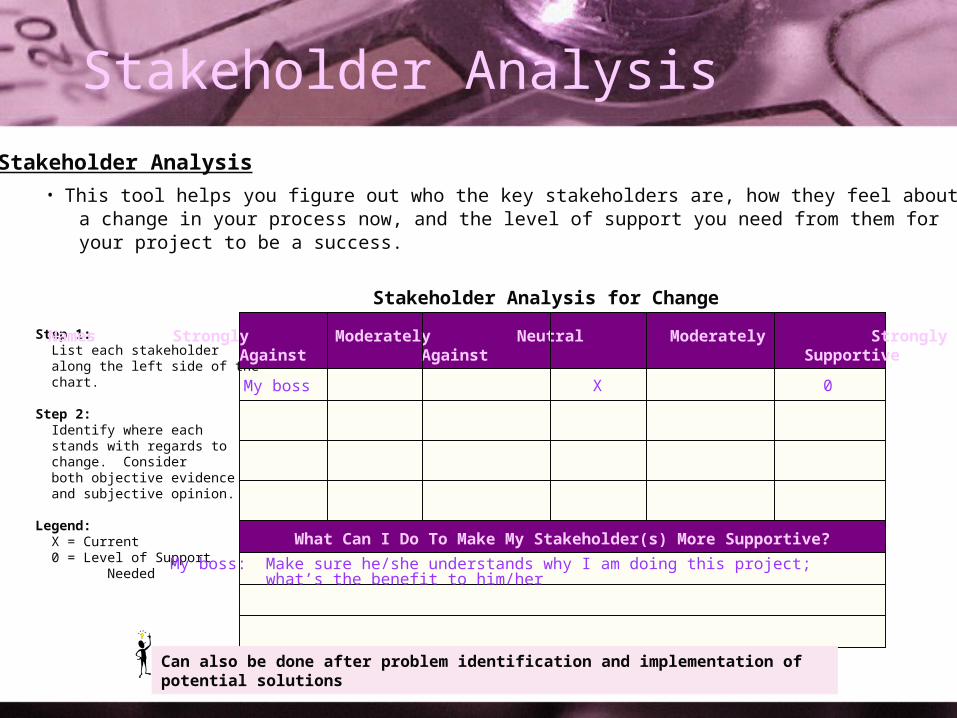
Stakeholder Analysis Stakeholder Analysis
• This tool helps you figure out who the key stakeholders are, how they feel about a change in your process now, and the level of support you need from them for your project to be a success.
Stakeholder Analysis for Change
Step 1: List each stakeholder along the left side of the chart.
Step 2: Identify where each stands with regards to change. Consider both objective evidence and subjective opinion.
Legend: X = Current 0 = Level of Support Needed
My boss X
What Can I Do To Make My Stakeholder(s) More Supportive?
My boss: Make sure he/she understands why I am doing this project; what’s the benefit to him/her
0
Names Strongly Moderately Neutral Moderately Strongly Against Against Supportive Supportive
Can also be done after problem identification and implementation of potential solutions
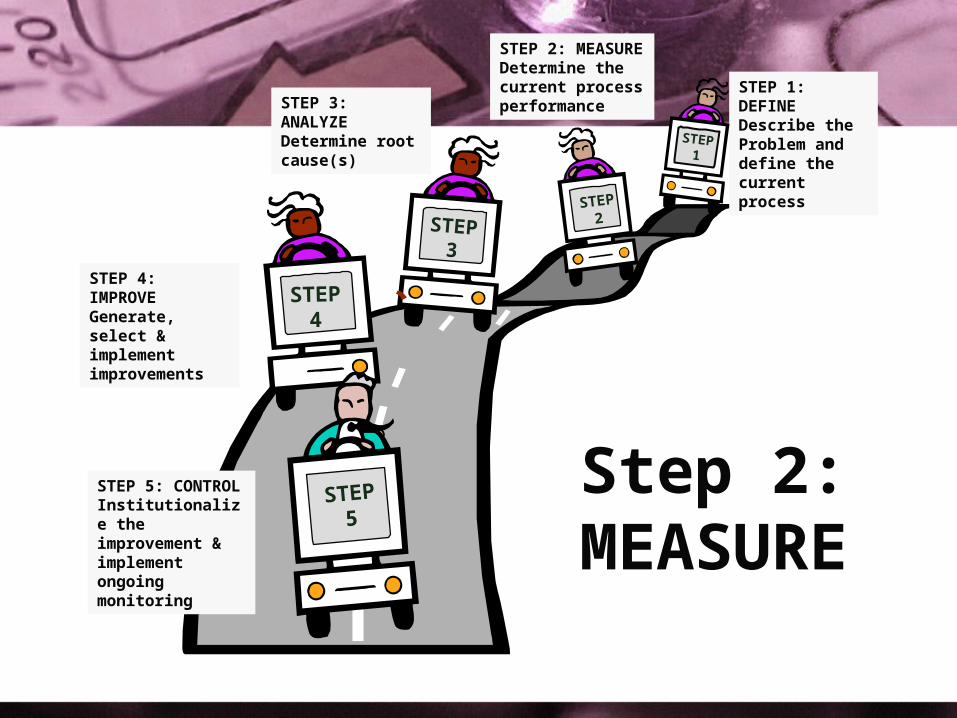
Step 2:MEASURE
STEP 2: MEASUREDetermine the current process performanceSTEP 3: ANALYZE
Determine root cause(s)
STEP 4: IMPROVEGenerate, select & implement improvements
STEP 5: CONTROLInstitutionalize the improvement & implement ongoing monitoring
STEP2STEP
3
STEP4
STEP5
STEP 1: DEFINEDescribe theProblem and define the current process
STEP1
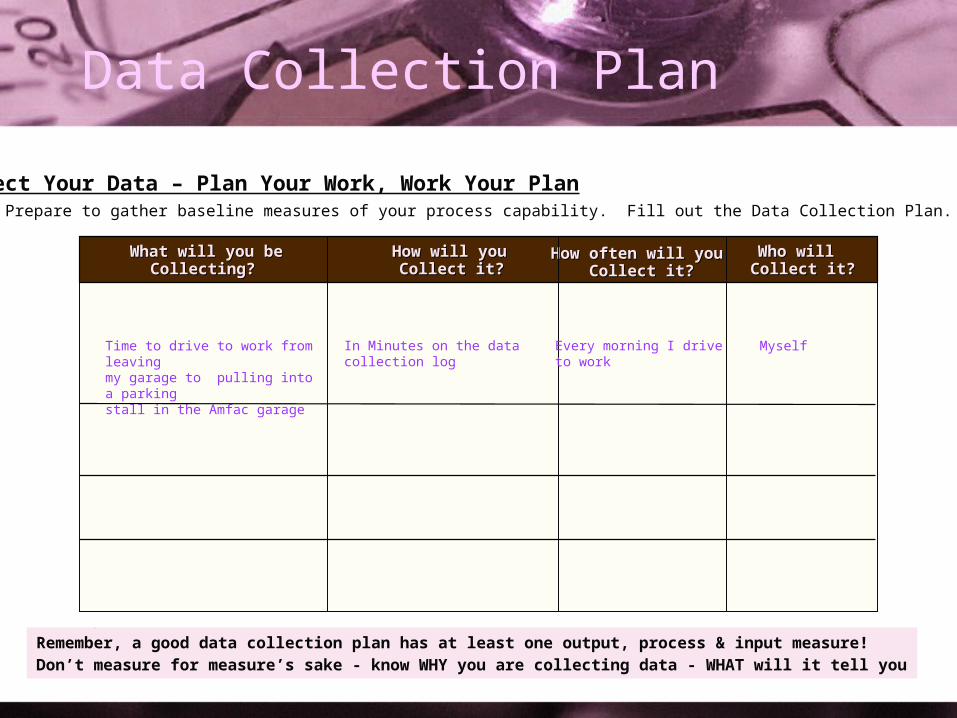
Data Collection Plan
Time to drive to work from leaving my garage to pulling into a parkingstall in the Amfac garage
In Minutes on the data collection log
Every morning I driveto work
Myself
Remember, a good data collection plan has at least one output, process & input measure!Don’t measure for measure’s sake - know WHY you are collecting data - WHAT will it tell you
Collect Your Data – Plan Your Work, Work Your Plan Prepare to gather baseline measures of your process capability. Fill out the Data Collection Plan.
What will you beWhat will you beCollecting?Collecting?
How will youHow will you Collect it?Collect it?
Who will Who will Collect it?Collect it?
How often will youHow often will you Collect it?Collect it?
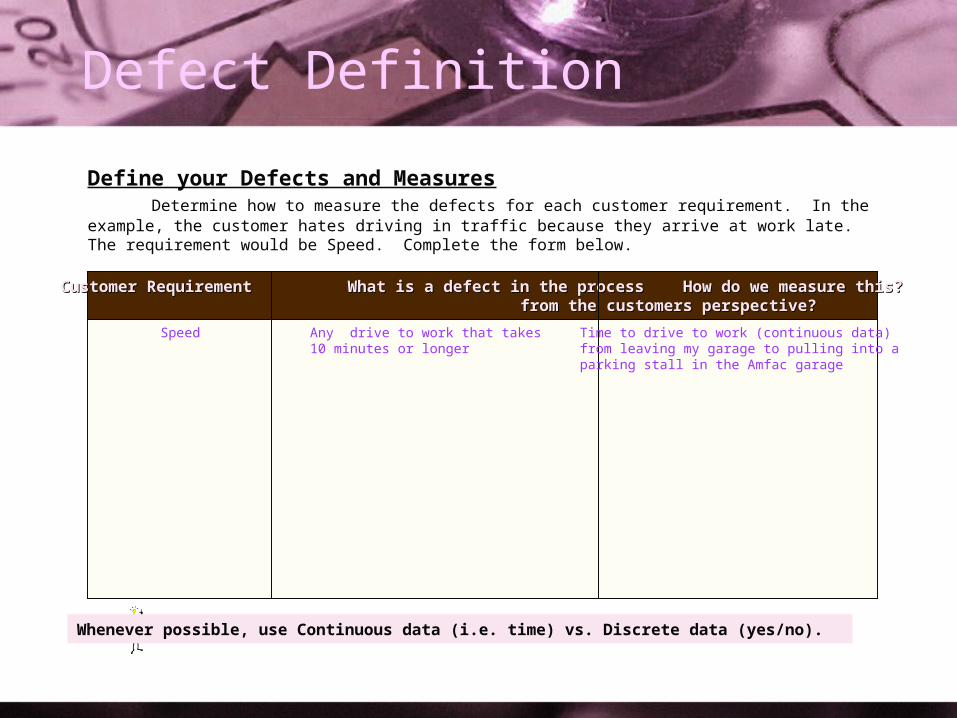
Defect Definition
Define your Defects and Measures Determine how to measure the defects for each customer requirement. In the example, the customer hates driving in traffic because they arrive at work late. The requirement would be Speed. Complete the form below.
Speed Any drive to work that takes 10 minutes or longer
Time to drive to work (continuous data)from leaving my garage to pulling into aparking stall in the Amfac garage
Whenever possible, use Continuous data (i.e. time) vs. Discrete data (yes/no).
Customer Requirement What is a defect in the processCustomer Requirement What is a defect in the process How do we measure this? How do we measure this? from the customers perspective?from the customers perspective?
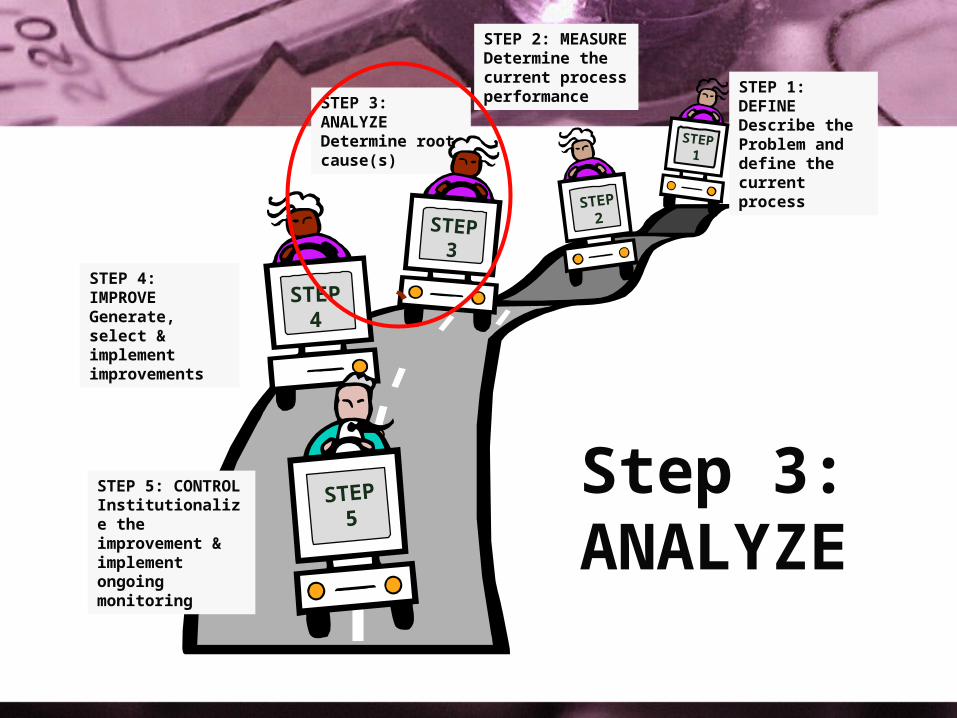
STEP 3: ANALYZEDetermine root cause(s)
Step 3:ANALYZE
STEP 2: MEASUREDetermine the current process performance
STEP 4: IMPROVEGenerate, select & implement improvements
STEP 5: CONTROLInstitutionalize the improvement & implement ongoing monitoring
STEP2STEP
3
STEP4
STEP5
STEP 1: DEFINEDescribe theProblem and define the current process
STEP1
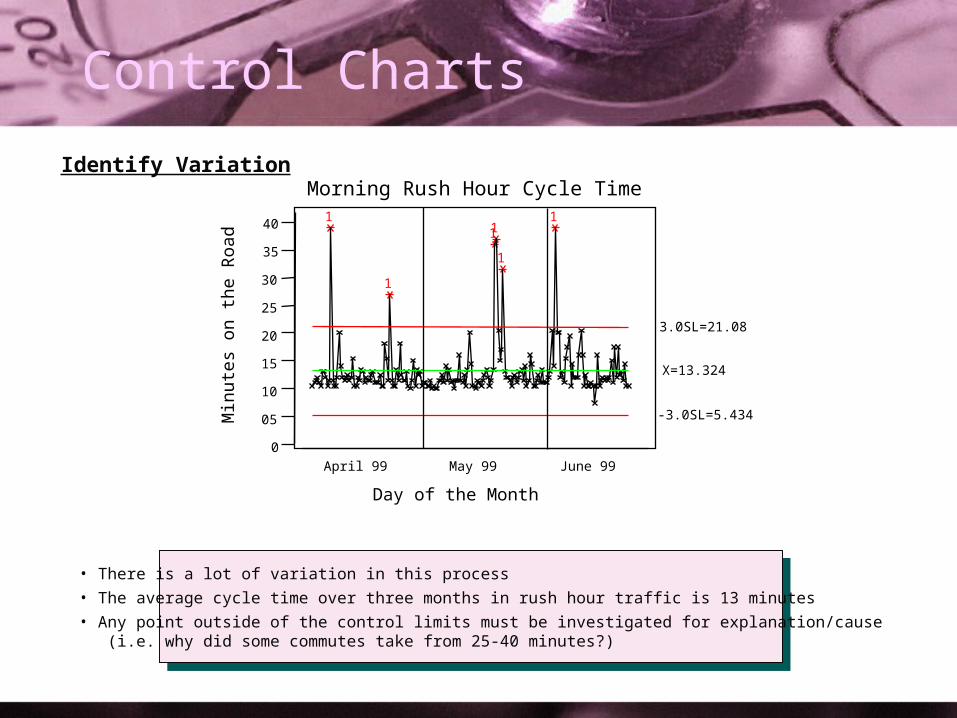
Control Charts
• There is a lot of variation in this process
• The average cycle time over three months in rush hour traffic is 13 minutes
• Any point outside of the control limits must be investigated for explanation/cause (i.e. why did some commutes take from 25-40 minutes?)
30
25
20
15
10
05
0
Day of the Month
Min
utes
on
the
Roa
d
Morning Rush Hour Cycle Time1
1
11
1
1
X=13.324
3.0SL=21.08
-3.0SL=5.434
April 99 May 99 June 99
40
35
Identify Variation
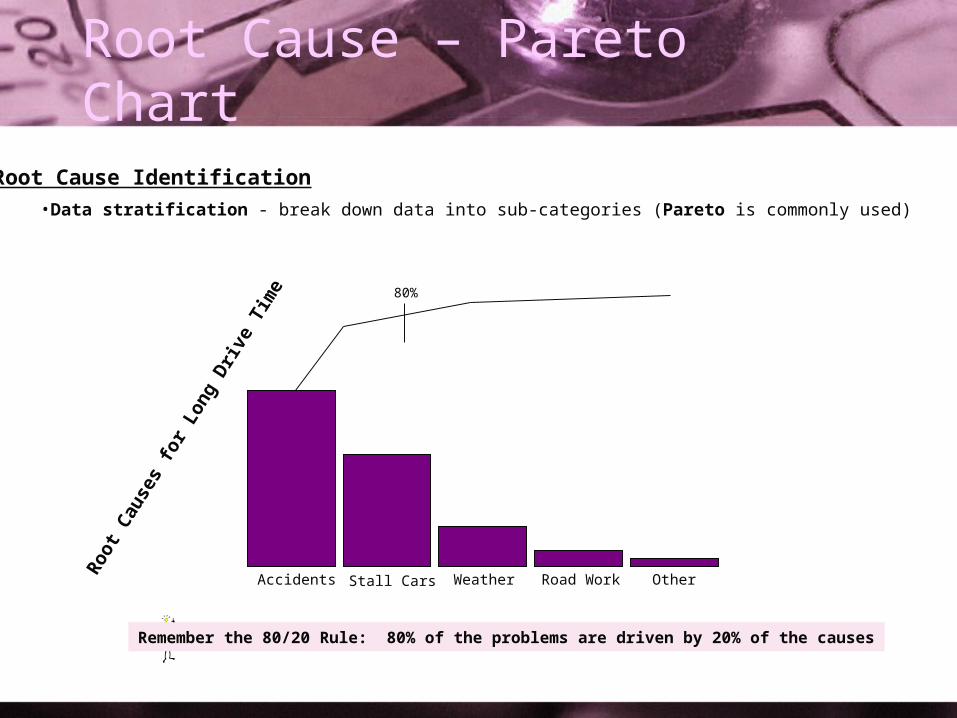
Root Cause – Pareto Chart
Root Cause Identification
•Data stratification - break down data into sub-categories (Pareto is commonly used)
Roo
t Cau
ses
for
Long
Dri
ve T
ime
Accidents Stall Cars Weather OtherRoad Work
80%
Remember the 80/20 Rule: 80% of the problems are driven by 20% of the causes
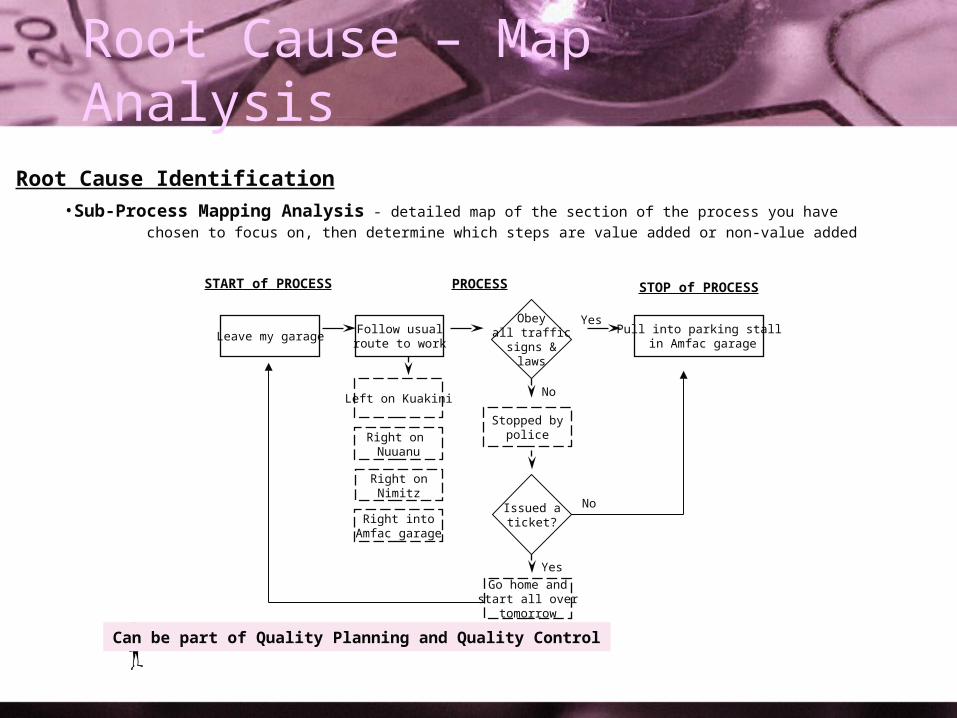
Root Cause – Map Analysis
Root Cause Identification
•Sub-Process Mapping Analysis - detailed map of the section of the process you have
chosen to focus on, then determine which steps are value added or non-value added
PROCESS STOP of PROCESSSTART of PROCESS
Follow usualroute to work
Leave my garage
Right intoAmfac garage
Right onNimitz
Left on Kuakini
Pull into parking stall in Amfac garage
Right on Nuuanu
Go home andstart all over
tomorrow
Stopped bypolice
Obeyall trafficsigns &
laws
Yes
No
Issued aticket?
No
Yes
Can be part of Quality Planning and Quality Control
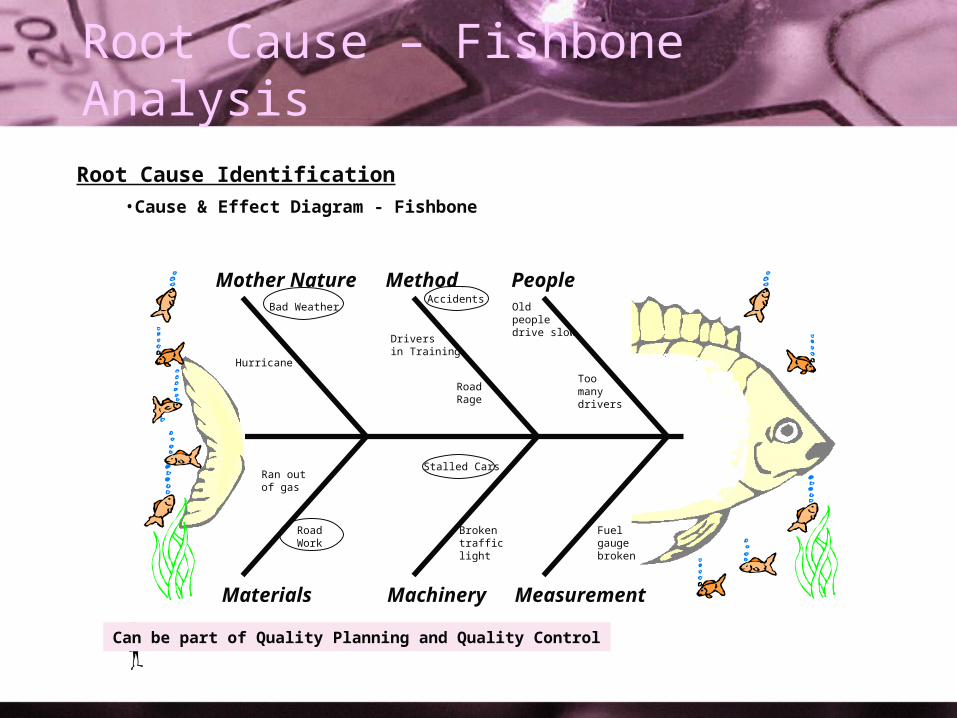
Root Cause – Fishbone Analysis
Root Cause Identification
•Cause & Effect Diagram - Fishbone
People
Measurement
Method
Machinery
Mother Nature
Materials
Bad Weather
Stalled Cars
RoadRage
Driversin Training
RoadWork
Toomanydrivers
Oldpeopledrive slow
Hurricane
Ran outof gas
Fuelgaugebroken
Brokentrafficlight
Accidents
Can be part of Quality Planning and Quality Control
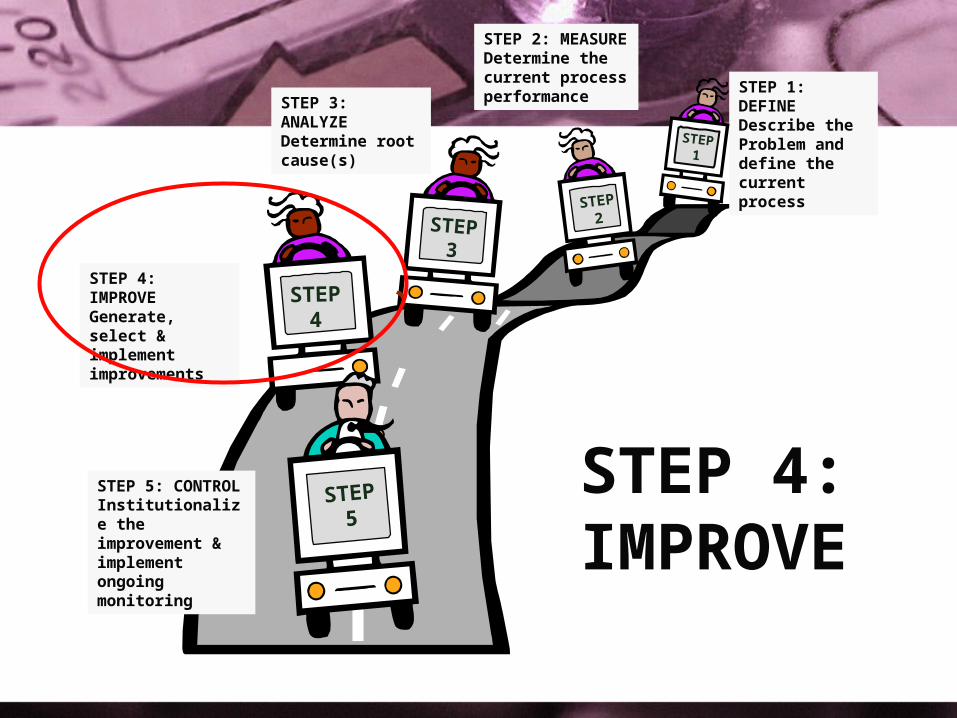
STEP 4:IMPROVE
STEP 2: MEASUREDetermine the current process performanceSTEP 3: ANALYZE
Determine root cause(s)
STEP 4: IMPROVEGenerate, select & implement improvements
STEP 5: CONTROLInstitutionalize the improvement & implement ongoing monitoring
STEP2STEP
3
STEP4
STEP5
STEP 1: DEFINEDescribe theProblem and define the current process
STEP1
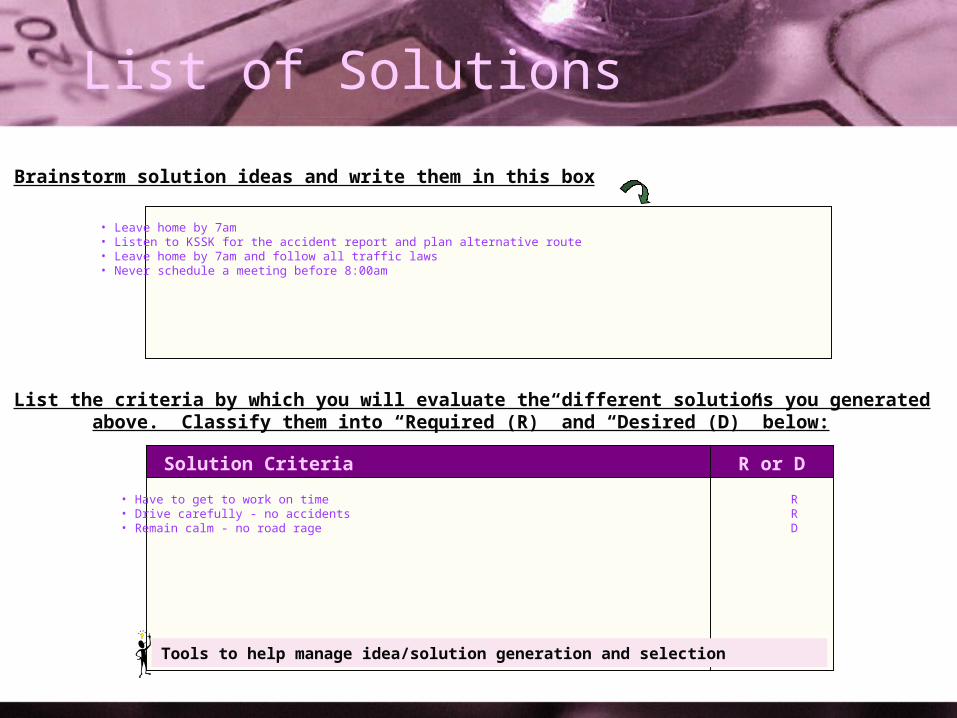
List of Solutions
Brainstorm solution ideas and write them in this box
List the criteria by which you will evaluate the different solutions you generated above. Classify them into “Required (R)” and “Desired (D)” below:
Solution Criteria R or D
• Leave home by 7am• Listen to KSSK for the accident report and plan alternative route• Leave home by 7am and follow all traffic laws• Never schedule a meeting before 8:00am
• Have to get to work on time R• Drive carefully - no accidents R• Remain calm - no road rage D
Tools to help manage idea/solution generation and selection
Evaluate Solutions
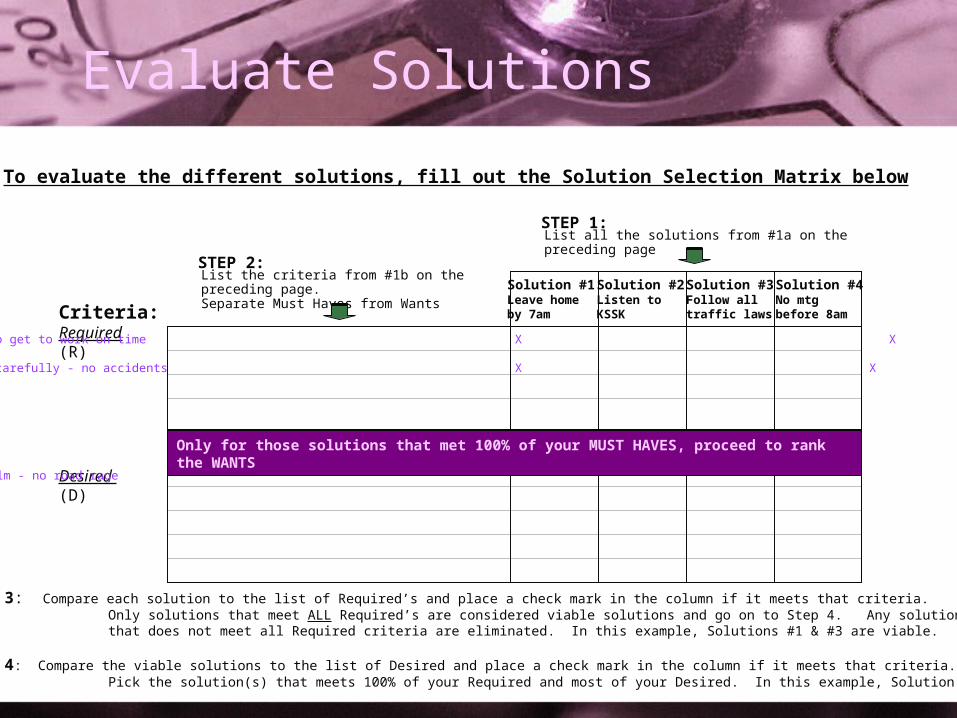
To evaluate the different solutions, fill out the Solution Selection Matrix below
List all the solutions from #1a on the preceding page
Solution #1Leave homeby 7am
Solution #2Listen toKSSK
Solution #3Follow alltraffic laws
Solution #4No mtgbefore 8amCriteria:
Required(R)
Desired (D)
List the criteria from #1b on the preceding page.Separate Must Haves from Wants
Only for those solutions that met 100% of your MUST HAVES, proceed to rank the WANTS
STEP 1:
STEP 2:
STEP 3: Compare each solution to the list of Required’s and place a check mark in the column if it meets that criteria. Only solutions that meet ALL Required’s are considered viable solutions and go on to Step 4. Any solution that does not meet all Required criteria are eliminated. In this example, Solutions #1 & #3 are viable.
STEP 4: Compare the viable solutions to the list of Desired and place a check mark in the column if it meets that criteria. Pick the solution(s) that meets 100% of your Required and most of your Desired. In this example, Solution #3.
Have to get to work on time X X
Drive carefully - no accidents X X X
Remain calm - no road rage X
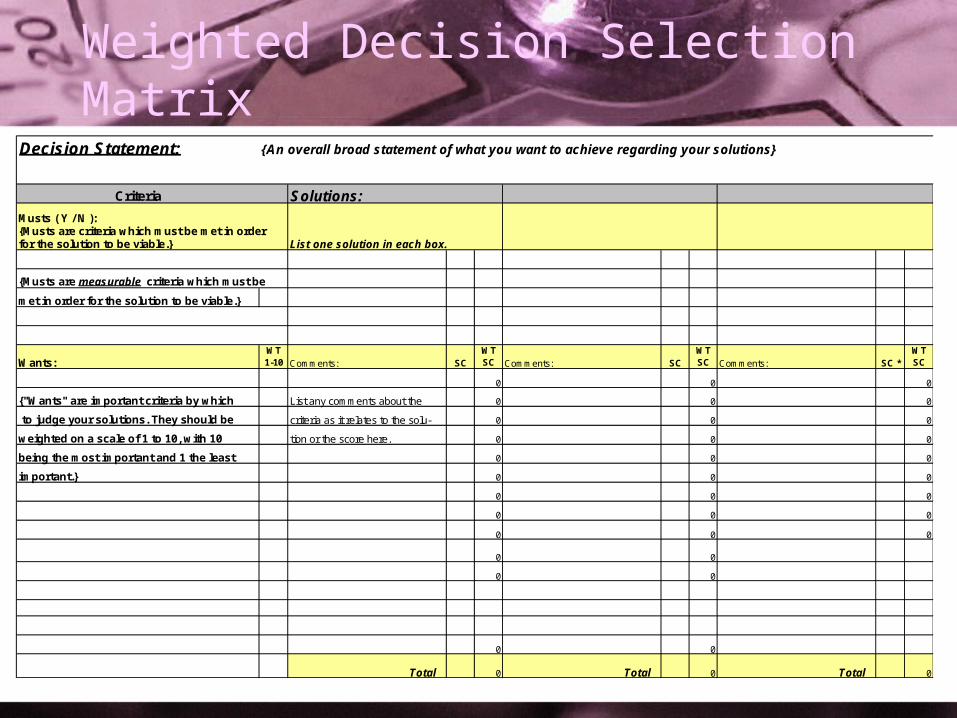
Weighted Decision Selection Matrix
Decision Statement: {An overall broad statement of what you want to achieve regarding your solutions}
Criteria Solutions:
Musts ( Y / N ):{Musts are criteria which must be met in orderfor the solution to be viable.}
{Musts are measurable criteria which must be
met in order for the solution to be viable.}
Wants:WT1-10 Comments: SC
WT SC Comments: SC
WT SC Comments: SC *
WT SC
0 0 0
{"Wants" are important criteria by which List any comments about the 0 0 0
to judge your solutions. They should be criteria as it relates to the solu- 0 0 0
weighted on a scale of 1 to 10, with 10 tion or the score here. 0 0 0
being the most important and 1 the least 0 0 0
important.} 0 0 0
0 0 0
0 0 0
0 0 0
0 0
0 0
0 0
Total 0 Total 0 Total 0
List one solution in each box.
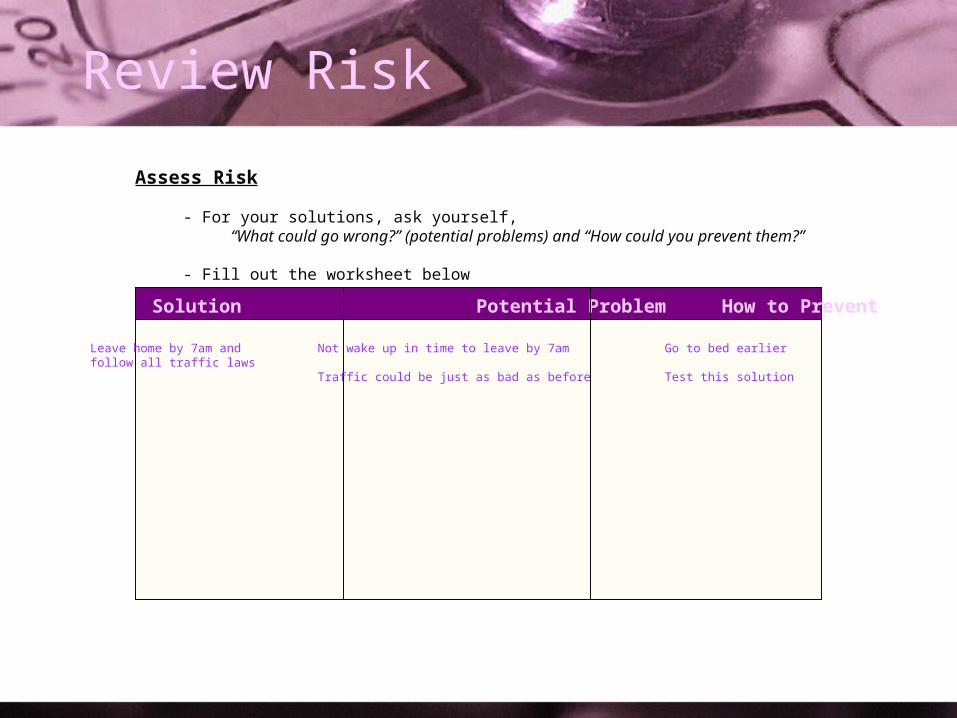
Review Risk
Assess Risk
- For your solutions, ask yourself, “What could go wrong?” (potential problems) and “How could you prevent them?”
- Fill out the worksheet below
Solution Potential Problem How to Prevent
Leave home by 7am and Not wake up in time to leave by 7am Go to bed earlierfollow all traffic laws
Traffic could be just as bad as before Test this solution
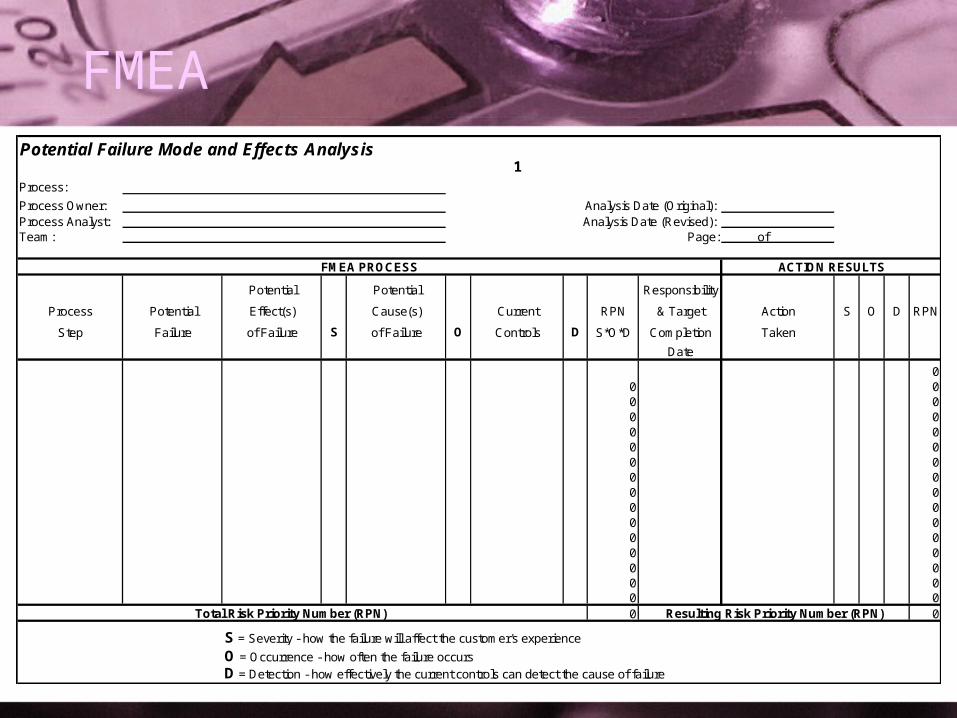
FMEAPotential Failure Mode and Effects Analysis
1Process:
Process Owner: Analysis Date (Original): Process Analyst: Analysis Date (Revised): Team: Page: of
FMEA PROCESS ACTION RESULTS
Potential Potential Responsibility
Process Potential Effect(s) Cause(s) Current RPN & Target Action S O D RPN
Step Failure of Failure S of Failure O Controls D S*O*D Completion Taken
Date
00 00 00 00 00 00 00 00 00 00 00 00 00 00 00 0
Total Risk Priority Number (RPN) 0 Resulting Risk Priority Number (RPN) 0
S = Severity - how the failure will affect the customer's experience
O = Occurrence - how often the failure occursD = Detection - how effectively the current controls can detect the cause of failure
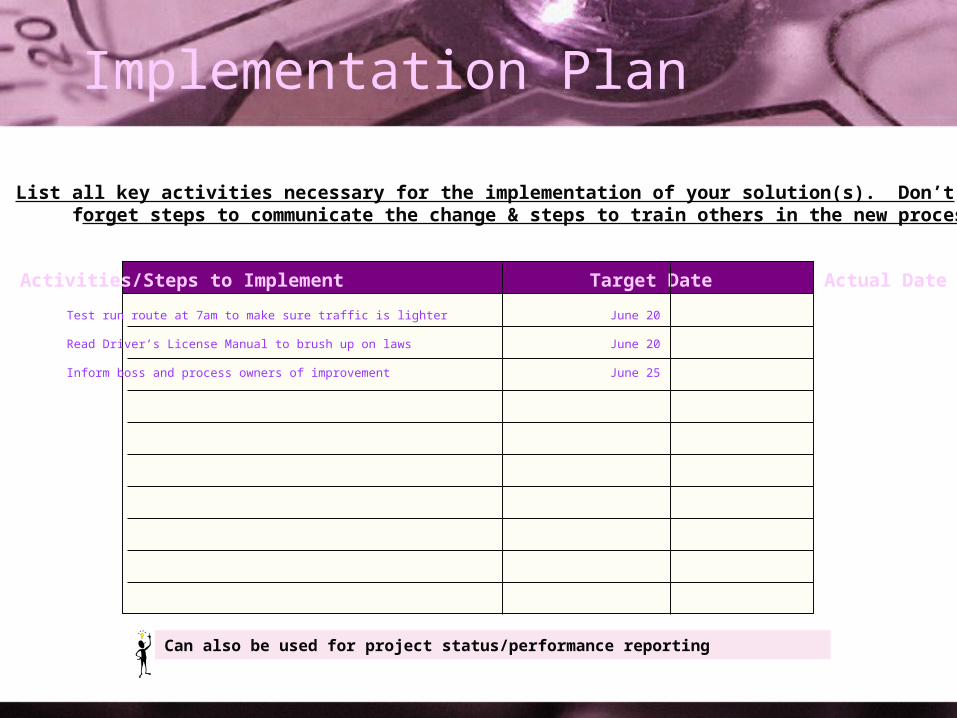
Implementation Plan
List all key activities necessary for the implementation of your solution(s). Don’t forget steps to communicate the change & steps to train others in the new process.
Activities/Steps to Implement Target Date Actual Date
Test run route at 7am to make sure traffic is lighter June 20
Read Driver’s License Manual to brush up on laws June 20
Inform boss and process owners of improvement June 25
Can also be used for project status/performance reporting
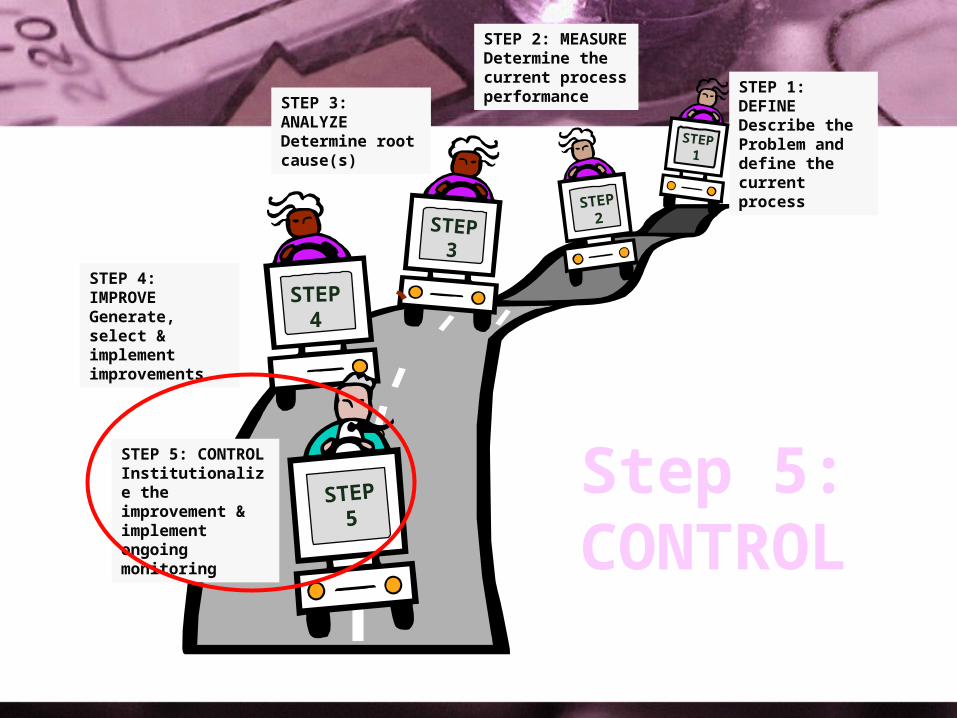
Step 5:CONTROL
STEP 2: MEASUREDetermine the current process performanceSTEP 3: ANALYZE
Determine root cause(s)
STEP 4: IMPROVEGenerate, select & implement improvements
STEP 5: CONTROLInstitutionalize the improvement & implement ongoing monitoring
STEP2STEP
3
STEP4
STEP5
STEP 1: DEFINEDescribe theProblem and define the current process
STEP1
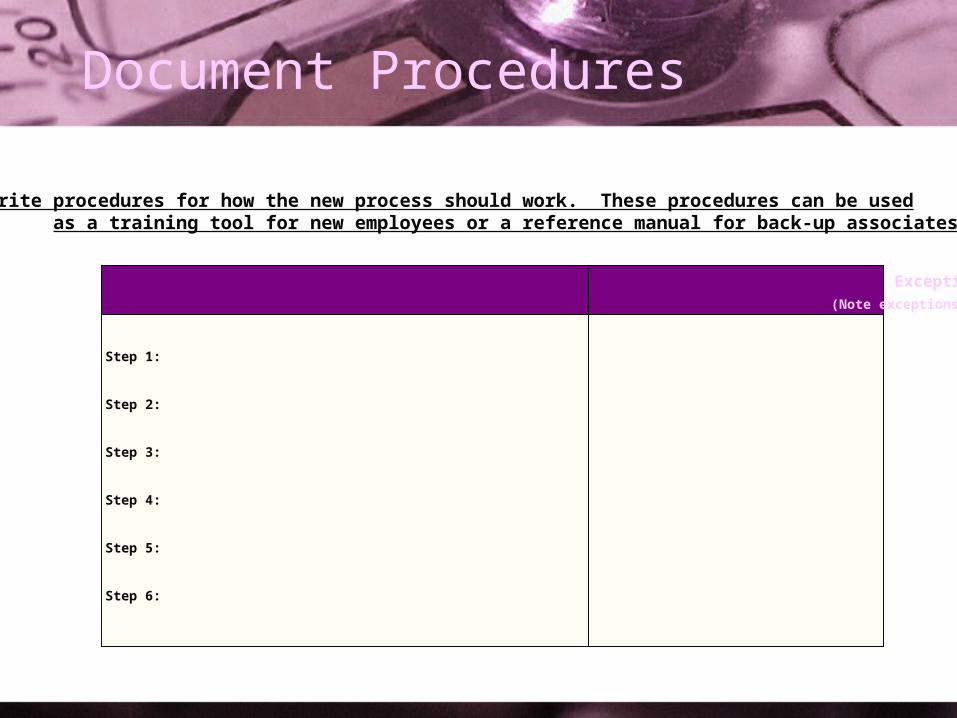
Document Procedures
Write procedures for how the new process should work. These procedures can be used as a training tool for new employees or a reference manual for back-up associates.
Steps in the process Exceptions
(including description) (Note exceptions, if any)
Step 1:
Step 2:
Step 3:
Step 4:
Step 5:
Step 6:
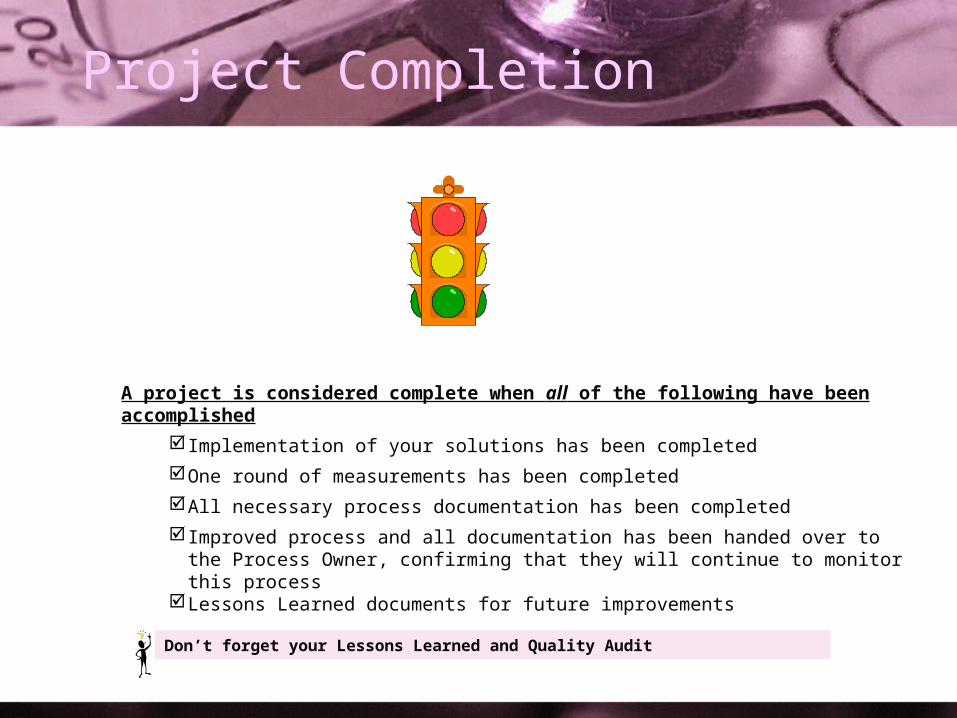
Project Completion
A project is considered complete when all of the following have been accomplished
Implementation of your solutions has been completed
One round of measurements has been completed
All necessary process documentation has been completed
Improved process and all documentation has been handed over to the Process Owner, confirming that they will continue to monitor this process
Lessons Learned documents for future improvements
Don’t forget your Lessons Learned and Quality Audit
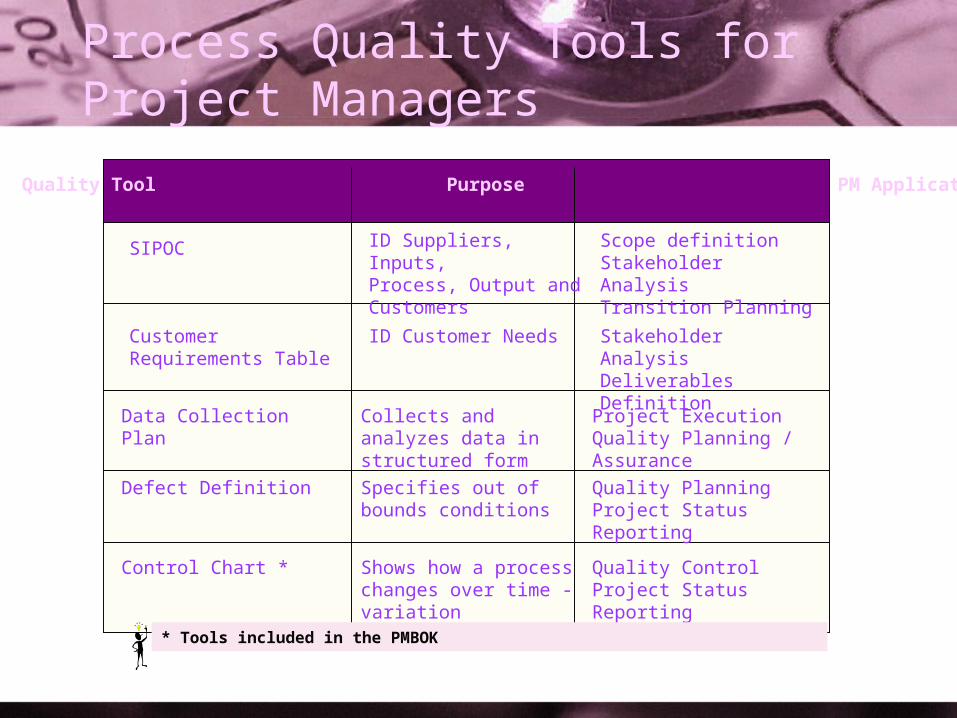
Process Quality Tools for Project Managers
Quality Tool Purpose PM Application
Customer Requirements Table
SIPOC
Data Collection Plan
Defect Definition
Control Chart *
ID Customer Needs
ID Suppliers, Inputs, Process, Output and Customers
Collects and analyzes data in structured form
Specifies out of bounds conditions
Shows how a process changes over time - variation
Stakeholder AnalysisDeliverables Definition
Scope definitionStakeholder AnalysisTransition Planning
Project ExecutionQuality Planning / Assurance
Quality PlanningProject Status Reporting
Quality ControlProject Status Reporting
* Tools included in the PMBOK
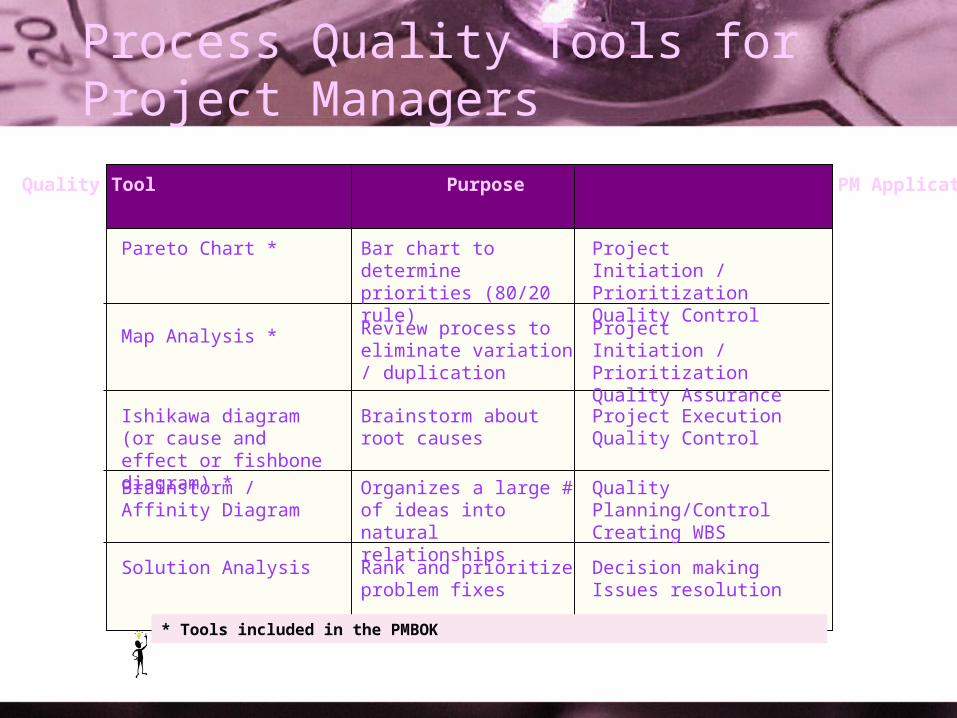
Process Quality Tools for Project Managers
Quality Tool Purpose PM Application
Pareto Chart *
Map Analysis *
Ishikawa diagram (or cause and effect or fishbone diagram) *
Brainstorm / Affinity Diagram
Solution Analysis
Bar chart to determine priorities (80/20 rule)
Review process to eliminate variation / duplication
Brainstorm about root causes
Organizes a large # of ideas into natural relationships
Rank and prioritize problem fixes
Project Initiation / PrioritizationQuality Control
Project Initiation / PrioritizationQuality Assurance
Project ExecutionQuality Control
Quality Planning/ControlCreating WBS
Decision makingIssues resolution
* Tools included in the PMBOK
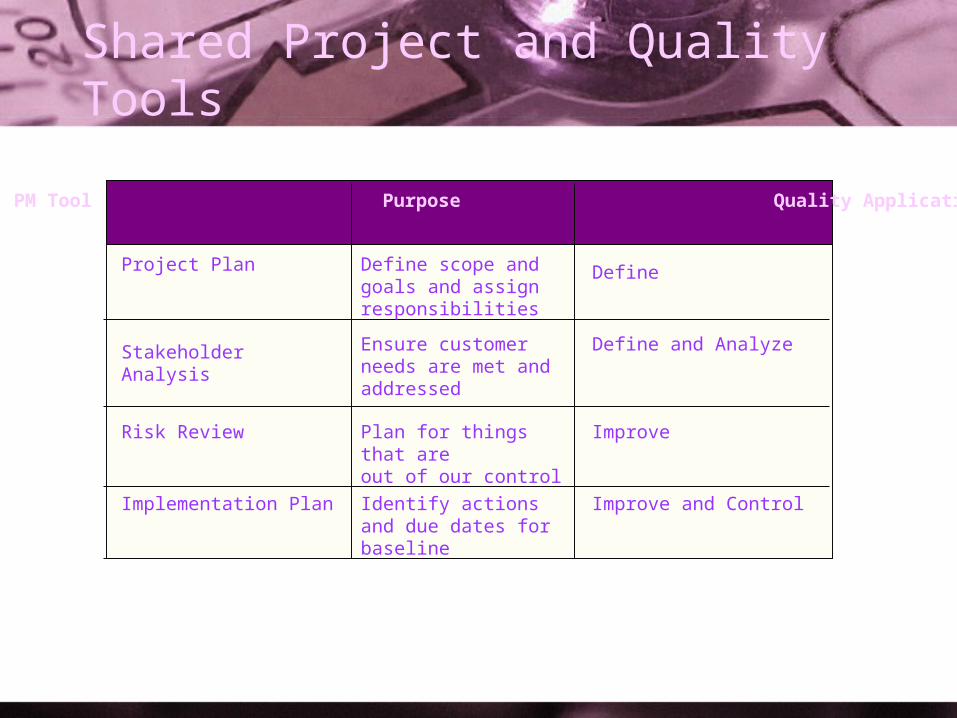
Shared Project and Quality Tools
PM Tool Purpose Quality Application
Project Plan
Stakeholder Analysis
Risk Review
Implementation Plan
Define scope and goals and assign responsibilities
Ensure customer needs are met and addressed
Plan for things that are out of our control
Identify actions and due dates for baseline
Define
Define and Analyze
Improve
Improve and Control
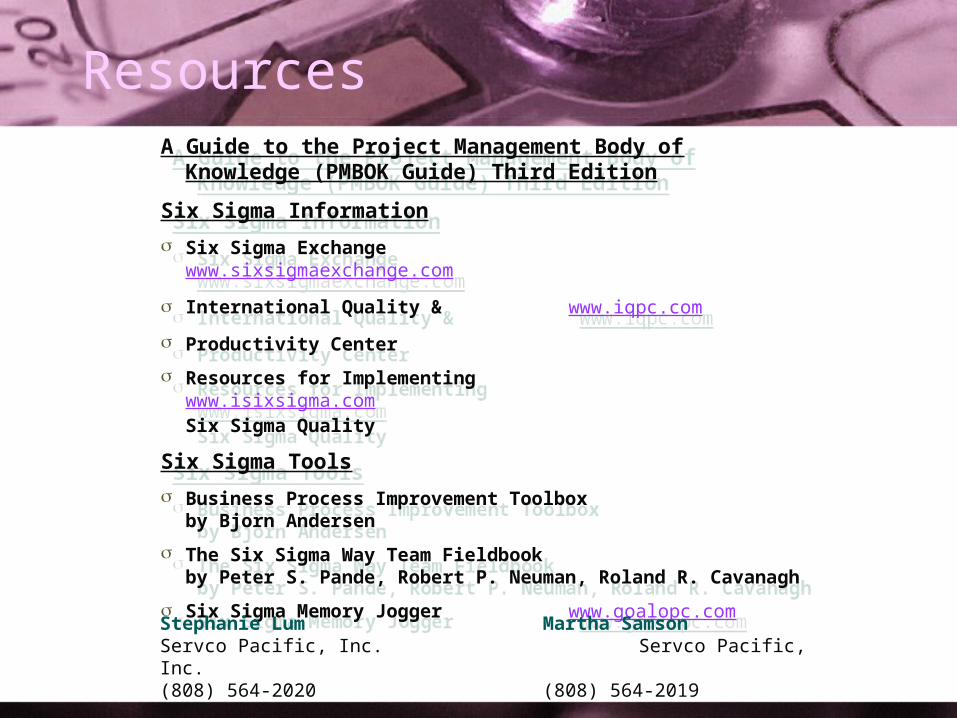
Resources
A Guide to the Project Management Body of Knowledge (PMBOK Guide) Third Edition
Six Sigma Information
Six Sigma Exchange www.sixsigmaexchange.com
International Quality & www.iqpc.com
Productivity Center
Resources for Implementing www.isixsigma.com Six Sigma Quality
Six Sigma Tools
Business Process Improvement Toolboxby Bjorn Andersen
The Six Sigma Way Team Fieldbookby Peter S. Pande, Robert P. Neuman, Roland R. Cavanagh
Six Sigma Memory Jogger www.goalopc.com
Stephanie Lum Martha SamsonServco Pacific, Inc. Servco Pacific, Inc.(808) 564-2020 (808) 564-2019