Embed Size (px)
Citation preview

1
March 2013
Structure of Earnings Survey for the year 2010
Implementation of the Commission Regulation 698/2006
and therefore Council Regulation 530/1999
and Commission Regulation 1738/2005
Quality Report ITALY
Contact persons: S Cardinaleschi [email protected] +39/06/46736159
F. Rocci [email protected] - S. De Santis [email protected]
2
Index
PART I – QUALITY EVALUATION CRITERIA ..................................................................... 3
1. RELEVANCE ................................................................................................................... 3
2. ACCURACY ..................................................................................................................... 3
3. PUNCTUALITY AND TIMELINESS ................................................................................. 8
4. ACCESSIBILITY and CLARITY ....................................................................................... 8
5. COMPARABILITY ............................................................................................................ 8
6. COHERENCE .................................................................................................................. 8
PART II - SPECIFIC METHODOLOGICAL NOTES........................................................... 11
1. GENERAL INFORMATION ............................................................................................ 11
2. SURVEY STRATEGY .................................................................................................... 12
Annex I ............................................................................................................................... 18

3
In accordance with the Commission Regulation No 698/2006 of 5 May 2006 concerning quality evaluation of
Statistics on labour costs and earnings, Istat provides Eurostat with required information on Quality
Indicators and Specific Methodological Notes, concerning Structure of Earnings Survey year of reference
2010.
The framework of the quality report is as follows: descriptive analysis of each applicable quality evaluation
criteria and specific methodological notes are reported in the text, while required tables with quality indicators
on Accuracy and Response are described in Annex I.
PART I – QUALITY EVALUATION CRITERIA
1. RELEVANCE
The SES 2010 survey results to provide a important information for decision makers in national and
European social policy and to establish reliable and harmonized comparisons of earnings and composition of
earnings between European countries or regions. The Italian institute of Statistics (Istat) disseminates those
information through three main channels:
- a public release of the main aggregates and indicators by a statistical report;
- the Istat Research data centre ADELE that assures a similar access to the one offered by the
Eurostat safe centre (where also the privacy and the statistical anonymization of data are assured);
- as a MFR file specifically anonymized data for the research;
The main national users of the SES survey data are academics, the universities students, typically for any
kind of degree and/or PhD thesis, field experts and sociological and economic research institutions.
2. ACCURACY
In the general statistical sense, accuracy denotes the closeness of computations (or estimates) to the exact
values; it is defined by the size of possible gap between measurement and true but unknown population
parameters. This possible gap consists of the so-called errors.
There are two possible kinds of errors:
a. SAMPLING errors related to the sampling design, measured by the relative error (coefficient of
variation=CV)
b. NON SAMPLING errors related to other aspects of the data production process quantified by a set of
specific indicators dealing with the effects of list status, total and item non response, editing and imputation
criteria.
The SES2010 microdata on employees is the result of an integration of sources and modes, at the basis of
which a designed based method has been established, that involves a two stage sample procedure. At the
first stage, a sample and a census of the statistical units, respectively on the private and on the public
sectors, have been implemented. At the second stage, a sample of employees has been drawn in both
cases. Furthermore, a mixed mode strategy of collection and the integration of sources, between direct
survey and administrative data, has been used. Hence, the indicators of accuracy about the sampling errors
will be given with regards the whole domain of estimation, while the indicators of accuracy about the non-
sampling errors will be given with regards that part of data collected through the direct survey, that covered
most of the final domains but not all.

4
2.1 SAMPLING ERRORS
Variance estimation and therefore coefficient of variation have been calculated for the two interest variables
“Average gross hourly earnings in the reference month” and “gross earnings in the reference month”
providing data broken down by:
- NACE Rev.2 Section;
- occupation (ISCO-08 at the 1-digit level);
- age band (16-24, 25-54, 55-64,>= 65 years old);
- size class (10 – 49, 50 – 249, 250 – 499, 500 – 999, > 1000);
- NUTS1;
- ISCED.
Coefficient of variation refer to whole observed units.
2.2 NON-SAMPLING ERRORS
2.2.1• Coverage errors:
The target population of the survey is defined by the private businesses and institutions and public
institutions belonging to the Section B-S Nace Rev. 2, except the Section O. In order to identify the statistical
units to be surveyed the whole universe has been divided into three type of units, mainly according to the
available information about the starting list of units. In this view, two lists were already available that could
cover the whole private sector and a part of the public one; for the remaining part of the public sector of the
Section P Education an ad hoc reconstruction of the starting frame has been done because a proper list was
non available.
Hence, the three registers were:
a. ASIA (Statistical Register on Active Business) Register, year of reference 2009. It consists of a
statistical Business Register resulting from the logical and physical combination of data resident in
statistical and administrative sources (Tax Register, Register of Enterprises and Local Units provided
by the Chambers of Commerce, Social Security Register, Work Accident Insurance Register,
Register of the Electric Power Board) treated with statistical methodologies. It supplies official
information about the economic activity and the average employment in the reference year. A
sample of the private business has been drawn from this list (reference year 2009) and data were
due to be collected only through a direct survey.
b. S13 list (Statistical Register of the Public Institutions), year of reference 2009, This is the list of units
included by Istat in the S13 domain that is the “General government” institutional sector in European
System of National and Regional Accounts, see ESA (1995). The information from this list does not
supply anything about employment of the statistical unit. In this case, a census has been done in
order to evaluate also the frame of the population according the number of employees, to identify the
survey target population of business with at least 10 employees. Data were due to be collected
through a direct survey. This list could not cover the institutions operating in the Section P, under the
public control, (except the universities) since they have specific characteristics and are not included
in the list S13.

5
c. the list of units operating in Section P, not included in the previous list S13, that had to be estimated.
To this purpose, a specific model using administrative and fiscal data has been applied to estimate
the target population of the statistical units of the public schools (local units). Furthermore, the
complete universe of employees of this sector has also been obtained through the record linkage of
administrative and fiscal data, from which the second stage sample has been drawn, optimizing the
use of data on the same people derived form the statistical archives LFS and EuSilc.
A more detailed description of this ad hoc method can be found in Cardinaleschi, Spinelli (2012)1.
As a consequence, the measure of any problem of misclassification can be related only to the first two
registers. As regards the list on the private sector, the out of scope units added to wrong addresses and to
change of status sum up to a final list error of 8.2% of total initially sampled units. This value is due to
different type of error: a. out of scope units about the 1% of the sample; b. added to wrong addresses the
4.7% of the sample; c. change of status 2.5% of the sample.
In this regard, an update of the starting list has been made, in order to take into account the new units
resulted from change on the units belonging to the starting list which percentage accounts to the 0.6% of the
starting frame.
On the other side, as regards the list S13 the percentage of error list is higher, about the 14.2%, even though
with a completely different composition in comparison to the one about the other list. In the case of the public
sector, most of error list are due to the units out of scope with regards to the size class, indeed the 12% of
errors are due to this reason (less than 10 employees) and only the 2,2% are due to wrong address and
different status than the one declared in the starting frame.
2.2.2 Measurement and processing errors
Measurement errors are the ones that occur at the time of data collection because of the survey instrument,
the respondent, the information system, the mode of data collection.
A structured scheme of control of such errors has been established, first during the data collection with
interactive editing rules on the web questionnaires. Indeed, on the web questionnaire the main rules have
been implemented, first of all in order to avoid missing data on the mandatory variable, furthermore also the
easiest kind of logical control were required to be satisfied.
Afterwards, once the collection was ended, a further process of Editing and Correction has been used that
followed several steps:
1. deterministic control in order to detect that error which solution could be given directly;
2. a selective editing procedure has been run, to detect influential data that could be potentially errors
controlling for the variable per capita earnings. The identification of such data has been based on a
statistical software produced by the Institute itself (Selemix, in R language)2;
3. a complete check on all the variable, specifically the software BANFF has been used on the set of
quantitative variable required on the employees, in order to identify inconsistencies among the data
1 1Cardinaleschi S.- Spinelli V. Integration of Administrative Registers for Statistics Eurostat”, European
University SIS VPS , April 19-20, 2012, Rome.
2 Buglielli M.T., Di Zio M., Guarnera U., (2010). Use of Contamination Models for Selective Editing, Q2010,
European Conference on Quality in Survey Statistics, 4-6 May 2010, Helsinki.

6
and to correct according to the principle of the minimum change and to localize the variable to
correct with the best donor.
2.2.3 Non-response errors
o Unit response rate
First level unit (business and public institutions) response rates by economic activity, size class and macro-
region have been calculated as “valid usable compiled questionnaires“ divided by “number of units being
contacted”, hence it is evaluated only on the units on which the direct survey has been implemented. The
total response rate was 43.9%.
Results are presented in Annex 1 according to the following list:
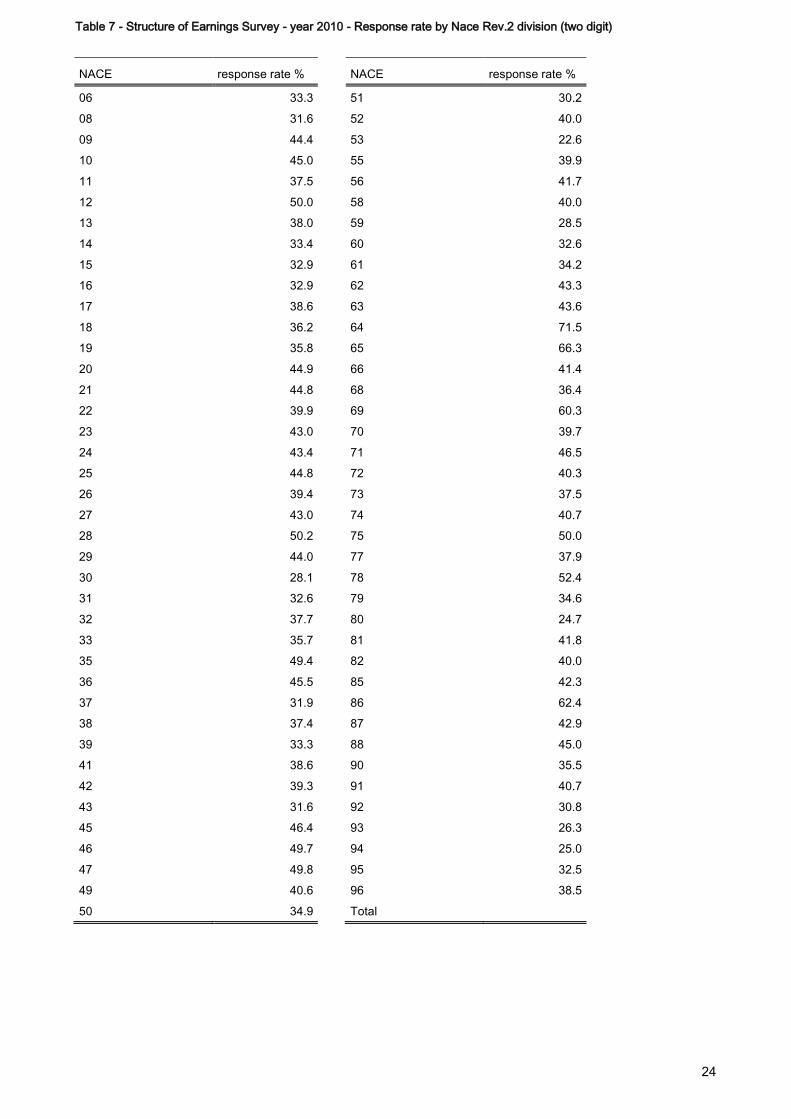
— Table 7 - Structure of Earnings Survey - year 2010 - Response rate by Nace Rev.2
division (two digit)
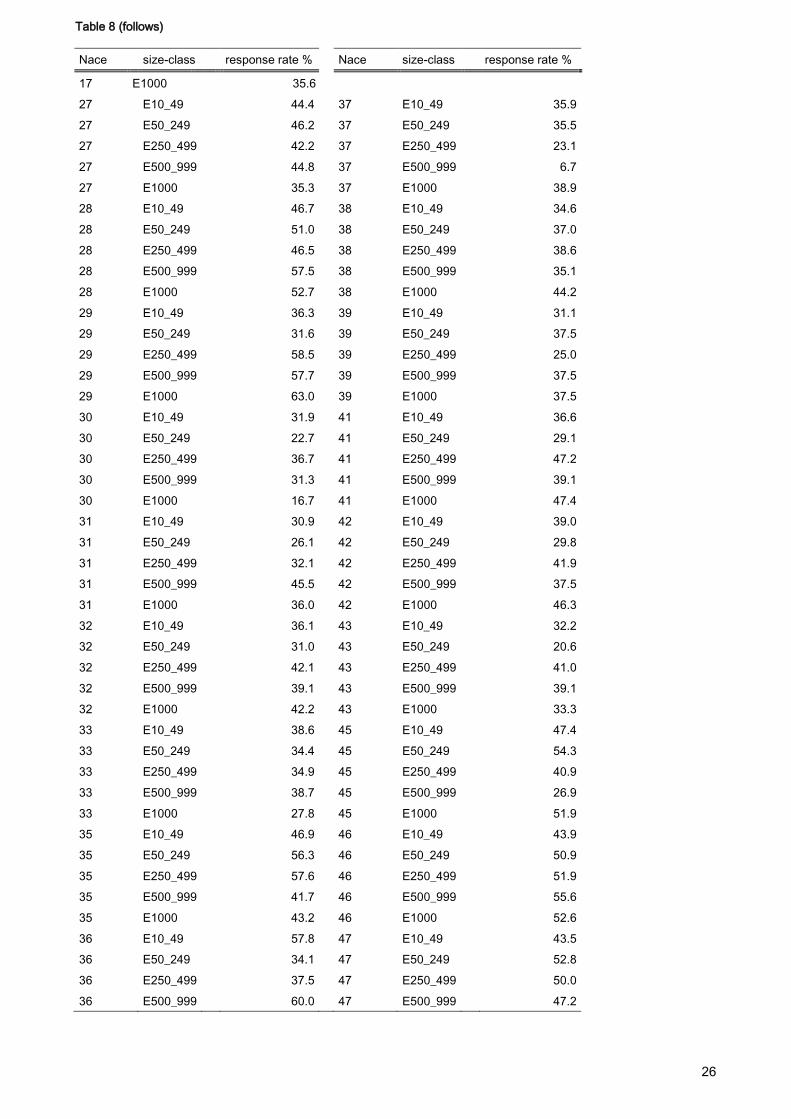
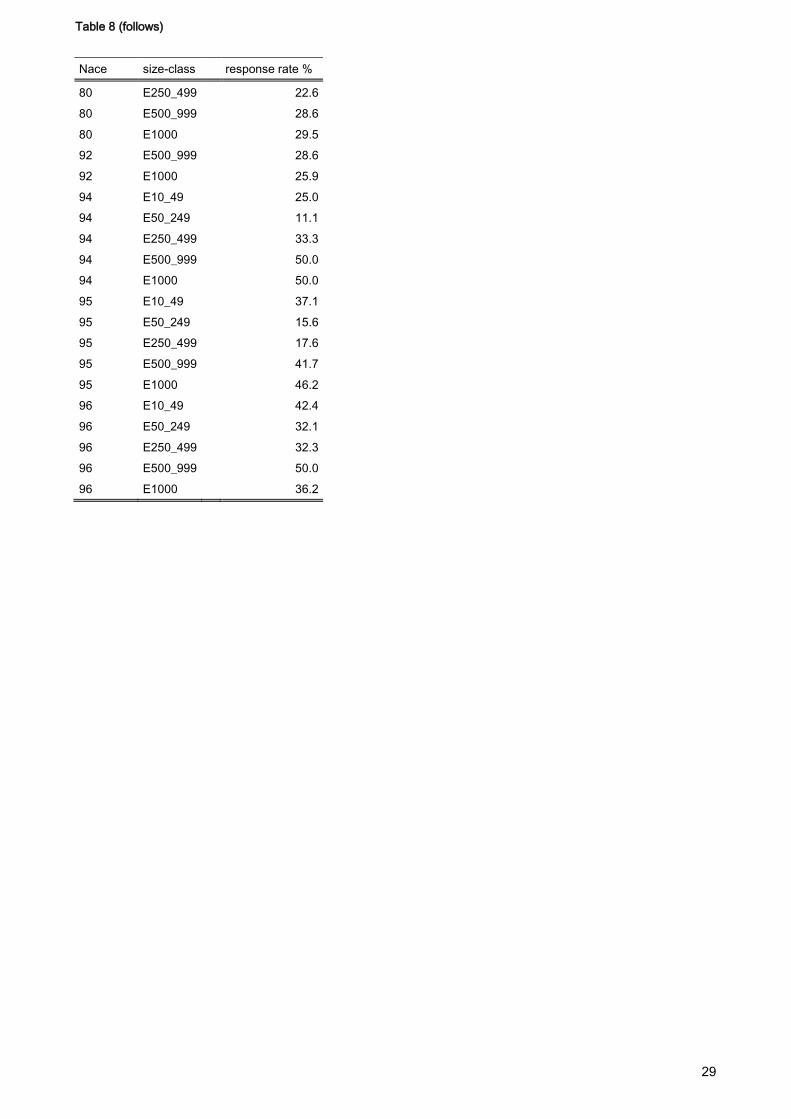
— Table 8 - Structure of Earnings Survey - year 2010 - Response rate by Nace Rev.2
division and size class
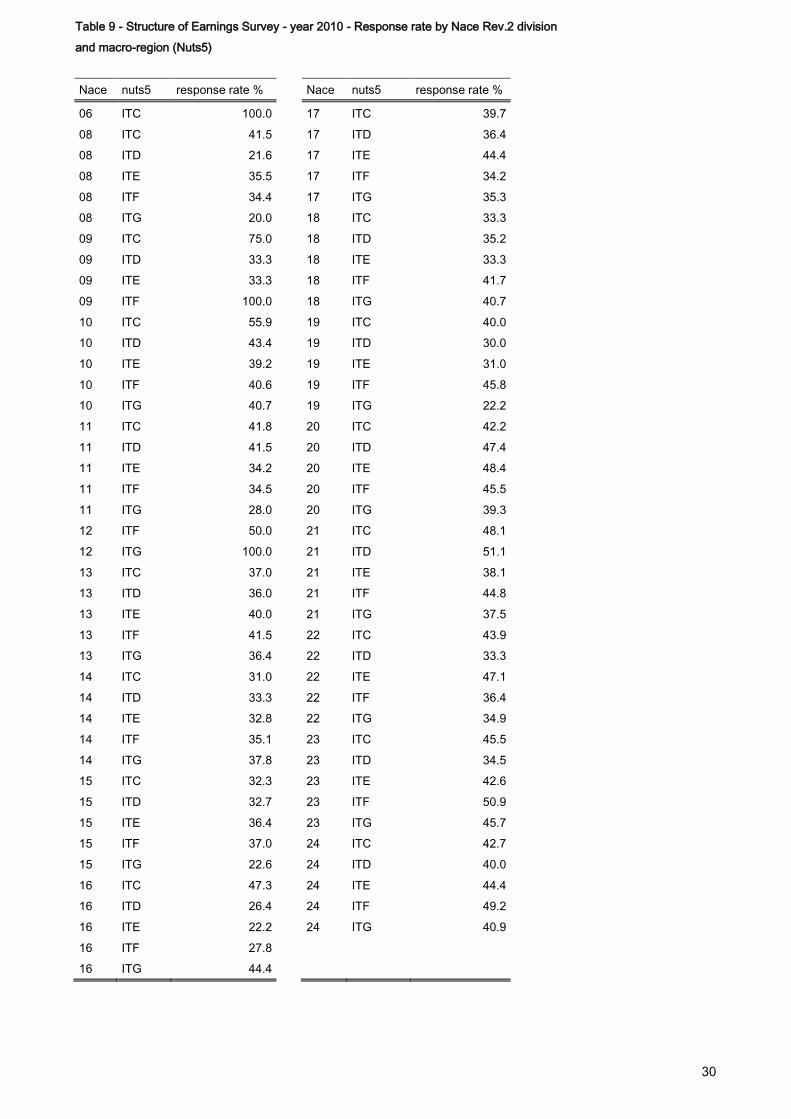
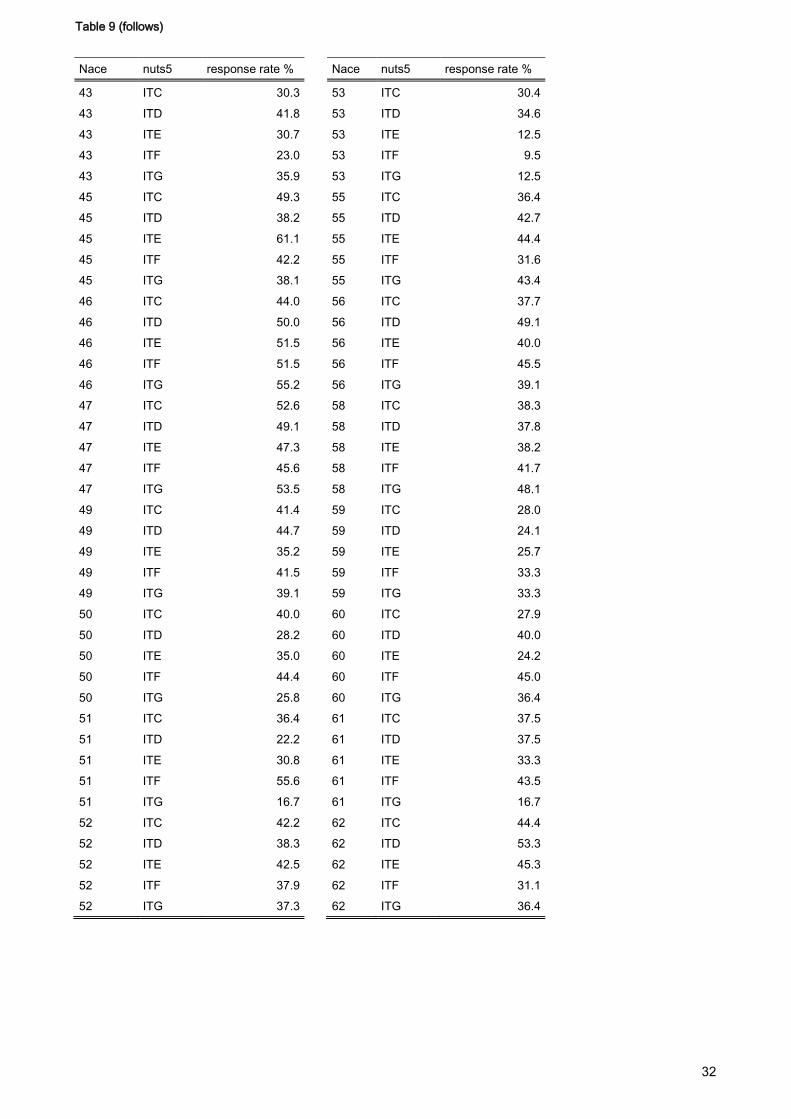
— Table 9 - Structure of Earnings Survey - year 2010 - Response rate by Nace Rev.2
division and macro-region (Nuts1)
o Item response rate
Item response rate has been calculated for interest variables: monthly hours, monthly earnings, and annual
earnings; prospect 1 shows absolute figures and percentage.
Around 15.000 (6.1%) records has one missing value in at least one of those variables. More in details, 4.7%
of the record had a missing response on the item concerning monthly hours, 5.7 on the variable monthly
earnings and of 5.9% on the variable annual earnings.

7
Prospect 1 - Interest variables monthly hours, monthly earnings, and annual earnings - Item non response:
absolute figures and percentage
Number of item non response Number of occurrences Percentage
0 246,411 97.9
1 3,105 1.2
2 1,585 0.6
3 601 0.3
number of total records 251,702 100

8
3. PUNCTUALITY AND TIMELINESS
The statistical units have been contacted by a letter, sent on the 11th of September 2011, that was an
invitation to compile the given questionnaire on line, where it could be possible to find all the necessary
instructions to proceed with sending the data via web. All the legislation and the instruments to assure the
security of the web questionnaire were given (proper user name and password). Afterwards, an official recall
has been made to the not respondents, by sending them the whole paper questionnaire as a further mode to
supply the requested data. Data collection went on till June 2012.
The delay was mainly due to several facts, first of all the complete re-ingeneration of the survey involved a
late starting of the survey; then some problems in managing a new instrument has caused, in certain
periods, some problem to be solved, that in a second session would be already performed.
In order to optimise the contacts and hence the quality of the data, special follow up of non respondent units
were implemented and a strong back office job has been assured by all the personnel involved in the survey,
in order to help out the statistical units in any conceptual or practical problem they met.
Official delivery of updated microdata to Eurostat dated September 2012.
4. ACCESSIBILITY and CLARITY
4.1. ACCESSIBILITY
Online dissemination of SES 2010 main results will be soon available in the Istat web site www.istat.it
(http://www.istat.it/it/archivio/83362). No results are sent to reporting units included in the sample. Special
anonymized microdata files for research purpose will be disseminated in the future months, according to
Reg. 831 on confidentiality.
Furthermore, as already mentioned, the data will be available through the secure Research data centre
ADELE and on the data warehouse I. Stat, that is directly available on the Istat web site www.istat.it aimed at
the production of tables with possibility of multiple choice.
4.2 CLARITY
Every way of diffusion of data, above mentioned, includes the proper information on the metadata and on the
methodological scheme and the glossary of every definition implemented by the survey.
5. COMPARABILITY
Statistical units
Reporting units consisted of enterprises and public institutions; results relate to local units. No restriction on
NACE coverage was performed. All mandatory variables have been surveyed and provided
to Eurostat.
6. COHERENCE
An analysis on links and coherence is presented in the following part, by comparing the variable ‘gross
annual earnings in the reference year’, expressed per employee, and the variable ‘wages and salaries’, per
employee, of the NA.

9
Ideally, they belong to the same statistical system internally coherent, but differences in coverage, statistical
unit used and concepts in defining the items may produce some differences. This analysis aims to identify
discrepancies in the data provided and to evaluate the causes of potential differences.
National Accounts (NA) are the implementation of comprehensive and consistent accounting techniques to
quantify the economic activity of a nation, combining data from many statistical source. As a matter of fact,
techniques of data combination and integration vary, depending on the compilation approach, the statistical
source available, the particular account in the system of accounts and the timeliness of data release and
other factors. NA provides a coherent and consistent macroeconomic picture of the economy as they broadly
present the production, income and expenditure activities of the economic actors (corporations, government,
households). All stages of production, distribution and use of income are covered, focusing on aggregates by
industry and institutional sectors. The comparison between the variable “gross annual earnings expressed
per capita” in the reference year supplied by the SES and the variable “wages and salaries per employee”
estimated by the NA is presented (Prospect 6). To have a meaningful comparison the national Account data
have been chosen to have the same coverage of the SES. The NA data refer only to regular economy and
excluding less than 10 employees firms but it has not been possible to exclude public and private institutions
units with less than 10 employees. Therefore in the last column of the prospect 6 there is the percentage
incidence of the employment related to units with less than 10 employees which can help to understand
differences deriving only from this coverage factor.
Taking into account the differences in definitions in the greater part the Nace Sections the coherence is very
high. High difference arise in Sections I, N, P, Q and S. But it must be taken into account that the Sections P
to S have a high incidence of units with less than 10 employees. In I the tips and remuneration in kind make
explain the differences. In fact National accounts labour cost aggregates, differently from the SES of
information available, include Tips and remuneration in kind, the latter is included entirely only in structural
business surveys wages and salaries. Wages and salaries in large enterprises and labour cost series include
only fiscally taxable in kind remuneration. This can heavily affect the comparability of specific industries (for
example, hotels and restaurants for tips).
10
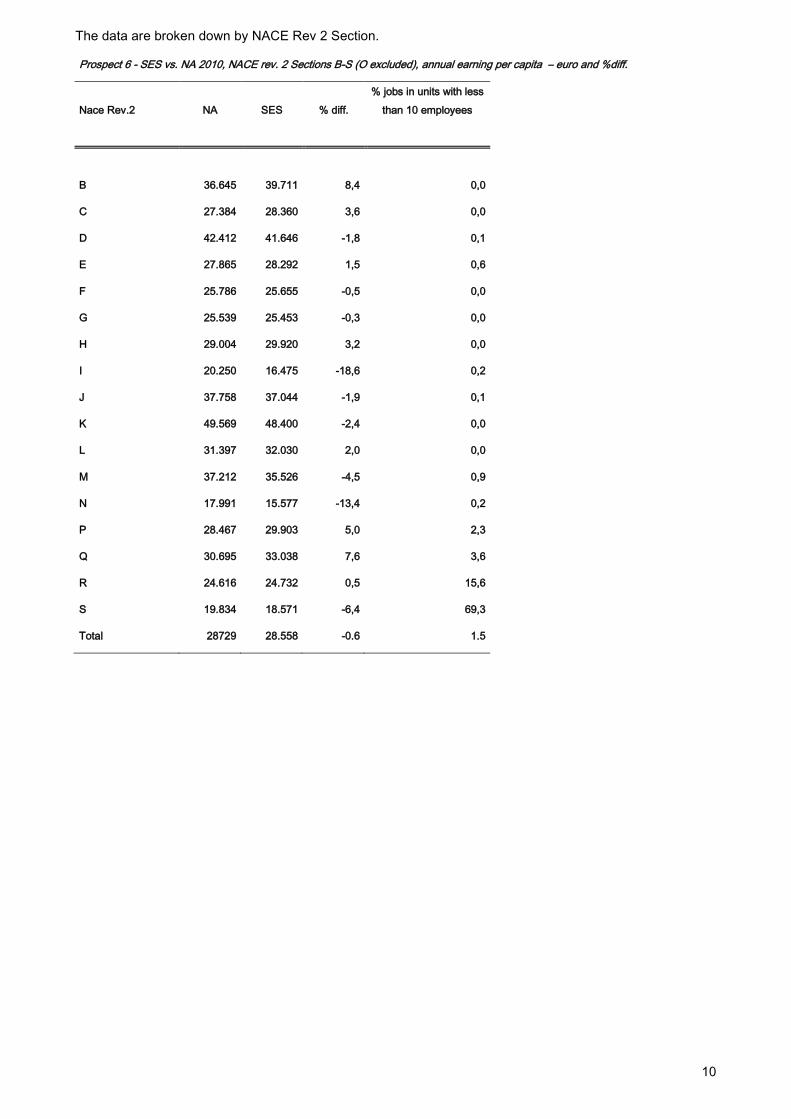
The data are broken down by NACE Rev 2 Section.
Prospect 6 - SES vs. NA 2010, NACE rev. 2 Sections B-S (O excluded), annual earning per capita – euro and %diff.
Nace Rev.2 NA SES % diff.
% jobs in units with less
than 10 employees
B 36.645 39.711 8,4 0,0
C 27.384 28.360 3,6 0,0
D 42.412 41.646 -1,8 0,1
E 27.865 28.292 1,5 0,6
F 25.786 25.655 -0,5 0,0
G 25.539 25.453 -0,3 0,0
H 29.004 29.920 3,2 0,0
I 20.250 16.475 -18,6 0,2
J 37.758 37.044 -1,9 0,1
K 49.569 48.400 -2,4 0,0
L 31.397 32.030 2,0 0,0
M 37.212 35.526 -4,5 0,9
N 17.991 15.577 -13,4 0,2
P 28.467 29.903 5,0 2,3
Q 30.695 33.038 7,6 3,6
R 24.616 24.732 0,5 15,6
S 19.834 18.571 -6,4 69,3
Total 28729 28.558 -0.6 1.5

11
PART II - SPECIFIC METHODOLOGICAL NOTES
1. GENERAL INFORMATION
Introduction
The first Structure of Earnings Survey (SES) took place for reference year 1995 covering all sectors of
economic activity from C to K of the NACE Rev. 1.
Since then, according to Council Reg.530/99 SES was carried out every 4 years, starting with year 2002 and
covering all mandatory scope. In 2002, in derogation to Council reg.530/99 the compilation of statistics was
based only on enterprises; moreover a pilot Survey on three key sectors of Italian economy, namely Textile,
Retail trade and Services to business, for micro-enterprises (business with at least 1 employee to 9
employees) has been carried out to test the burden and quality of results of the extension of SES to micro
enterprises; results for this pilot survey showed evidence of reduced quality and excessive burden for small
business.
Two mayor improvements have been implemented in the 2006 round: data referring to Local Unit and Public
Institution in sectors of economic activity (in the Nace Rev.1.2) M (education) and N (health) have been
covered using administrative, fiscal and data from other statistical archives, given by the Labour Force
Survey and the Eu_Silc survey.
With regards to the session 2010, the passage to the NACE Rev. 2 has been implemented, covering the
whole required scope from B to S (O excluded, that is optional). From a methodological point of view, a final
optimization of the integration of the different archives has been assured and finally structured in order to
estimate the final data on the sector of the public Instruction. On the other side, a strong change on the direct
survey has been implemented by establishing a on line data acquisition, together with a complete re-
engineering of the statistical process that assured a better result in terms of quantity and quality of the
supplied microdata.
Sources
The main source of data on Structure of earnings is the SES 2010 survey, based on a two stage sample
design: first stage is a sample of enterprises employing at least 10 people, afterwards a sample of
employees is drawn from each enterprises belonging to the first sample. As regards the enterprises
belonging to the register ASIA, a sample has been drawn on the enterprise with less 250 employees and a
census on the ones with more than 250 employees. As regards the public sector (excluded Section O and
P), a Census of all the institutions has been implemented.
As far as Public Institutions in Education (Section P), an integrated system of both administrative and fiscal
files) and statistical sources (Labour Force Survey and Eu_Silc) have been used.
Reference period
Structure of Earning Survey refers to year 2010 for annual variables and to Month of October 2010 for
monthly data in line with Commission Reg. 1738/2005.
Statistical unit
Reporting units consisted of enterprises; results relate to local units and to employees.

12
• Scope of the survey
SES 2010 covers all sectors of economic activity from B to S (O excluded) NACE Rev 2 for unit with at least
10 employees
Variables and definitions
Each variable is defined according to Commission Regulation 1738/2005.
Improvements proposed for Structure of Earnings Survey 2014
Further development of the use of already existing archives, both administrative and fiscal and from
statistical surveys, have been studied and planned for the next session. The aim is to optimize the
integration of other sources in order to achieve as much information as possible on the available information
on the economic variable, from administrative and fiscal data, together hast is possible to exploit about the
personal characteristics of the employees, where possible from the other statistical sources. Once all the set
of information is established, it is possible to study a new direct survey aimed only at the reaming part of the
needed information and with a much smaller sample of enterprises and institution to contact. This project
would imply a the strong reduce of the statistical burden on the units and of the cost for the institute.
Dissemination of national data on quality by Eurostat
No national data on quality shall be published without the agreement of Istat.
2. SURVEY STRATEGY
Sample design, selection procedure, stratification and size of the sample from the register
ASIA
The Structure of Earnings survey sample design is based on a two stage sample; a primary units consists of
enterprises, while final units are employees. The target population of the SES2010 was identified by three
different lists of statistical units, two of which previously gathered and one on purpose built internally in the
survey, using administrative, fiscal data and statistical archives from other surveys. In this view, the features
of the sample design will be described according to the list of units. In this regard, the sample design has
been organized in a way to have a different scheme according to the list:
a. a sample for the private enterprises with a direct survey;
b. a census on the public institutions belonging to the Istat S13 list (that included Universities), whose data
was collected by direct survey as well;
c. the sector of Education (except the Universities) were estimated only with data from other archives
(administrative, fiscal and from other surveys).
The sample design varies according the different frame with regards to the first stage, but about the second
stage the design is the same in every case. Within each statistical units, belonging to the final list, the
number of units to be included in the sample of employees was established according to a predetermined
size proportional to the size class of the enterprise (from a minimum of 10 to 200 employees). Every unit
could choose the employees to include into the sample, Istat gave proper instruction in order to guarantee
the randomization of the sample.
As regards the Business Register ASIA , the target population included 176,295 enterprises, of which 3380
belong to the size class 250 and more employees; 40,6% of employees (3,296,097) out of a total of
8,119,388 is employed in big enterprises. As far as the first stage is concerned a stratified sample of

13
enterprises with 10 to 249 employees has been designed, while a census survey of big business (with 250
and more employees) was carried out. Sampling size for enterprises with 10 to 249 employees, which fulfils
the target of 3% for the coefficient of variation of a transformed function of monthly gross earning per
employee, resulting from the multivariate allocation procedures adopted, has been increased considering the
response rate recorded in previous SES rounds. Units have been drawn according to Pareto sampling, a
specific case of probability proportional to size selection. Where possible, an increase of 17% of sample was
performed in order to prevent the negative effect of total non-response.
A further improvement has been implemented in order to guarantee, where possible, that the second stage
sample would represent the actual structure of the target population by age and gender. Indeed,
administrative fiscal files has been used as auxiliary information, so that for units with more than 100
employees the stratification by gender and age has been possible. For the units where the record linkage
with those fiscal data was robust, a list of VAT code of their employees representing their structure was
drawn and proposed to the units.
The final first level sample includes 19,535 businesses.
Expected numbers of second level units was 479,718.
The SES sample design on the public institutions consists of a census for units with 10 or more person in
employment, from the S13 list (statistical Register of the Public Institutions, including Universities). This list
includes about 1,100 units, it did not contain any information on the employment, that have been properly
estimated. During the survey 113 units of the list (about the 12%) resulted to be out of scope and therefore
were excluded.
The list of institutions belonging to the Education sector - except Universities - has been estimated to be of
13.030 statistical units by the integration of administrative and statistical archives. For the second stage
sample, the integrations with data from the statistical archives supplied by the Eu_Silc and the Labour Force
Survey has been used. Once the due number of units belonging to the second stage sample was
established, one part of the set could be fully gained by the integration among the survey microdata and the
administrative data, that allowed to estimate the full microdata on a subset of the final employees sample. At
last, on the remaining part of the sample only the quantitative variable were available, gathered by the
administrative and fiscal data, on which the imputation of item no response was run.

14
Response rate
The effective response rate taking into account only the valid returning questionnaire is about 44.5 (36.3% in
SES 2006) As regards the units belonging to the first frame ASIA, the response rate assured the 54.3% of
total expected employees (only on this frame is possible to do such evaluation, because it is the only one
supplying an a priori information on the employees).
Handling of non-response: Unit no-response
An over-sampling of 30% has been considered to prevent the negative effects of unit non-response in those
strata where there was a response rate lower than 22% in previous SES round. So as to minimize the non
response rate, special telephone lines and personalised email addresses were set up to help information
providers in answering the questions. One reminder together with a new copy of the questionnaire was sent
by mail two months later, while special follow-up of major enterprises has been carried out to ensure
minimum response in “ critical cells”; nearly all business with 250 or more employees which had not
responded received telephone calls.
A further step has been taken in this session of the SES, indeed administrative data gathered by the social
security institution (INPS) have been used to estimate the variable about earnings and hours worked of a
specific set of enterprises belonging to the register ASIA, that had been identified belonging to the most
delicate empty stratum. As second step, the remaining variables have been imputed according to the Editing
and Imputation design, considering them as item no response. The final result is: 272 firms estimated, for a
total of 7.180 employees records estimated.
Finally, reweighting with post stratification model has been adopted to deal with unit non-response
considering the employment measured by the ASIA business register (average of year 2010).
Item non response
Key variables on monthly and annual earnings have been estimated according to a deterministic model
based on auxiliary variables available from Social Security data base (year 2010); auxiliary variables
consisted in the average monthly and annual earning by position in employment in the business.
15
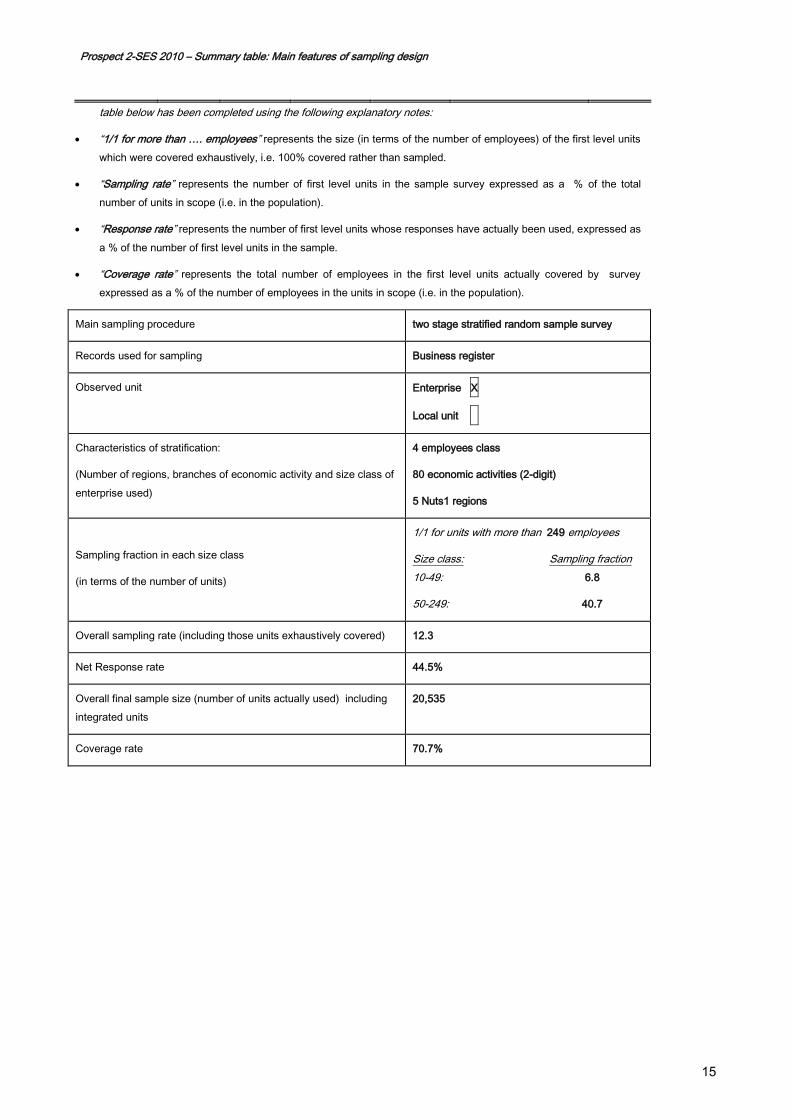
Prospect 2-SES 2010 – Summary table: Main features of sampling design
table below has been completed using the following explanatory notes:
“1/1 for more than …. employees” represents the size (in terms of the number of employees) of the first level units
which were covered exhaustively, i.e. 100% covered rather than sampled.
“Sampling rate” represents the number of first level units in the sample survey expressed as a % of the total
number of units in scope (i.e. in the population).
“Response rate” represents the number of first level units whose responses have actually been used, expressed as
a % of the number of first level units in the sample.
“Coverage rate” represents the total number of employees in the first level units actually covered by survey
expressed as a % of the number of employees in the units in scope (i.e. in the population).
Main sampling procedure two stage stratified random sample survey
Records used for sampling Business register
Observed unit Enterprise X
Local unit X
Characteristics of stratification:
(Number of regions, branches of economic activity and size class of
enterprise used)
4 employees class
80 economic activities (2-digit)
5 Nuts1 regions
Sampling fraction in each size class
(in terms of the number of units)
1/1 for units with more than 249 employees
Size class: Sampling fraction
10-49: 6.8
50-249: 40.7
Overall sampling rate (including those units exhaustively covered) 12.3
Net Response rate 44.5%
Overall final sample size (number of units actually used) including
integrated units
20,535
Coverage rate 70.7%

16
Grossing up
As regards the data covered by the direct survey, the final grossing up have been done adjusting the direct
weights in each strata have to take into account the non response pattern.
Responding units have been post-stratified and the final weight resulted from the standard procedure
implemented in Istat according to the calibration estimators. Numbers of business and employees in the
frame provided by ASIA register (with reference year 2010) have been used as auxiliary variables as regards
the private sector, numbers of business in the frame provided by the S13 list (with reference year 2010) has
have been used as auxiliary variables as regards the public sector .
Final weights guarantee the convergence of the results to the known totals of the auxiliary variables of the
following estimation domain:
— Subsection of economic activity (Nace Rev.2) and employees class (10-19, 20-49, 50-99, 100-249,
250-499, 500 and more)
— Subsection of economic activity (Nace Rev.2) and 5 macro regions (Nuts1 2005)
On the other hand, as regards the grossing up of the data related to the public part of the sector P, the
procedure is completely different from the one used in the other context. The elaboration of the final weights
at the local unit level takes into account the ones already elaborated for the same record for the survey from
which they have been extrapolated, i.e. Eu_Silc and LFS. Distinct pondering has been obtained for the local
unit (first stage sample ) and for the employees (second stage sample).

17
Structure of Earnings Survey for the year 2010
Implementation of the Commission Regulation 72/2006
and therefore Council Regulation 530/1999
and Commission Regulation 1916/2000
Quality Report – Annex I Tables
ITALY

18
Annex I
Index of the tables
ACCURACY
Table 1a - Structure of Earnings Survey, year 2010 - Monthly earnings: coefficient of variation by NACE Rev. 2 Section Table 1b - Structure of Earnings Survey, year 2010 - Hourly earnings: coefficient of variation by NACE Rev. 2 Section Table 2a - Structure of Earnings Survey, year 2010 - Monthly earnings: coefficient of variation by Size Class Table 2b - Structure of Earnings Survey, year 2010 - Hourly earnings: coefficient of variation by Size Class Table 3a - Structure of Earnings Survey, year 2010 - Monthly earnings: coefficient of variation by NUTS1 Table 3b - Structure of Earnings Survey, year 2010 - Hourly earnings: coefficient of variation by NUTS1 Table 4a - Structure of Earnings Survey, year 2010 - Monthly earnings: coefficient of variation by ISCO1 Table 4b - Structure of Earnings Survey, year 2010 - Hourly earnings: coefficient of variation by ISCO1 Table 5a - Structure of Earnings Survey, year 2010 - Monthly earnings: coefficient of variation by Age Class Table 5b - Structure of Earnings Survey, year 2010 - Hourly earnings: coefficient of variation by Age Class Table 6a - Structure of Earnings Survey, year 2010 - Monthly earnings: coefficient of variation by ISCED Table 6b - Structure of Earnings Survey, year 2010 - Hourly earnings: coefficient of variation by ISCED
RESPONSE
Table 7 - Structure of Earnings Survey - year 2010 - Response rate by Nace Rev.2 division (two digit) Table 8 - Structure of Earnings Survey - year 2010 - Response rate by Nace Rev.2 division (two digit) Table 9 - Structure of Earnings Survey - year 2010 - Response rate by Nace Rev.2 division and macro-region (Nuts one digit)

19
Table 1a - Structure of Earnings Survey, year 2010 - Monthly earnings: coefficient of variation by NACE Rev. 2 Section
Nace N
(a)
mean
(b)
Standard
Error
( c)
Coefficient
Variation
( c) /(b)
B 1,722 2897.86 70.010 2.416
C 78,318 2178.51 15.666 0.719
D 3,650 2967.20 37.691 1.270
E 8,506 2095.00 21.925 1.047
F 8,053 2107.76 36.641 1.738
G 21,362 1906.38 22.018 1.155
H 16,452 2244.42 30.642 1.365
I 7,515 1399.06 22.445 1.604
J 12,532 2759.34 39.876 1.445
K 15,788 3399.62 26.163 0.770
L 1,286 2352.43 126.903 5.395
M 14,963 2696.87 40.373 1.497
N 20,329 1319.22 20.356 1.543
P 19,010 2326.97 5.862 0.252
Q 24,993 2567.45 22.372 0.871
R 6,686 2010.52 92.264 4.589
S 3,567 1473.81 45.994 3.121
ITALY 264,732 2193.42 7.184 0.328

20
Table 1b - Structure of Earnings Survey, year 2010 - Hourly earnings: coefficient of variation by NACE Rev. 2 Section
Nace N
(a)
mean
(b)
Standard
Error
( c)
Coefficient
Variation
( c) /(b)
B 1,722 17.43 0.443 2.5390
C 78,318 12.96 0.091 0.7002
D 3,650 17.53 0.219 1.2509
E 8,506 12.84 0.125 0.9762
F 8,053 12.63 0.208 1.6464
G 21,362 11.85 0.127 1.0726
H 16,452 13.57 0.172 1.2680
I 7,515 9.46 0.131 1.3862
J 12,532 16.92 0.209 1.2372
K 15,788 21.89 0.173 0.7897
L 1,286 14.65 0.740 5.0463
M 14,963 16.35 0.233 1.4239
N 20,329 9.14 0.101 1.1100
P 19,010 22.21 0.044 0.1981
Q 24,993 16.62 0.141 0.8477
R 6,686 13.29 0.523 3.9352
S 3,567 9.43 0.242 2.5613
ITALY 264,732 14.48 0.041 0.2845
Table 2a - Structure of Earnings Survey, year 2010 - Monthly earnings: coefficient of variation by Size Class
Size
Class
N
(a)
mean
(b)
Standard
Error
( c)
Coefficient
Variation
( c) /(b)
10 - 49 62,876 1828.62 15.393 0.842
50 - 249 69,180 2134.09 18.108 0.848
250 - 499 46,112 2181.59 16.328 0.748
500 - 999 37,042 2280.07 9.001 0.395
> 1000 49,522 2590.66 8.217 0.317

21
Table 2b - Structure of Earnings Survey, year 2010 - Hourly earnings: coefficient of variation by Size Class
Nace N (a)
mean (b)
Standard Error ( c)
Coefficient Variation ( c) /(b)
10 - 49 62,876 11.32 0.090 0.793
50 - 249 69,180 15.82 0.101 0.637 250 - 499 46,112 13.54 0.088 0.648 500 - 999 37,042 14.20 0.053 0.372
> 1000 49,522 16.48 0.051 0.307
Table 3a - Structure of Earnings Survey, year 2010 - Monthly earnings: coefficient of variation by NUTS1
NUTS1 N (a)
mean (b)
Standard Error ( c)
Coefficient Variation ( c) /(b)
ITC 91938 2262.60 13.587 0.600
ITF 30552 2004.81 17.893 0.893
ITG 19907 2092.38 21.760 1.040
ITH 68196 2107.79 15.044 0.714
ITI 54139 2311.98 14.224 0.615
Table 3b - Structure of Earnings Survey, year 2010 - Hourly earnings: coefficient of variation by NUTS1
NUTS1 N (a)
mean (b)
Standard Error ( c)
Coefficient Variation ( c) /(b)
ITC 91938 14.46 0.079 0.544
ITF 30552 14.41 0.108 0.750
ITG 19907 15.15 0.130 0.861
ITH 68196 13.70 0.086 0.625
ITI 54139 15.18 0.079 0.522

22
Table 4a - Structure of Earnings Survey, year 2010 - Monthly earnings: coefficient of variation by ISCO1
ISCO1 N (a)
mean (b)
Standard Error ( c)
Coefficient Variation ( c) /(b)
1 4,109 5926.14 166.391 2.808
2 33,235 3114.43 16.314 0.524
3 46,514 2566.31 14.145 0.551
4 65,989 2114.73 9.959 0.471
5 27,634 1576.02 15.466 0.981
6 777 1570.38 51.690 3.292
7 33,928 1736.24 17.009 0.980
8 28,976 1967.68 17.703 0.900
9 23,570 1503.00 18.907 1.258
Table 4b - Structure of Earnings Survey, year 2010 - Hourly earnings: coefficient of variation by ISCO1
ISCO1 N (a)
mean (b)
Standard Error ( c)
Coefficient Variation ( c) /(b)
1 4,109 36.58 1.005 2.746
2 33,235 24.88 0.119 0.479
3 46,514 16.06 0.085 0.526
4 65,989 13.40 0.058 0.436
5 27,634 10.27 0.087 0.851
6 777 9.60 0.263 2.741
7 33,928 10.56 0.079 0.752
8 28,976 11.57 0.099 0.858
9 23,570 9.66 0.088 0.906
Table 5a - Structure of Earnings Survey, year 2010 - Monthly earnings: coefficient of variation by Age Class
Age Class
N (a)
mean (b)
Standard Error ( c)
Coefficient Variation ( c) /(b)
16 -19 542 1277.74 80.140 6.272
20 -29 29,558 1573.05 12.476 0.793
30 -39 80,879 1962.13 8.805 0.449
40 -49 88,449 2255.70 10.202 0.452
50 -59 57,473 2578.89 14.097 0.547
>59 7,831 2993.99 41.560 1.388
23
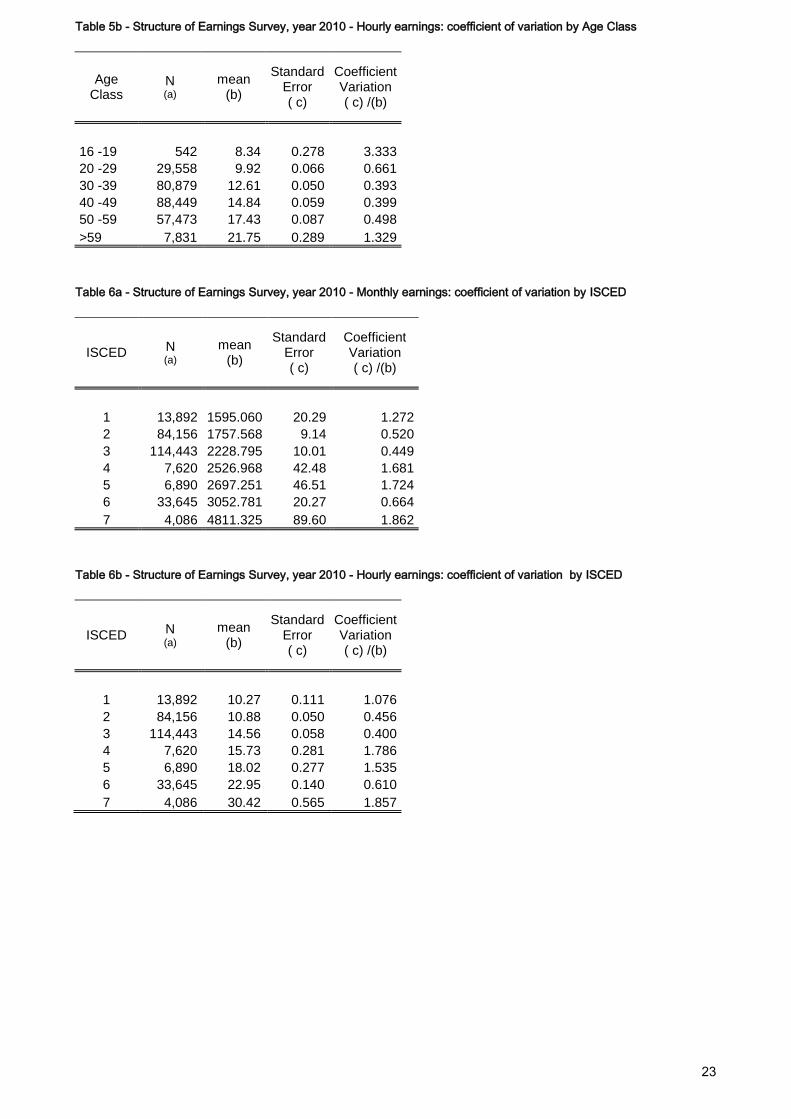
Table 5b - Structure of Earnings Survey, year 2010 - Hourly earnings: coefficient of variation by Age Class
Age Class
N (a)
mean (b)
Standard Error ( c)
Coefficient Variation ( c) /(b)
16 -19 542 8.34 0.278 3.333
20 -29 29,558 9.92 0.066 0.661
30 -39 80,879 12.61 0.050 0.393
40 -49 88,449 14.84 0.059 0.399
50 -59 57,473 17.43 0.087 0.498
>59 7,831 21.75 0.289 1.329
Table 6a - Structure of Earnings Survey, year 2010 - Monthly earnings: coefficient of variation by ISCED
ISCED N (a)
mean (b)
Standard Error ( c)
Coefficient Variation ( c) /(b)
1 13,892 1595.060 20.29 1.272
2 84,156 1757.568 9.14 0.520
3 114,443 2228.795 10.01 0.449
4 7,620 2526.968 42.48 1.681
5 6,890 2697.251 46.51 1.724
6 33,645 3052.781 20.27 0.664
7 4,086 4811.325 89.60 1.862
Table 6b - Structure of Earnings Survey, year 2010 - Hourly earnings: coefficient of variation by ISCED
ISCED N (a)
mean (b)
Standard Error ( c)
Coefficient Variation ( c) /(b)
1 13,892 10.27 0.111 1.076
2 84,156 10.88 0.050 0.456
3 114,443 14.56 0.058 0.400
4 7,620 15.73 0.281 1.786
5 6,890 18.02 0.277 1.535
6 33,645 22.95 0.140 0.610
7 4,086 30.42 0.565 1.857
24
Table 7 - Structure of Earnings Survey - year 2010 - Response rate by Nace Rev.2 division (two digit)
NACE response rate % NACE response rate %
06 33.3 51 30.2
08 31.6 52 40.0
09 44.4 53 22.6
10 45.0 55 39.9
11 37.5 56 41.7
12 50.0 58 40.0
13 38.0 59 28.5
14 33.4 60 32.6
15 32.9 61 34.2
16 32.9 62 43.3
17 38.6 63 43.6
18 36.2 64 71.5
19 35.8 65 66.3
20 44.9 66 41.4
21 44.8 68 36.4
22 39.9 69 60.3
23 43.0 70 39.7
24 43.4 71 46.5
25 44.8 72 40.3
26 39.4 73 37.5
27 43.0 74 40.7
28 50.2 75 50.0
29 44.0 77 37.9
30 28.1 78 52.4
31 32.6 79 34.6
32 37.7 80 24.7
33 35.7 81 41.8
35 49.4 82 40.0
36 45.5 85 42.3
37 31.9 86 62.4
38 37.4 87 42.9
39 33.3 88 45.0
41 38.6 90 35.5
42 39.3 91 40.7
43 31.6 92 30.8
45 46.4 93 26.3
46 49.7 94 25.0
47 49.8 95 32.5
49 40.6 96 38.5
50 34.9 Total

25
Table 8 - Structure of Earnings Survey - year 2010 - Response rate by Nace Rev.2 division (two digit)
Nace size-class response rate % Nace size-class response rate %
06 E50_249 100.0 18 E10_49 41.3
08 E10_49 29.0 18 E50_249 37.5
08 E50_249 26.3 18 E250_499 36.4
08 E250_499 43.8 18 E500_999 14.3
08 E500_999 7.1 18 E1000 32.4
08 E1000 41.2 19 E10_49 31.7
09 E10_49 66.7 19 E50_249 38.7
09 E50_249 100.0 19 E250_499 56.3
09 E500_999 33.3 19 E500_999 40.0
09 E1000 33.3 19 E1000 28.0
10 E10_49 40.7 20 E10_49 44.0
10 E50_249 46.5 20 E50_249 41.1
10 E250_499 48.0 20 E250_499 52.9
10 E500_999 54.5 20 E500_999 39.1
10 E1000 42.6 20 E1000 45.3
11 E10_49 35.1 21 E10_49 46.9
11 E50_249 37.5 21 E50_249 36.2
11 E250_499 44.8 21 E250_499 50.0
11 E500_999 42.9 21 E500_999 44.4
11 E1000 32.4 21 E1000 47.1
12 E1000 100.0 22 E10_49 35.4
13 E10_49 34.7 22 E50_249 42.6
13 E50_249 38.6 22 E250_499 40.9
13 E250_499 35.5 22 E500_999 41.4
13 E500_999 35.7 22 E1000 40.9
13 E1000 45.8 23 E10_49 39.0
14 E10_49 30.1 23 E50_249 55.1
14 E50_249 32.9 23 E250_499 47.4
14 E250_499 30.2 23 E500_999 31.0
14 E500_999 42.3 23 E1000 40.7
14 E1000 37.9 24 E10_49 39.1
15 E10_49 31.4 24 E50_249 45.0
15 E50_249 35.0 24 E250_499 54.5
15 E250_499 28.6 24 E500_999 50.0
15 E500_999 44.4 24 E1000 34.5
15 E1000 33.3 25 E10_49 42.5
16 E10_49 31.0 25 E50_249 37.1
16 E50_249 32.7 25 E250_499 45.6
16 E250_499 45.0 25 E500_999 43.8
16 E500_999 30.8 25 E1000 52.6
16 E1000 31.4 26 E10_49 38.4
17 E10_49 44.0 26 E50_249 41.4
17 E50_249 33.3 26 E250_499 40.4
17 E250_499 29.4 26 E500_999 45.2
17 E500_999 47.1 26 E1000 36.7
26
Table 8 (follows)
Nace size-class response rate % Nace size-class response rate %
17 E1000 35.6
27 E10_49 44.4 37 E10_49 35.9
27 E50_249 46.2 37 E50_249 35.5
27 E250_499 42.2 37 E250_499 23.1
27 E500_999 44.8 37 E500_999 6.7
27 E1000 35.3 37 E1000 38.9
28 E10_49 46.7 38 E10_49 34.6
28 E50_249 51.0 38 E50_249 37.0
28 E250_499 46.5 38 E250_499 38.6
28 E500_999 57.5 38 E500_999 35.1
28 E1000 52.7 38 E1000 44.2
29 E10_49 36.3 39 E10_49 31.1
29 E50_249 31.6 39 E50_249 37.5
29 E250_499 58.5 39 E250_499 25.0
29 E500_999 57.7 39 E500_999 37.5
29 E1000 63.0 39 E1000 37.5
30 E10_49 31.9 41 E10_49 36.6
30 E50_249 22.7 41 E50_249 29.1
30 E250_499 36.7 41 E250_499 47.2
30 E500_999 31.3 41 E500_999 39.1
30 E1000 16.7 41 E1000 47.4
31 E10_49 30.9 42 E10_49 39.0
31 E50_249 26.1 42 E50_249 29.8
31 E250_499 32.1 42 E250_499 41.9
31 E500_999 45.5 42 E500_999 37.5
31 E1000 36.0 42 E1000 46.3
32 E10_49 36.1 43 E10_49 32.2
32 E50_249 31.0 43 E50_249 20.6
32 E250_499 42.1 43 E250_499 41.0
32 E500_999 39.1 43 E500_999 39.1
32 E1000 42.2 43 E1000 33.3
33 E10_49 38.6 45 E10_49 47.4
33 E50_249 34.4 45 E50_249 54.3
33 E250_499 34.9 45 E250_499 40.9
33 E500_999 38.7 45 E500_999 26.9
33 E1000 27.8 45 E1000 51.9
35 E10_49 46.9 46 E10_49 43.9
35 E50_249 56.3 46 E50_249 50.9
35 E250_499 57.6 46 E250_499 51.9
35 E500_999 41.7 46 E500_999 55.6
35 E1000 43.2 46 E1000 52.6
36 E10_49 57.8 47 E10_49 43.5
36 E50_249 34.1 47 E50_249 52.8
36 E250_499 37.5 47 E250_499 50.0
36 E500_999 60.0 47 E500_999 47.2

27
Table 8 (follows)
Nace size-class response rate % Nace size-class response rate %
36 E1000 36.4 47 E1000 57.9
49 E10_49 43.3 60 E10_49 34.6
49 E50_249 31.9 60 E50_249 43.5
49 E250_499 44.1 60 E250_499 50.0
49 E500_999 25.0 60 E500_999 9.1
49 E1000 43.5 60 E1000 20.0
50 E10_49 41.5 61 E10_49 32.4
50 E50_249 37.5 61 E50_249 42.9
50 E250_499 20.0 61 E250_499 30.4
50 E500_999 42.9 61 E500_999 22.2
50 E1000 25.0 61 E1000 37.5
51 E10_49 29.4 62 E10_49 46.9
51 E50_249 29.4 62 E50_249 35.1
51 E250_499 27.3 62 E250_499 45.2
51 E500_999 44.4 62 E500_999 37.8
51 E1000 26.7 62 E1000 45.5
52 E10_49 34.9 63 E10_49 37.6
52 E50_249 44.3 63 E50_249 46.8
52 E250_499 33.3 63 E250_499 47.8
52 E500_999 29.3 63 E500_999 41.7
52 E1000 60.0 63 E1000 51.4
53 E10_49 18.3 64 E10_49 71.3
53 E50_249 29.0 64 E50_249 66.7
53 E250_499 16.7 64 E250_499 75.4
53 E500_999 16.7 64 E500_999 76.9
53 E1000 33.3 64 E1000 68.5
55 E10_49 42.0 65 E10_49 78.4
55 E50_249 34.6 65 E50_249 64.0
55 E250_499 52.5 65 E250_499 72.2
55 E500_999 22.2 65 E500_999 40.0
55 E1000 37.5 65 E1000 45.5
56 E10_49 42.3 66 E10_49 40.7
56 E50_249 37.5 66 E50_249 36.8
56 E250_499 48.4 66 E250_499 51.3
56 E500_999 48.0 66 E500_999 52.2
56 E1000 38.3 66 E1000 35.4
58 E10_49 36.5 68 E10_49 36.8
58 E50_249 45.7 68 E50_249 32.6
58 E250_499 48.1 68 E250_499 37.5
58 E500_999 38.9 68 E500_999 47.1
58 E1000 36.1 68 E1000 33.3
59 E10_49 22.4 69 E10_49 59.1
59 E50_249 23.7 69 E50_249 46.2
59 E250_499 35.7 69 E250_499 66.7
59 E500_999 50.0 69 E500_999 54.5

28
Table 8 (follows)
Nace size-class response rate % Nace size-class response rate %
59 E1000 29.6 69 E1000 74.5
70 E10_49 44.6 81 E10_49 40.3
70 E50_249 26.9 81 E50_249 33.3
70 E250_499 32.0 81 E250_499 50.8
70 E500_999 51.6 81 E500_999 48.6
70 E1000 35.6 81 E1000 43.2
71 E10_49 47.9 82 E10_49 38.3
71 E50_249 56.1 82 E50_249 37.7
71 E250_499 41.3 82 E250_499 45.5
71 E500_999 47.8 82 E500_999 50.0
71 E1000 34.5 82 E1000 32.6
72 E10_49 42.1 85 E10_49 42.6
72 E50_249 33.8 85 E50_249 39.5
72 E250_499 55.9 85 E250_499 39.3
72 E500_999 38.1 85 E500_999 48.1
72 E1000 36.4 85 E1000 44.6
73 E10_49 32.9 86 E10_49 62.0
73 E50_249 34.1 86 E50_249 66.9
73 E250_499 38.9 86 E250_499 56.9
73 E500_999 30.0 86 E500_999 59.2
73 E1000 53.8 86 E1000 62.8
74 E10_49 39.8 87 E10_49 35.8
74 E50_249 38.5 87 E50_249 49.1
74 E250_499 33.3 87 E250_499 45.2
74 E500_999 33.3 87 E500_999 51.7
74 E1000 51.6 87 E1000 42.2
75 E10_49 50.0 88 E10_49 45.4
77 E10_49 34.9 88 E50_249 45.2
77 E50_249 45.2 88 E250_499 52.5
77 E250_499 46.2 88 E500_999 31.3
77 E500_999 31.3 88 E1000 46.3
77 E1000 38.2 90 E10_49 27.1
78 E10_49 57.7 90 E50_249 36.7
78 E50_249 56.5 90 E250_499 50.0
78 E250_499 17.6 90 E500_999 25.0
78 E500_999 63.6 90 E1000 52.9
78 E1000 56.5 91 E10_49 41.5
79 E10_49 36.3 91 E50_249 40.7
79 E50_249 33.3 91 E250_499 47.1
79 E250_499 39.0 91 E500_999 60.9
79 E500_999 21.1 91 E1000 25.5
79 E1000 34.2 92 E10_49 33.7
80 E10_49 20.8 92 E50_249 23.8
80 E50_249 26.3 92 E250_499 33.3
29
Table 8 (follows)
Nace size-class response rate %
80 E250_499 22.6
80 E500_999 28.6
80 E1000 29.5
92 E500_999 28.6
92 E1000 25.9
94 E10_49 25.0
94 E50_249 11.1
94 E250_499 33.3
94 E500_999 50.0
94 E1000 50.0
95 E10_49 37.1
95 E50_249 15.6
95 E250_499 17.6
95 E500_999 41.7
95 E1000 46.2
96 E10_49 42.4
96 E50_249 32.1
96 E250_499 32.3
96 E500_999 50.0
96 E1000 36.2
30
Table 9 - Structure of Earnings Survey - year 2010 - Response rate by Nace Rev.2 division
and macro-region (Nuts5)
Nace nuts5 response rate % Nace nuts5 response rate %
06 ITC 100.0 17 ITC 39.7
08 ITC 41.5 17 ITD 36.4
08 ITD 21.6 17 ITE 44.4
08 ITE 35.5 17 ITF 34.2
08 ITF 34.4 17 ITG 35.3
08 ITG 20.0 18 ITC 33.3
09 ITC 75.0 18 ITD 35.2
09 ITD 33.3 18 ITE 33.3
09 ITE 33.3 18 ITF 41.7
09 ITF 100.0 18 ITG 40.7
10 ITC 55.9 19 ITC 40.0
10 ITD 43.4 19 ITD 30.0
10 ITE 39.2 19 ITE 31.0
10 ITF 40.6 19 ITF 45.8
10 ITG 40.7 19 ITG 22.2
11 ITC 41.8 20 ITC 42.2
11 ITD 41.5 20 ITD 47.4
11 ITE 34.2 20 ITE 48.4
11 ITF 34.5 20 ITF 45.5
11 ITG 28.0 20 ITG 39.3
12 ITF 50.0 21 ITC 48.1
12 ITG 100.0 21 ITD 51.1
13 ITC 37.0 21 ITE 38.1
13 ITD 36.0 21 ITF 44.8
13 ITE 40.0 21 ITG 37.5
13 ITF 41.5 22 ITC 43.9
13 ITG 36.4 22 ITD 33.3
14 ITC 31.0 22 ITE 47.1
14 ITD 33.3 22 ITF 36.4
14 ITE 32.8 22 ITG 34.9
14 ITF 35.1 23 ITC 45.5
14 ITG 37.8 23 ITD 34.5
15 ITC 32.3 23 ITE 42.6
15 ITD 32.7 23 ITF 50.9
15 ITE 36.4 23 ITG 45.7
15 ITF 37.0 24 ITC 42.7
15 ITG 22.6 24 ITD 40.0
16 ITC 47.3 24 ITE 44.4
16 ITD 26.4 24 ITF 49.2
16 ITE 22.2 24 ITG 40.9
16 ITF 27.8
16 ITG 44.4

31
Table 9 – (follows)
Nace nuts5 response rate % Nace nuts5 response rate %
25 ITC 51.9 33 ITC 43.8
25 ITD 42.7 33 ITD 28.9
25 ITE 42.3 33 ITE 35.7
25 ITF 39.1 33 ITF 30.2
25 ITG 45.0 33 ITG 39.4
26 ITC 46.5 35 ITC 45.9
26 ITD 34.1 35 ITD 52.3
26 ITE 33.3 35 ITE 47.5
26 ITF 39.0 35 ITF 44.2
26 ITG 43.1 35 ITG 63.3
27 ITC 45.3 36 ITC 46.9
27 ITD 41.0 36 ITD 52.1
27 ITE 43.9 36 ITE 40.0
27 ITF 40.8 36 ITF 45.9
27 ITG 43.2 36 ITG 33.3
28 ITC 54.0 37 ITC 35.0
28 ITD 53.3 37 ITD 20.7
28 ITE 48.5 37 ITE 30.0
28 ITF 52.9 37 ITF 47.6
28 ITG 33.3 37 ITG 28.6
29 ITC 42.0 38 ITC 36.5
29 ITD 44.3 38 ITD 36.5
29 ITE 49.3 38 ITE 43.3
29 ITF 37.0 38 ITF 31.6
29 ITG 50.0 38 ITG 38.5
30 ITC 34.2 39 ITC 25.0
30 ITD 16.4 39 ITD 27.3
30 ITE 28.6 39 ITE 40.0
30 ITF 35.4 39 ITF 37.5
30 ITG 21.4 39 ITG 33.3
31 ITC 39.0 41 ITC 40.4
31 ITD 34.6 41 ITD 35.1
31 ITE 25.0 41 ITE 36.7
31 ITF 31.8 41 ITF 43.4
31 ITG 31.4 41 ITG 36.2
32 ITC 36.4 42 ITC 40.0
32 ITD 37.7 42 ITD 33.9
32 ITE 41.0 42 ITE 47.5
32 ITF 36.4 42 ITF 36.4
32 ITG 38.5 42 ITG 37.0
32
Table 9 (follows)
Nace nuts5 response rate % Nace nuts5 response rate %
43 ITC 30.3 53 ITC 30.4
43 ITD 41.8 53 ITD 34.6
43 ITE 30.7 53 ITE 12.5
43 ITF 23.0 53 ITF 9.5
43 ITG 35.9 53 ITG 12.5
45 ITC 49.3 55 ITC 36.4
45 ITD 38.2 55 ITD 42.7
45 ITE 61.1 55 ITE 44.4
45 ITF 42.2 55 ITF 31.6
45 ITG 38.1 55 ITG 43.4
46 ITC 44.0 56 ITC 37.7
46 ITD 50.0 56 ITD 49.1
46 ITE 51.5 56 ITE 40.0
46 ITF 51.5 56 ITF 45.5
46 ITG 55.2 56 ITG 39.1
47 ITC 52.6 58 ITC 38.3
47 ITD 49.1 58 ITD 37.8
47 ITE 47.3 58 ITE 38.2
47 ITF 45.6 58 ITF 41.7
47 ITG 53.5 58 ITG 48.1
49 ITC 41.4 59 ITC 28.0
49 ITD 44.7 59 ITD 24.1
49 ITE 35.2 59 ITE 25.7
49 ITF 41.5 59 ITF 33.3
49 ITG 39.1 59 ITG 33.3
50 ITC 40.0 60 ITC 27.9
50 ITD 28.2 60 ITD 40.0
50 ITE 35.0 60 ITE 24.2
50 ITF 44.4 60 ITF 45.0
50 ITG 25.8 60 ITG 36.4
51 ITC 36.4 61 ITC 37.5
51 ITD 22.2 61 ITD 37.5
51 ITE 30.8 61 ITE 33.3
51 ITF 55.6 61 ITF 43.5
51 ITG 16.7 61 ITG 16.7
52 ITC 42.2 62 ITC 44.4
52 ITD 38.3 62 ITD 53.3
52 ITE 42.5 62 ITE 45.3
52 ITF 37.9 62 ITF 31.1
52 ITG 37.3 62 ITG 36.4

33
Table 9 (follows)
Nace nuts5 response rate % Nace nuts5 response rate %
63 ITC 45.3 72 ITC 37.5
63 ITD 40.7 72 ITD 46.9
63 ITE 34.1 72 ITE 42.9
63 ITF 48.5 72 ITF 32.8
63 ITG 53.6 72 ITG 40.0
64 ITC 71.2 73 ITC 39.1
64 ITD 67.4 73 ITD 41.9
64 ITE 61.7 73 ITE 27.0
64 ITF 77.7 73 ITF 35.7
64 ITG 83.7 73 ITG 46.2
65 ITC 62.5 74 ITC 31.1
65 ITD 63.2 74 ITD 47.1
65 ITE 57.1 74 ITE 50.0
65 ITF 76.5 74 ITF 43.3
65 ITG 75.0 74 ITG 33.3
66 ITC 48.1 75 ITF 100.0
66 ITD 33.3 77 ITC 40.3
66 ITE 46.3 77 ITD 37.5
66 ITF 37.5 77 ITE 39.0
66 ITG 36.1 77 ITF 29.3
68 ITC 28.9 77 ITG 44.4
68 ITD 46.7 78 ITC 57.1
68 ITE 36.0 78 ITD 48.3
68 ITF 38.7 78 ITE 47.8
68 ITG 31.4 78 ITF 46.7
69 ITC 56.1 78 ITG 68.8
69 ITD 62.2 79 ITC 28.9
69 ITE 55.3 79 ITD 32.8
69 ITF 71.9 79 ITE 42.0
69 ITG 62.5 79 ITF 35.1
70 ITC 50.0 79 ITG 39.4
70 ITD 39.6 80 ITC 20.5
70 ITE 31.9 80 ITD 22.8
70 ITF 34.2 80 ITE 27.1
70 ITG 34.4 80 ITF 25.0
71 ITC 43.5 80 ITG 36.0
71 ITD 52.8 81 ITC 46.4
71 ITE 44.4 81 ITD 41.8
71 ITF 47.4 81 ITE 36.1
71 ITG 46.5 81 ITF 39.2
81 ITG 46.7

34
Table 9 (follows)
Nace nuts5 response rate % Nace nuts5 response rate %
82 ITC 39.5 93 ITC 19.8
82 ITD 39.7 93 ITD 25.0
82 ITE 41.8 93 ITE 37.7
82 ITF 37.0 93 ITF 24.3
82 ITG 42.9 93 ITG 24.3
85 ITC 39.7 94 ITD 50.0
85 ITD 41.2 94 ITE 80.0
85 ITE 48.4 95 ITC 30.4
85 ITF 43.4 95 ITD 31.4
85 ITG 39.3 95 ITE 37.1
86 ITC 66.3 95 ITF 20.0
86 ITD 69.2 95 ITG 42.9
86 ITE 54.2 96 ITC 36.5
86 ITF 60.6 96 ITD 43.1
86 ITG 56.5 96 ITE 35.0
87 ITC 37.5 96 ITF 41.3
87 ITD 45.5 96 ITG 38.2
87 ITE 53.7
87 ITF 45.0
87 ITG 29.0
88 ITC 50.0
88 ITD 44.9
88 ITE 41.7
88 ITF 33.9
88 ITG 53.3
90 ITC 36.7
90 ITD 41.3
90 ITE 41.2
90 ITF 29.7
90 ITG 21.7
91 ITC 40.3
91 ITD 34.0
91 ITE 33.3
91 ITF 44.4
91 ITG 53.7
92 ITC 23.6
92 ITD 38.7
92 ITE 32.4
92 ITF 28.6
92 ITG 38.9