Embed Size (px)
Citation preview
April 25, 2017
Quality Program Evaluation Executive Summary
2016
1
Table of Contents
I. Clinical Quality Improvement Activities in 2016
Health and Wellness, Disease Management and Quality ImprovementPromotions
2
Care Gap Closure and Prevention 3
Preventive Services and Screenings 3
Quality of Care 3
Continuity of Care 4
Quality of Service 5
Member Experience 5o Phone Accessibility 5o Member Complaints 6
o Social Media Complaints & Executive Escalations 7
o Member Appeals 9o Member Survey Results 14
II. Trending of Clinical Quality Improvement Measure Results 18 Healthcare Effectiveness Data and Information Set (HEDIS®) 18
Patient Safety 19o Mortality Study 19o Hospital Acquired Conditions/Serious Reportable Events 20o Quality of Care Case Reviews 21o Drug Safety Alert 22o Avoidable Readmissions 23
III. Analysis and Evaluation of CQI Program Effectiveness 25
CQI Committee Structure 25
CQI Program Resources 26
CQI Work Plan Summary 26
CQI Program and Work Plan Barriers 27
Conclusions of Overall CQI Program Effectiveness 29
2
Clinical Quality Improvement Program Evaluation
The purpose of this report is to summarize quality improvement activities and initiatives, reviewsubsequent results for trends and provide an analysis of the overall effectiveness of theCompany’s Clinical Quality Improvement (CQI) Program. The CQI department annuallyevaluates CQI activities, initiatives and results. The reporting period is based upon a calendaryear, January to December. The following Medical Mutual plans are included: Medical Mutualof Ohio (MMO), Medical Health Insuring Corporation of Ohio (MHICO) and Consumers LifeInsurance Company (CLIC). These licensed entities offer a variety of plans and productsincluding: Commercial, Marketplace and Medicare Advantage (MA) with HMO, POS and/orPPO products. In 2016, all Commercial and Marketplace products were reaccredited by NCQAat the Accredited status.
All activities and initiatives within the 2016 CQI Work Plan were evaluated in this report. TheHealthcare Effectiveness Data and Information Set (HEDIS®), Consumer Assessment HealthcarePlans Survey (CAHPS), Qualified Health Plan (QHP) Enrollee Experience Survey results andother annual measurements were analyzed for trends to help assess performance in the qualityand safety of clinical care and the quality of service provided to our members. Becausedemographics and populations are similar for MMO, MHICO and CLIC members, products aretreated the same, members receive the same interventions and similar outcomes are produced.
I. Clinical Quality Improvement Activities in 2016
Health and Wellness, Disease Management and Quality Improvement
Telephonic counseling and a supply of nicotine replacement therapy at no out-of-pocketcost to members was offered through the QuitLine program.
To help members achieve personal health goals telephonic or online coaching wasoffered through the Lifestyle Coaching program.
For Commercial and Marketplace members with asthma, coronary artery disease (CAD),congestive heart failure (CHF), chronic obstructive pulmonary disease (COPD), diabetes,depression and pain, telephonic health coaching was available to members through aDisease Management program delegated to Optum Health. In 2016 the MedicareAdvantage plan included CHF, COPD and diabetes.
Maternity management was available to expectant mothers through a program delegatedto Optum Health. High risk expectant mothers were managed through Medical Mutual’sCase Management program.
In addition to the Disease Management program for diabetes, Clinical QualityImprovement (CQI) mailed an educational newsletter to members newly diagnosed withdiabetes. A multi-channel approach was used to reach members via mail or secure email.
Exercise and Weight Management:o CQI mailed a booklet on pre-diabetes to members at risk for developing
diabetes, stressing the importance of activity and nutrition.o SilverSneakers™, available to Medicare Advantage members at no cost, offered
programs for improved health and well-being with regular exercise.
3
o Participation in Weight Watchers® was financially supported for members whoincluded weight loss in their personal health goals.
Care Gap Closure and Prevention
Immunizations To facilitate accurate targeting and reporting of childhood immunizations, Medical
Mutual supplemented claims data by accessing the Ohio Department of Healthimmunization registry called the Impact Statewide Immunization Information System(ImpactSIIS). Providers are encouraged to utilize ImpactSIIS.
To encourage immunizations recommended by the Advisory Council on ImmunizationPractices (ACIP), Medical Mutual in partnership with Pfizer utilized postal mail andtelephonic messaging through TeleVox (a healthcare message delivery company) toremind parents/guardians that their child missed an immunization dose.
Preventive Services and Screenings
Members over age 40 were reminded to obtain important preventive services. TheMember Profile Outreach letter was a personal, gender and age-specific preventivescreening summary.
When speaking telephonically with members, the Care Management or Customer Careteams evaluated if members of targeted groups were receptive to receiving informationregarding the need for preventive service(s), including colorectal cancer screening(COL), cervical cancer screening (CCS) and/or breast cancer screening (BCS).
Medical Mutual identified care gaps through available data systems and conducted multi-channel outreach to members for COL, CCS and BCS.
CQI notified providers of members they were treating that had not obtainedrecommended diabetes testing or women’s health services.
o Notices on diabetic missed services were sent to primary care providers andendocrinologists.
o Notices on women’s health missed services were sent to primary care providersincluding obstetrics/gynecology providers.
Quality of Care
During 2016, the quality case tracking process changed to allow for clearer categorizationof the different types of potential quality of care issues related to deviations from thestandard of care and determination of harm to the member.
Medical Mutual utilized a vendor to assist with HEDIS medical record retrieval andabstraction, but continued in-house medical record abstraction for supplemental HEDISdata, HEDIS hybrid measures over read and specialized reviews.
Medical Mutual continued to acknowledge network clinicians who achieved recognitionstatus in the NCQA Provider Recognition Programs for high level performance inproviding patient care in:
4
o Diabetes Physician Recognition Program (DPRP), oro Patient Centered Medical Home (PCMH).
A listing of these physicians by county was made available to members in the Memberssection of the Web site and in the provider directory.
Clinical Practice Guidelines published by nationally recognized organizations wereadopted, reviewed and made available to providers through the Web site. Availableguidelines included asthma, COPD, CHF and diabetes.
Annual network provider notifications, clinical updates, corporate medical policy updatesand/or other educational items were published as required in Medical Mutual’s quarterlyMutual News provider newsletter.
Continuity of Care
Behavioral Healthcare To accurately capture behavioral health provider follow-up visits after hospitalization for
mental illness, Medical Mutual continued two important activities:o Care Management conducted post-discharge calls to all members hospitalized for
a mental health inpatient stay. Opportunities for compliance with follow-upappointments and improved care coordination were identified.
o Claims were reviewed for post-discharge follow-up visits from providers with anunknown specialty to identify visits with behavioral health specialists.
To better coordinate care and services for members with co-morbid medical andbehavioral conditions, Medical Mutual continued a dual medical/behavioral CaseManagement program to ensure that one Case Manager coordinates care for both medicaland behavioral conditions when they exist in the same member.
CQI continued to send an educational card to the parents/guardian of a newly diagnosedchild with Attention Deficit/Hyperactivity Disorder (ADHD) encouraging appropriatefollow-up care for children prescribed medications and providing information on theimportance of timely and regular follow-up care.
Medical Healthcare To better identify and coordinate care following discharge from an acute inpatient
hospitalization, Medical Mutual utilized an automated telephonic outreach program,targeting members with specific chronic conditions to identify potential transition ofcare issues and coordinate follow-up office visits as needed. Effectiveness is measuredannually via monitoring of 30-day readmission rates.
For members with asthma, to improve continuity of care following an emergencydepartment visit or discharge from the hospital, the following letters continued to besent:
o Mailing to members experiencing one of the above events encouraging a follow-up visit with their asthma care provider within 7 days
o Mailing to asthma care providers, when identified, informing them of theirpatient’s recent asthma event and encouraging them to initiate a follow-up visitwithin 7 days, if not already done
Effectiveness is measured annually via monitoring follow-up visit rates.
5
Care Navigator staff were added to assist Medicare Advantage members findproviders, get appointments, provide resources to meet socio-economic needs ofmembers, triage urgent and non-urgent referrals from home visits, etc.
Medicare Advantage members were outreached on the importance of having aprimary care physician (PCP) and on the incentive for an Annual Wellness Visit.
Quality of Service
CQI continued to manage member complaints regarding accessibility of after-hour appointments,physician office appearance or adequacy of wait times and examination room availability. Inaddition, the Quality department continued to track member quality of service complaints andcollaborated with Provider Engagement on addressing complaints related to quality issuesinvolving providers. Medical Mutual enhanced our provider network when gaps were noted andincorporated value-based measures in provider contracts with large healthcare systems andprovider groups. In 2016 a cross-functional team initiated a state-wide effort to enhance thenumber of behavioral health providers to help address gaps.
Member Experience
The Service Quality Improvement Committee (SQIC) is a cross-functional team that served tomonitor overall member experience and take action on areas of improvement; identify andprioritize service quality issues and opportunities; review and evaluate reporting on membercomplaints, appeals, surveys, email timeliness, satisfaction, privacy and cultural competence.The committee met in April and August of 2016. An evaluation of the committee resulted in arestructuring of the committee for 2017.
Phone Accessibility:
The 2015 Member Phone Access report showed the following:
Average speed to answer was 25 seconds, below the standard of 30 seconds Abandon rate was 0.78%, below the standard of 5% The overall member experience was improved by:
o Additional staffing from the Finance department for member questions on paymento Improved employee recruiting practiceso Improved new hire onboarding
The 2016 Member Phone Access report showed that 2016 goals for average speed to answer andabandon rate were exceeded. Average speed to answer was 24.4 seconds, below the goals of less than 30 seconds Abandon rate was 1.24%, below the goal of 2%
Staffing requirements were forecasted in advance of the addition of the January 1, 2016Medicare Advantage implementation to ensure that staffing levels were adequate to service all
6
members in a timely manner. In addition, there was more focus placed on self-service web toolsto provide customers with an alternative information source.
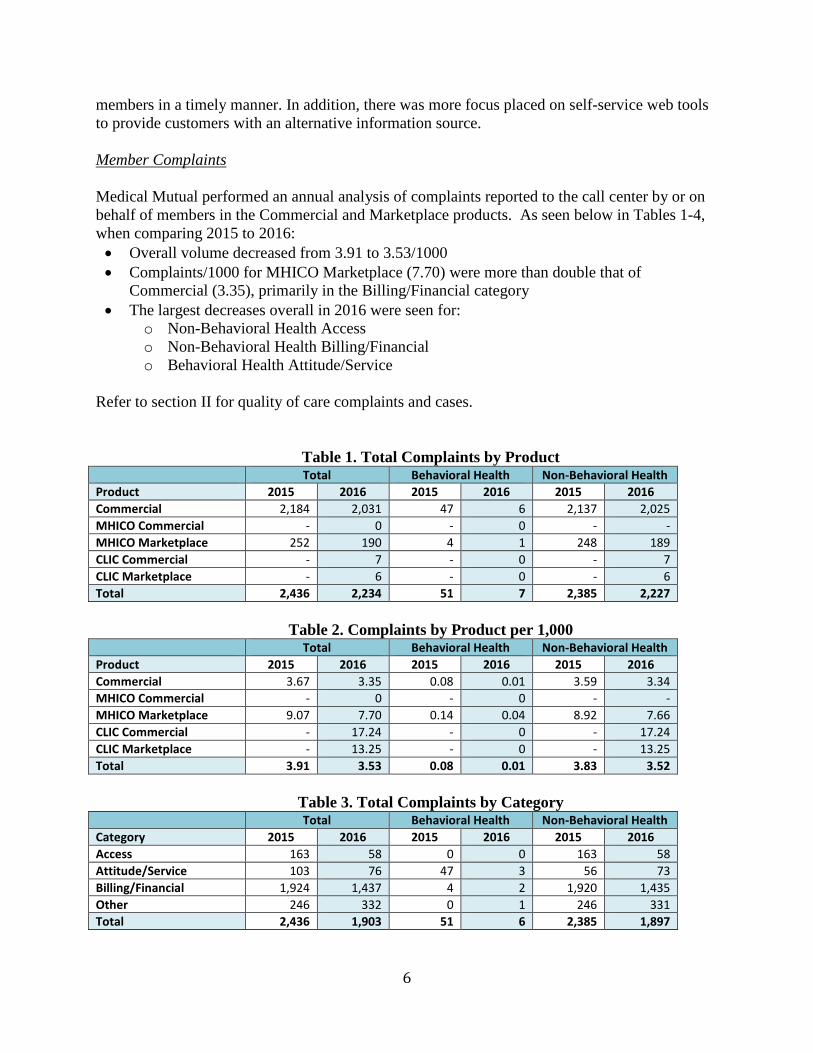
Member Complaints
Medical Mutual performed an annual analysis of complaints reported to the call center by or onbehalf of members in the Commercial and Marketplace products. As seen below in Tables 1-4,when comparing 2015 to 2016: Overall volume decreased from 3.91 to 3.53/1000 Complaints/1000 for MHICO Marketplace (7.70) were more than double that of
Commercial (3.35), primarily in the Billing/Financial category The largest decreases overall in 2016 were seen for:
o Non-Behavioral Health Accesso Non-Behavioral Health Billing/Financialo Behavioral Health Attitude/Service
Refer to section II for quality of care complaints and cases.
Table 1. Total Complaints by ProductTotal Behavioral Health Non-Behavioral Health
Product 2015 2016 2015 2016 2015 2016
Commercial 2,184 2,031 47 6 2,137 2,025
MHICO Commercial - 0 - 0 - -
MHICO Marketplace 252 190 4 1 248 189
CLIC Commercial - 7 - 0 - 7
CLIC Marketplace - 6 - 0 - 6
Total 2,436 2,234 51 7 2,385 2,227
Table 2. Complaints by Product per 1,000Total Behavioral Health Non-Behavioral Health
Product 2015 2016 2015 2016 2015 2016
Commercial 3.67 3.35 0.08 0.01 3.59 3.34
MHICO Commercial - 0 - 0 - -
MHICO Marketplace 9.07 7.70 0.14 0.04 8.92 7.66
CLIC Commercial - 17.24 - 0 - 17.24
CLIC Marketplace - 13.25 - 0 - 13.25
Total 3.91 3.53 0.08 0.01 3.83 3.52
Table 3. Total Complaints by CategoryTotal Behavioral Health Non-Behavioral Health
Category 2015 2016 2015 2016 2015 2016
Access 163 58 0 0 163 58
Attitude/Service 103 76 47 3 56 73
Billing/Financial 1,924 1,437 4 2 1,920 1,435
Other 246 332 0 1 246 331
Total 2,436 1,903 51 6 2,385 1,897
7
Table 4. Complaints by Category per 1,000Total Behavioral Health Non-Behavioral Health
Category 2015 2016 2015 2016 2015 2016
Access 0.26 0.09 0 0 0.26 0.09
Attitude/Service 0.17 0.12 0.08 0.00 0.09 0.12
Billing/Financial 3.09 2.27 0.01 0.00 3.08 2.27
Other 0.39 0.53 0 0.00 0.39 0.52
Total 3.91 3.01 0.08 0.01 3.83 3.00
POLICY HOLDERS
PRODUCT 2015 2016
COMMERCIAL 595,074 606,683
MHICO COMMERCIAL 21 46
MHICO MARKETPLACE 27,795 24,662
CLIC COMMERCIAL - 406
CLIC MARKETPLACE - 453
TOTAL 622,890 632,250
Interventions that took place in 2016 included: Customer service agent education on more consistently quoting benefits for
preventive versus medical services and for non-contracting providers System enhancements for claims mapping (ex. 3D mammogram; provider status) New remark code to track exceptions for fully insured groups
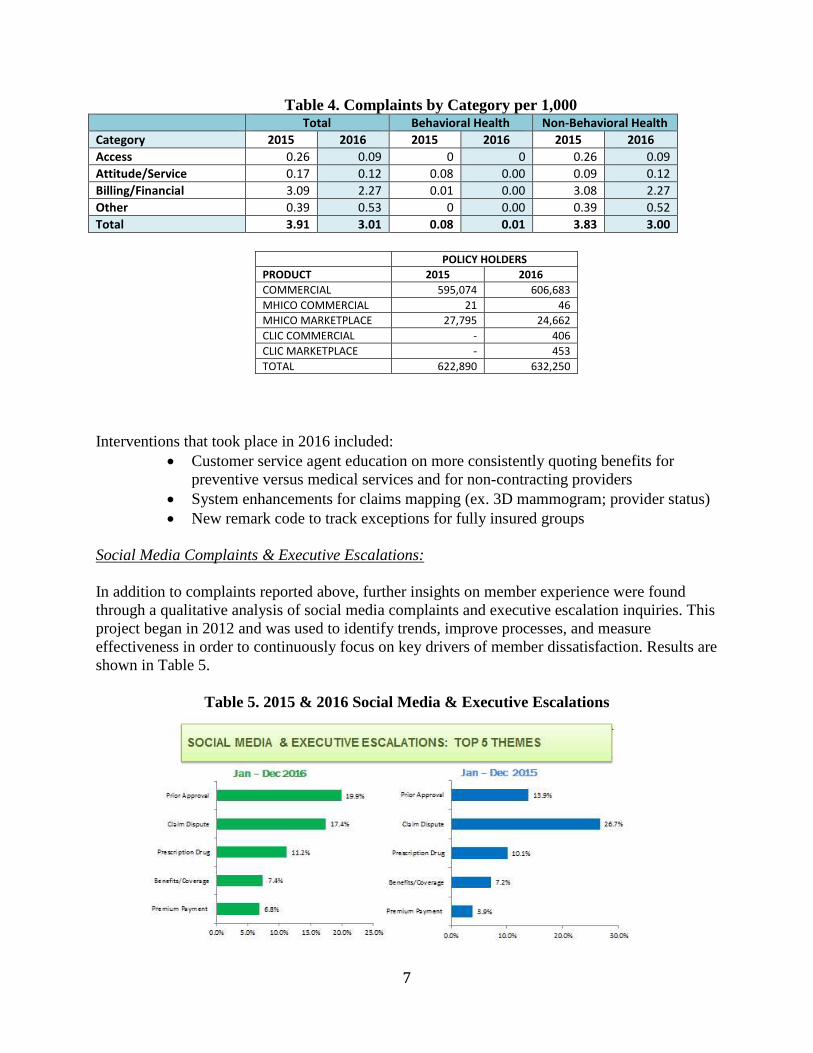
Social Media Complaints & Executive Escalations:
In addition to complaints reported above, further insights on member experience were foundthrough a qualitative analysis of social media complaints and executive escalation inquiries. Thisproject began in 2012 and was used to identify trends, improve processes, and measureeffectiveness in order to continuously focus on key drivers of member dissatisfaction. Results areshown in Table 5.
Table 5. 2015 & 2016 Social Media & Executive Escalations
8
Top three increases and issues for 2016 included: Prior Approvals: Letters and insufficient documentation to support medical
necessity Prescription Drug/Pharmacy: The primary issue for members involved prior
authorization requirements, vacation overrides, refill limitations and StepTherapy.
Premium Payments: Grace Periods - payments made after grace period2016 interventions resulting from social media inquiries and executive escalations were:
Prior Approvals:o Monthly Care Management, Pharmacy Operations and Customer Care
meetings to discuss issues involving prior approvals and pharmacy issueso Created a clinical escalation grid
Prescription Drug/Pharmacy:o Established CORS routing and escalation procedures for Pharmacy
Operations Premium Payments:
o Enhanced PNC Bank lock box rules to handle multiple paymentsubmissions
o Established a process to prevent policy terminations if premium paymentis short
Main decrease in 2016 was seen for: Claim Disputes Benefits and Coverage remained static
Interventions for Claims Decrease: Consistent agent education for quoting benefits: Preventative vs Medical,
Non-Contracting Providers System enhancements for claims mapping (ex. 3D mammogram; Provider
Status) Created remark code to track exceptions for fully insured groups
Interventions planned for 2017: Communication
o Identifying an improved process for reporting network adequacycomplaints and requests for out of network waivers
o Reviewing methods of communicating to members including letterso Establishing a new quality program to focus on active listening, taking
ownership and de-escalating Education and Training
o Continuing education for quoting benefitso Collaborating with Care Authorizations to identify opportunities to reduce
prior approval complaints Process Enhancements
9
o Exploring the possibility of extending refill look back dates for steptherapy when new drugs are added
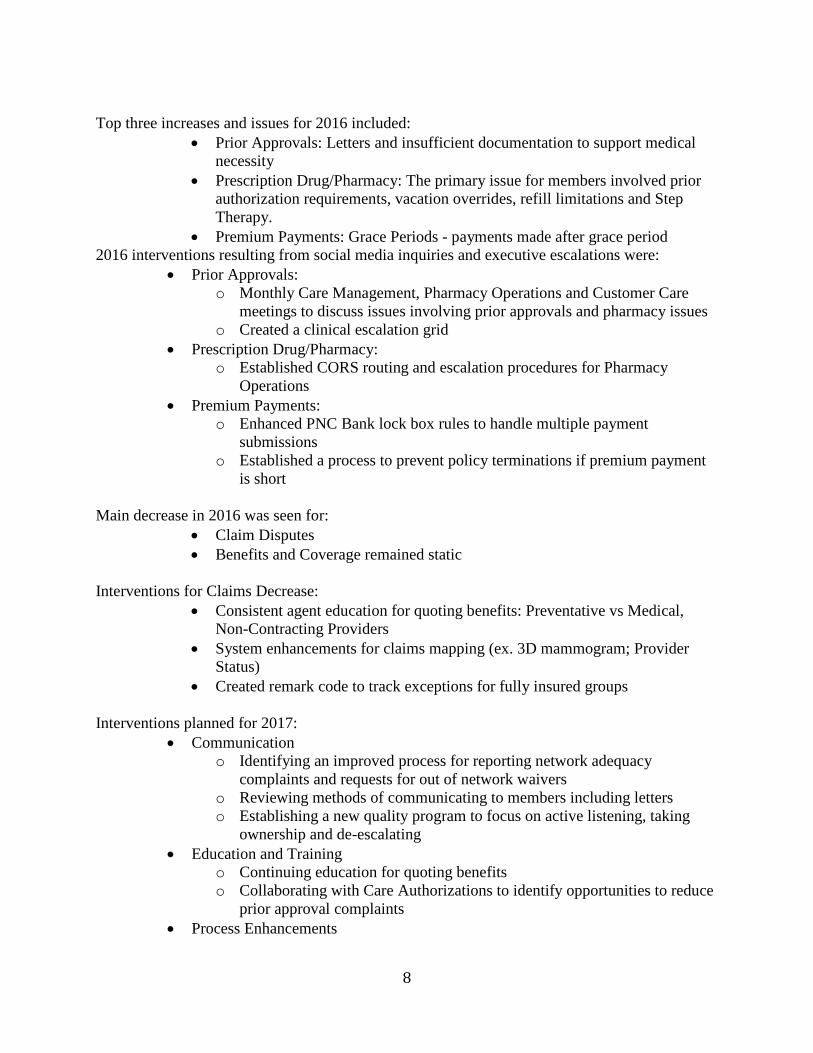
Member Appeals
Medical Mutual performs an annual analysis of member appeals for both Commercial andMarketplace. The proportion of case overturns to overall volume is displayed in Table 6.
Table 6. Appeals Volume vs. Appeals Overturned
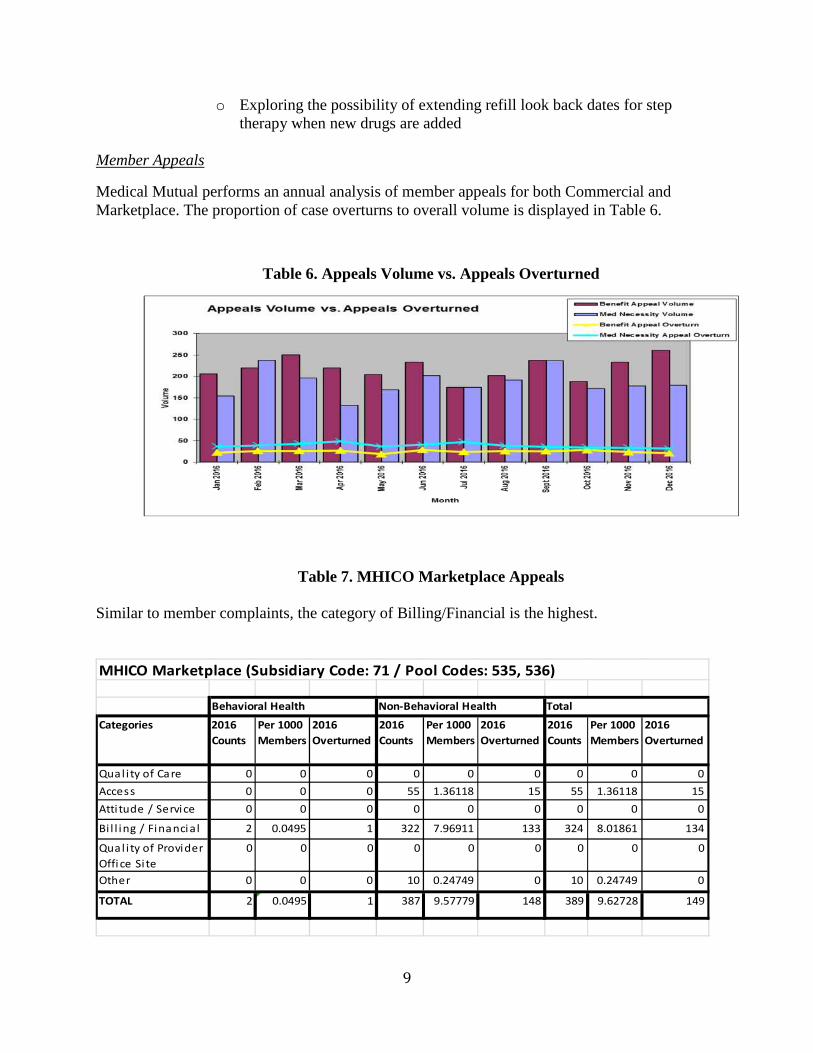
Table 7. MHICO Marketplace Appeals
Similar to member complaints, the category of Billing/Financial is the highest.
Categories 2016
Counts
Per 1000
Members
2016
Overturned
2016
Counts
Per 1000
Members
2016
Overturned
2016
Counts
Per 1000
Members
2016
Overturned
Qual i ty of Care 0 0 0 0 0 0 0 0 0
Access 0 0 0 55 1.36118 15 55 1.36118 15
Atti tude / Service 0 0 0 0 0 0 0 0 0
Bi l l ing / Financial 2 0.0495 1 322 7.96911 133 324 8.01861 134
Qual i ty of Provider
Offi ce Site
0 0 0 0 0 0 0 0 0
Other 0 0 0 10 0.24749 0 10 0.24749 0
TOTAL 2 0.0495 1 387 9.57779 148 389 9.62728 149
Behavioral Health Non-Behavioral Health Total
MHICO Marketplace (Subsidiary Code: 71 / Pool Codes: 535, 536)
10
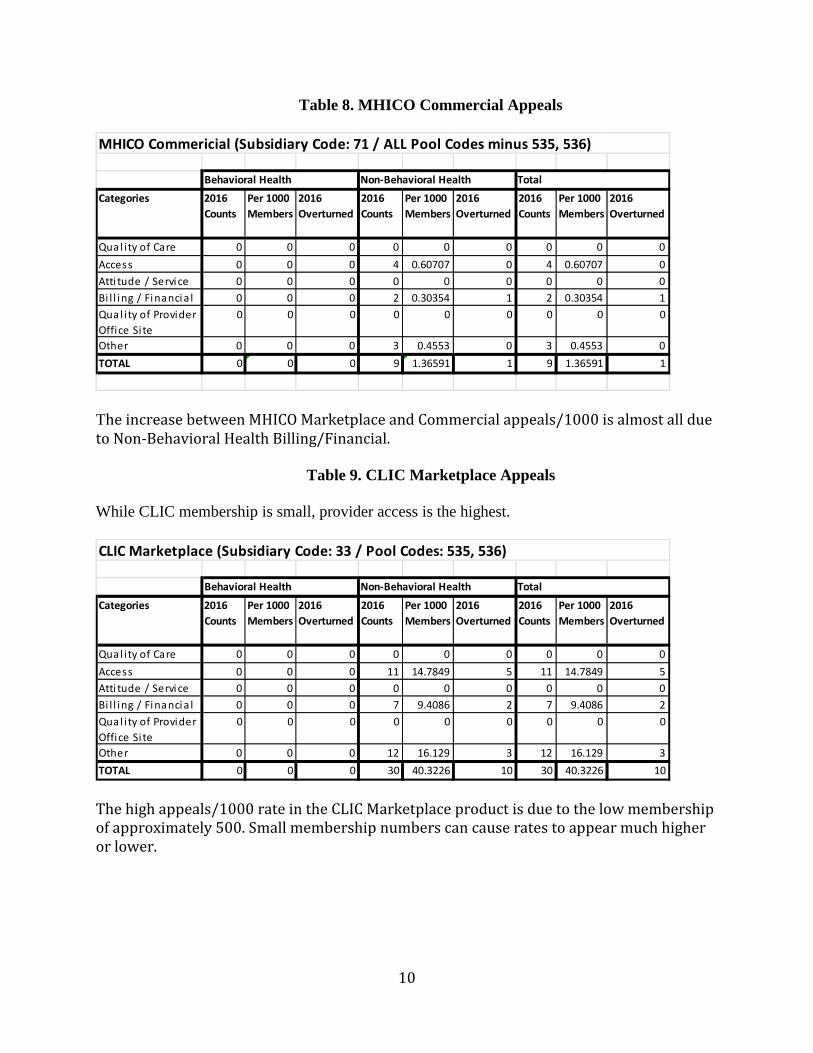
Table 8. MHICO Commercial Appeals
The increase between MHICO Marketplace and Commercial appeals/1000 is almost all dueto Non-Behavioral Health Billing/Financial.
Table 9. CLIC Marketplace Appeals
While CLIC membership is small, provider access is the highest.
The high appeals/1000 rate in the CLIC Marketplace product is due to the low membershipof approximately 500. Small membership numbers can cause rates to appear much higheror lower.
Categories 2016
Counts
Per 1000
Members
2016
Overturned
2016
Counts
Per 1000
Members
2016
Overturned
2016
Counts
Per 1000
Members
2016
Overturned
Qual i ty of Care 0 0 0 0 0 0 0 0 0
Access 0 0 0 4 0.60707 0 4 0.60707 0
Atti tude / Service 0 0 0 0 0 0 0 0 0
Bi l l ing / Financia l 0 0 0 2 0.30354 1 2 0.30354 1
Qual i ty of Provider
Office Site
0 0 0 0 0 0 0 0 0
Other 0 0 0 3 0.4553 0 3 0.4553 0
TOTAL 0 0 0 9 1.36591 1 9 1.36591 1
MHICO Commericial (Subsidiary Code: 71 / ALL Pool Codes minus 535, 536)
Behavioral Health Non-Behavioral Health Total
Categories 2016
Counts
Per 1000
Members
2016
Overturned
2016
Counts
Per 1000
Members
2016
Overturned
2016
Counts
Per 1000
Members
2016
Overturned
Qual ity of Care 0 0 0 0 0 0 0 0 0
Access 0 0 0 11 14.7849 5 11 14.7849 5
Atti tude / Service 0 0 0 0 0 0 0 0 0
Bi l l ing / Financia l 0 0 0 7 9.4086 2 7 9.4086 2
Qual i ty of Provider
Office Site
0 0 0 0 0 0 0 0 0
Other 0 0 0 12 16.129 3 12 16.129 3
TOTAL 0 0 0 30 40.3226 10 30 40.3226 10
CLIC Marketplace (Subsidiary Code: 33 / Pool Codes: 535, 536)
Behavioral Health Non-Behavioral Health Total
11
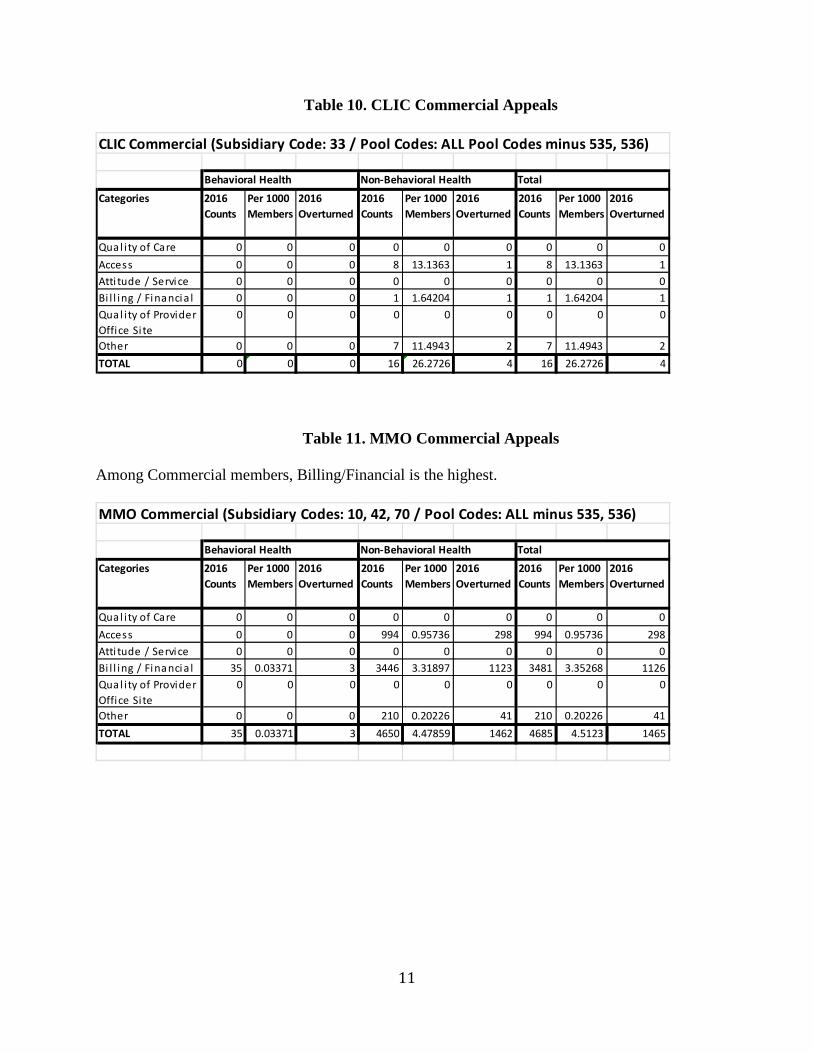
Table 10. CLIC Commercial Appeals
Table 11. MMO Commercial Appeals
Among Commercial members, Billing/Financial is the highest.
Categories 2016
Counts
Per 1000
Members
2016
Overturned
2016
Counts
Per 1000
Members
2016
Overturned
2016
Counts
Per 1000
Members
2016
Overturned
Qual ity of Care 0 0 0 0 0 0 0 0 0
Access 0 0 0 8 13.1363 1 8 13.1363 1
Atti tude / Service 0 0 0 0 0 0 0 0 0
Bi l l ing / Financia l 0 0 0 1 1.64204 1 1 1.64204 1
Qual i ty of Provider
Office Site
0 0 0 0 0 0 0 0 0
Other 0 0 0 7 11.4943 2 7 11.4943 2
TOTAL 0 0 0 16 26.2726 4 16 26.2726 4
CLIC Commercial (Subsidiary Code: 33 / Pool Codes: ALL Pool Codes minus 535, 536)
Behavioral Health Non-Behavioral Health Total
Categories 2016
Counts
Per 1000
Members
2016
Overturned
2016
Counts
Per 1000
Members
2016
Overturned
2016
Counts
Per 1000
Members
2016
Overturned
Qual i ty of Care 0 0 0 0 0 0 0 0 0
Access 0 0 0 994 0.95736 298 994 0.95736 298
Atti tude / Service 0 0 0 0 0 0 0 0 0
Bi l l ing / Financia l 35 0.03371 3 3446 3.31897 1123 3481 3.35268 1126
Qual i ty of Provider
Office Site
0 0 0 0 0 0 0 0 0
Other 0 0 0 210 0.20226 41 210 0.20226 41
TOTAL 35 0.03371 3 4650 4.47859 1462 4685 4.5123 1465
Behavioral Health Non-Behavioral Health Total
MMO Commercial (Subsidiary Codes: 10, 42, 70 / Pool Codes: ALL minus 535, 536)
12
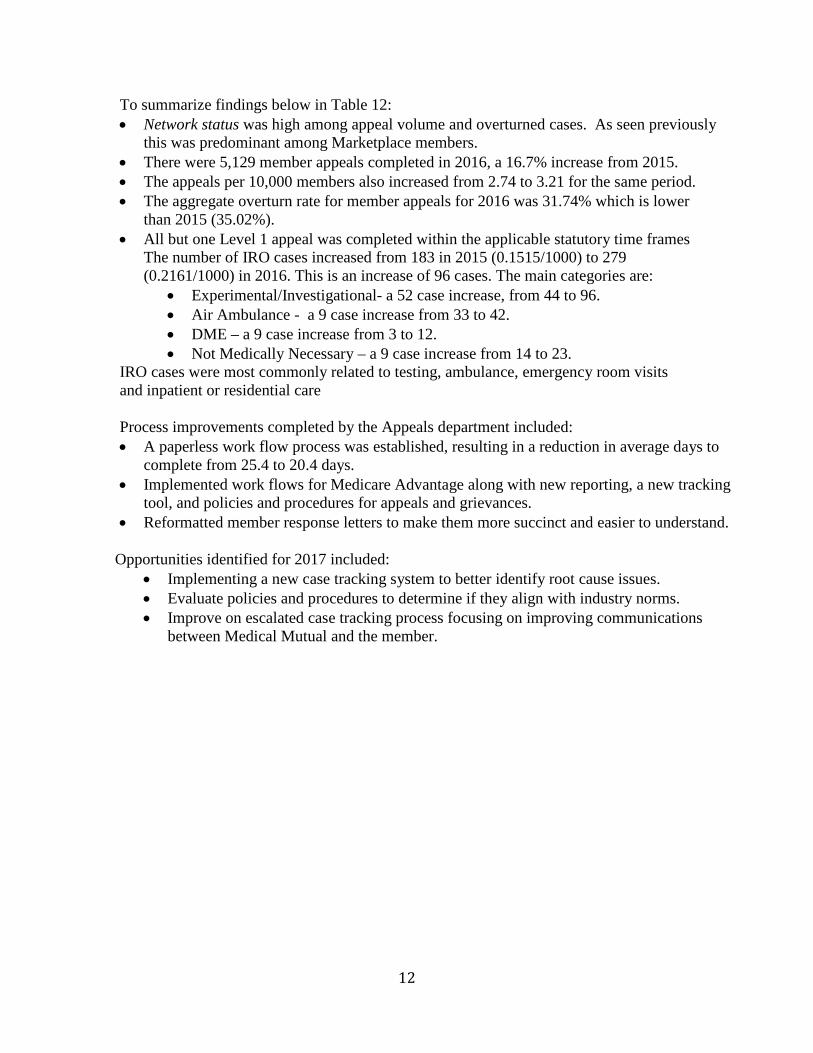
To summarize findings below in Table 12: Network status was high among appeal volume and overturned cases. As seen previously
this was predominant among Marketplace members. There were 5,129 member appeals completed in 2016, a 16.7% increase from 2015. The appeals per 10,000 members also increased from 2.74 to 3.21 for the same period. The aggregate overturn rate for member appeals for 2016 was 31.74% which is lower
than 2015 (35.02%). All but one Level 1 appeal was completed within the applicable statutory time frames
The number of IRO cases increased from 183 in 2015 (0.1515/1000) to 279(0.2161/1000) in 2016. This is an increase of 96 cases. The main categories are:
Experimental/Investigational- a 52 case increase, from 44 to 96. Air Ambulance - a 9 case increase from 33 to 42. DME – a 9 case increase from 3 to 12. Not Medically Necessary – a 9 case increase from 14 to 23.
IRO cases were most commonly related to testing, ambulance, emergency room visitsand inpatient or residential care
Process improvements completed by the Appeals department included: A paperless work flow process was established, resulting in a reduction in average days to
complete from 25.4 to 20.4 days. Implemented work flows for Medicare Advantage along with new reporting, a new tracking
tool, and policies and procedures for appeals and grievances. Reformatted member response letters to make them more succinct and easier to understand.
Opportunities identified for 2017 included: Implementing a new case tracking system to better identify root cause issues. Evaluate policies and procedures to determine if they align with industry norms. Improve on escalated case tracking process focusing on improving communications
between Medical Mutual and the member.
13
Table 12. Appeal Activity and Overturn Rates January – December 2016
ODI: Ohio Department of InsuranceIRO: Independent Review Organization
2016 Case Count Overturned % Overturned
First Level Internal Appeals
Administrative 18 18 100.00
Benefit Exclusions 739 167 22.60
Benefit Limitations 674 130 19.29
Network Status 1,002 287 28.64
Policy Rescission 0 0 0.00
Benefits Sub Total 2,433 602 24.74
Medical Necessity 2,068 815 39.41
Total 4,501 1,417 31.48
Second Level Internal Appeals
Administrative 23 23 100.00
Benefit Exclusions 35 4 11.43
Benefit Limitations 17 2 11.76
Network Status 85 16 18.82
Policy Rescission 0 0 0.00
Benefits Sub Total 160 45 28.13
Medical Necessity 147 39 26.53
Total 307 84 27.36
ODI Contractual
Administrative 3 3 100.00
Benefit Exclusions 6 0 0.00
Benefit Limitations 14 0 0.00
Network Status 19 3 15.79
Benefits Sub Total 42 6 14.29
External Reviews (IRO)
State 145 44 30.34
Federal 75 18 24.00
Expedited 2 2 100.00
Administrative Resolution 57 57 100.00
Total 279 121 43.37
All Appeals 5,129 1,628 31.74
14
Member Survey Results
CAHPS:
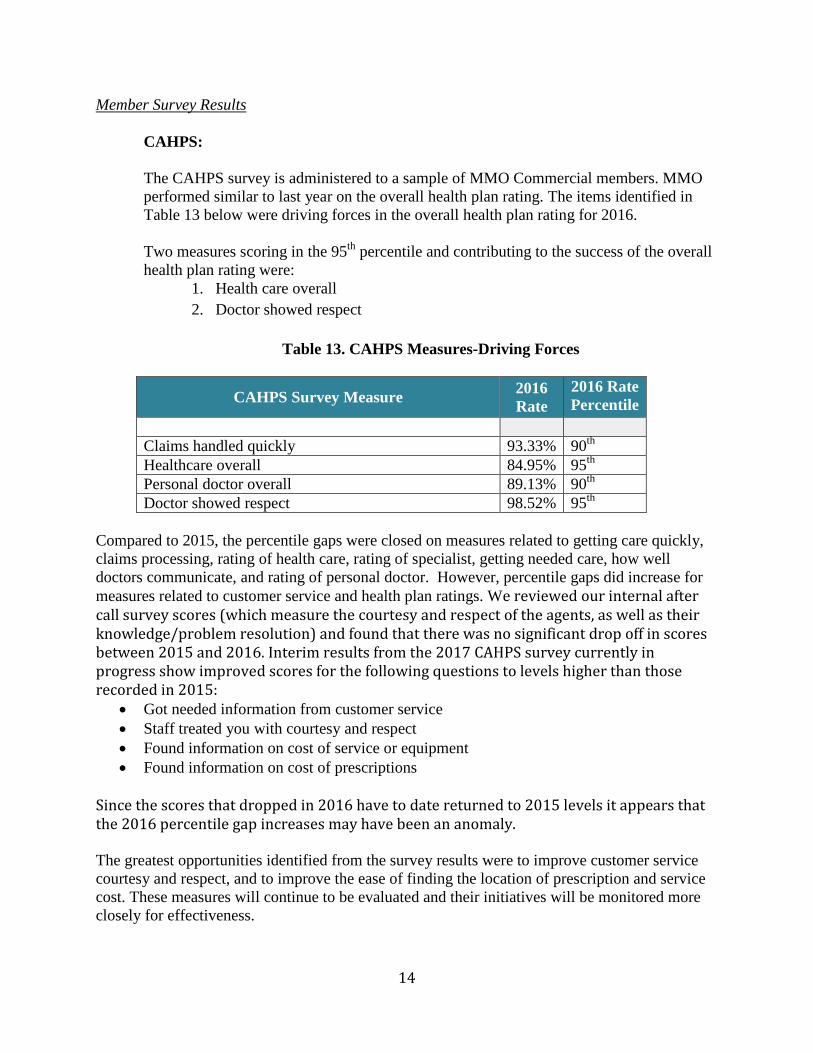
The CAHPS survey is administered to a sample of MMO Commercial members. MMOperformed similar to last year on the overall health plan rating. The items identified inTable 13 below were driving forces in the overall health plan rating for 2016.
Two measures scoring in the 95th percentile and contributing to the success of the overallhealth plan rating were:
1. Health care overall
2. Doctor showed respect
Table 13. CAHPS Measures-Driving Forces
CAHPS Survey Measure2016Rate
2016 RatePercentile
Claims handled quickly 93.33% 90th
Healthcare overall 84.95% 95th
Personal doctor overall 89.13% 90th
Doctor showed respect 98.52% 95th
Compared to 2015, the percentile gaps were closed on measures related to getting care quickly,claims processing, rating of health care, rating of specialist, getting needed care, how welldoctors communicate, and rating of personal doctor. However, percentile gaps did increase formeasures related to customer service and health plan ratings. We reviewed our internal aftercall survey scores (which measure the courtesy and respect of the agents, as well as theirknowledge/problem resolution) and found that there was no significant drop off in scoresbetween 2015 and 2016. Interim results from the 2017 CAHPS survey currently inprogress show improved scores for the following questions to levels higher than thoserecorded in 2015:
Got needed information from customer service Staff treated you with courtesy and respect Found information on cost of service or equipment Found information on cost of prescriptions
Since the scores that dropped in 2016 have to date returned to 2015 levels it appears thatthe 2016 percentile gap increases may have been an anomaly.
The greatest opportunities identified from the survey results were to improve customer servicecourtesy and respect, and to improve the ease of finding the location of prescription and servicecost. These measures will continue to be evaluated and their initiatives will be monitored moreclosely for effectiveness.
15
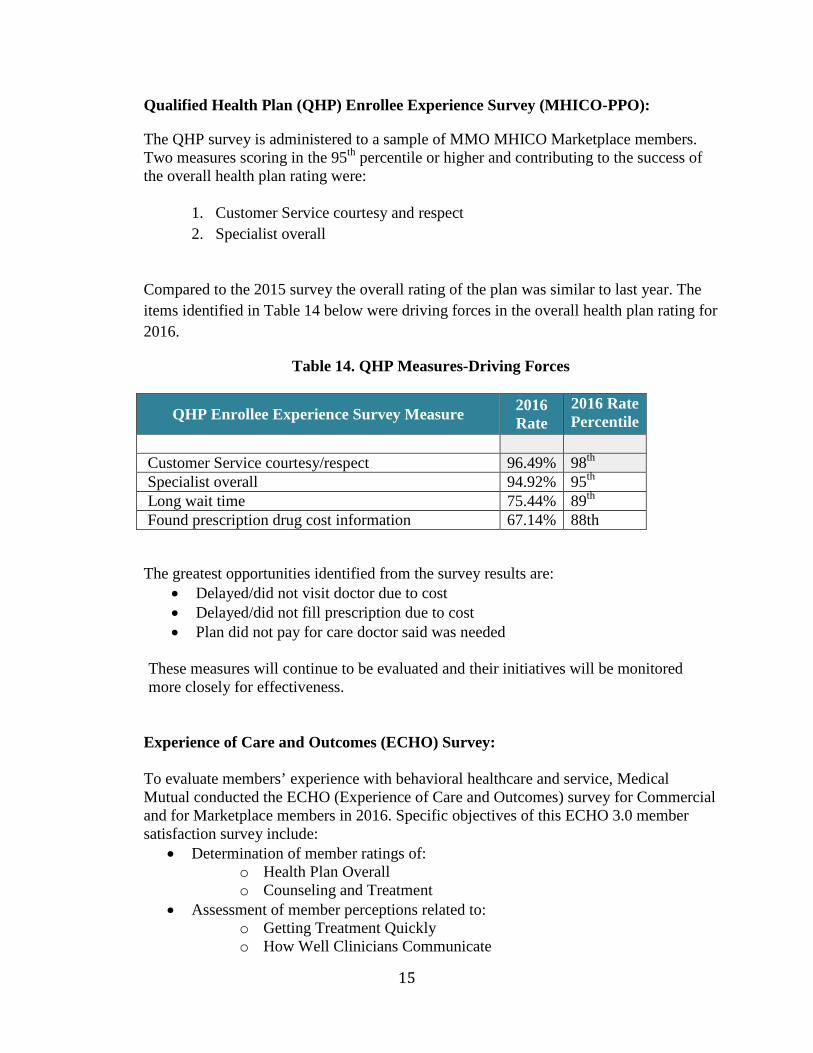
Qualified Health Plan (QHP) Enrollee Experience Survey (MHICO-PPO):
The QHP survey is administered to a sample of MMO MHICO Marketplace members.Two measures scoring in the 95th percentile or higher and contributing to the success ofthe overall health plan rating were:
1. Customer Service courtesy and respect
2. Specialist overall
Compared to the 2015 survey the overall rating of the plan was similar to last year. The
items identified in Table 14 below were driving forces in the overall health plan rating for
2016.
Table 14. QHP Measures-Driving Forces
QHP Enrollee Experience Survey Measure2016Rate
2016 RatePercentile
Customer Service courtesy/respect 96.49% 98th
Specialist overall 94.92% 95th
Long wait time 75.44% 89th
Found prescription drug cost information 67.14% 88th
The greatest opportunities identified from the survey results are: Delayed/did not visit doctor due to cost Delayed/did not fill prescription due to cost Plan did not pay for care doctor said was needed
These measures will continue to be evaluated and their initiatives will be monitoredmore closely for effectiveness.
Experience of Care and Outcomes (ECHO) Survey:
To evaluate members’ experience with behavioral healthcare and service, MedicalMutual conducted the ECHO (Experience of Care and Outcomes) survey for Commercialand for Marketplace members in 2016. Specific objectives of this ECHO 3.0 membersatisfaction survey include:
Determination of member ratings of:o Health Plan Overallo Counseling and Treatment
Assessment of member perceptions related to:o Getting Treatment Quicklyo How Well Clinicians Communicate
16
o Perceived Improvemento Getting Treatment and Information from Plano Information About Treatment Options
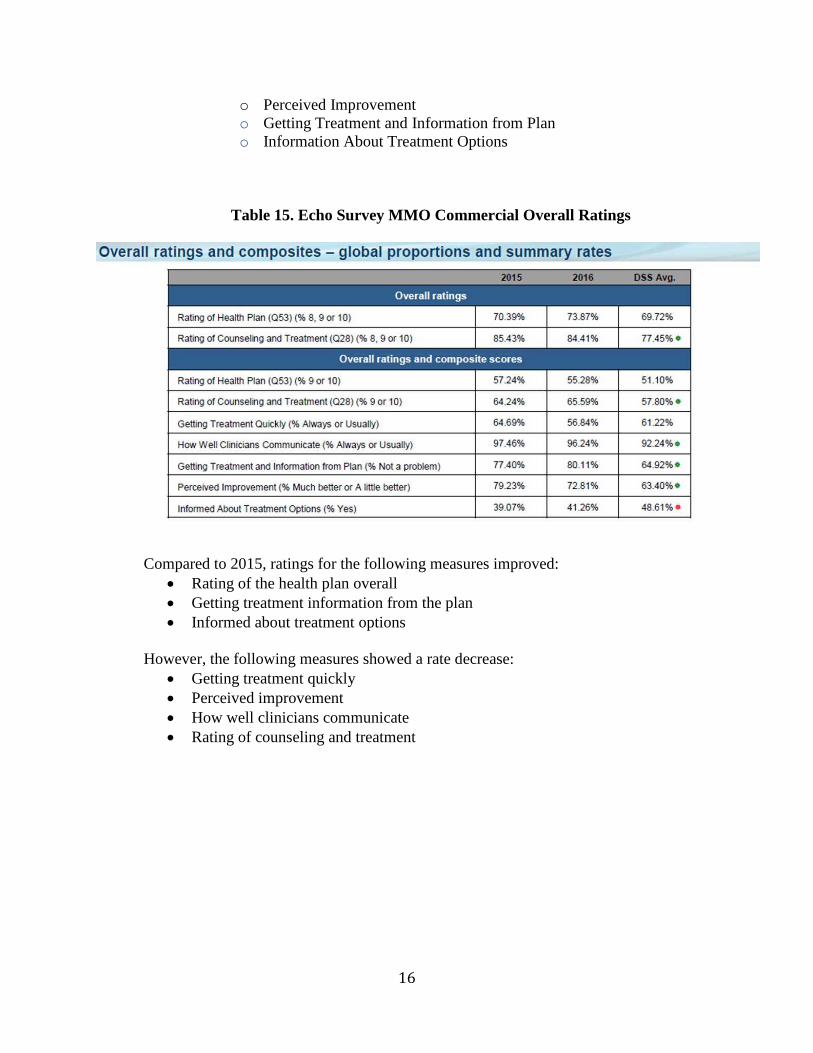
Table 15. Echo Survey MMO Commercial Overall Ratings
Compared to 2015, ratings for the following measures improved: Rating of the health plan overall Getting treatment information from the plan Informed about treatment options
However, the following measures showed a rate decrease: Getting treatment quickly Perceived improvement How well clinicians communicate Rating of counseling and treatment
17
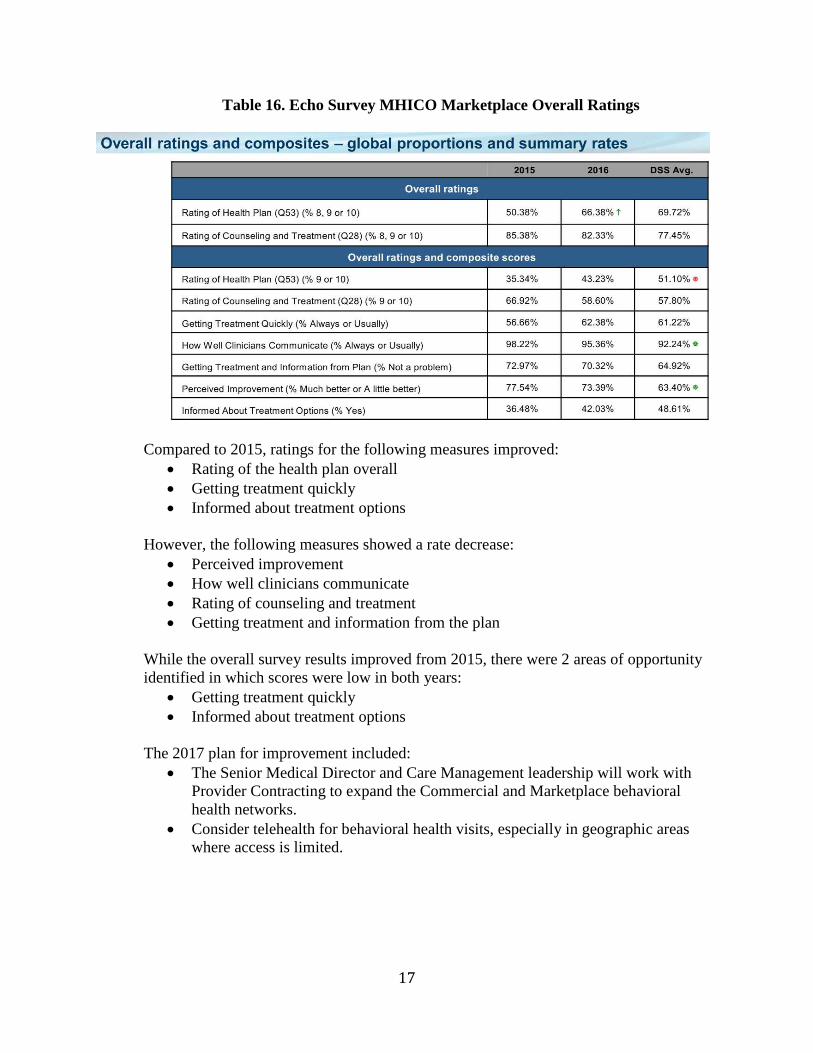
Table 16. Echo Survey MHICO Marketplace Overall Ratings
Compared to 2015, ratings for the following measures improved: Rating of the health plan overall Getting treatment quickly Informed about treatment options
However, the following measures showed a rate decrease: Perceived improvement How well clinicians communicate Rating of counseling and treatment Getting treatment and information from the plan
While the overall survey results improved from 2015, there were 2 areas of opportunityidentified in which scores were low in both years:
Getting treatment quickly Informed about treatment options
The 2017 plan for improvement included: The Senior Medical Director and Care Management leadership will work with
Provider Contracting to expand the Commercial and Marketplace behavioralhealth networks.
Consider telehealth for behavioral health visits, especially in geographic areaswhere access is limited.
18
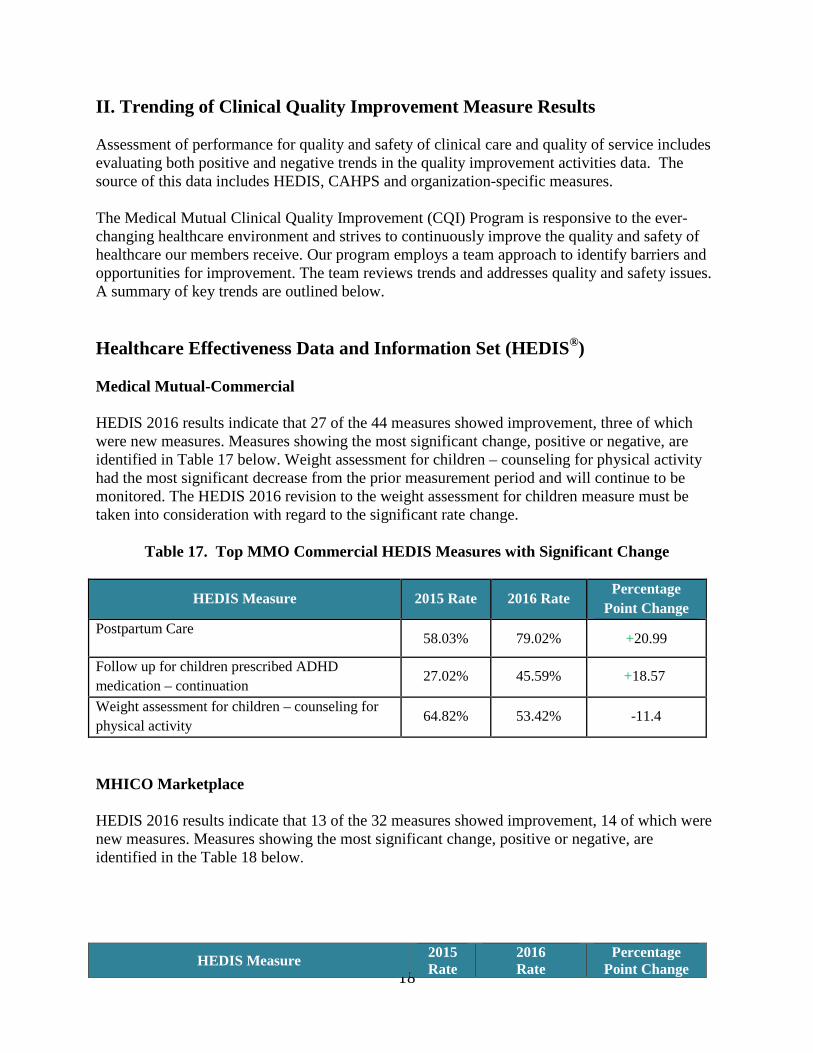
II. Trending of Clinical Quality Improvement Measure Results
Assessment of performance for quality and safety of clinical care and quality of service includesevaluating both positive and negative trends in the quality improvement activities data. Thesource of this data includes HEDIS, CAHPS and organization-specific measures.
The Medical Mutual Clinical Quality Improvement (CQI) Program is responsive to the ever-changing healthcare environment and strives to continuously improve the quality and safety ofhealthcare our members receive. Our program employs a team approach to identify barriers andopportunities for improvement. The team reviews trends and addresses quality and safety issues.A summary of key trends are outlined below.
Healthcare Effectiveness Data and Information Set (HEDIS®)
Medical Mutual-Commercial
HEDIS 2016 results indicate that 27 of the 44 measures showed improvement, three of whichwere new measures. Measures showing the most significant change, positive or negative, areidentified in Table 17 below. Weight assessment for children – counseling for physical activityhad the most significant decrease from the prior measurement period and will continue to bemonitored. The HEDIS 2016 revision to the weight assessment for children measure must betaken into consideration with regard to the significant rate change.
Table 17. Top MMO Commercial HEDIS Measures with Significant Change
HEDIS Measure 2015 Rate 2016 RatePercentage
Point Change
Postpartum Care58.03% 79.02% +20.99
Follow up for children prescribed ADHD
medication – continuation27.02% 45.59% +18.57
Weight assessment for children – counseling for
physical activity64.82% 53.42% -11.4
MHICO Marketplace
HEDIS 2016 results indicate that 13 of the 32 measures showed improvement, 14 of which werenew measures. Measures showing the most significant change, positive or negative, areidentified in the Table 18 below.
HEDIS Measure2015Rate
2016Rate
PercentagePoint Change
19
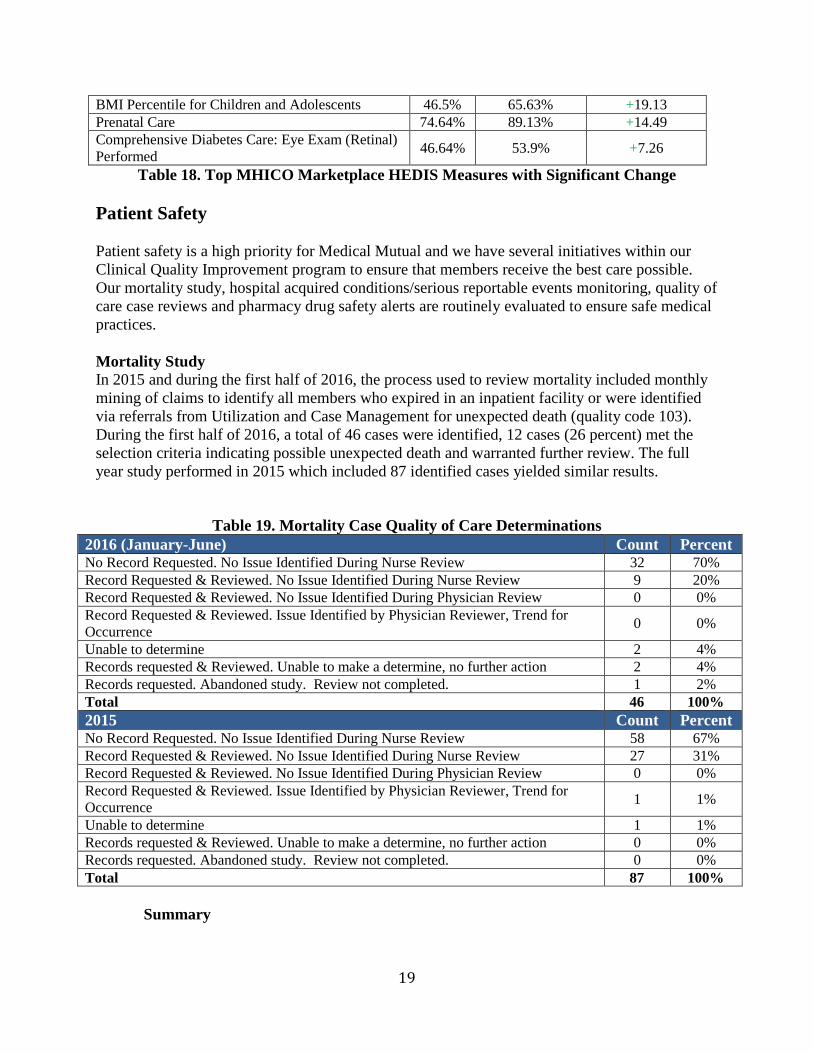
Table 18. Top MHICO Marketplace HEDIS Measures with Significant Change
Patient Safety
Patient safety is a high priority for Medical Mutual and we have several initiatives within ourClinical Quality Improvement program to ensure that members receive the best care possible.Our mortality study, hospital acquired conditions/serious reportable events monitoring, quality ofcare case reviews and pharmacy drug safety alerts are routinely evaluated to ensure safe medicalpractices.
Mortality StudyIn 2015 and during the first half of 2016, the process used to review mortality included monthlymining of claims to identify all members who expired in an inpatient facility or were identifiedvia referrals from Utilization and Case Management for unexpected death (quality code 103).During the first half of 2016, a total of 46 cases were identified, 12 cases (26 percent) met theselection criteria indicating possible unexpected death and warranted further review. The fullyear study performed in 2015 which included 87 identified cases yielded similar results.
Table 19. Mortality Case Quality of Care Determinations2016 (January-June) Count PercentNo Record Requested. No Issue Identified During Nurse Review 32 70%Record Requested & Reviewed. No Issue Identified During Nurse Review 9 20%Record Requested & Reviewed. No Issue Identified During Physician Review 0 0%Record Requested & Reviewed. Issue Identified by Physician Reviewer, Trend forOccurrence
0 0%
Unable to determine 2 4%Records requested & Reviewed. Unable to make a determine, no further action 2 4%Records requested. Abandoned study. Review not completed. 1 2%Total 46 100%
2015 Count PercentNo Record Requested. No Issue Identified During Nurse Review 58 67%Record Requested & Reviewed. No Issue Identified During Nurse Review 27 31%Record Requested & Reviewed. No Issue Identified During Physician Review 0 0%Record Requested & Reviewed. Issue Identified by Physician Reviewer, Trend forOccurrence
1 1%
Unable to determine 1 1%Records requested & Reviewed. Unable to make a determine, no further action 0 0%Records requested. Abandoned study. Review not completed. 0 0%Total 87 100%
Summary
BMI Percentile for Children and Adolescents 46.5% 65.63% +19.13Prenatal Care 74.64% 89.13% +14.49Comprehensive Diabetes Care: Eye Exam (Retinal)Performed
46.64% 53.9% +7.26
20
There were no quality of care issues identified contributing to death in 41 (90%) ofthe 46 cases reviewed, either upon review of available information (32 cases) orfollowing review of additional information (9 cases).
In 5 cases the nurse was unable to make a determination because there wasinsufficient information.
No cases warranted referral to a physician reviewer or the CQI Committee.
Review of the study methodology identified barriers to accurate identification of unexpecteddeath and potential quality of care issues. Study results consistently showed that most deaths inthe inpatient setting as identified by claims were not unexpected and/or not related to quality ofcare. Therefore, the study methodology was revised to focus on review of potential quality ofcare issues discovered during utilization/case management review of inpatient cases that resultedin unexpected death, as well as all deaths classified as a Serious Reportable Event. Cases are nowreferred to CQI when they are identified by Care Management via entry of a designated qualitycode in Focus Manager. This change allows CQI to focus their review on only unexpected deathsin which quality of care may have been a factor, improves the timeliness of case identificationand review, and improves the accuracy of provider/facility tracking and trending. Duringredesign of the study methodology during the second half of 2016, review of all unexpecteddeaths with potential quality of care concerns was continued via review of cases referred fromCare Management with quality code 103 and assignment of the appropriate quality level (SeeTable 20).
Hospital Acquired Conditions/Serious Reportable Events
In 2015 and during the first half of 2016, occurrences of CMS Hospital Acquired Conditions(HACs) were identified via a monthly claims report. Comparison of 2015 and 2016 studyfindings revealed:
There were no “Never Events” (wrong site, wrong patient or wrong proceduresurgery) in 2015 or 2016.
The number of claims with a code corresponding to the following HACs increasedsignificantly from 2015 to 2016 due to the implementation of ICD-10, which includeda larger number of more specific codes:
o 3.17- Manifestations of poor glycemic controlo 3.22- Iatrogenic pneumothorax
Despite the increase in volume, review did not reveal a corresponding increase in theincidence of quality of care issues relating to these HACs.
In June of 2016, the HAC study methodology was re-evaluated. It was determined that manyHAC cases identified via claims did not meet the CMS definition of the HAC (e.g., the reasonfor poor glycemic control was related to steroids instead of substandard care). It was determinedthat claims mining was not an effective method of identifying true HAC occurrences. Therefore,the study methodology was revised to review each quality referral to identify those that meet thecriteria of a HAC. New quality codes corresponding to each HAC were added to Focus Manager,which are entered into the case by the quality team when a HAC is identified. This change allows
21
the quality team to identify all HACs and SREs based on evidence-based standards of care ratherthan relying on claims coding. This methodology also improves the timeliness of HACidentification, thereby facilitating action when required and improving the accuracy of facilitytracking and trending to identify outliers. Beginning in 2017, tracking and trending of HACs willbe accomplished through assignment of the new quality level and point system described in thefollowing section of this report for a more systematic and standardized process.
Quality of Care Case Reviews
An analysis of our quality tracking process revealed several barriers to effective trending of qualityissues, including lack of severity adjustment, exclusion of quality of service issues and a manualtracking process. This led to the development of a new quality level rating system implemented onJune 1, 2016 that permitted a more holistic approach to reviewing quality cases (Table 20). Qualityof service points were also included. Automated monthly reports began in 2017 and continue tobe refined. These reports will identify providers who reach or exceed the maximum pointthreshold which may prompt a focused review of these cases.
Table 20. Quality of Care Rating System
Quality Level Description
Quality of Service0.5 point
Member complaint about the quality of service.
Quality of Care Level 11 point
Treatment/practice determined to be within established practice standards. Otherproviders would have managed care in a similar manner. Practice pattern unlikelyto warrant future focused review. No harm or minimal harm to member.
Quality of Care Level 22 points
Questionable treatment/practice not clearly within established practice standards.Variance did not affect member outcome (no harm).
Quality of Care Level 33 points
Treatment/practice not within established practice standards. Other providerslikely to have managed the care differently; minimal harm to the member.Minimal harm is defined as an event that negatively affects the member, such asrequiring an extended length of stay or additional treatment, but withoutpermanent injury or disability.
Quality of Care Level 46 points
Treatment/practice not within established practice standards. High harm withnegative outcome to the member. High harm is defined as an event resulting indeath, permanent disability, and permanent loss of function or permanent changein quality of life.
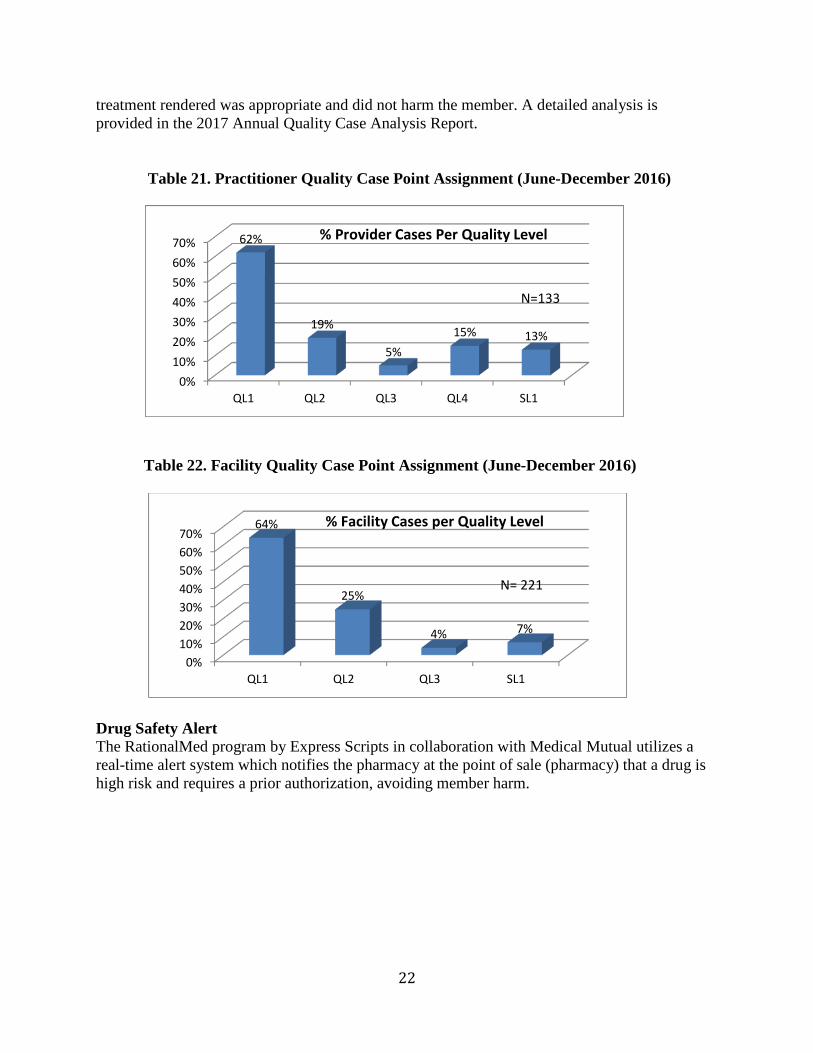
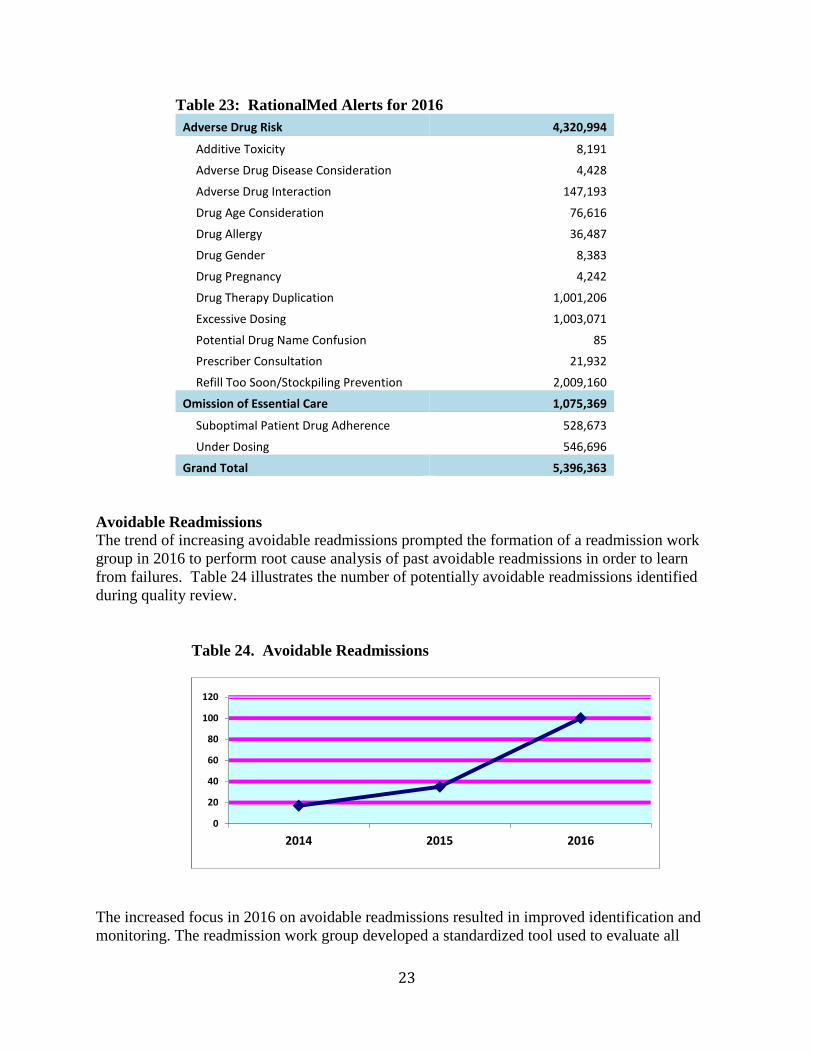
As seen in Tables 21 and 22, the vast majority of the cases from June – December 2016 for bothpractitioners and facilities were categorized as Quality Levels 1 or 2, indicating that the
22
treatment rendered was appropriate and did not harm the member. A detailed analysis isprovided in the 2017 Annual Quality Case Analysis Report.
Table 21. Practitioner Quality Case Point Assignment (June-December 2016)
Table 22. Facility Quality Case Point Assignment (June-December 2016)
Drug Safety AlertThe RationalMed program by Express Scripts in collaboration with Medical Mutual utilizes areal-time alert system which notifies the pharmacy at the point of sale (pharmacy) that a drug ishigh risk and requires a prior authorization, avoiding member harm.
0%
10%
20%
30%
40%
50%
60%
70%
QL1 QL2 QL3 QL4 SL1
62%
19%
5%
15% 13%
% Provider Cases Per Quality Level
N=133
0%
10%
20%
30%
40%
50%
60%
70%
QL1 QL2 QL3 SL1
64%
25%
4% 7%
% Facility Cases per Quality Level
N= 221
23
Table 23: RationalMed Alerts for 2016
Adverse Drug Risk 4,320,994
Additive Toxicity 8,191
Adverse Drug Disease Consideration 4,428
Adverse Drug Interaction 147,193
Drug Age Consideration 76,616
Drug Allergy 36,487
Drug Gender 8,383
Drug Pregnancy 4,242
Drug Therapy Duplication 1,001,206
Excessive Dosing 1,003,071
Potential Drug Name Confusion 85
Prescriber Consultation 21,932
Refill Too Soon/Stockpiling Prevention 2,009,160
Omission of Essential Care 1,075,369
Suboptimal Patient Drug Adherence 528,673
Under Dosing 546,696
Grand Total 5,396,363
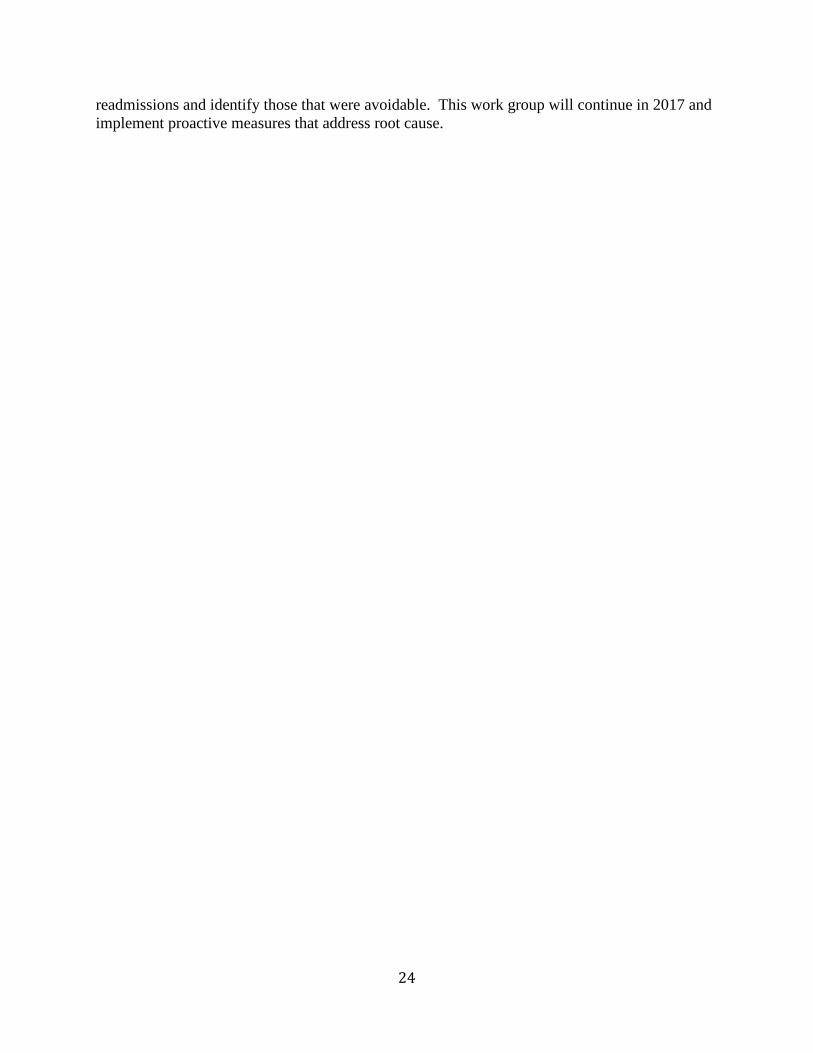
Avoidable ReadmissionsThe trend of increasing avoidable readmissions prompted the formation of a readmission workgroup in 2016 to perform root cause analysis of past avoidable readmissions in order to learnfrom failures. Table 24 illustrates the number of potentially avoidable readmissions identifiedduring quality review.
Table 24. Avoidable Readmissions
The increased focus in 2016 on avoidable readmissions resulted in improved identification andmonitoring. The readmission work group developed a standardized tool used to evaluate all
0
20
40
60
80
100
120
2014 2015 2016
24
readmissions and identify those that were avoidable. This work group will continue in 2017 andimplement proactive measures that address root cause.
25
III. Analysis and Evaluation of CQI Program Effectiveness
Components of the CQI Program include committees, resources, and a work plan. Each of thesecomponents is summarized below. Once the performance and evaluation of each component issummarized, an overall program effectiveness is described in our conclusion.
CQI Committee Structure
The Chief Medical Officer (CMO) chaired the CQI committee and was responsible to lead thedesign and implementation of the CQI program.
Responsibilities for various clinical functions inherent in the CQI Program were delegated asappropriate, to clinical staff and designated physicians. In 2016, eight clinical committeessupported the CQI program, with the CMO or a Senior Medical Director chairing eachcommittee. The structure and need for each committee was developed based on the ability of theCQI Program to functionally operate within Medical Mutual. Committee members werecomprised of network providers from various clinical specialties.
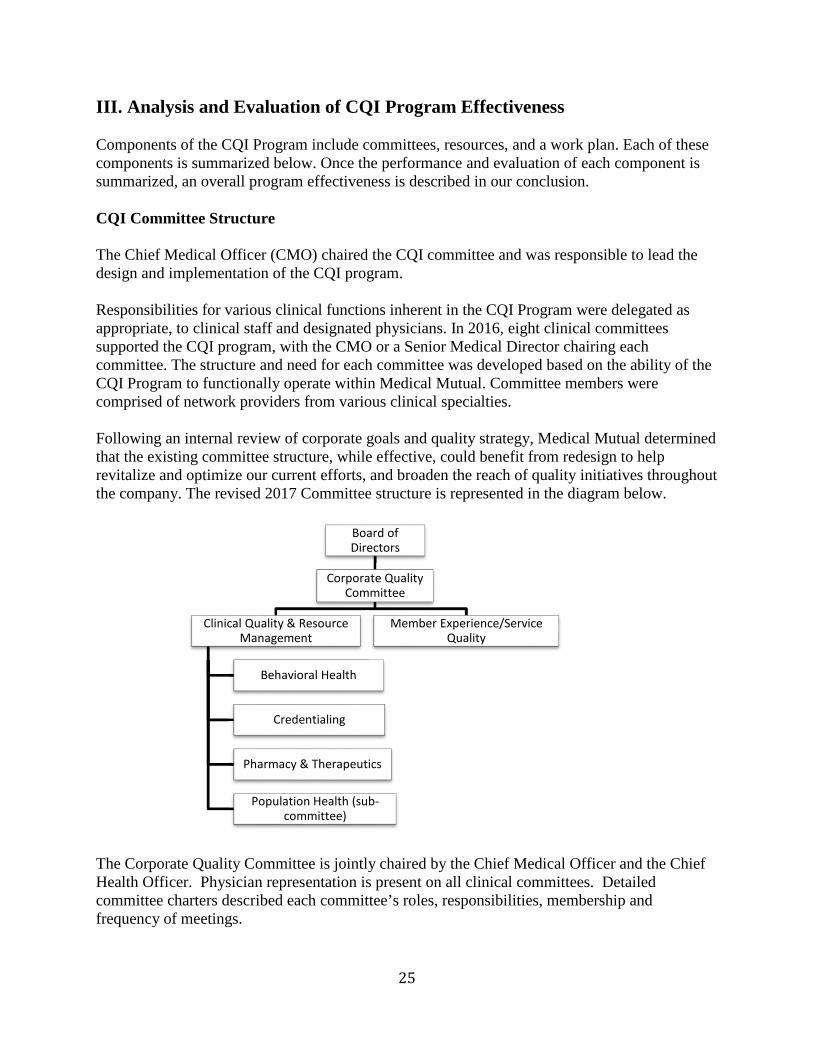
Following an internal review of corporate goals and quality strategy, Medical Mutual determinedthat the existing committee structure, while effective, could benefit from redesign to helprevitalize and optimize our current efforts, and broaden the reach of quality initiatives throughoutthe company. The revised 2017 Committee structure is represented in the diagram below.
The Corporate Quality Committee is jointly chaired by the Chief Medical Officer and the ChiefHealth Officer. Physician representation is present on all clinical committees. Detailedcommittee charters described each committee’s roles, responsibilities, membership andfrequency of meetings.
Board ofDirectors
Corporate QualityCommittee
Clinical Quality & ResourceManagement
Behavioral Health
Credentialing
Pharmacy & Therapeutics
Population Health (sub-committee)
Member Experience/ServiceQuality
26
CQI Program Resources
Medical Mutual has dedicated substantial investment and resources to the development andimplementation of tools to promote high quality services to our members, including claimsprocessing, data mining and analytical software for state of the art reporting processes.
Inovalon software training was provided to the Quality team over the course of the year,allowing quality analysts to evaluate initiatives. The ability to prospectively look at current datafor their related quality measures allows analysts to develop timely interventions based oncurrent trends and impact.
Resources from many other Medical Mutual departments are utilized to support the CQIProgram, in collaboration with the Care Management and CQI department staffs. HealthInformatics provides primary support to the CQI program by providing relevant data on metricssuch as HEDIS, quality indicators, cost and utilization, and consultation on various projects. Acertified medical coder provided support this year to advise on proper coding for preventivescreenings, which enhanced the effectiveness of the CQI Program. Analytical support is alsoprovided through the Member Experience department for service related initiatives and surveyanalysis.
CQI Work Plan SummaryThe CQI Work Plan Summary is a fluid working document used to record and evaluate currentCQI activity. It provides details on the status of how we are meeting our project objectives.Individual Project Improvement Plans contain details of all initiatives and are used to support theCQI Work Plan Summary. The 2016 CQI Project Work Plan Summary evaluates each of theprojects within the QI Work plan. Highlights of the Work Plan Summary are listed below.
1. Evaluate CAHPS results –Results were analyzed and compared to 2015, the percentilegaps were closed on measures related to getting care quickly, claims processing, ratingof health care, rating of specialist, getting needed care, how well doctors communicate,and rating of personal doctor. However, our current results did identify the opportunityto improve customer service and health plan ratings.
2. Evaluate QHP Enrollee Experience Survey results-The greatest opportunities identifiedfrom the survey results are delayed or did not visit doctor due to cost, delayed or didnot fill prescription due to cost and plan did not pay for care doctor said was needed.These measures will continue to be evaluated and initiatives will be monitored moreclosely for effectiveness.
3. Evaluate HEDIS results - HEDIS results were analyzed and barriers and opportunitiesidentified for individual measures. For all measures with a rate decrease and/or the ratedid not meet the goal, opportunities for improvement were identified.
4. To improve asthma medication adherence and medication safety - There were slightlymore members compliant with medication adherence 75 percent of the time whencomparing MY 2015 to MY 2014. Members with asthma did slightly improvemedication adherence attributed to our member outreach initiatives.
27
5. To improve appropriate treatment post-COPD exacerbation-There was no change in thenumber of members who received appropriate medications post-COPD exacerbationfrom MY 2015 to MY 2014.This is a quarterly mailing that will be evaluated toimprove effectiveness.
6. To improve treatment for members suffering from major depressive disorder- ratesimproved for both the acute and continuation phase from MY2014 to MY2015.
7. To ensure proper ADHD medication follow-up the initiation, continuation andmaintenance phase of treatment all showed improved in 2016 compared to the previousyear. The Summer Parent Letter which had been used in the past is being reevaluatedfor the 2017 year.
8. To improve avoidance of antibiotic treatment in adults with acute bronchitis the rateswere slightly higher in MY 2015 to MY 2014.
9. To improve treatment for members who were diagnosed with hypertension and whoseBP was adequately controlled was increased for our Commercial members in MY 2014compared to MY 2015. The Marketplace members decreased from MY 2014 to MY2015. This mailing has been on hold since June 2016, with reconsideration tocommence in 2017.
10. To provide education and improve screening rates- A1C poor control rate increased4.79 percentage points from MY 2014 to MY 2015 for Commercial. A1C testingincreased 2.46 percentage points from MY 2014 to MY 2015 for Commercial andincreased 2.71 percentage points for Marketplace.
11. To document and implement a consistent Out of Network Waiver policy-For MY 2015there was a drop in the number of appeals. Standard operating procedures were updatedwhich resulted in resolving the member issue before it became an appeal.
Projects with unmet objectives will be prioritized and evaluated by the CQI team to determinefocus areas for 2017.
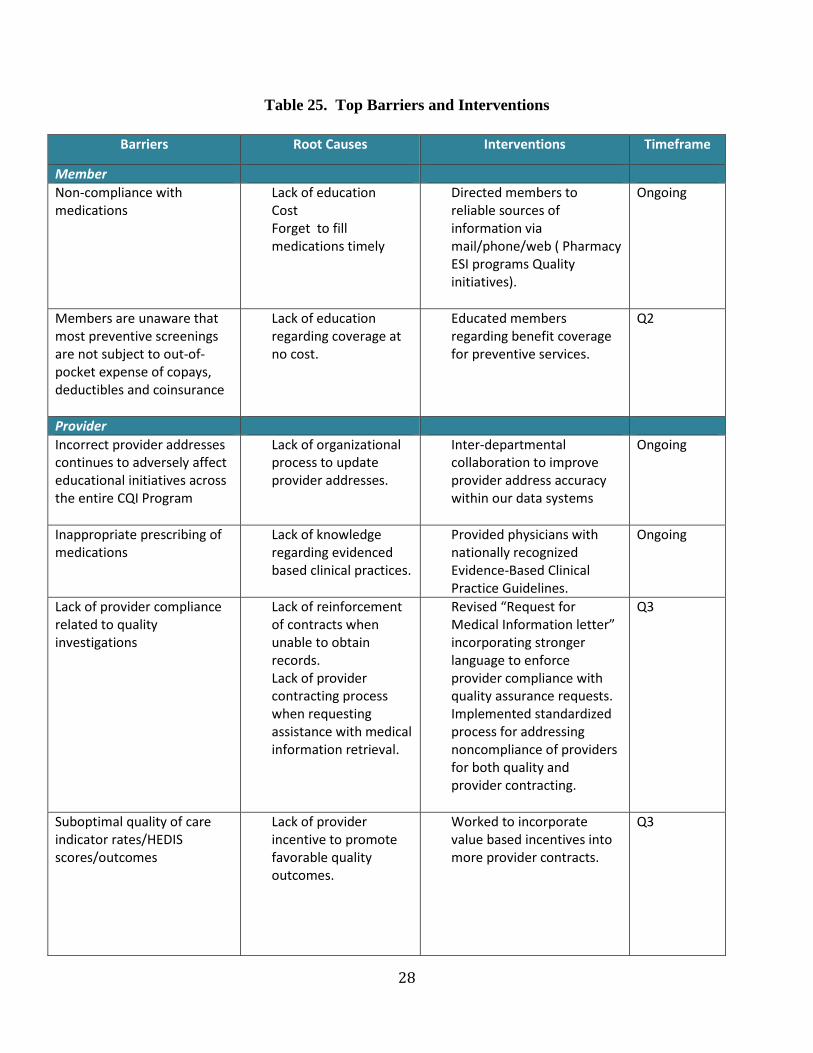
CQI Program and Work Plan BarriersEvaluating the CQI Program and CQI Work Plan against its stated goals and objectives includesidentification of barriers to improvement, and then developing and implementing initiatives toovercome the identified barriers. Barriers were identified by CQI team through an analysis ofHEDIS and/or CAHPS trended rates, a review of literature, and an evaluation of our competitors’programs, including safety measures. As barriers were identified and new interventionsdeveloped, the CQI Committee was asked for input regarding the barriers and potentialeffectiveness of the proposed interventions. Once identified, barriers to achieving program goalsduring the review period are organized into four categories. See Table 25 to review our topbarriers and interventions.
28
Table 25. Top Barriers and Interventions
Barriers Root Causes Interventions Timeframe
Member
Non-compliance withmedications
Lack of educationCostForget to fillmedications timely
Directed members toreliable sources ofinformation viamail/phone/web ( PharmacyESI programs Qualityinitiatives).
Ongoing
Members are unaware thatmost preventive screeningsare not subject to out-of-pocket expense of copays,deductibles and coinsurance
Lack of educationregarding coverage atno cost.
Educated membersregarding benefit coveragefor preventive services.
Q2
Provider
Incorrect provider addressescontinues to adversely affecteducational initiatives acrossthe entire CQI Program
Lack of organizationalprocess to updateprovider addresses.
Inter-departmentalcollaboration to improveprovider address accuracywithin our data systems
Ongoing
Inappropriate prescribing ofmedications
Lack of knowledgeregarding evidencedbased clinical practices.
Provided physicians withnationally recognizedEvidence-Based ClinicalPractice Guidelines.
Ongoing
Lack of provider compliancerelated to qualityinvestigations
Lack of reinforcementof contracts whenunable to obtainrecords.Lack of providercontracting processwhen requestingassistance with medicalinformation retrieval.
Revised “Request forMedical Information letter”incorporating strongerlanguage to enforceprovider compliance withquality assurance requests.Implemented standardizedprocess for addressingnoncompliance of providersfor both quality andprovider contracting.
Q3
Suboptimal quality of careindicator rates/HEDISscores/outcomes
Lack of providerincentive to promotefavorable qualityoutcomes.
Worked to incorporatevalue based incentives intomore provider contracts.
Q3
29
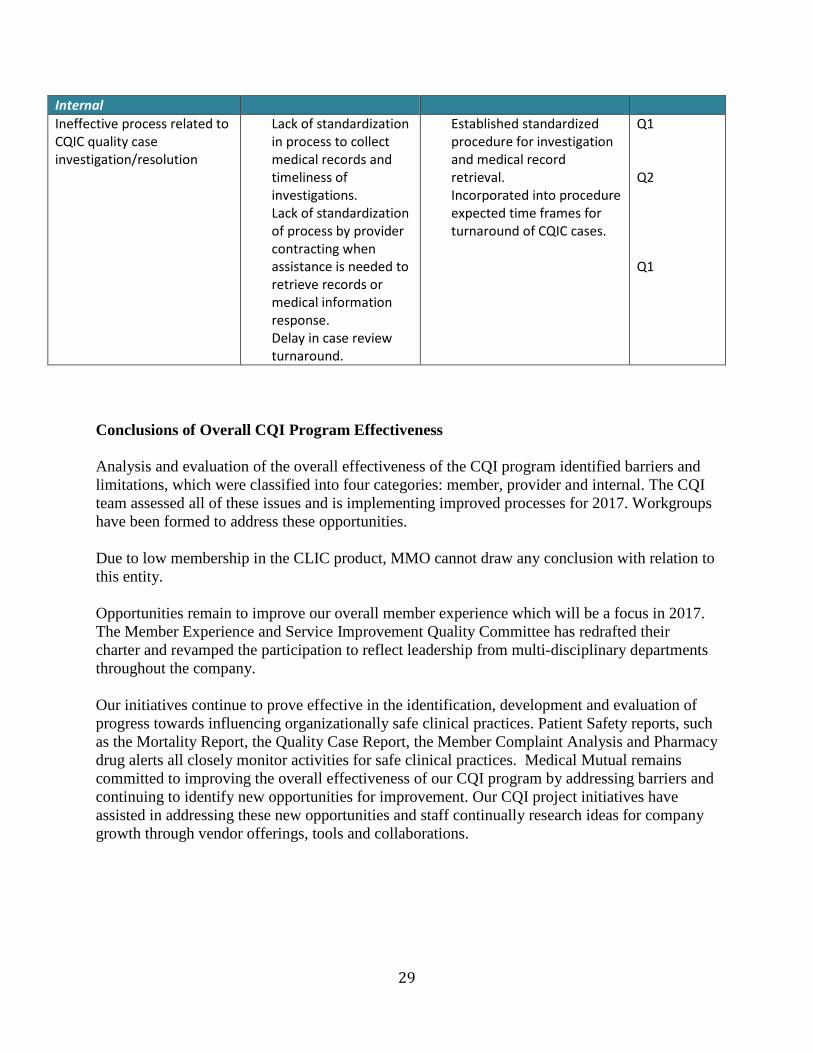
Conclusions of Overall CQI Program Effectiveness
Analysis and evaluation of the overall effectiveness of the CQI program identified barriers andlimitations, which were classified into four categories: member, provider and internal. The CQIteam assessed all of these issues and is implementing improved processes for 2017. Workgroupshave been formed to address these opportunities.
Due to low membership in the CLIC product, MMO cannot draw any conclusion with relation tothis entity.
Opportunities remain to improve our overall member experience which will be a focus in 2017.The Member Experience and Service Improvement Quality Committee has redrafted theircharter and revamped the participation to reflect leadership from multi-disciplinary departmentsthroughout the company.
Our initiatives continue to prove effective in the identification, development and evaluation ofprogress towards influencing organizationally safe clinical practices. Patient Safety reports, suchas the Mortality Report, the Quality Case Report, the Member Complaint Analysis and Pharmacydrug alerts all closely monitor activities for safe clinical practices. Medical Mutual remainscommitted to improving the overall effectiveness of our CQI program by addressing barriers andcontinuing to identify new opportunities for improvement. Our CQI project initiatives haveassisted in addressing these new opportunities and staff continually research ideas for companygrowth through vendor offerings, tools and collaborations.
Internal
Ineffective process related toCQIC quality caseinvestigation/resolution
Lack of standardizationin process to collectmedical records andtimeliness ofinvestigations.Lack of standardizationof process by providercontracting whenassistance is needed toretrieve records ormedical informationresponse.Delay in case reviewturnaround.
Established standardizedprocedure for investigationand medical recordretrieval.Incorporated into procedureexpected time frames forturnaround of CQIC cases.
Q1
Q2
Q1

30