Embed Size (px)
Citation preview

©2008 William J. Sieber, Erik J. Groessl, Kristin M. David, Theodore G. Ganiats, and Robert M. Kaplan. All Rights Reserved.
Quality of Well Being
Self-Administered (QWB-SA) Scale
User’s Manual
William J. Seiber, Ph.D.
Erik J. Groessl, Ph. D.
Kristin M. David, MPH
Theodore G. Ganiats, M.D.
Robert M. Kaplan, Ph.D.
Health Services Research Center
University of California, San Diego

© 2008 William J. Sieber, Erik J. Groessl, Kristin M. David, Theodore G. Ganiats, and Robert M. Kaplan. All Rights Reserved. 1
Table of Contents
II. The General Health Policy Model and The Quality of Well-Being Scale (QWB) .................... 4
III. The Quality of Well-Being Scale Self-Administered (QWB-SA) ........................................... 7
A. Development of the questionnaire ...................................................................................... 7
B. Derivation of preference weights ........................................................................................ 9
IV. Psychometric Properties of the QWB-SA .............................................................................. 11
A. Modes of Administration .................................................................................................. 17
A-1 Self-Administered ...................................................................................................... 17
A-2. Interviewer................................................................................................................. 19
A-3. Proxy ......................................................................................................................... 19
A-4. On-line ....................................................................................................................... 20
B. Scoring .............................................................................................................................. 20
VI. QWB-SA Normative Data ..................................................................................................... 22
VII. References ............................................................................................................................ 23
Appendix A: QWB-SA References .............................................................................................. 28
Appendix B: QWB Data from Selected Studies ........................................................................... 30
Appendix C: QWB-SA Preference Weights ................................................................................. 38

© 2008 William J. Sieber, Erik J. Groessl, Kristin M. David, Theodore G. Ganiats, and Robert M. Kaplan. All Rights Reserved. 2
I. Introduction
Measuring health outcomes has become an important objective for health care
professionals in research, clinical care, health care finance, and public policy. One of the main
purposes of measuring health outcomes is to document levels and changes in a patients’ health
status over time. Depending on the need of the assessor, health status can be measured in many
ways. It can be assessed by using endpoints of mortality, disease diagnosis, or by using
intermediate outcomes such as blood pressure, cholesterol, or Body Mass Index. Intermediate
outcomes are often easier to measure and do not rely upon patient self-report, but may not
directly affect health care consumers. Outcomes can be disease-specific or generic. One can
attempt to measure outcomes such as symptoms, function, and mortality, which more directly
affect the quality of life of health care consumers.
Another issue in the assessment of health is whether to use a disease-specific instrument
or a more comprehensive measure of health-related quality of life (HRQoL). Disease-specific
measures are often perceived as being more sensitive to subtle changes in the disease of interest,
but may miss changes in other areas of health or functioning. Given the unpredictable impact
interventions can have on multiple body systems, it is essential to assess health in ways that can
capture a patient’s overall functioning and well-being.
Health-related quality of life (HRQoL) is a concept used to describe a comprehensive
picture of how a person’s health affects their overall well-being. The Quality-Adjusted Life Year
(QALY) has become a standard measure of HRQoL in medical cost-effectiveness research (Gold
et al., 1996). QALYs integrate HRQoL with the duration of life to provide a single
comprehensive expression of health outcome.

© 2008 William J. Sieber, Erik J. Groessl, Kristin M. David, Theodore G. Ganiats, and Robert M. Kaplan. All Rights Reserved. 3
The Quality of Well-Being (QWB) scale was developed in the 1970’s as a comprehensive
measure of health-related quality of life (Kaplan, Bush, & Berry, 1975). The QWB is one of the
few instruments that can help calculate QALYs as an expression of health outcome. It has been
extensively validated and its psychometric properties are well established (Kaplan, Anderson,
and Ganiats, 1993). The widespread use of this instrument has been low in part due to length and
difficulty in its administration. The Quality of Well-Being Scale-Self Administered (QWB-SA)
was developed in response to previously identified limitations of the QWB (Kaplan, Ganiats, and
Sieber, 1996). It is easier to administer in most research and clinical assessment protocols than
the interviewer-administered QWB.
This manual is designed to serve as a guide to the administration, scoring, and
interpretation of the QWB-SA. Psychometric properties are reported and validation studies are
described. Initial normative data are provided to assist the user of the QWB-SA in interpreting
scores. References are also provided.
© 2008 William J. Sieber, Erik J. Groessl, Kristin M. David, Theodore G. Ganiats, and Robert M. Kaplan. All Rights Reserved. 4
II. The General Health Policy Model and The Quality of Well-Being Scale (QWB)
The assessment of health-related quality of life has developed significantly since the
1970’s. Among the instruments that assess overall HRQoL, only a few can be used for cost-
utility analysis. Cost-utility analysis is defined as cost-effectiveness analysis (CEA) that uses
QALYs as the outcome. QALYs have been identified as the preferred outcome metric by Gold et
al. (1996) in hopes of standardizing CEAs in medicine and healthcare. QALYs incorporate both
quality of life and mortality into one score which allows for comparisons across diseases and
populations. In the past, CEAs have used a variety of outcomes, making comparisons difficult.
Standardization of outcomes, definitions, and methods of CEA is an important step for
integrating findings.
The Quality of Well-being (QWB) scale was the first instrument specifically designed to
measure quality of life for the estimation of QALYs. The QWB is a preference-weighted
measure combining three scales of functioning with a measure of symptoms and problems to
produce a point-in-time expression of well-being that runs from 0 (for death) to 1.0 (for
asymptomatic full function). Most HRQoL measures focus on functioning; the QWB and QWB-
SA have a functioning component complemented by a strong symptom component. Prior work
by our group demonstrated that on any particular day, nearly 80% of the general population is
optimally functional. However, fewer than half of the population experience no symptoms.
Symptoms or problems may be severe such as serious joint pain, or minor such as taking
medication or following a prescribed diet for health reasons.
The QWB was developed using theory from the General Health Policy Model (Kaplan,
1993b, 1993c; Kaplan & Anderson, 1996; Kaplan, Anderson & Ganiats, 1993). This model
includes several components, such as mortality (death) and morbidity (health-related quality of
© 2008 William J. Sieber, Erik J. Groessl, Kristin M. David, Theodore G. Ganiats, and Robert M. Kaplan. All Rights Reserved. 5
life). Kaplan and colleagues have suggested that diseases and disabilities are important for two
reasons: illness may cause life expectancy to be shortened, and illness may make life less
desirable at times prior to death. In assessing the impact of a health intervention, one must
measure both a possible decrease in mortality and an improvement in health. In addition to
mortality and morbidity, the General Health Policy Model incorporates preference for observed
health states (utility) (and duration of stay in health states prognosis).
Utility studies looking at how people value health have been conducted to place the
observable states of health and functioning onto a preference continuum for the desirability of
various conditions, giving a "quality" rating between 0 for death and 1.0 for completely well. A
Quality-Adjusted Life Year (QALY) is defined as the equivalent of a completely well year of life,
or a year of life free of any symptoms, problems, or health-related disabilities. Consider, a person
who has a set of symptoms and is in a state of functioning that is rated by community peers as 0.5
on a 0.0 to 1.0 scale. If the person remains in that state for one year, he or she would have lost the
equivalent of 1/2 of one year of life. A person who has the flu may also be rated as 0.50. In this
case, the illness might only last three days and the total loss in QALYs might be 3/365 X 0.50
which is equal to 0.004 QALYs. This may not appear as significant an outcome as the person
whose symptoms persist for one year. But suppose that 5,000 people in a community get the flu.
The well years lost would then be 5,000 x .004 which is equal to 20 years of perfect health in one
person. The quality-adjusted life expectancy is the current life expectancy adjusted for
diminished quality of life associated with dysfunctional states and the duration of stay in each
state.
By administering the QWB before and after a treatment or intervention program, the
intervention can be described in terms of the quality adjusted life years that it produces or saves.
When costs are examined (using standardized methods), every intervention can be given a
© 2008 William J. Sieber, Erik J. Groessl, Kristin M. David, Theodore G. Ganiats, and Robert M. Kaplan. All Rights Reserved. 6
cost/QALY value. This value delineates how much it costs, on average, to produce an extra
QALY for each subject in a given study.
Several studies have demonstrated that the QWB is responsive to clinical change in a
variety of patient populations. For example, QWB scores have been shown to be associated with
health improvements in patients with cystic fibrosis (Orenstein et al, 1989), chronic sinusitis
(Hodgkin, 1994), and cochlear implant (Harris, et al., 1995). In addition, the QWB is responsive
to medications expected to have a minor effect such as oral gold treatment for patients with
arthritis (Bombardier, et al., 1986) or medications that have a larger effect such as AZT for
patients with HIV infection (Kaplan, Anderson, Wu, et al., 1989). Other applications of the
QWB include chronic obstructive pulmonary disease (Kaplan, et al., 1984), AIDS (Kaplan, et al.,
1989), diabetes mellitus (Kaplan, et al., 1987), atrial fibrillation (Ganiats, et al., 1992), lung
transplantation (Squier, et al., 1994), cancer (Kaplan, 1993a), depression (Kaplan, 1997),
schizophrenia (Patterson et al, 1996), fibromyalgia (Kaplan, Schmidt, and Cronan, 2000),
osteoarthritis (Groessl, Kaplan, and Cronan, 2000), and several other conditions (Kaplan, 1993b).
Further, the method has been used for health resource allocation modeling and served as the basis
for the innovative experiment on rationing of health care by the state of Oregon (Kaplan 1993b,
1993c).
© 2008 William J. Sieber, Erik J. Groessl, Kristin M. David, Theodore G. Ganiats, and Robert M. Kaplan. All Rights Reserved. 7
III. The Quality of Well-Being Scale Self-Administered (QWB-SA)
A. Development of the questionnaire The demand for rapid health status assessment is exemplified by the current widespread
use of the SF-36, though the SF-36 cannot be used to produce QALYs. What is needed is a
clinically useful, self-administered instrument that is sensitive to changes at the higher levels of
functioning, and that produces QALYs for important cost-effectiveness analyses. A self-
administered version of the QWB, known as the QWB-SA, was developed to meet this need.
There are several improvements from the original QWB seen in the QWB-SA. First,
several items assessing mental health are now included. Second, the assessment of symptoms
follows a clinically useful Review of Systems model, rather than clustering symptoms based on
preference weights. Third, additional symptoms not included in the interview format of the
QWB are in the symptom assessment portion of the QWB-SA. Finally, the administration of the
questionnaire no longer requires a trained interviewer and can be completed in less than 10
minutes.
The period assessed by the QWB-SA is shorter than in the QWB. The QWB asked
patients about symptoms and function “over the past 6 days” prior to the day of administration,
whereas the QWB-SA questions refer to the 3 days prior to the day of administration. This
change was designed to reduce respondents’ recall bias without decreasing the instrument’s
ability to assess over a period of time. In addition, assessing 3 days rather than 6 days results in a
more rapid administration. The impact on the overall quality of life score of using only the last 3
days was examined by dropping information from Day 4, 5, 6 and recalculating QWB scores
based only on the past 3 days. No significant differences in scores were found.

© 2008 William J. Sieber, Erik J. Groessl, Kristin M. David, Theodore G. Ganiats, and Robert M. Kaplan. All Rights Reserved. 8
The development of the QWB-SA has gone through several stages. First, a list of
symptoms and health-related problems was developed. The current version of the interviewer-
administered QWB uses a list of 26 symptom clusters; these clusters are based on the preference
weights assigned to each symptom. Despite having similar preference weights, some of the
symptoms within a given group were clinically heterogeneous or unrelated. The endorsement of
a symptom cluster did not specifically identify the health problem experienced; the endorsement
of an item on the QWB-SA does suggest symptoms that are clinically related.
The symptom checklist of the QWB-SA was expanded to 58 symptom complexes
including at least 12 symptoms that are typically considered “psychological.” Most items focus
on one problem related to one body system.
The expansion of the symptom checklist for the QWB-SA involved conducting several
focus groups comprised of physicians. Input on which symptoms would be important to be
aware of led to structuring symptoms along a medical Review of Systems. The different
symptoms selected reflect different important aspects of health, are understood by physicians as
distinct signs/predictors of various disease conditions, and cover different degrees of severity. A
total of 58 different symptoms emerged. The QWB-SA reflects a broad array of symptoms, and
has been organized to closely resemble how a clinician might conduct an assessment of a
patient’s symptoms, again potentially increasing the clinical utility of the QWB-SA.
The format for the QWB-SA includes five sections. The first part assesses the
presence/absence of 19 chronic symptoms or problems (e.g., blindness, speech problems). The
question format does not assess each of the previous 3 days (as in the rest of the questionnaire)
with the expectation that these chronic conditions do not vary much over the 3-day assessment
period. These chronic symptoms are followed by 25 acute (or more transient) physical symptoms
(e.g. headache, coughing, pain), and 14 mental health symptoms and behaviors (e.g., sadness,
© 2008 William J. Sieber, Erik J. Groessl, Kristin M. David, Theodore G. Ganiats, and Robert M. Kaplan. All Rights Reserved. 9
anxiety, irritation). The remaining sections of the QWB-SA are similar to the QWB and include
assessment of a person’s mobility (including use of transportation), physical activity (e.g.,
walking and bending over), and social activity including completion of role expectations (e.g.,
work, school, or home).
B. Derivation of preference weights
A unique aspect of the QWB-SA is that a person’s score reflects a societal perspective on
the value of that person’s level of functioning and well-being. Preference weights (i.e., societal
value of various health states) used with the QWB-SA were derived from a community sample.
Preference weights have been found to be quite consistent across groups (Balaban, et al. 1986;
EuroQol Group, 1990; Froberg and Kane, 1989c). While the community sample used for the
development of the QWB-SA preference weights was geographically homogeneous, the age and
gender distributions were similar to the census statistics for the U.S. population in 1990.
A total of 435 English-speaking adults were drawn from several primary care clinics as well as
two college campuses in San Diego. The final sample included 239 females (56%) and 191
males between the ages of 18 and 85 (mean age = 38 years). Distribution by age, gender, and
ethnicity approximated those reported in the 1990 U.S. census.
Each item included on the QWB-SA was described as a health state to be rated on a 0 to
100 scale. Subjects were asked to use “0” as an anchor for death/worst possible health state and
“100” for optimum health (no dysfunction or symptoms). Subjects were provided two examples
to assess their understanding of the task: one that described the maximum dysfunction in the
areas of mobility, physical activity, social role activity, while the other example listed no
dysfunction or symptoms. Due to the very large number of items to be rated and the burden
created by having each subject rate each possible health state, each subject completed a randomly

© 2008 William J. Sieber, Erik J. Groessl, Kristin M. David, Theodore G. Ganiats, and Robert M. Kaplan. All Rights Reserved. 10
selected subsample of 12 items. Ratings for QWB-SA items included one symptom and a level
of impairment for a mobility, physical activity, or social activity item. Subjects rated each
symptom separately and in combination with multiple levels of one of the functional scales (i.e.,
mobility, physical activity, social activity). Once all subjects provided ratings, preference
weights were estimated using an adaptation of Multiattribute Utility Scaling method (Anderson
and Zelinski, 1990). The method assumes an additive model, such that an item’s weight is
calculated with the following formula:
item weight = 1.0 – ( mean rating/100)
Once preference weights were calculated for all symptom items, weights for mobility, physical
activity, and social activity were calculated by subtraction. That is, once the weight for a
symptom (i.e., shortness of breath) was established, the mean rating for a health state with both a
symptom and a functional item (e.g., confined to bed) was subtracted from the symptom alone to
determine the preference weight assigned each item from the functional scale. In this manner,
new preference weights were derived for the QWB-SA and are presented in Appendix A. Item
preference weights are higher on the QWB-SA than weights originally calculated for the QWB
more than 20 years ago (Kaplan et al, 1978). Thus, the lowest total score for a living subject on
the QWB-SA is .09, whereas for the QWB, it is .33. This results in a greater distribution of
scores that approaches a normal curve as compared to the truncated distribution evident with the
QWB. The distribution of QWB-SA scores approaches normality to a greater degree than the
HUI and EuroQoL and has fewer ceiling effects (Ganiats, Barrett-Connor, Sieber, 1999
Barcelona ISQoL).

© 2008 William J. Sieber, Erik J. Groessl, Kristin M. David, Theodore G. Ganiats, and Robert M. Kaplan. All Rights Reserved. 11
IV. Psychometric Properties of the QWB-SA
The initial published report of the psychometric properties of the QWB-SA included a
test of the impact of mode of administration on overall scores as well as test-retest reliability
(Kaplan, Sieber, and Ganiats, 1997). Using the same preference weights in the scoring
algorithm for both the interviewer-administered QWB and the QWB-SA, a 2 x 2 (Mode x Time)
factorial design allowed for two types of comparison: to detect differences between the two
modes of administration using the same scoring algorithm, and to assess the stability of scores on
each instrument over a 4 week time period. Each of 218 English-speaking adults recruited from
primary care clinics was assigned to one of four groups that differed in mode of administration at
each time point: 1) interviewer-interviewer, 2) interviewer-SA, 3) SA-SA and 4) SA-interviewer.
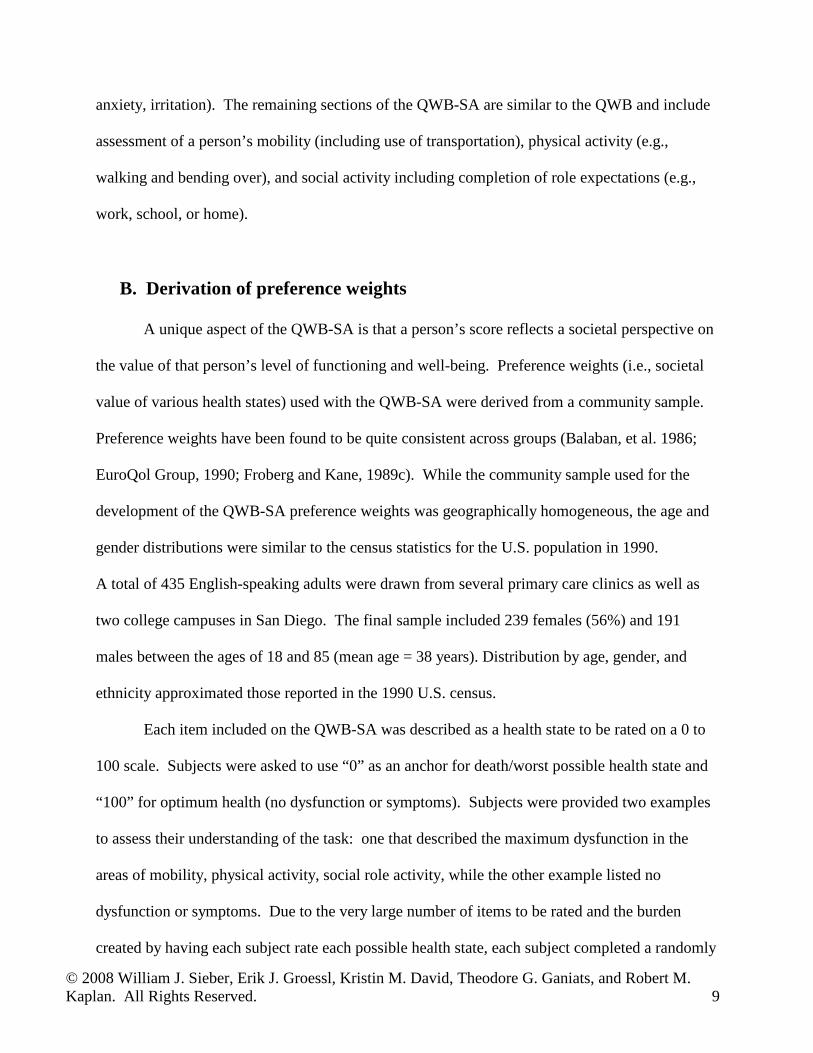
Table 1 suggests the two measures yielded nearly identical scores at both the baseline and the
one-month evaluations (with all main effects and interactions in the model being non-
significant). This implies that the different modes of administration produce equivalent results.
These results also demonstrate that both the QWB and QWB-SA scores remain stable over a
one-month time period for relatively healthy adults not under-going any health intervention or
change: r = .60 for the QWB, and r = .77 for the QWB-SA.
© 2008 William J. Sieber, Erik J. Groessl, Kristin M. David, Theodore G. Ganiats, and Robert M. Kaplan. All Rights Reserved. 12
Table 1. Means and Standard Deviations for QWB by Mode of Administration
The same analysis was then performed on the QWB-SA using the new preference weights
derived specifically for the QWB-SA. (Note: All QWB-SA scores reported in this manual
hereafter reflect the use of the preference weights to be used in future administrations of the
QWB-SA.) The same data from respondents reported in Kaplan, Sieber, and Ganiats, (1997)
was used, though the QWB-SA total scores were calculated using the newly constructed
preference weights (Appendix A). A total of 118 females (54%) and 100 males between the ages
of 18 and 85 (mean age = 50 years) completed one of the two instruments at both time points.
Data were analyzed by comparing both instruments' total scores at both the baseline and
one-month evaluations (See Table 2). (Interviewer-administered QWB scores are presented in
the following tables for comparison.) Test-retest correlations were computed for each instrument
and showed greater temporal stability for the QWB-SA (r=.80) than for the QWB (.60; both
p<001). Results did show that QWB-SA scores were significantly lower than the QWB scores at
baseline (F(1,217)=18.06; p<001) and at one month follow-up (F(1,217)=4.00, p<05).
Mode Baseline 1 Month
QWB .708 (.119) .707 (.108)
QWB-SA .701 (.101) .700 (.110)

© 2008 William J. Sieber, Erik J. Groessl, Kristin M. David, Theodore G. Ganiats, and Robert M. Kaplan. All Rights Reserved. 13
Table 2. Means (and standard deviations) for QWB by Mode of Administration & Time
QWB-SA scores were compared between groups based on gender, ethnicity, and
education. Substantial literature suggests that women live longer than men, yet report greater
morbidity (Wingard, 1984). A sensitive health status measure should capture these differences in
function and symptom reporting. Current results reflect such differences on the QWB-SA.
Significant negative correlations were found between age and the QWB-SA (r= -.23) and QWB
(r = -.20; both r's p<05). Given that men in this sample were older (mean age 52.7) than women
(mean age was 45; F(1, 217) = 22.4, p<001), ANCOVAs were performed to examine gender
differences on each measure with age as a covariate. Table 3 shows the age-adjusted means for
men and women on both instruments; no differences were found by gender on the interviewer
version of the QWB, though women did score lower than men on the QWB -SA (F(1,217)=
13.96, p< 001).
Mode Baseline 1 Month
QWB .709 (.112) .699 (.112)
QWB-SA .634 (.159) .663 (.149)

© 2008 William J. Sieber, Erik J. Groessl, Kristin M. David, Theodore G. Ganiats, and Robert M. Kaplan. All Rights Reserved. 14
Table 3. Age-adjusted Means (Standard Error of Measurement) by instrument and gender
Finally, differences in scores between ethnic groups were examined for each instrument.
Given the low number of minority subjects who participated in this validation study, scores for
all non-Hispanic Caucasians were compared to the mean for all other subjects combined. The
age- and gender-adjusted means in Table 4 show no differences between these two groups on
either the QWB or QWB-SA, though this analysis has limited power due to a small sample size.
Table 4. Age-adjusted means (Standard Error of Measurement) by instrument and ethnicity
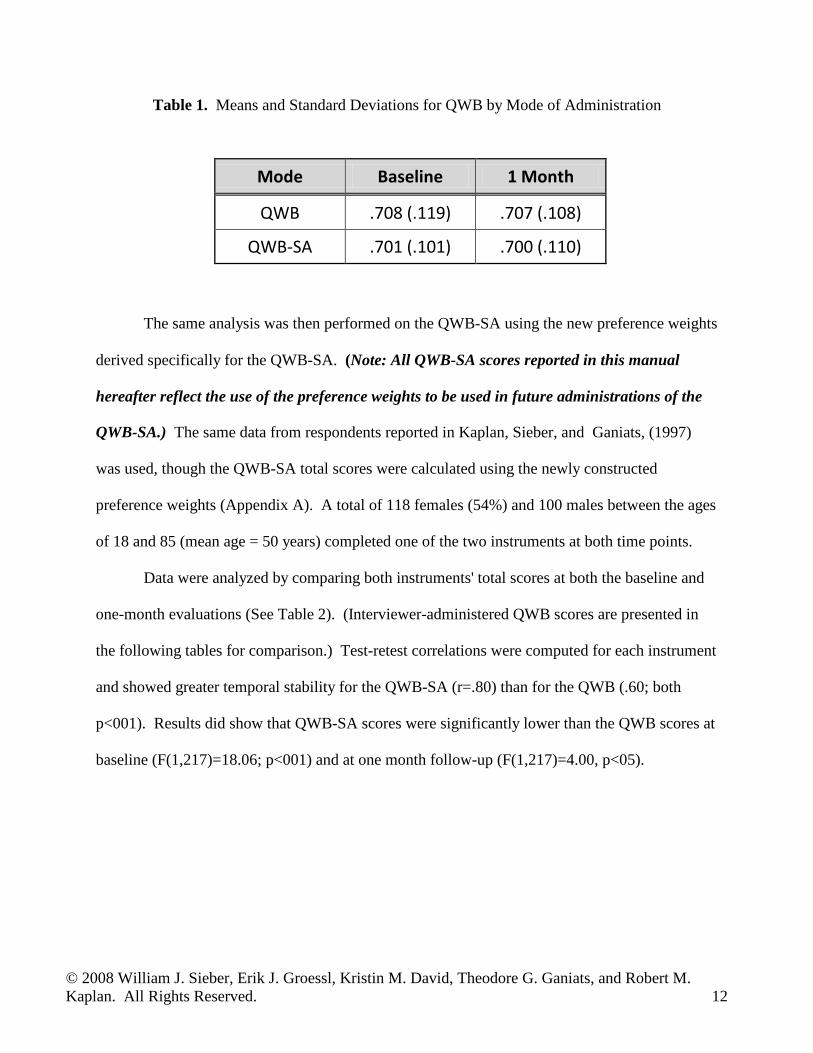
Similar analyses on QWB-SA scores showed no statistically significant differences by
educational level (adjusted by age and gender; see Table 5). The limited sample size in this
study may have limited the statistical power to detect differences seen in Tables 4 & 5. More
research is clearly needed to understand the possible influence these socio-demographic variables
have on QWB-SA scores.
Mode Males Females p <
QWB .716 (.011) .697 (.009) ns
QWB-SA .692 (.016) .614 (.014) 0.001
Mode Caucasian Non-Caucasian
p < N=169 N=45
QWB .724 (.015) .695 (0.26) ns
QWB-SA .641 (.017) .614 (.033) ns
© 2008 William J. Sieber, Erik J. Groessl, Kristin M. David, Theodore G. Ganiats, and Robert M. Kaplan. All Rights Reserved. 15
Table 5. Age-adjusted means (Standard Error of Measurement) by instrument and education
Finally, each subject rated his/her overall health (i.e., 5-point scale from "poor" to
"excellent") at the end of each administration of the QWB-SA. This rating was used as the
independent variable in a one way ANOVA with linear contrasts. QWB-SA scores served as the
dependent variable. Table 6 shows the significant linear trend that emerged (F(1, 152)=62;
p<.001), thus providing convergent validity for overall QWB-SA score and self-rating of health
status.
Education n QWB-SA total
HS graduate or less 17 .590 (.038)
some college 46 .661 (.021)
college degree 19 .635 (.033)
some graduate school or graduate degree 19 .638 (.035)

© 2008 William J. Sieber, Erik J. Groessl, Kristin M. David, Theodore G. Ganiats, and Robert M. Kaplan. All Rights Reserved. 16
Table 6. QWB-SA and (SEM) score by self-rating of health
Research has demonstrated sensitivity of the QWB-SA to headache status in migraineurs
(Sieber, David, Adams, Kaplan, and Ganiats, 2000), depression severity (Pyne, Sieber, David,
Kaplan, Rapaport, and Williams, 2001), expected differences in a variety of medical conditions
(Frosch, Sieber, Wiesman, Kaplan, 2000) and responsiveness to cataract surgery (Kaplan, Rosen,
and Sieber , 2000). Additional studies that have reported on the use of the QWB-SA can be
found in Appendix B.
It must be noted that the studies listed in Appendix B do not constitute a normative
database. The studies were selected based on the overall quality of the study design, sample size,
and generalizability of the study participants to other populations. There are many more research
projects using the QWB-SA than are listed in Appendix B; however, the QWB-SA data reported
is done with the hope that researchers can better estimate sample size for their study and to place
their own participants’ scores within a broader context.
Self-rated health n QWB-SA total
Poor 11 .448 (.032)
Fair 32 .536 (.017)
Good 33 .639 (.020)
Very good 54 .696 (.025)
Excellent 23 .758 (.032)

© 2008 William J. Sieber, Erik J. Groessl, Kristin M. David, Theodore G. Ganiats, and Robert M. Kaplan. All Rights Reserved. 17
V. Use of the QWB-SA
A. Modes of Administration The QWB-SA is designed to be self-administered. The instructions below pertain to the
scannable form used by UCSD and can be accessed by researchers for a nominal fee.
A-1 Self-Administered
The following are directions to investigators for instructing participants in self-
administration of the QWB-SA.
General Instructions: • The QWB-SA form (as designed, produced, and distributed by the UCSD Health Services
Research Center) can be completed using either a black or blue ball point pen; use of a #2
pencil is discouraged and use of felt tip ink pens are not permissible.
• Circles provided for a patient’s response to any item on the QWB-SA should be filled in
completely. Putting check marks or lines through the circles is not acceptable.
correct: incorrect: x
• The “Today’s Date” field should be filled out “Month/Day/Year.” For example, February 5,
2001 should be entered in the date field as “02/05/01.”
• The “Participant” field (at the bottom of each side) should have the subject's identification
number left justified.
• The “Protocol Number” field (at the bottom of the back side) is a free field that can be
determined by the researcher or data manager. If the questionnaires are to be scanned at any
point, entries in the “Protocol Number” field should be left justified.

© 2008 William J. Sieber, Erik J. Groessl, Kristin M. David, Theodore G. Ganiats, and Robert M. Kaplan. All Rights Reserved. 18
• The “Investigator Number” field (at the bottom of the back side) allows for the opportunity
of identifying the person collecting the data or the site from which data is being collected.
Entry of such an identifier should be left justified.
Specific Instructions: Questions 1a-1k are a list of chronic symptoms as well as commonly used health aids.
For these questions the subject simply fills in the circle corresponding to “Y” (for yes) if s/he
currently experiences the symptom or uses the health aid listed, or “N” (for no) if the subject is
not currently experiencing the symptom or using the health aid listed.
For questions 2-8, the QWB-SA scale queries subjects on their functional health status,
including the presence of certain physical symptoms (Q2), mental health symptoms (Q3), the
subject’s ability to perform self-care activities (Q5), limitations in mobility (Q6), physical
activity (Q7), or usual activities (Q8). These questions refer to a three-day time period that
corresponds to the three days directly preceding the day the questionnaire is completed. For
example, if a participant were completing the QWB-SA on Thursday, February 5, 2001, s/he
would answer questions about Wednesday, 02/04/01 (“Yesterday” on the QWB-SA form),
Tuesday, 02/03/01 (“2 Days ago”), and Monday, 02/02/01 (“3 Days ago”). It is important that
the subject understand the specific days s/he is being asked about. If the subject did not
experience a particular symptom in the past 3 days, s/he would fill in the circle corresponding to
“No Days.” Symptoms are reported for each of the 3 days separately. For example, if the subject
experienced the symptom 2 days ago but not yesterday or three days ago, s/he would fill in only
the circle corresponding with 2 days ago; if the subject experienced the symptom on all of the
past 3 days s/he would fill in a circles for each of the 3 days separately.

© 2008 William J. Sieber, Erik J. Groessl, Kristin M. David, Theodore G. Ganiats, and Robert M. Kaplan. All Rights Reserved. 19
Question 4 asks if the subject had any symptoms that were not mentioned on the QWB-
SA. If the subject experienced symptoms that were not mentioned, s/he would fill in the circle
corresponding to “Yes” and then write in the particular symptom(s) along with which of the past
3 days s/he experienced them.
Question 8c asks if the subject changed any plans or activities due to their health not
already reported. If s/he did have to change plans/activities, s/he should write a description of the
limitation(s) in the box provided.
Questions 9a-c instructs the subject to rate their overall health state in 3 different ways.
First, on a 5 point scale from “poor” to “excellent.” Second, a respondent compares current
health to health of one year previous, and third to rate his/her overall health over the past 3 days
on a 0 – 100 scale.
Question 10 provides space for the respondent to provide information regarding gender,
age, ethnicity, and education level.
A-2. Interviewer
The QWB-SA can be administered by telephone or in a face-to-face interview, though the
psychometric properties of the QWB-SA administered by these methods have not been
specifically studied. If an investigator finds it necessary to administer a QWB-SA by telephone
or via an interviewer, the questions should be read exactly as they appear on the questionnaire.
A-3. Proxy
Assessment by proxy is not recommended for the QWB-SA but may be the only option
for a subject who cannot comprehend all of the questions or cannot adequately communicate
responses to the questions. For example, this option may be considered with subjects who are
© 2008 William J. Sieber, Erik J. Groessl, Kristin M. David, Theodore G. Ganiats, and Robert M. Kaplan. All Rights Reserved. 20
cognitively impaired (e.g., brain injury, dementia). The User is warned, however, that problems
abound with data on subjective health states gathered by proxy. Psychometric properties of the
QWB-SA administered by proxy have not been evaluated. Investigators may consider using the
responses of a proxy to the QWB-SA in cases where a patient cannot respond on their own.
Given many of the symptoms assessed are subjective and personal in nature, and the impact of
the use of a proxy lacks adequate psychometric testing.
A-4. On-line
A web-based version of the QWB-SA is available on the Internet. Access codes and
passwords providing access to the web-based QWB-SA are available to researchers through the
UCSD Health Services Research Center. Identifying information is not necessary and security
measures have been implemented. Response data is scored before being stored in a
downloadable format and data for each research project is stored separately.
B. Scoring Scoring algorithms are available to all individuals and entities signing a QWB-SA
copyright agreement. The QWB-SA may be used free of charge by non-profit organizations that
provide evidence of their non-profit status and agree to provide a copy of relevant, non-
identifiable project data with UCSD. For-profit organizations are required to sign a usage
contract in addition to the copyright agreement. Fees for usage are dependent on volume, length
of intended usage, mode of administration, and other factors; but are usually quite affordable.
The UCSD Health Services Research Center provides complete data services for the
administration, scoring, cleaning, and interpretation of the QWB-SA and other health outcome

© 2008 William J. Sieber, Erik J. Groessl, Kristin M. David, Theodore G. Ganiats, and Robert M. Kaplan. All Rights Reserved. 21
measures. (A computer software-scoring program is also available for a fee, under certain
circumstances and pre-arranged with HSRC personnel.)
For more information, or to complete a copyright agreement and begin using the QWB-
SA, please contact the UCSD Health Services Research Center at 9500 Gilman Dr. #0994, La
Jolla, CA 92093-0994, or call 858-622-1771.

© 2008 William J. Sieber, Erik J. Groessl, Kristin M. David, Theodore G. Ganiats, and Robert M. Kaplan. All Rights Reserved. 22
VI. QWB-SA Normative Data
General Outpatient Medical Samples (controls)
Total Sample Age ≤ 30 31-40 41-50 51-60 61-70 ≥ 71
N 86 109 91 99 191 267 Mean 0.67 0.6428 0.6017 0.6161 0.6162 0.6075 Std Dev. 0.1286 0.1476 0.1323 0.1199 0.108 0.1354 Range .286-1.0 .260-1.0 .285-.913 .273-.934 .260-.934 .151-1.0
Men Only Age ≤ 30 31-40 41-50 51-60 61-70 ≥ 71 N 29 42 35 27 65 96 Mean 0.6548 0.6743 0.6173 0.647 0.6351 0.6015 Std Dev. 0.1093 0.1604 0.1148 0.1044 0.1026 0.1494 Range .397-.850 .260-1.0 .394-.874 .419-.934 .315-.934 .151-.934
Women Only Age ≤ 30 31-40 41-50 51-60 61-70 ≥ 71 N 57 67 56 72 125 171 Mean 0.6778 0.623 0.592 0.6045 0.6062 0.6108 Std Dev. 0.1377 0.1365 0.1424 0.1238 0.1103 0.1272 Range .286-1.0 .348-1.0 .285-.913 .273-.871 .260-.903 .278-1.0 *Male and female subgroups may not add to total due to missing data on gender variable for some respondents

© 2008 William J. Sieber, Erik J. Groessl, Kristin M. David, Theodore G. Ganiats, and Robert M. Kaplan. All Rights Reserved. 23
General Outpatient Medical Samples (controls)Caucasian Only Age ≤ 30 31-40 41-50 51-60 61-70 ≥ 71
N 48 75 68 79 161 235 Mean 0.6742 0.6448 0.6047 0.6138 0.6177 0.6104 Std Dev. 0.1242 0.1538 0.1334 0.1208 0.1097 0.1281 Range .391-1.0 .260-1.0 .285-.874 .273-.934 .260-.934 .264-.934
African American Only Age ≤ 30 31-40 41-50 51-60 61-70 ≥ 71 N 5 6 4 4 2 2 Mean 0.7297 0.5159 0.5245 0.6123 0.5063 0.617 Std Dev. 0.0925 0.1013 0.0561 0.0208 0.107 0.1032 Range .649-.877 .348-.639 .477-.586 .589-.639 .431-.582 .544-.690
Hispanic Only Age ≤ 30 31-40 41-50 51-60 61-70 ≥ 71 N 13 6 8 6 9 3 Mean 0.6362 0.6259 0.6495 0.5512 0.5855 0.8657 Std Dev. 0.1556 0.0344 0.0995 0.0991 0.1067 0.1786 Range .286-.871 .598-.680 .498-.815 .448-.732 .376-.737 .663-1.0
Asian Only Age ≤ 30 31-40 41-50 51-60 61-70 ≥ 71 N 12 10 4 6 11 0 Mean 0.6793 0.7218 0.6961 0.6861 0.6715 --- Std Dev. 0.1014 0.1397 0.1455 0.1714 0.0919 --- Range .524-.850 .477-1.0 .604-.913 .148-.871 .537-.826 ---
Native American Only Age ≤ 30 31-40 41-50 51-60 61-70 ≥ 71 N 1 2 0 0 1 14 Mean 0.4446 0.755 --- --- 0.647 0.5546 Std Dev. --- 0.2531 --- --- --- 0.1044 Range --- .576-.934 --- --- --- .405-.701
© 2008 William J. Sieber, Erik J. Groessl, Kristin M. David, Theodore G. Ganiats, and Robert M. Kaplan. All Rights Reserved. 24
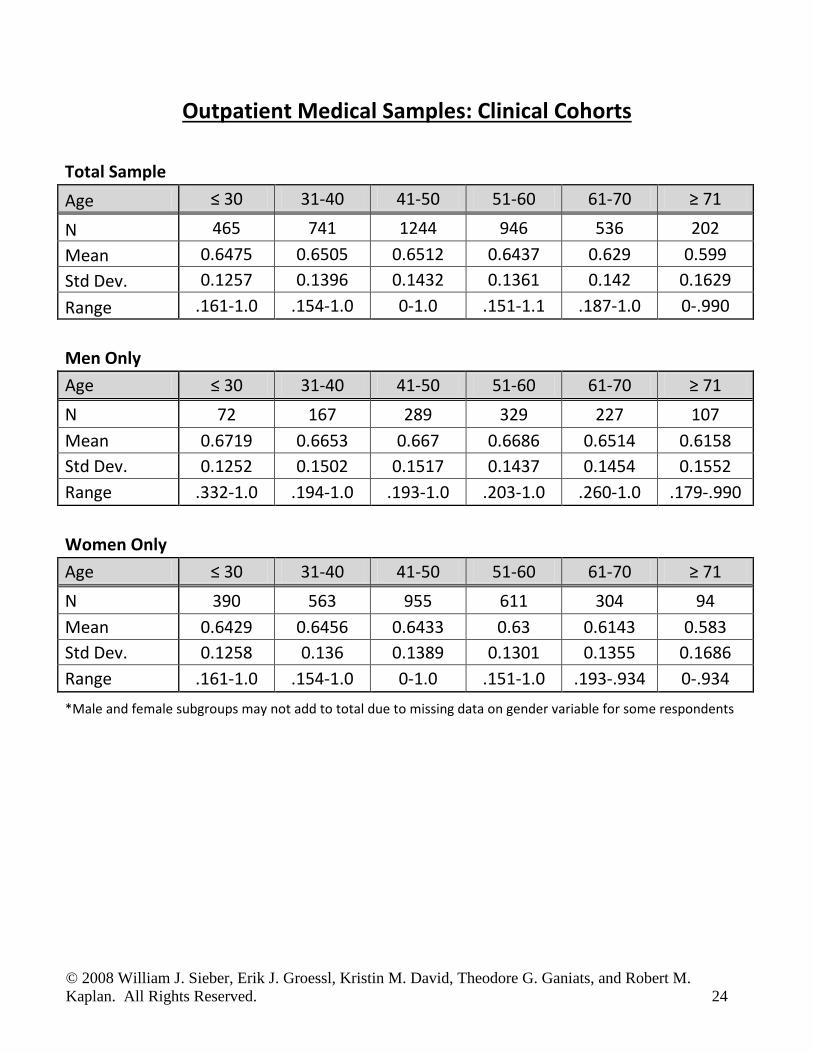
Outpatient Medical Samples: Clinical Cohorts
Total Sample Age ≤ 30 31-40 41-50 51-60 61-70 ≥ 71
N 465 741 1244 946 536 202 Mean 0.6475 0.6505 0.6512 0.6437 0.629 0.599 Std Dev. 0.1257 0.1396 0.1432 0.1361 0.142 0.1629 Range .161-1.0 .154-1.0 0-1.0 .151-1.1 .187-1.0 0-.990
Men Only Age ≤ 30 31-40 41-50 51-60 61-70 ≥ 71 N 72 167 289 329 227 107 Mean 0.6719 0.6653 0.667 0.6686 0.6514 0.6158 Std Dev. 0.1252 0.1502 0.1517 0.1437 0.1454 0.1552 Range .332-1.0 .194-1.0 .193-1.0 .203-1.0 .260-1.0 .179-.990
Women Only Age ≤ 30 31-40 41-50 51-60 61-70 ≥ 71 N 390 563 955 611 304 94 Mean 0.6429 0.6456 0.6433 0.63 0.6143 0.583 Std Dev. 0.1258 0.136 0.1389 0.1301 0.1355 0.1686 Range .161-1.0 .154-1.0 0-1.0 .151-1.0 .193-.934 0-.934 *Male and female subgroups may not add to total due to missing data on gender variable for some respondents
© 2008 William J. Sieber, Erik J. Groessl, Kristin M. David, Theodore G. Ganiats, and Robert M. Kaplan. All Rights Reserved. 25
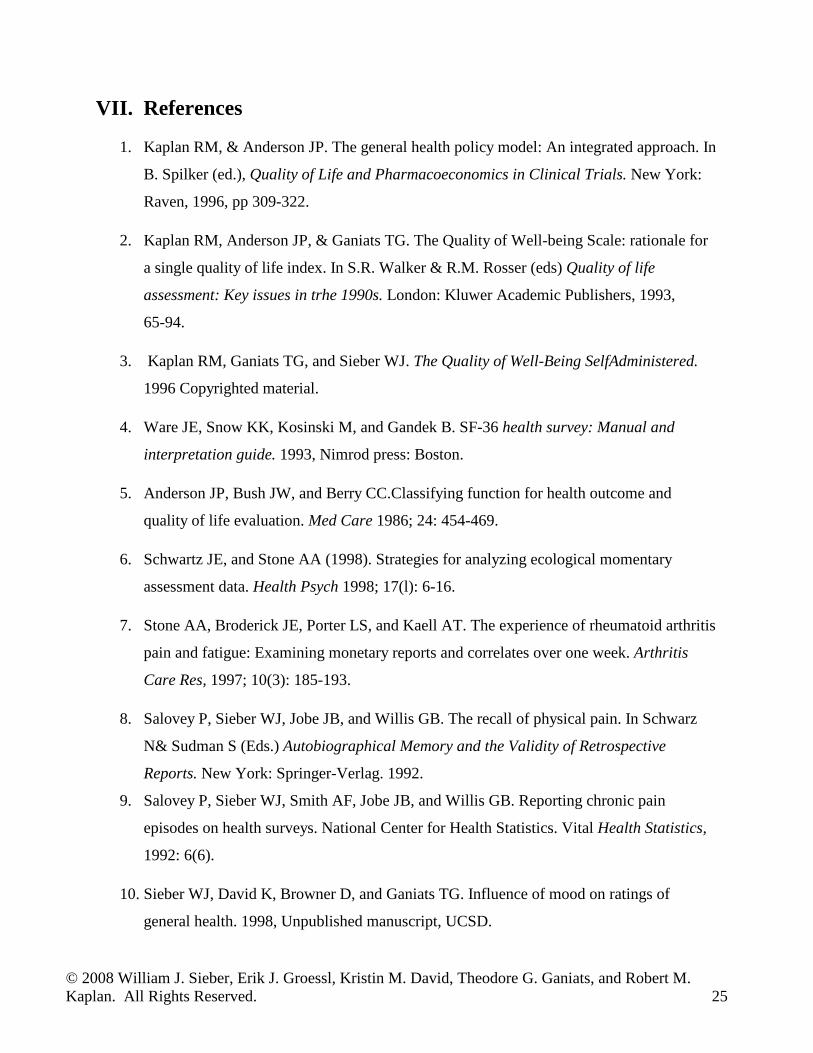
VII. References
1. Kaplan RM, & Anderson JP. The general health policy model: An integrated approach. In
B. Spilker (ed.), Quality of Life and Pharmacoeconomics in Clinical Trials. New York:
Raven, 1996, pp 309-322.
2. Kaplan RM, Anderson JP, & Ganiats TG. The Quality of Well-being Scale: rationale for
a single quality of life index. In S.R. Walker & R.M. Rosser (eds) Quality of life
assessment: Key issues in trhe 1990s. London: Kluwer Academic Publishers, 1993,
65-94.
3. Kaplan RM, Ganiats TG, and Sieber WJ. The Quality of Well-Being SelfAdministered.
1996 Copyrighted material.
4. Ware JE, Snow KK, Kosinski M, and Gandek B. SF-36 health survey: Manual and
interpretation guide. 1993, Nimrod press: Boston.
5. Anderson JP, Bush JW, and Berry CC.Classifying function for health outcome and
quality of life evaluation. Med Care 1986; 24: 454-469.
6. Schwartz JE, and Stone AA (1998). Strategies for analyzing ecological momentary
assessment data. Health Psych 1998; 17(l): 6-16.
7. Stone AA, Broderick JE, Porter LS, and Kaell AT. The experience of rheumatoid arthritis
pain and fatigue: Examining monetary reports and correlates over one week. Arthritis
Care Res, 1997; 10(3): 185-193.
8. Salovey P, Sieber WJ, Jobe JB, and Willis GB. The recall of physical pain. In Schwarz
N& Sudman S (Eds.) Autobiographical Memory and the Validity of Retrospective
Reports. New York: Springer-Verlag. 1992.
9. Salovey P, Sieber WJ, Smith AF, Jobe JB, and Willis GB. Reporting chronic pain
episodes on health surveys. National Center for Health Statistics. Vital Health Statistics,
1992: 6(6).
10. Sieber WJ, David K, Browner D, and Ganiats TG. Influence of mood on ratings of
general health. 1998, Unpublished manuscript, UCSD.
© 2008 William J. Sieber, Erik J. Groessl, Kristin M. David, Theodore G. Ganiats, and Robert M. Kaplan. All Rights Reserved. 26
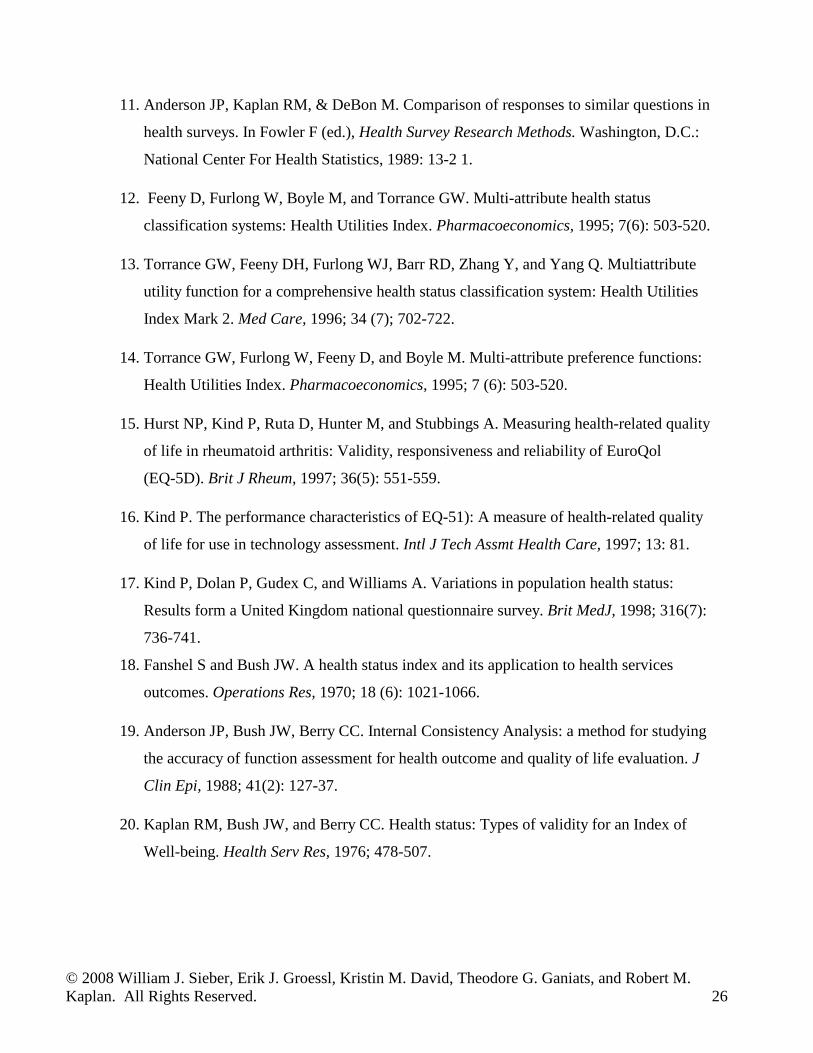
11. Anderson JP, Kaplan RM, & DeBon M. Comparison of responses to similar questions in
health surveys. In Fowler F (ed.), Health Survey Research Methods. Washington, D.C.:
National Center For Health Statistics, 1989: 13-2 1.
12. Feeny D, Furlong W, Boyle M, and Torrance GW. Multi-attribute health status
classification systems: Health Utilities Index. Pharmacoeconomics, 1995; 7(6): 503-520.
13. Torrance GW, Feeny DH, Furlong WJ, Barr RD, Zhang Y, and Yang Q. Multiattribute
utility function for a comprehensive health status classification system: Health Utilities
Index Mark 2. Med Care, 1996; 34 (7); 702-722.
14. Torrance GW, Furlong W, Feeny D, and Boyle M. Multi-attribute preference functions:
Health Utilities Index. Pharmacoeconomics, 1995; 7 (6): 503-520.
15. Hurst NP, Kind P, Ruta D, Hunter M, and Stubbings A. Measuring health-related quality
of life in rheumatoid arthritis: Validity, responsiveness and reliability of EuroQol
(EQ-5D). Brit J Rheum, 1997; 36(5): 551-559.
16. Kind P. The performance characteristics of EQ-51): A measure of health-related quality
of life for use in technology assessment. Intl J Tech Assmt Health Care, 1997; 13: 81.
17. Kind P, Dolan P, Gudex C, and Williams A. Variations in population health status:
Results form a United Kingdom national questionnaire survey. Brit MedJ, 1998; 316(7):
736-741.
18. Fanshel S and Bush JW. A health status index and its application to health services
outcomes. Operations Res, 1970; 18 (6): 1021-1066.
19. Anderson JP, Bush JW, Berry CC. Internal Consistency Analysis: a method for studying
the accuracy of function assessment for health outcome and quality of life evaluation. J
Clin Epi, 1988; 41(2): 127-37.
20. Kaplan RM, Bush JW, and Berry CC. Health status: Types of validity for an Index of
Well-being. Health Serv Res, 1976; 478-507.
© 2008 William J. Sieber, Erik J. Groessl, Kristin M. David, Theodore G. Ganiats, and Robert M. Kaplan. All Rights Reserved. 27
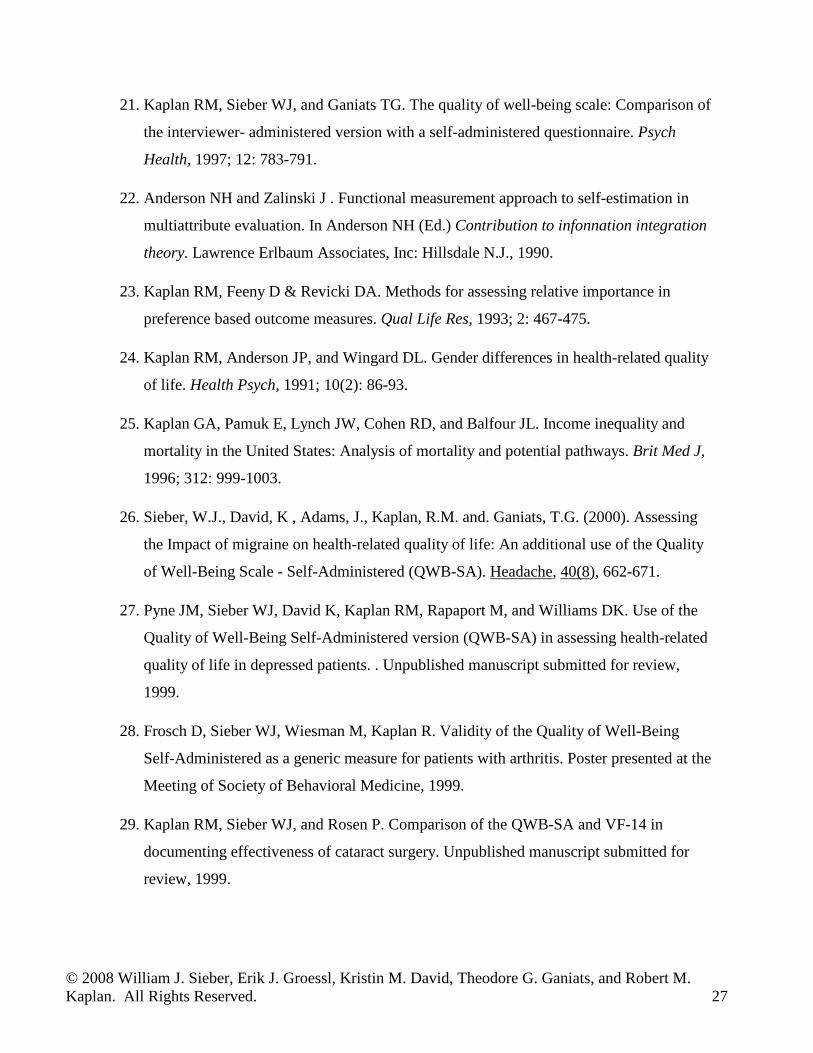
21. Kaplan RM, Sieber WJ, and Ganiats TG. The quality of well-being scale: Comparison of
the interviewer- administered version with a self-administered questionnaire. Psych
Health, 1997; 12: 783-791.
22. Anderson NH and Zalinski J . Functional measurement approach to self-estimation in
multiattribute evaluation. In Anderson NH (Ed.) Contribution to infonnation integration
theory. Lawrence Erlbaum Associates, Inc: Hillsdale N.J., 1990.
23. Kaplan RM, Feeny D & Revicki DA. Methods for assessing relative importance in
preference based outcome measures. Qual Life Res, 1993; 2: 467-475.
24. Kaplan RM, Anderson JP, and Wingard DL. Gender differences in health-related quality
of life. Health Psych, 1991; 10(2): 86-93.
25. Kaplan GA, Pamuk E, Lynch JW, Cohen RD, and Balfour JL. Income inequality and
mortality in the United States: Analysis of mortality and potential pathways. Brit Med J,
1996; 312: 999-1003.
26. Sieber, W.J., David, K , Adams, J., Kaplan, R.M. and. Ganiats, T.G. (2000). Assessing
the Impact of migraine on health-related quality of life: An additional use of the Quality
of Well-Being Scale - Self-Administered (QWB-SA). Headache, 40(8), 662-671.
27. Pyne JM, Sieber WJ, David K, Kaplan RM, Rapaport M, and Williams DK. Use of the
Quality of Well-Being Self-Administered version (QWB-SA) in assessing health-related
quality of life in depressed patients. . Unpublished manuscript submitted for review,
1999.
28. Frosch D, Sieber WJ, Wiesman M, Kaplan R. Validity of the Quality of Well-Being
Self-Administered as a generic measure for patients with arthritis. Poster presented at the
Meeting of Society of Behavioral Medicine, 1999.
29. Kaplan RM, Sieber WJ, and Rosen P. Comparison of the QWB-SA and VF-14 in
documenting effectiveness of cataract surgery. Unpublished manuscript submitted for
review, 1999.

© 2008 William J. Sieber, Erik J. Groessl, Kristin M. David, Theodore G. Ganiats, and Robert M. Kaplan. All Rights Reserved. 28
Appendix A: QWB-SA References
A. Kaplan RM, Sieber WJ, and Ganiats TG. The quality of well-being scale: Comparison of
the interviewer- administered version with a self-administered questionnaire. Psych
Health, 1997;12:783-791.
B. Andresen EM, Rothenberg BM, Kaplan RM. Performance of a self-administered mailed
version of the Quality of Well-Being (QWB-SA) questionnaire among older adults. Med
Care. 1998 Sep;36(9):1349-60.
C. Sieber WJ, David KM, Adams JE, Kaplan RM, Ganiats TG. Assessing the impact of
migraine on health-related quality of life: An additional use of the quality of well-being
scale-self-administered. Headache. 2000 Sep;40(8):662-71.
D. Smith PS, Crossley B, Greenberg J, Wilder C, Carroll B. Agreement among three quality
of life measures in patients with ALS.Amyotroph Lateral Scler Other Motor Neuron
Disord. 2000 Sep;1(4):269-75.
E. Frosch D, Porzsolt F, Heicappell R, Kleinschmidt K, Schatz M, Weinknecht S, Kaplan
RM. Comparison of German language versions of the QWB-SA and SF-36 evaluating
outcomes for patients with prostate disease. Qual Life Res. 2001;10(2):165-73.
F. Coffey JT, Brandle M, Zhou H, Marriott D, Burke R, Tabaei BP, Engelgau MM, Kaplan
RM, Herman WH. Valuing health-related quality of life in diabetes. Diabetes Care. 2002
Dec;25(12):2238-43.
G. Pyne JM, Sieber WJ, David K, Kaplan RM, Hyman Rapaport M, Keith Williams D. Use
of the quality of well-being self-administered version (QWB-SA) in assessing health-
related quality of life in depressed patients. J Affect Disord. 2003 Sep;76(1-3):237-47.
H. Beusterien KM, Ackerman SJ, Plante K, Glaspy J, Naredi P, Wood D, Gehlsen K,
Agarwala SS. The health-related quality-of-life impact of histamine dihydrochloride plus
interleukin-2 compared with interleukin-2 alone in patients with metastatic melanoma.
Support Care Cancer. 2003 May;11(5):304-12.

© 2008 William J. Sieber, Erik J. Groessl, Kristin M. David, Theodore G. Ganiats, and Robert M. Kaplan. All Rights Reserved. 29
I. Frosch D, Kaplan RM, Ganiats TG, Groessl EJ, Sieber WJ, Weisman M. Validity of self-
administered quality of well-being scale in musculoskeletal disease. Arthritis Rheum.
2004 Feb;51(1):28-33.
J. Tabaei BP, Shill-Novak J, Brandle M, Burke R, Kaplan RM, Herman WH. Glycemia and
the quality of well-being in patients with diabetes. Qual Life Res. 2004 Aug;13(6):1153-
61.
K. Rosen PN, Kaplan RM, David K. Measuring outcomes of cataract surgery using the
Quality of Well-Being Scale and VF-14 Visual Function Index. J Cataract Refract Surg.
2005 Feb;31(2):369-78.
L. Mancino MJ, Pyne JM, Tripathi S, Constans J, Roca V, Freeman T. Quality-adjusted
health status in veterans with posttraumatic stress disorder. J Nerv Ment Dis. 2006
Nov;194(11):877-9.
M. Mittal D, Fortney JC, Pyne JM, Edlund MJ, Wetherell JL. Impact of comorbid anxiety
disorders on health-related quality of life among patients with major depressive disorder.
Psychiatr Serv. 2006 Dec;57(12):1731-7.
N. Pyne JM, Tripathi S, Williams DK, Fortney J. Depression-free day to utility-weighted
score: is it valid? Med Care. 2007 Apr;45(4):357-62.
O. Groessl EJ, Kaplan RM, Rejeski WJ, Katula JA, King AC, Frierson G, Glynn NW, Hsu
FC, Walkup M, Pahor M. Health-related quality of life in older adults at risk for
disability. Am J Prev Med. 2007 Sep;33(3):214-8.
P. Moock J, Kohlmann T. Comparing preference-based quality-of-life measures: results
from rehabilitation patients with musculoskeletal, cardiovascular, or psychosomatic
disorders. Qual Life Res. 2008 Apr;17(3):485-495.
Q. Pyne JM, French M, McCollister K, Tripathi S, Rapp R, Booth B. Preference-weighted
health-related quality of life measures and substance abuse disorder severity. Addiction.
2008 Apr. (in press)
© 2008 William J. Sieber, Erik J. Groessl, Kristin M. David, Theodore G. Ganiats, and Robert M. Kaplan. All Rights Reserved. 30
Appendix B: QWB Data from Selected Studies
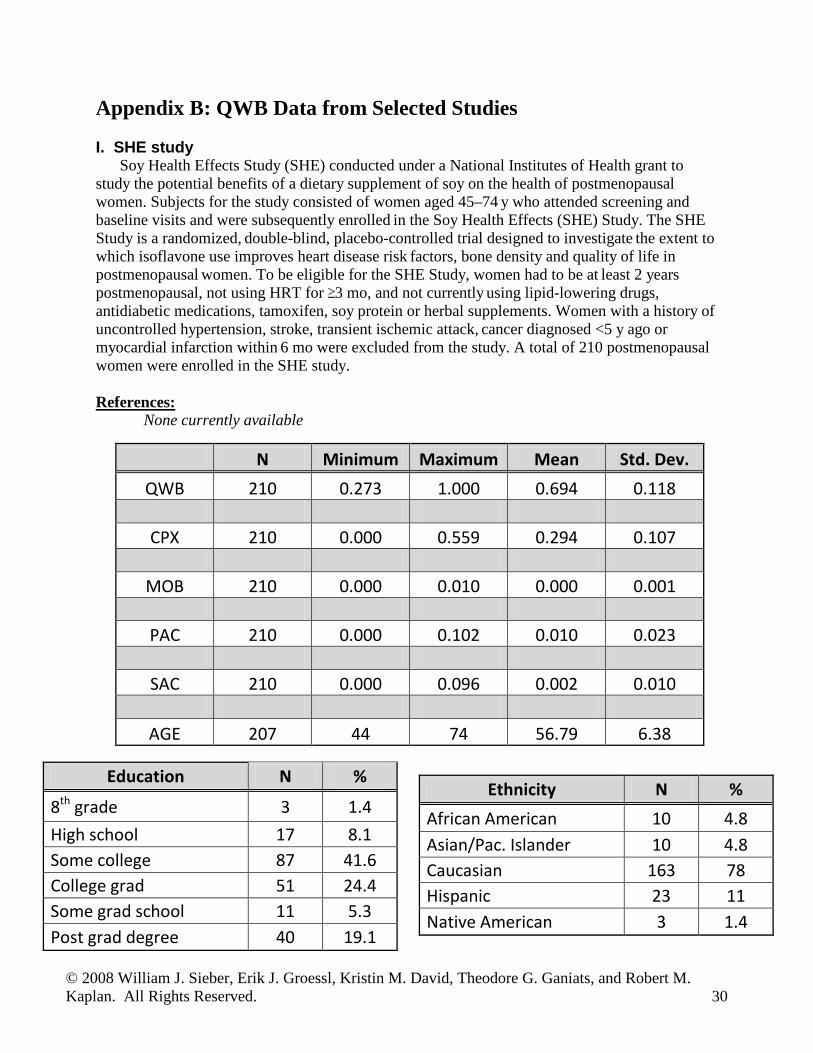
I. SHE studySoy Health Effects Study (SHE) conducted under a National Institutes of Health grant to
study the potential benefits of a dietary supplement of soy on the health of postmenopausal women. Subjects for the study consisted of women aged 45–74 y who attended screening and baseline visits and were subsequently enrolled in the Soy Health Effects (SHE) Study. The SHE Study is a randomized, double-blind, placebo-controlled trial designed to investigate the extent to which isoflavone use improves heart disease risk factors, bone density and quality of life in postmenopausal women. To be eligible for the SHE Study, women had to be at least 2 years postmenopausal, not using HRT for 3 mo, and not currently using lipid-lowering drugs, antidiabetic medications, tamoxifen, soy protein or herbal supplements. Women with a history of
uncontrolled hypertension, stroke, transient ischemic attack, cancer diagnosed <5 y ago or myocardial infarction within 6 mo were excluded from the study. A total of 210 postmenopausalwomen were enrolled in the SHE study.
References: None currently available
N Minimum Maximum Mean Std. Dev. QWB 210 0.273 1.000 0.694 0.118
CPX 210 0.000 0.559 0.294 0.107
MOB 210 0.000 0.010 0.000 0.001
PAC 210 0.000 0.102 0.010 0.023
SAC 210 0.000 0.096 0.002 0.010
AGE 207 44 74 56.79 6.38
Education N %
8th grade 3 1.4 High school 17 8.1 Some college 87 41.6 College grad 51 24.4 Some grad school 11 5.3 Post grad degree 40 19.1
Ethnicity N % African American 10 4.8 Asian/Pac. Islander 10 4.8 Caucasian 163 78 Hispanic 23 11 Native American 3 1.4

© 2008 William J. Sieber, Erik J. Groessl, Kristin M. David, Theodore G. Ganiats, and Robert M. Kaplan. All Rights Reserved. 31
II. Cataract
Between July & November 1998 patients were selected from the practices of 9 ophthalmaologists in a group practice of the Southern Ca. Kaiser-Permanente Med Group. All consecutive adult patients coming to cataract surgery were invited to participate.
Reference:
1. Rosen PN, Kaplan RM, David K. Measuring outcomes of cataract surgery using the Quality ofWell-Being Scale and VF-14 Visual Function Index. J Cataract Refract Surg. 2005Feb;31(2):369-78.
Cataract baseline (pre-surgery scores)
N Minimum Maximum Mean Std. Dev. QWB 288 0.151 1.000 0.595 0.134
CPX 288 0.000 0.559 0.359 0.102
MOB 288 0.000 0.059 0.003 0.006
PAC 288 0.000 0.163 0.034 0.044
SAC 288 0.000 0.096 0.009 0.020
AGE 277 42 91 71.43 9.07
Education N %
8th grade 14 5.2 High school 84 31.2 Some college 87 32.3 College grad 38 14.1 Some grad school 19 7.1 Post grad degree 27 10.0
Ethnicity N % African American 5 1.8 Asian/Pac. Islander 11 4.0 Caucasian 224 82.1 Hispanic 14 5.1 Native American 13 4.8 Other 6 2.2

© 2008 William J. Sieber, Erik J. Groessl, Kristin M. David, Theodore G. Ganiats, and Robert M. Kaplan. All Rights Reserved. 32
III. DPP Study
The Diabetes Prevention Program is a large, multi-site, randomized, controlled clinical trialthat compared the efficacy of an intensive lifestyle intervention to a glucose lowering drug and a placebo control. Between 1996 and 1999, 3234 non-diabetic persons who were at risk for developing diabetes were randomized to one of the 3 groups (1082 placebo, 1073 metformin (Glucophage), and 1079 lifestyle intervention).
Participants were recruited at 27 different sites nationwide. According to the study website, "Volunteers were recruited from populations known to be at particularly high risk for impaired glucose tolerance and NIDDM including the following: persons with a family history of NIDDM, the elderly, overweight individuals, women with a history of diabetes during pregnancy ("gestational diabetes"), and minority populations including African Americans, Hispanic Americans, Asian and Pacific Island Americans, and Native Americans. In order to be eligible, persons who are older than 25 years will have to demonstrate impaired glucose tolerance with plasma glucose levels 95-125 mg/dL (5.3-6.9 mmol/L) fasting and 140- 199 mg/dL (7.8 - 11.0 mmol/L) two hours after a 75 gram oral glucose tolerance test. The study-wide goal is that approximately 50% of the study population be composed of minorities and approximately 20% be 65 years of age or older"(1).
References:
1. The Diabetes Prevention Program. Design and methods for a clinical trial in the prevention oftype 2 diabetes. Diabetes Care. 1999 Apr;22(4):623-34.
2. The DPP Research Group. Reduction in the incidence of type 2 diabetes with lifestyleintervention or metformin. New England Journal of Medicine 2002 Feb; 346(6);393-403.
© 2008 William J. Sieber, Erik J. Groessl, Kristin M. David, Theodore G. Ganiats, and Robert M. Kaplan. All Rights Reserved. 33
IV. Validation of the QWB-SA in Musculoskeletal Disease
This project was conducted as part of the UCSD Multipurpose Arthritis Center and theprimary goal was to demonstrate the construct validity of the QWB-SA in persons with musculoskeletal disease and to compare them to family medicine patients without arthritis. Individuals with arthritis were recruited from three rheumatology clinics in the San Diego area, while family medicine patients were recruited from four family medicine clinics in the San Diego area
The study examined the relationships between the score obtained with the QWB with those obtained using disease specific paper and pencil measures. Second, the study compared people with arthritis to people visiting family medicine clinics for a variety of reasons other than arthritis. Research assistants approached potential subjects in the waiting rooms of the cooperating clinics. Potential subjects were told that the purpose of the study was to validate a quality of life measure for persons with arthritis, and that participation would involve completing a set of questionnaires. Interested individuals approached in family medicine clinics were asked if they had ever been diagnosed with rheumatoid arthritis, osteoarthritis, fibromyalgia, lupus, or another musculoskeletal disease. Patients reporting one of the above diagnoses were grouped with arthritis patients rather than family medicine subjects. Musculoskeletal diagnoses for participants recruited from rheumatology clinics were obtained from their physicians.
Reference:
1. Frosch D, Kaplan RM, Ganiats TG, Groessl EJ, Sieber WJ, Weisman M. Validity of self-administered quality of well-being scale in musculoskeletal disease. Arthritis Rheum. 2004Feb;51(1):28-33.
© 2008 William J. Sieber, Erik J. Groessl, Kristin M. David, Theodore G. Ganiats, and Robert M. Kaplan. All Rights Reserved. 34
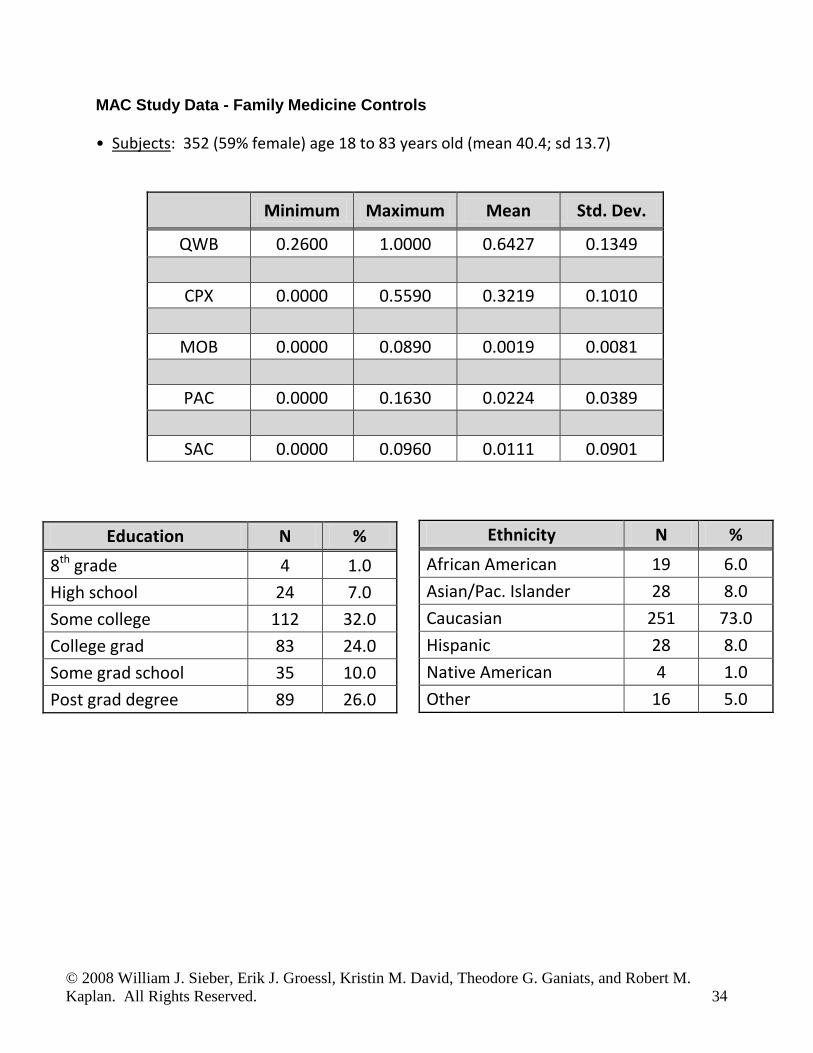
MAC Study Data - Family Medicine Controls
• Subjects: 352 (59% female) age 18 to 83 years old (mean 40.4; sd 13.7)
Minimum Maximum Mean Std. Dev.
QWB 0.2600 1.0000 0.6427 0.1349
CPX 0.0000 0.5590 0.3219 0.1010
MOB 0.0000 0.0890 0.0019 0.0081
PAC 0.0000 0.1630 0.0224 0.0389
SAC 0.0000 0.0960 0.0111 0.0901
Education N % 8th grade 4 1.0 High school 24 7.0 Some college 112 32.0 College grad 83 24.0 Some grad school 35 10.0 Post grad degree 89 26.0
Ethnicity N %
African American 19 6.0 Asian/Pac. Islander 28 8.0 Caucasian 251 73.0 Hispanic 28 8.0 Native American 4 1.0 Other 16 5.0

© 2008 William J. Sieber, Erik J. Groessl, Kristin M. David, Theodore G. Ganiats, and Robert M. Kaplan. All Rights Reserved. 35
MAC Study Data – RA Subjects
• Subjects: 220 (72% female) age 20 to 91 years old (mean 52.4; sd 15.5)
Minimum Maximum Mean Std. Dev. QWB 0.0000 0.9897 0.4966 0.1542
CPX 0.0000 0.5590 0.3846 0.1077
MOB 0.0000 0.0593 0.0027 0.0079
PAC 0.0000 0.1630 0.0662 0.0492
SAC 0.0000 0.0960 0.0272 0.0294
Education N % 8th grade 8 4.0 High school 26 12.0 Some college 86 39.0 College grad 51 23.0 Some grad school 14 6.0 Post grad degree 34 16.0
Ethnicity N % African American 13 6.0 Asian/Pac. Islander 14 6.0 Caucasian 161 74.0 Hispanic 16 7.0 Native American 9 4.0 Other 5 2.0
© 2008 William J. Sieber, Erik J. Groessl, Kristin M. David, Theodore G. Ganiats, and Robert M. Kaplan. All Rights Reserved. 36
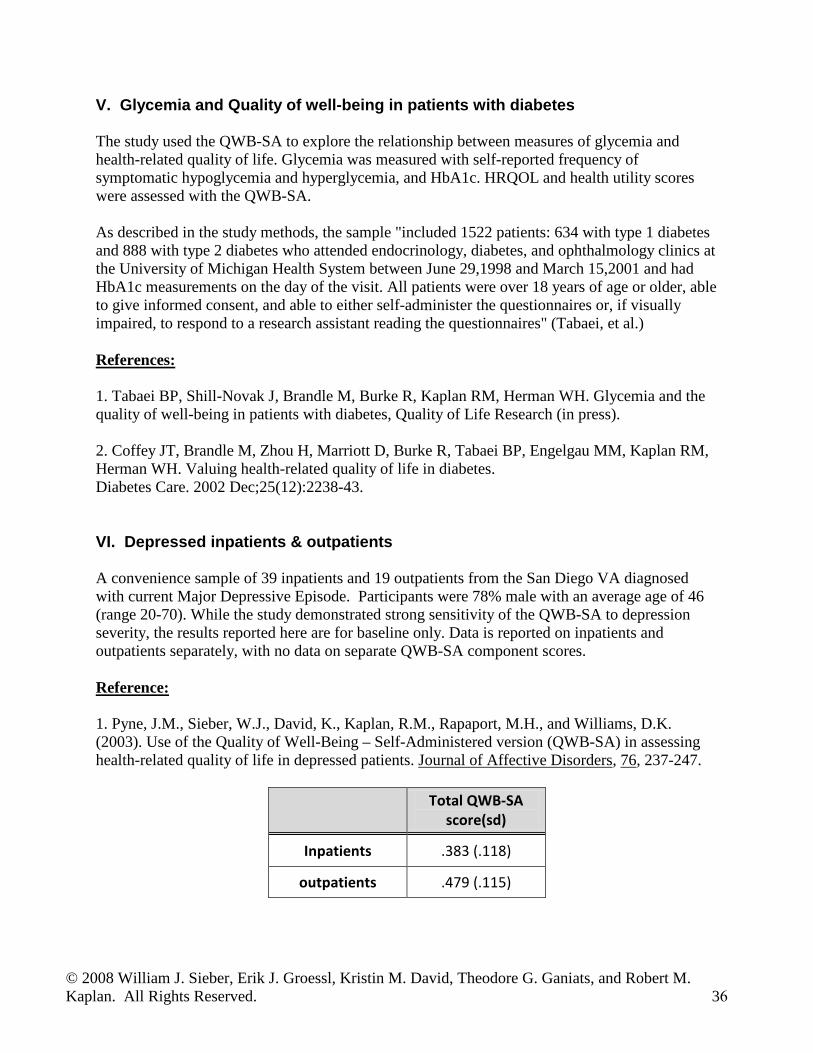
V. Glycemia and Quality of well-being in patients with diabetes
The study used the QWB-SA to explore the relationship between measures of glycemia and health-related quality of life. Glycemia was measured with self-reported frequency of symptomatic hypoglycemia and hyperglycemia, and HbA1c. HRQOL and health utility scores were assessed with the QWB-SA.
As described in the study methods, the sample "included 1522 patients: 634 with type 1 diabetes and 888 with type 2 diabetes who attended endocrinology, diabetes, and ophthalmology clinics at the University of Michigan Health System between June 29,1998 and March 15,2001 and had HbA1c measurements on the day of the visit. All patients were over 18 years of age or older, able to give informed consent, and able to either self-administer the questionnaires or, if visually impaired, to respond to a research assistant reading the questionnaires" (Tabaei, et al.)
References:
1. Tabaei BP, Shill-Novak J, Brandle M, Burke R, Kaplan RM, Herman WH. Glycemia and thequality of well-being in patients with diabetes, Quality of Life Research (in press).
2. Coffey JT, Brandle M, Zhou H, Marriott D, Burke R, Tabaei BP, Engelgau MM, Kaplan RM,Herman WH. Valuing health-related quality of life in diabetes.Diabetes Care. 2002 Dec;25(12):2238-43.
VI. Depressed inpatients & outpatients
A convenience sample of 39 inpatients and 19 outpatients from the San Diego VA diagnosed with current Major Depressive Episode. Participants were 78% male with an average age of 46 (range 20-70). While the study demonstrated strong sensitivity of the QWB-SA to depression severity, the results reported here are for baseline only. Data is reported on inpatients and outpatients separately, with no data on separate QWB-SA component scores.
Reference:
1. Pyne, J.M., Sieber, W.J., David, K., Kaplan, R.M., Rapaport, M.H., and Williams, D.K.(2003). Use of the Quality of Well-Being – Self-Administered version (QWB-SA) in assessinghealth-related quality of life in depressed patients. Journal of Affective Disorders, 76, 237-247.
Total QWB-SA score(sd)
Inpatients .383 (.118)
outpatients .479 (.115)
© 2008 William J. Sieber, Erik J. Groessl, Kristin M. David, Theodore G. Ganiats, and Robert M. Kaplan. All Rights Reserved. 37
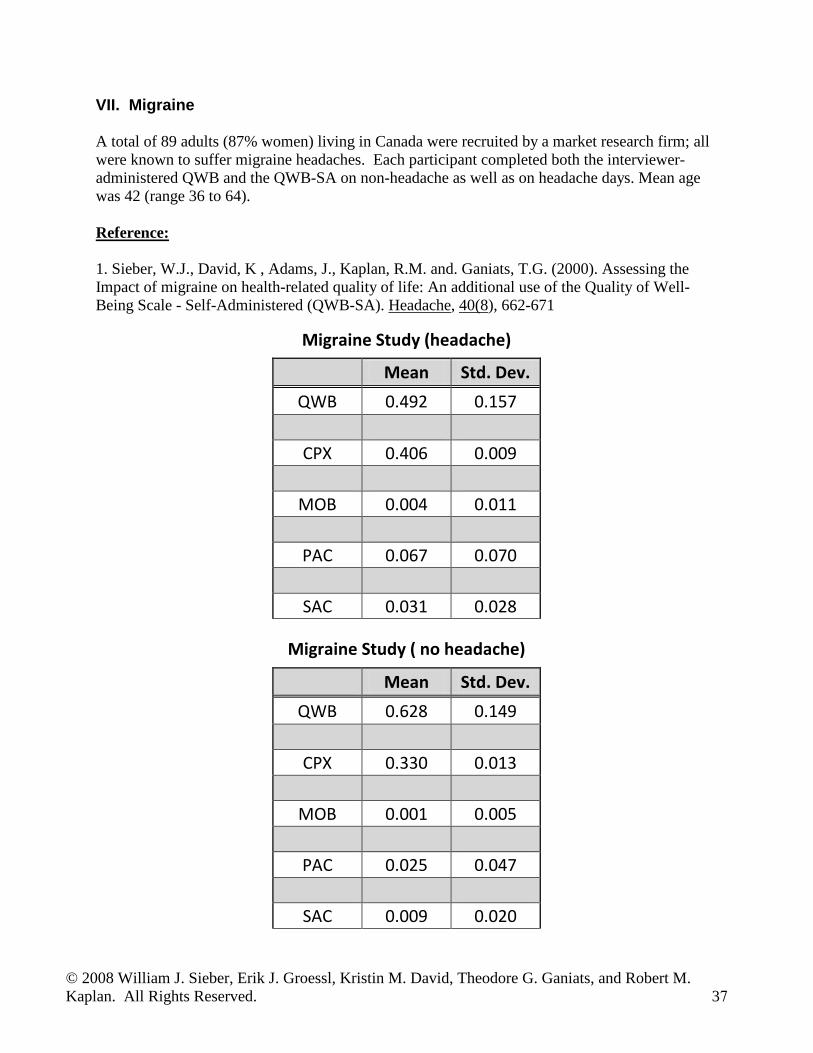
VII. Migraine
A total of 89 adults (87% women) living in Canada were recruited by a market research firm; all were known to suffer migraine headaches. Each participant completed both the interviewer-administered QWB and the QWB-SA on non-headache as well as on headache days. Mean age was 42 (range 36 to 64).
Reference:
1. Sieber, W.J., David, K , Adams, J., Kaplan, R.M. and. Ganiats, T.G. (2000). Assessing theImpact of migraine on health-related quality of life: An additional use of the Quality of Well-Being Scale - Self-Administered (QWB-SA). Headache, 40(8), 662-671
Migraine Study (headache)
Mean Std. Dev. QWB 0.492 0.157
CPX 0.406 0.009
MOB 0.004 0.011
PAC 0.067 0.070
SAC 0.031 0.028
Migraine Study ( no headache)
Mean Std. Dev. QWB 0.628 0.149
CPX 0.330 0.013
MOB 0.001 0.005
PAC 0.025 0.047
SAC 0.009 0.020
© 2008 William J. Sieber, Erik J. Groessl, Kristin M. David, Theodore G. Ganiats, and Robert M. Kaplan. All Rights Reserved. 38
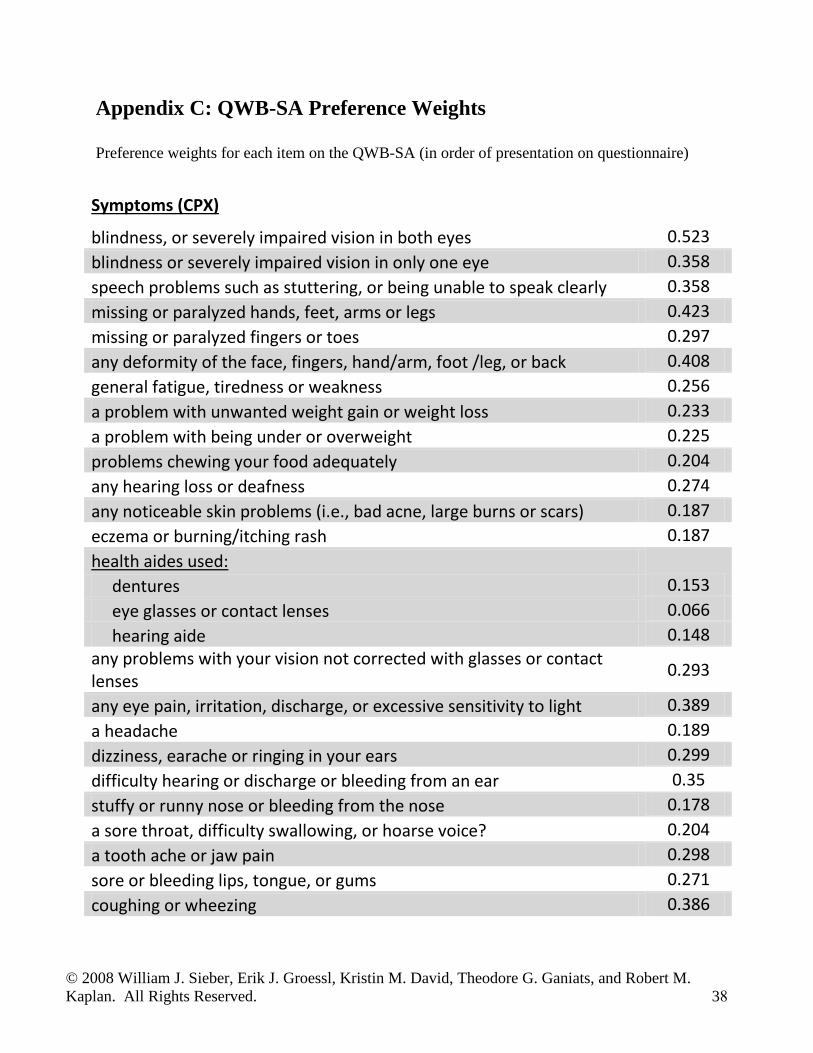
Appendix C: QWB-SA Preference Weights
Preference weights for each item on the QWB-SA (in order of presentation on questionnaire)
Symptoms (CPX)
blindness, or severely impaired vision in both eyes 0.523 blindness or severely impaired vision in only one eye 0.358 speech problems such as stuttering, or being unable to speak clearly 0.358 missing or paralyzed hands, feet, arms or legs 0.423 missing or paralyzed fingers or toes 0.297 any deformity of the face, fingers, hand/arm, foot /leg, or back 0.408 general fatigue, tiredness or weakness 0.256 a problem with unwanted weight gain or weight loss 0.233 a problem with being under or overweight 0.225 problems chewing your food adequately 0.204 any hearing loss or deafness 0.274 any noticeable skin problems (i.e., bad acne, large burns or scars) 0.187 eczema or burning/itching rash 0.187 health aides used: dentures 0.153 eye glasses or contact lenses 0.066 hearing aide 0.148 any problems with your vision not corrected with glasses or contact lenses 0.293
any eye pain, irritation, discharge, or excessive sensitivity to light 0.389 a headache 0.189 dizziness, earache or ringing in your ears 0.299 difficulty hearing or discharge or bleeding from an ear 0.35 stuffy or runny nose or bleeding from the nose 0.178 a sore throat, difficulty swallowing, or hoarse voice? 0.204 a tooth ache or jaw pain 0.298 sore or bleeding lips, tongue, or gums 0.271 coughing or wheezing 0.386

© 2008 William J. Sieber, Erik J. Groessl, Kristin M. David, Theodore G. Ganiats, and Robert M. Kaplan. All Rights Reserved. 39
Symptoms (CPX) cont. shortness of breath or difficulty breathing 0.208 chest pain, pressure, palpitations, fast or skipped heart beat or other discomfort in the chest 0.343 an upset stomach, abdominal pain, nausea, heart burn or vomiting 0.260 difficulty with bowel movements, diarrhea, constipation, rectal bleeding, black tar-like stools, or any pain or discomfort in the rectal area 0.278
pain, burning, or blood in urine 0.424 loss of bladder control, frequent night-time urination or difficulty with urination 0.259 genital pain, itching, burning, or abnormal discharge, or pelvic cramping or abnormal bleeding (does not include normal menstruation). 0.369 broken arm, wrist, foot, leg, or other broken bone (other than in back) 0.365 pain, stiffness, cramps, weakness or numbness in the neck or back 0.318 pain, stiffness, cramps, weakness or numbness in the hips or sides 0.365 pain, stiffness, cramps, weakness or numbness in any of the joints or muscles of the hand, feet, arms or legs 0.318 swelling of ankles, hands, feet, or abdomen 0.306 fever, chills, or sweats 0.320 loss of consciousness, fainting, or seizures 0.517 difficulty with your balance, standing or walking 0.377 trouble falling asleep or staying asleep 0.296 spells of feeling nervous or shaky 0.286 spells of feeling upset, downhearted, or blue 0.327 excessive worry or anxiety 0.324 feelings that you had little or no control over events in your life 0.430 feelings of being lonely or isolated 0.311 feelings of frustration, irritation or close to losing your temper 0.378 a hangover 0.297 any decrease of sexual interest or performance 0.307 Confusion, difficulty understanding the written or spoken word, or significant memory loss 0.559 thoughts or images you could not get out of your mind 0.255 take any medication including over-the-counter remedies (aspirin/Tylenol, allergy medications, insulin, hormones, estrogen, thyroid, prednisone) 0.160 to stay on a medically prescribed diet for health reasons 0.201 a loss of appetite or over-eating 0.223

© 2008 William J. Sieber, Erik J. Groessl, Kristin M. David, Theodore G. Ganiats, and Robert M. Kaplan. All Rights Reserved. 40
Mobility spend any part of the day or night as a patient in a hospital, nursing home, or rehabilitation center 0.089 either not drive a motor vehicle or not use public transportation because of your health or need help from another person to use 0.031
Physical Activity have trouble climbing stairs or inclines or walking off the curb 0.072 avoid or have trouble walking, or walk more slowly than other people your age 0.072 limp, use a cane, crutches or walker 0.072 avoid or have trouble bending over, stooping or kneeling 0.072 have any trouble lifting or carrying everyday objects such as books, a briefcase or groceries. 0.072 have any other limitations in physical movements 0.072 spend all or most of the day in a bed, chair or couch 0.163 spend all or most of the day in a wheelchair 0.102 If in wheelchair, someone else controlled its movement 0.163
Social & Self-care activity need help with your personal care needs, such as eating, dressing, bathing, or getting around our home 0.096 avoid, need help with, or were limited in doing some of your usual activities, such as work, school, or housekeeping? 0.054