Embed Size (px)
Citation preview
WASHINGTON STATE UNIVERSITY—TREE FRUIT RESEARCH AND EXTENSION CENTER
2003 ARTICLE, Quality of the 2001 Crop of Washington Apples page i of 55
POSTHARVEST INFORMATION NETWORK http://postharvest.tfrec.wsu.edu/EMK2003B.pdf
QUALITY OF THE 2001 CROP OF WASHINGTON APPLES: A REPORT TO THE WASHINGTON
TREE FRUIT INDUSTRY
Eugene Kupferman Jake Gutzwiler Nancy Buchanan Chris Sater
Washington State University Tree Fruit Research and Extension Center 1100 N. Western Ave. Wenatchee, WA 98801
Email: [email protected]
April 2003
WASHINGTON STATE UNIVERSITY—TREE FRUIT RESEARCH AND EXTENSION CENTER
2003 ARTICLE, Quality of the 2001 Crop of Washington Apples page ii of 55
POSTHARVEST INFORMATION NETWORK http://postharvest.tfrec.wsu.edu/EMK2003B.pdf
ABSTRACT This is the second part of a two-year study investigating apple quality characteristics and the variability of fruit packed by packinghouses in Washington State.
This survey includes a significant amount of fruit of the newer varieties (Braeburn, Pink Lady® brand, Cameo and Jonagold). It includes an estimation of apple edible quality (firmness, soluble solids and acidity) and fruit temperature at time of packing on nine varieties. Firmness evaluations were performed using traditional destructive technology (penetrometer) as well as nondestructive acoustical firmness.
Acidity levels and firmness changed a great deal during the season while soluble solids levels changed the least. Acidity declined the most in Granny Smith, Pink Lady® brand and Fuji as compared to other varieties. Low acidity levels and poor sugar/acid ratios result in bland flavor. This is typical of Red Delicious and Fuji at the end of the season.
Braeburn, Golden Delicious and Jonagold apples had the widest range in individual apple firmness. Six percent of all Red Delicious apples were below 12 lbf at the time of packing.
Quality varied over time to different degrees dependent upon variety. With most varieties, apples early in the packing season were firm, high in acidity and low in soluble solids. These factors changed slowly as fruit was packed out of regular storage. In December, fruit firmness and acidity increased as CA rooms were opened and over time both quality parameters declined.
However, all varieties did not behave in the same way. The firmness of Braeburn and Cameo declined during the packing season more than other varieties. Gala apples held firmness throughout the packing season. Golden Delicious apples lost firmness dramatically following regular storage more than out of CA. Firmness of Red Delicious was not related to packing date with both firm and soft apples available year-round. To provide higher and more consistent quality the industry should consider shortening the length of time it takes to obtain CA certification from 60 days to 45 days for both Red Delicious and Golden Delicious or raise grade standards for both firmness and SS.
The quality of apples from the 2001 crop packed between January and the end of the packing season was superior to the quality from the 2000 crop in most attributes. The largest difference in fruit quality between the two years was in Fuji and the least was in Gala.
Internal apple temperature at time of packing ranged from 34 ºF to 90 ºF. External temperature ranged from 44 ºF to 87 ºF.
The quality of apples was also related to packinghouse and is tabulated within the report.
Acknowledgements: This project was funded by the Washington Tree Fruit Research Commission and Washington State University. Technical help by Chris Sater, Nancy Buchanan and Marya Madsen Vidal. Special thanks to all of the packinghouses that participated in this survey.
WASHINGTON STATE UNIVERSITY—TREE FRUIT RESEARCH AND EXTENSION CENTER
2003 ARTICLE, Quality of the 2001 Crop of Washington Apples page iii of 55
POSTHARVEST INFORMATION NETWORK http://postharvest.tfrec.wsu.edu/EMK2003B.pdf
TABLE OF CONTENTS 1. INTRODUCTION .................................................................................................................. 1
1.1 METHODS ..................................................................................................................... 1 1.1.1 Sampling methodology ........................................................................................... 1 1.1.2 Description of the firmness instruments ................................................................. 2
1.2 TEMPERATURE ........................................................................................................... 4 2. APPLE QUALITY.................................................................................................................. 5
2.1 BRAEBURN QUALITY—2001 CROP ........................................................................ 6 2.1.1 Individual apples..................................................................................................... 6 2.1.2 Apple samples......................................................................................................... 6 2.1.3 Packinghouse information ...................................................................................... 6 2.1.4 Historical perspective for Braeburn ........................................................................ 7
2.2 CAMEO QUALITY—2001 CROP.............................................................................. 11 2.2.1 Individual apples................................................................................................... 11 2.2.2 Apple samples....................................................................................................... 11 2.2.3 Packinghouse information .................................................................................... 11 2.2.4 Historical perspective for Cameo.......................................................................... 12
2.3 FUJI QUALITY—2001 CROP .................................................................................... 16 2.3.1 Individual apples................................................................................................... 16 2.3.2 Apple samples....................................................................................................... 16 2.3.3 Packinghouse information .................................................................................... 17 2.3.4 Historical perspective for Fuji .............................................................................. 17
2.4 GALA QUALITY—2001 CROP ................................................................................. 21 2.4.1 Individual apples................................................................................................... 21 2.4.2 Apple samples....................................................................................................... 21 2.4.3 Packinghouse information .................................................................................... 21 2.4.4 Historical perspective for Gala ............................................................................. 22
2.5 GOLDEN DELICIOUS QUALITY—2001 CROP...................................................... 26 2.5.1 Individual apples................................................................................................... 26 2.5.2 Apple samples....................................................................................................... 26 2.5.3 Packinghouse information .................................................................................... 27 2.5.4 Historical perspective for Golden Delicious......................................................... 27
2.6 GRANNY SMITH QUALITY—2001 CROP.............................................................. 31 2.6.1 Individual apples................................................................................................... 31 2.6.2 Apple samples....................................................................................................... 31 2.6.3 Packinghouse information .................................................................................... 32 2.6.4 Historical perspective for Granny Smith .............................................................. 32
2.7 JONAGOLD QUALITY—2001 CROP....................................................................... 36 2.7.1 Individual apples................................................................................................... 36 2.7.2 Apple samples....................................................................................................... 36 2.7.3 Packinghouse information .................................................................................... 36 2.7.4 Historical perspective for Jonagold ...................................................................... 37
2.8 PINK LADY® BRAND APPLE QUALITY—2001 CROP........................................ 41 2.8.1 Individual apples................................................................................................... 41 2.8.2 Apple samples....................................................................................................... 41

WASHINGTON STATE UNIVERSITY—TREE FRUIT RESEARCH AND EXTENSION CENTER
2003 ARTICLE, Quality of the 2001 Crop of Washington Apples page iv of 55
POSTHARVEST INFORMATION NETWORK http://postharvest.tfrec.wsu.edu/EMK2003B.pdf
2.8.3 Packinghouse information .................................................................................... 41 2.8.4 Historical perspective for Pink Lady® brand apples ............................................ 41
2.9 RED DELICIOUS QUALITY—2001 CROP .............................................................. 45 2.9.1 Individual apples................................................................................................... 45 2.9.2 Apple samples....................................................................................................... 45 2.9.3 Packinghouse information .................................................................................... 46 2.9.4 Historical perspective for Red Delicious .............................................................. 46
3. CHANGES IN QUALITY.................................................................................................... 50 3.1 GALA QUALITY......................................................................................................... 50 3.2 GOLDEN DELICIOUS QUALITY ............................................................................. 50 3.3 RED DELICIOUS QUALITY...................................................................................... 50 3.4 COMPARING THE PATTERNS OF CHANGE OF GALA, GOLDEN DELICIOUS AND RED DELICIOUS............................................................................................... 51
4. COMPARISON OF 2000 AND 2001 CROPS..................................................................... 54 5. CONCLUSIONS................................................................................................................... 55
WASHINGTON STATE UNIVERSITY—TREE FRUIT RESEARCH AND EXTENSION CENTER
2003 ARTICLE, Quality of the 2001 Crop of Washington Apples page v of 55
POSTHARVEST INFORMATION NETWORK http://postharvest.tfrec.wsu.edu/EMK2003B.pdf
LIST OF FIGURES Figure 1. Acoustic and destructive firmness correlation, 2001 crop .............................................3
Figure 2. Braeburn acoustic and destructive firmness based on individual apples, 2001 crop .....8
Figure 3. Braeburn sample average acoustic and destructive firmness by week, 2001 crop.........9
Figure 4. Braeburn sample average SS and TA by week, 2001 crop ..........................................10
Figure 5. Cameo acoustic and destructive firmness based on individual apples, 2001 crop .......13
Figure 6. Cameo sample average acoustic and destructive firmness by week, 2001 crop ..........14
Figure 7. Cameo sample average SS and TA by week, 2001 crop ..............................................15
Figure 8. Fuji acoustic and destructive firmness based on individual apples, 2001 crop............18
Figure 9. Fuji sample average acoustic and destructive firmness by week, 2001 crop ...............19
Figure 10. Fuji sample average SS and TA by week, 2001 crop.................................................20
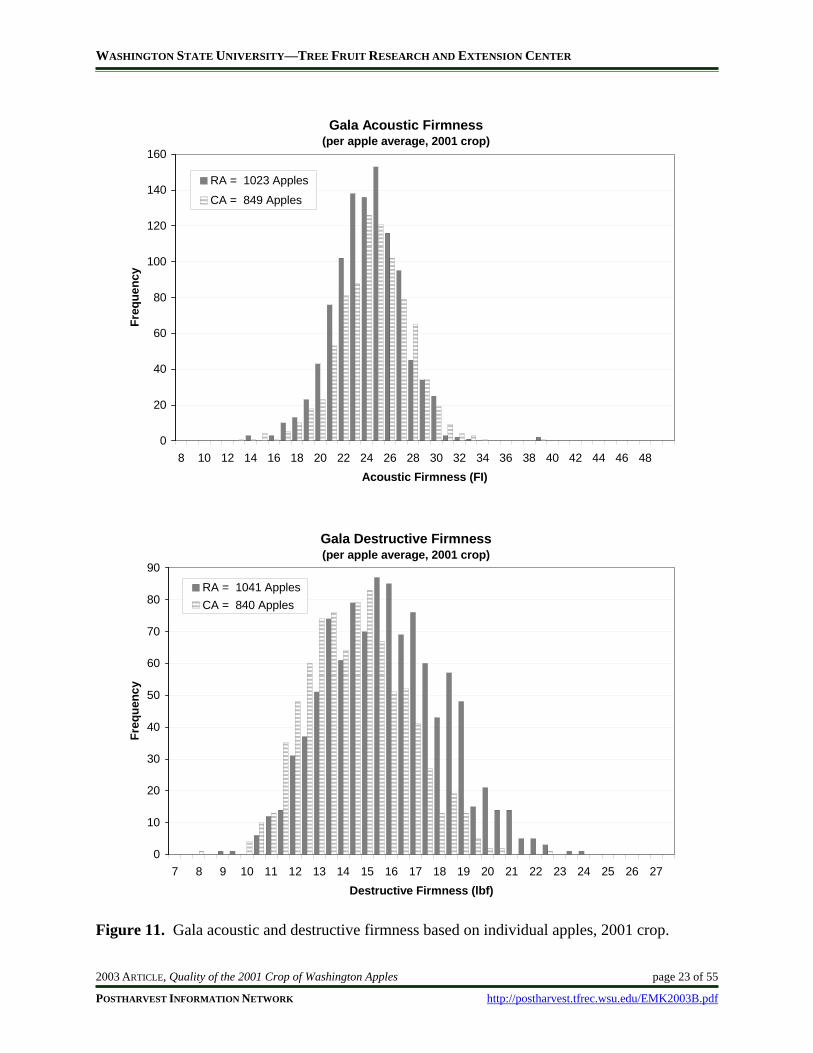
Figure 11. Gala acoustic and destructive firmness based on individual apples, 2001 crop.........23
Figure 12. Gala sample average acoustic and destructive firmness by week, 2001 crop ............24
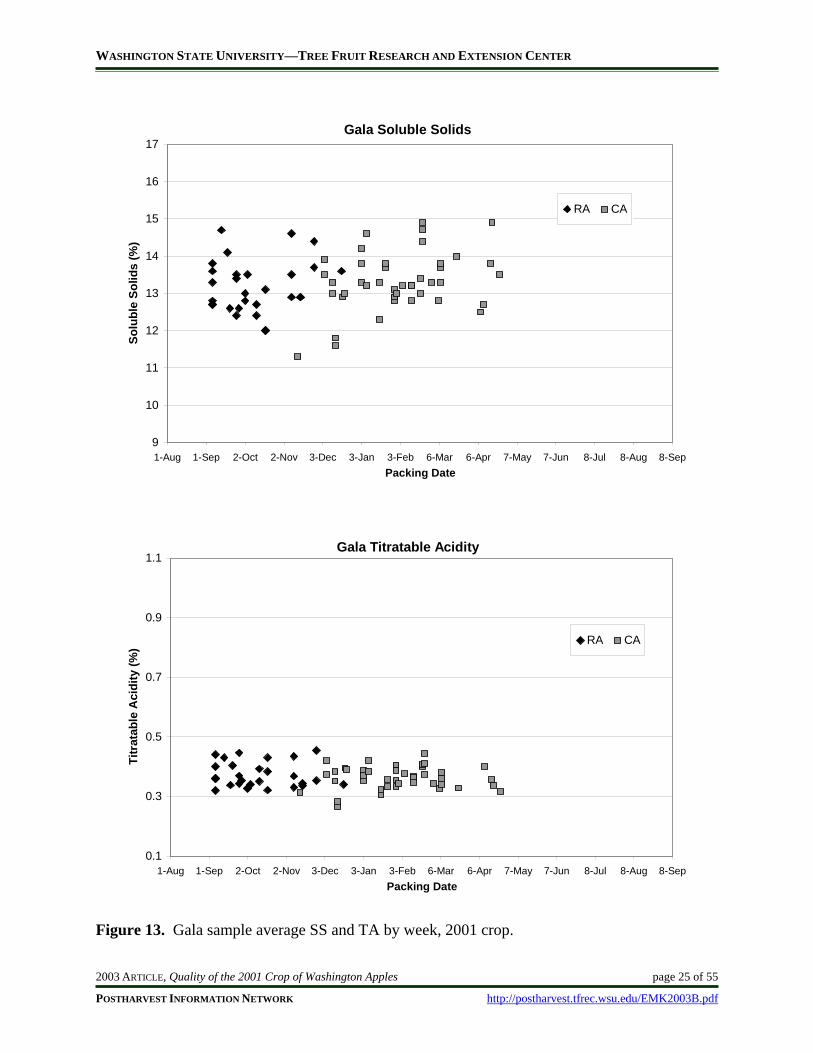
Figure 13. Gala sample average SS and TA by week, 2001 crop................................................25
Figure 14. Golden Delicious acoustic and destructive firmness based on individual apples, 2001 crop ..................................................................................................................28
Figure 15. Golden Delicious sample average acoustic and destructive firmness by week, 2001 crop ..................................................................................................................29
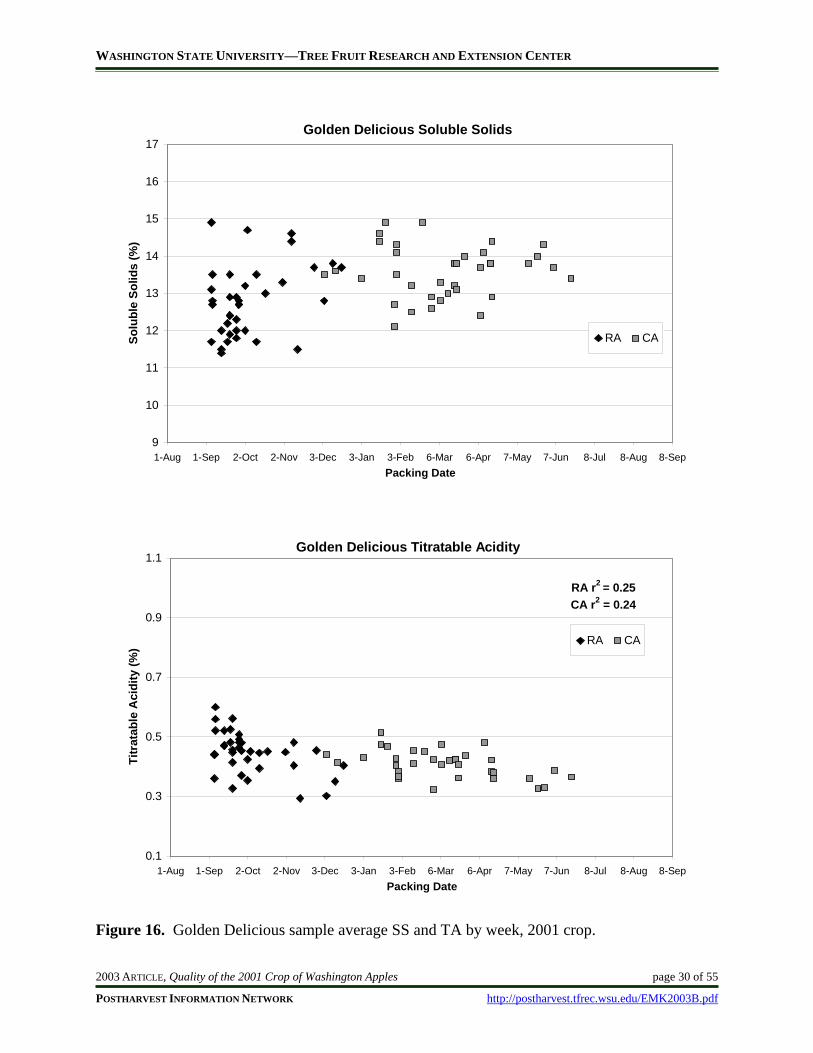
Figure 16. Golden Delicious sample average SS and TA by week, 2001 crop ...........................30
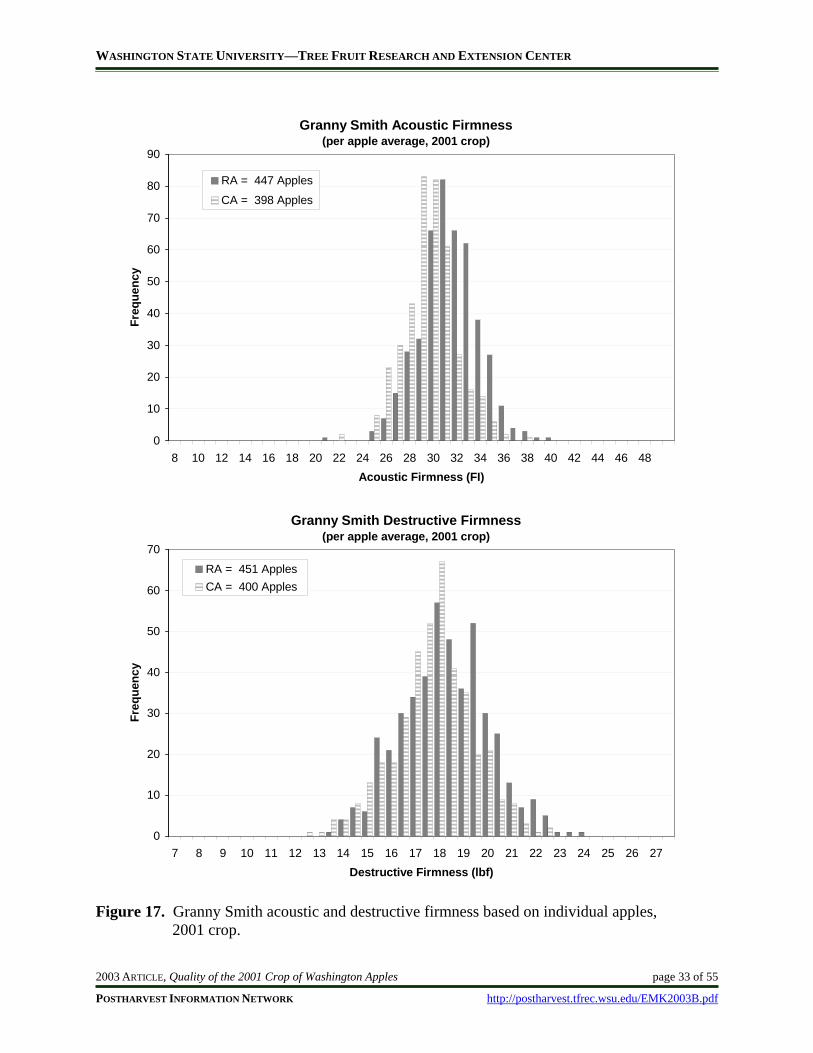
Figure 17. Granny Smith acoustic and destructive firmness based on individual apples, 2001 crop ..................................................................................................................33
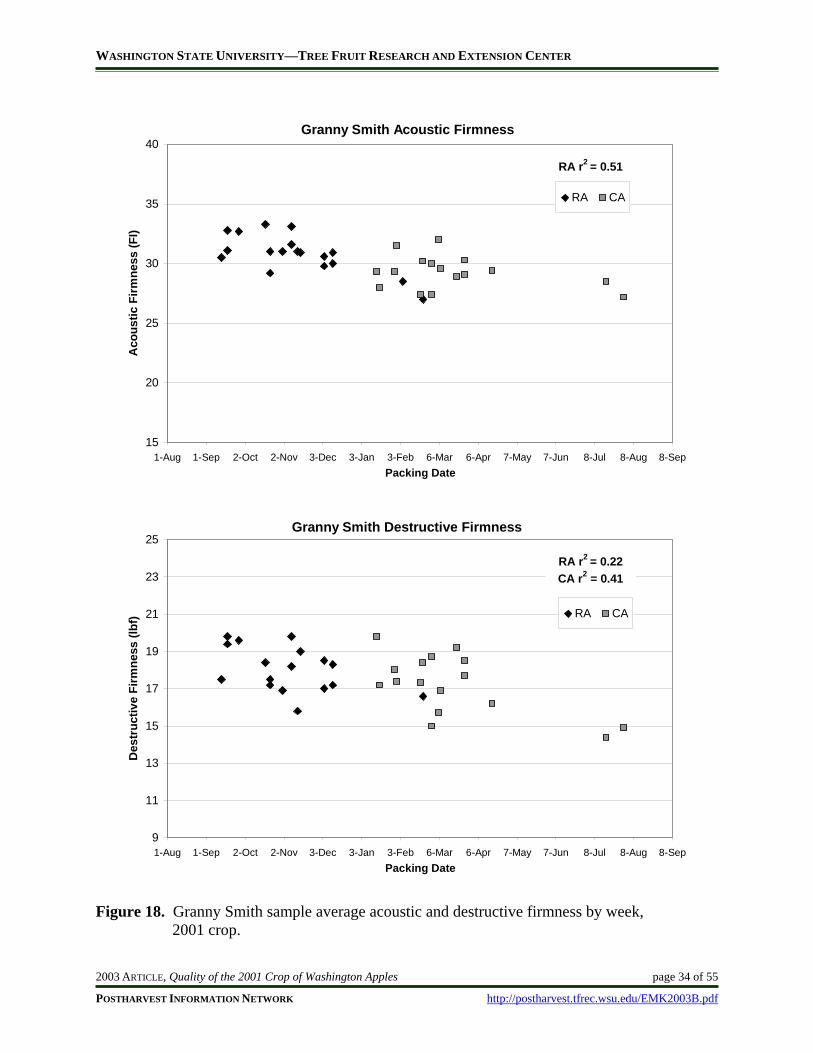
Figure 18. Granny Smith sample average acoustic and destructive firmness by week, 2001 crop ..................................................................................................................34
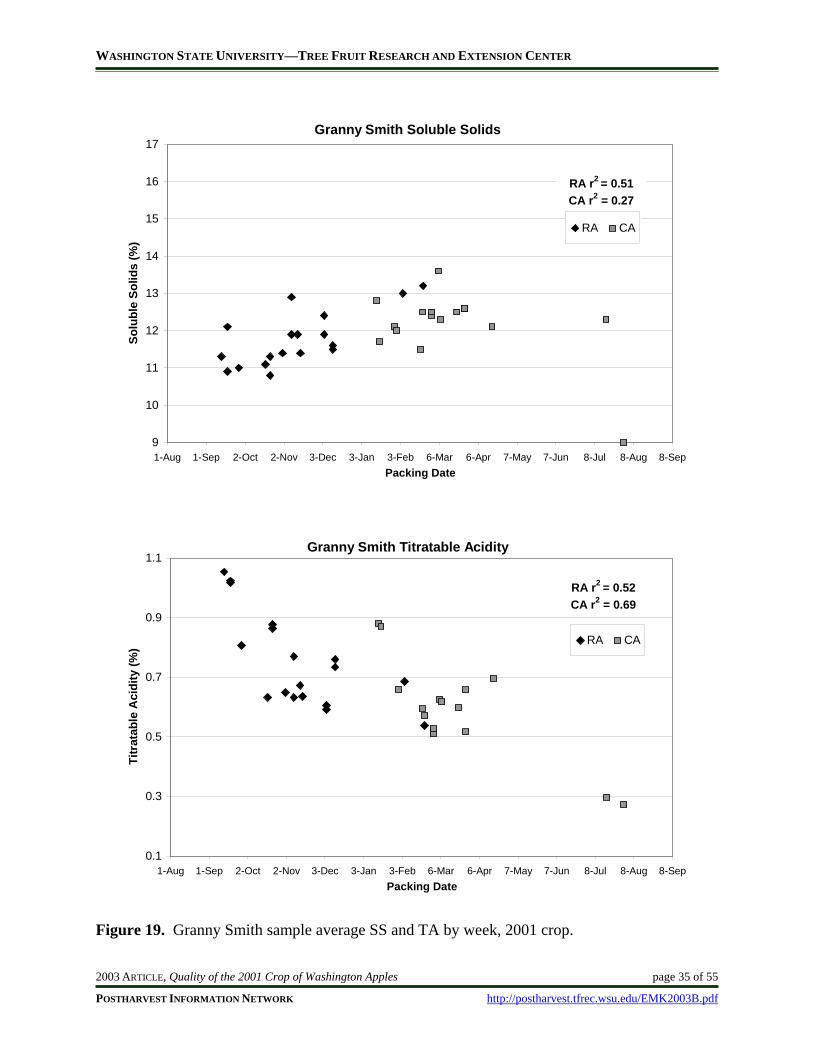
Figure 19. Granny Smith sample average SS and TA by week, 2001 crop.................................35
Figure 20. Jonagold acoustic and destructive firmness based on individual apples, 2001 crop..38
Figure 21. Jonagold sample average acoustic and destructive firmness by week, 2001 crop .....39
Figure 22. Jonagold sample average SS and TA by week, 2001 crop.........................................40
Figure 23. Pink Lady® brand acoustic and destructive firmness based on individual apples, 2001 crop ..................................................................................................................42
Figure 24. Pink Lady® brand sample average acoustic and destructive firmness by week, 2001 crop ..................................................................................................................43
Figure 25. Pink Lady® brand sample average SS and TA by week, 2001 crop..........................44
Figure 26. Red Delicious acoustic and destructive firmness based on individual apples, 2001 crop ..................................................................................................................47

WASHINGTON STATE UNIVERSITY—TREE FRUIT RESEARCH AND EXTENSION CENTER
2003 ARTICLE, Quality of the 2001 Crop of Washington Apples page vi of 55
POSTHARVEST INFORMATION NETWORK http://postharvest.tfrec.wsu.edu/EMK2003B.pdf
Figure 27. Red Delicious sample average acoustic and destructive firmness by week, 2001 crop ..................................................................................................................48
Figure 28. Red Delicious sample average SS and TA by week, 2001 crop.................................49
Figure 29. Firmness of Gala samples 0 to 140 days after harvest, 2001 crop. ............................52
Figure 30. Firmness of Golden Delicious samples 0 to 140 days after harvest, 2001 crop.........52
Figure 31. Firmness of Red Delicious samples 0 to 140 days after harvest, 2001 crop ..............53
LIST OF TABLES Table 1. Number of samples of each variety, 2001 crop year..................................................... 1
Table 2. Average apple internal and external temperature by variety, 2001 crop ...................... 4
Table 3. Summary of Braeburn quality attributes by packinghouse ........................................... 6
Table 4. Comparison of Braeburn quality attributes in 2000 and 2001 ...................................... 7
Table 5. Summary of Cameo quality attributes by packinghouse............................................. 11
Table 6. Comparison of Cameo quality attributes in 2000 and 2001........................................ 12
Table 7. Summary of Fuji quality attributes by packinghouse ................................................. 17
Table 8. Comparison of Fuji quality attributes over the past 10 years...................................... 17
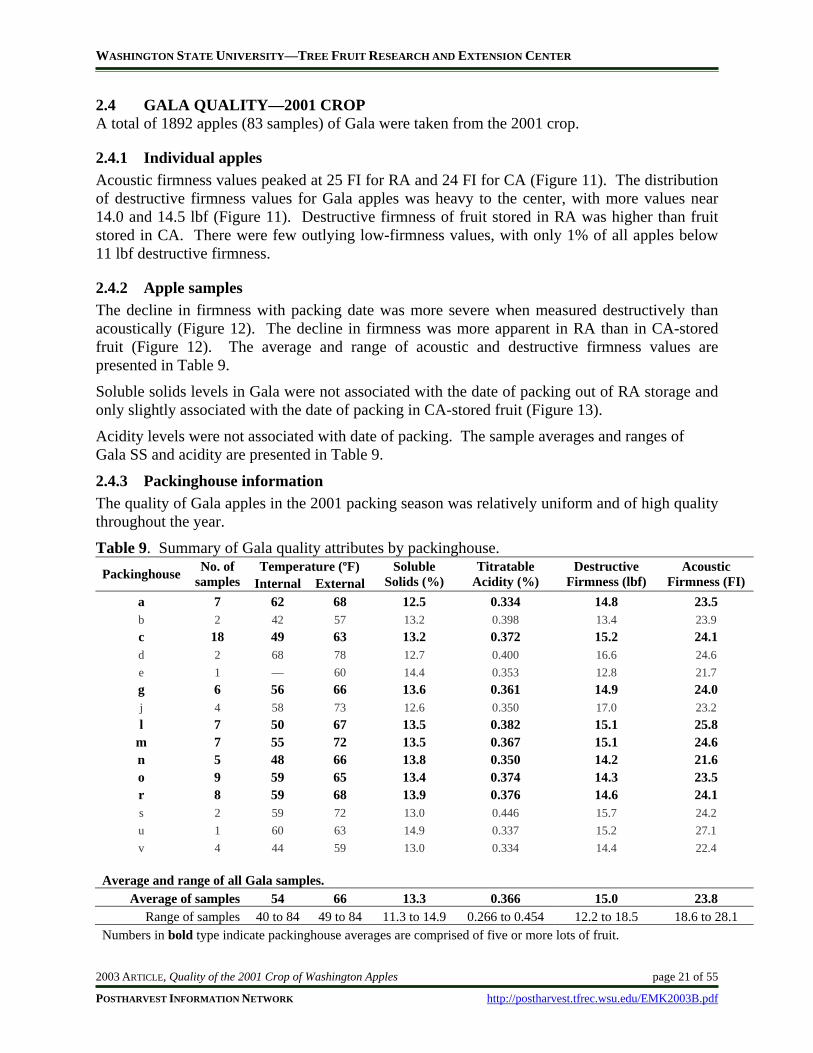
Table 9. Summary of Gala quality attributes by packinghouse ................................................ 21
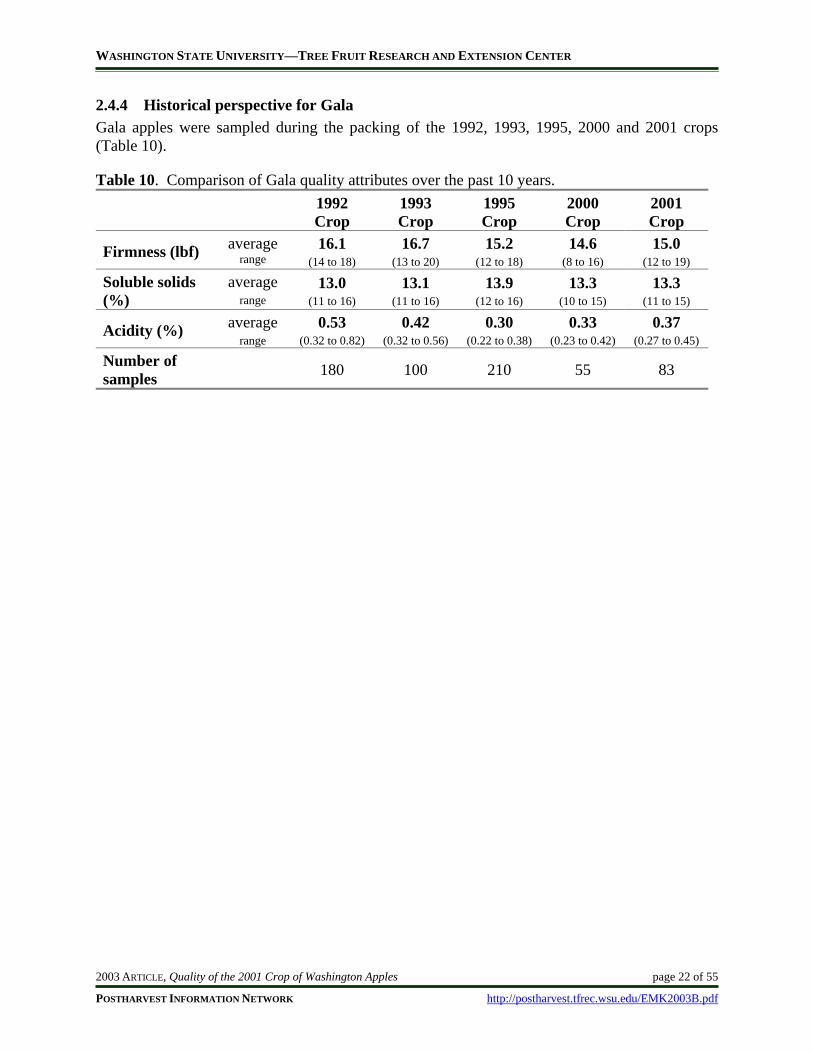
Table 10. Comparison of Gala quality attributes over the past 10 years .................................. 22
Table 11. Summary of Golden Delicious quality attributes by packinghouse.......................... 27
Table 12. Comparison of Golden Delicious quality attributes in 1991, 2000 and 2001........... 27
Table 13. Summary of Granny Smith quality attributes by packinghouse ............................... 32
Table 14. Comparison of Granny Smith quality attributes in 1995, 2000 and 2001 ................ 32
Table 15. Summary of Jonagold quality attributes by packinghouse ....................................... 36
Table 16. Comparison of Jonagold quality attributes in 2000 and 2001................................... 37
Table 17. Summary of Pink Lady® brand quality attributes by packinghouse ........................ 41
Table 18. Comparison of Pink Lady® brand quality attributes in 2000 and 2001 ................... 41
Table 19. Summary of Red Delicious quality attributes by packinghouse ............................... 46
Table 20. Comparison of Red Delicious quality attributes over the past 12 years ................... 46
WASHINGTON STATE UNIVERSITY—TREE FRUIT RESEARCH AND EXTENSION CENTER
2003 ARTICLE, Quality of the 2001 Crop of Washington Apples page 1 of 55
POSTHARVEST INFORMATION NETWORK http://postharvest.tfrec.wsu.edu/EMK2003B.pdf
1. INTRODUCTION This is the second part of a two-year study investigating apple quality characteristics and the variability of fruit packed by packinghouses in Washington State.
The Grade and Pack Committee of the Washington State Horticultural Association requested we initiate a survey of the quality of Washington grown apples. Funding was obtained from the Tree Fruit Research Commission. The survey is intended to provide data for the development of standards based on edible quality. Samples of apples were obtained at the time of packing from cooperating packinghouses throughout the packing season.
This report describes the methods used and the results of sampling the major Washington apple varieties from the 2001 harvest with comparisons to the 2000 crop.
1.1 METHODS
1.1.1 Sampling methodology Sampling for the 2001 packing season began on August 6, 2001 and continued through September 18, 2002. Sampling consisted of 25-apple samples taken from 35 different packing lines, located in three different regions of Eastern Washington. Nineteen packinghouses in Yakima were routinely sampled, seven in Wenatchee and nine north of Wenatchee. None of the fruit sampled had been treated with AgroFresh™ (MCP).
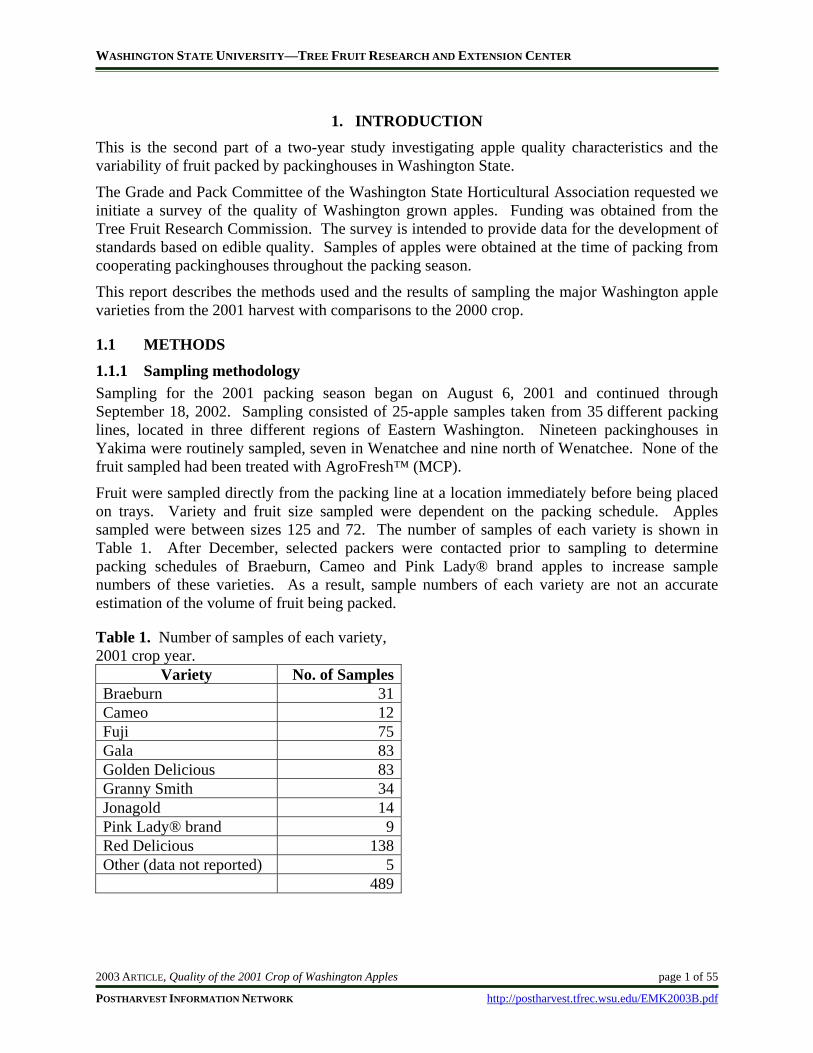
Fruit were sampled directly from the packing line at a location immediately before being placed on trays. Variety and fruit size sampled were dependent on the packing schedule. Apples sampled were between sizes 125 and 72. The number of samples of each variety is shown in Table 1. After December, selected packers were contacted prior to sampling to determine packing schedules of Braeburn, Cameo and Pink Lady® brand apples to increase sample numbers of these varieties. As a result, sample numbers of each variety are not an accurate estimation of the volume of fruit being packed.
Table 1. Number of samples of each variety, 2001 crop year.
Variety No. of SamplesBraeburn 31Cameo 12Fuji 75Gala 83Golden Delicious 83Granny Smith 34Jonagold 14Pink Lady® brand 9Red Delicious 138Other (data not reported) 5 489
WASHINGTON STATE UNIVERSITY—TREE FRUIT RESEARCH AND EXTENSION CENTER
2003 ARTICLE, Quality of the 2001 Crop of Washington Apples page 2 of 55
POSTHARVEST INFORMATION NETWORK http://postharvest.tfrec.wsu.edu/EMK2003B.pdf
The information collected at the packinghouse on each lot of fruit consisted of:
• Storage type (storage temperature, O2 and CO2 levels) • CA room opening dates • Grower/lot numbers and orchard locations • Flesh temperature of five apples (determined with a PT-2 thermocouple thermometer;
Ryan Instruments, Redmond, Washington) • External temperature of five apples (determined with a non-contact infrared thermometer
by Ryan Instruments, Redmond, Washington)
Fruit were taken to the WSU-TFREC Postharvest lab and analyzed for the following quality characteristics:
• Non-destructive acoustical firmness measurement (AWETA Acoustical Firmness Sensor; Nootdorp, the Netherlands)
• Destructive firmness measurement (Fruit Texture Analyzer, Güss Manufacturing; Strand, South Africa)
• Soluble solids (SS) levels (Palette Digital Refractometer; Atago, Tokyo, Japan) • Titratable acidity (TA) level (Titrino Automatic Titrator; Metrohm, Herisau,
Switzerland).
While the attributes of flavor, aroma and juiciness are important factors in acceptability, it was not possible to determine these factors in an accurate and efficient manner given the volume of fruit examined.
1.1.2 Description of the firmness instruments The acoustical firmness was measured using the AWETA Acoustic Firmness Sensor. This instrument delivers a slight impact to the apple surface, sending vibrations through the apple which are sent back to the device through a miniature hearing aid. The sonic vibration detected (which is based on the return vibration of a sphere) is then converted to a numeric value. Round apples produce the most accurate results.
The acoustical firmness of each apple was measured on three locations around the circumference. The average of the three readings was reported as the acoustical firmness value for the apple.
The destructive firmness was measured using the Fruit Texture Analyzer, an automated Magness-Taylor penetrometer instrument. The Magness-Taylor method determines the amount of force (pounds-force [lbf]) required to overcome the resistance of the cell walls as the probe penetrates fruit flesh. The Fruit Texture Analyzer is more consistent than a manually compressed penetrometer (e.g., Effegi) because probe speed and depth are regulated by the machine. Although the Magness-Taylor method is the industry standard, it only determines firmness at a single point for each measurement. For this survey, the destructive firmness was measured at two points on each apple (on the shoulders between the sun and shade sides), and the average was reported.
WASHINGTON STATE UNIVERSITY—TREE FRUIT RESEARCH AND EXTENSION CENTER
2003 ARTICLE, Quality of the 2001 Crop of Washington Apples page 3 of 55
POSTHARVEST INFORMATION NETWORK http://postharvest.tfrec.wsu.edu/EMK2003B.pdf
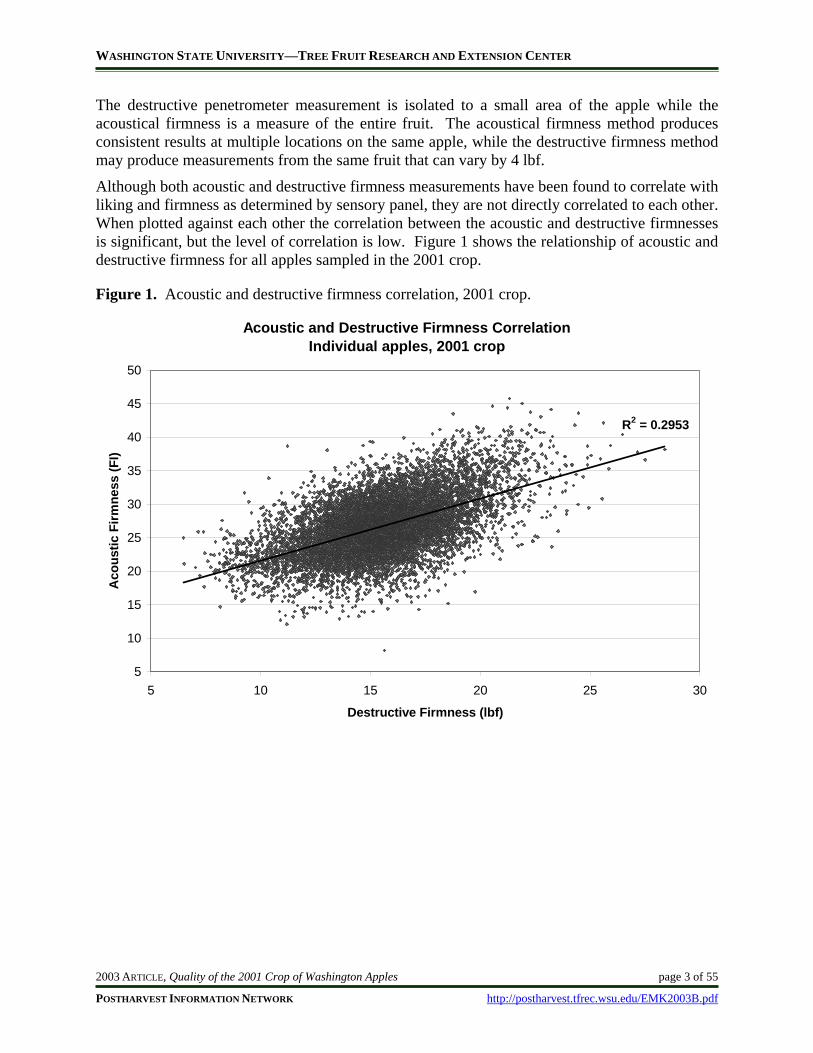
The destructive penetrometer measurement is isolated to a small area of the apple while the acoustical firmness is a measure of the entire fruit. The acoustical firmness method produces consistent results at multiple locations on the same apple, while the destructive firmness method may produce measurements from the same fruit that can vary by 4 lbf.
Although both acoustic and destructive firmness measurements have been found to correlate with liking and firmness as determined by sensory panel, they are not directly correlated to each other. When plotted against each other the correlation between the acoustic and destructive firmnesses is significant, but the level of correlation is low. Figure 1 shows the relationship of acoustic and destructive firmness for all apples sampled in the 2001 crop.
Figure 1. Acoustic and destructive firmness correlation, 2001 crop.
Acoustic and Destructive Firmness CorrelationIndividual apples, 2001 crop
R2 = 0.2953
5
10
15
20
25
30
35
40
45
50
5 10 15 20 25 30
Destructive Firmness (lbf)
Aco
ustic
Firm
ness
(FI)
WASHINGTON STATE UNIVERSITY—TREE FRUIT RESEARCH AND EXTENSION CENTER
2003 ARTICLE, Quality of the 2001 Crop of Washington Apples page 4 of 55
POSTHARVEST INFORMATION NETWORK http://postharvest.tfrec.wsu.edu/EMK2003B.pdf
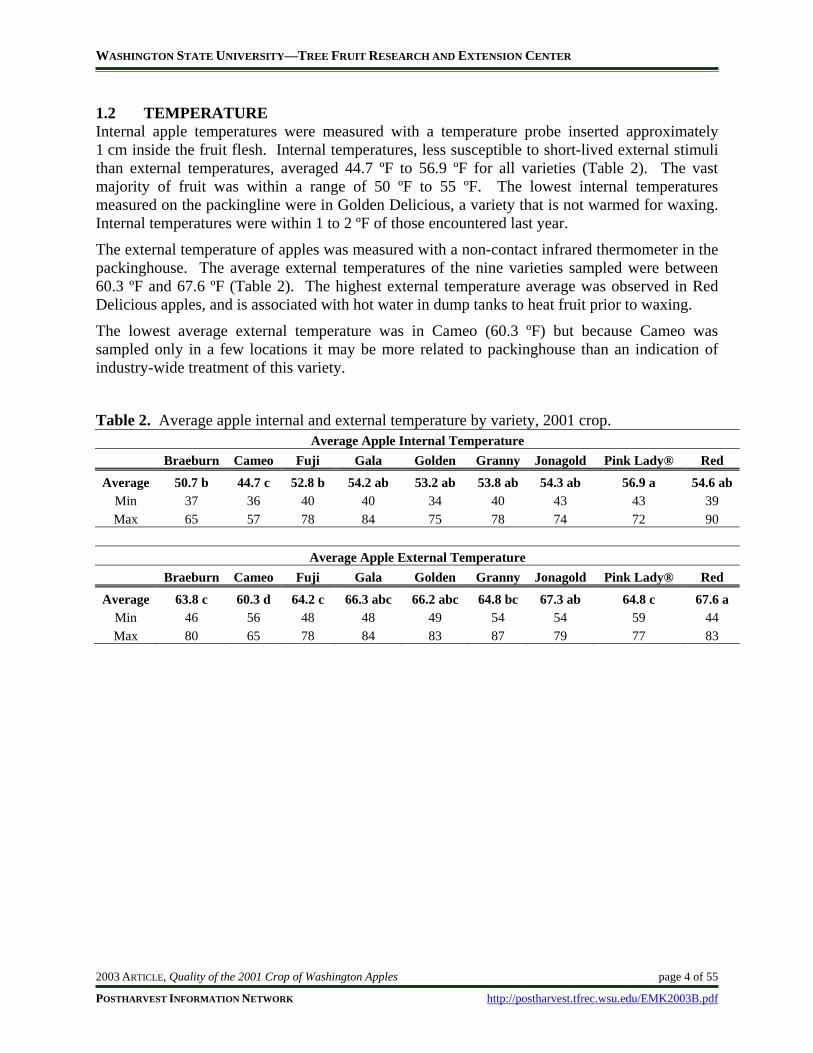
1.2 TEMPERATURE Internal apple temperatures were measured with a temperature probe inserted approximately 1 cm inside the fruit flesh. Internal temperatures, less susceptible to short-lived external stimuli than external temperatures, averaged 44.7 ºF to 56.9 ºF for all varieties (Table 2). The vast majority of fruit was within a range of 50 ºF to 55 ºF. The lowest internal temperatures measured on the packingline were in Golden Delicious, a variety that is not warmed for waxing. Internal temperatures were within 1 to 2 ºF of those encountered last year.
The external temperature of apples was measured with a non-contact infrared thermometer in the packinghouse. The average external temperatures of the nine varieties sampled were between 60.3 ºF and 67.6 ºF (Table 2). The highest external temperature average was observed in Red Delicious apples, and is associated with hot water in dump tanks to heat fruit prior to waxing.
The lowest average external temperature was in Cameo (60.3 ºF) but because Cameo was sampled only in a few locations it may be more related to packinghouse than an indication of industry-wide treatment of this variety.
Table 2. Average apple internal and external temperature by variety, 2001 crop. Average Apple Internal Temperature
Braeburn Cameo Fuji Gala Golden Granny Jonagold Pink Lady® Red
Average 50.7 b 44.7 c 52.8 b 54.2 ab 53.2 ab 53.8 ab 54.3 ab 56.9 a 54.6 ab Min 37 36 40 40 34 40 43 43 39 Max 65 57 78 84 75 78 74 72 90
Average Apple External Temperature
Braeburn Cameo Fuji Gala Golden Granny Jonagold Pink Lady® Red
Average 63.8 c 60.3 d 64.2 c 66.3 abc 66.2 abc 64.8 bc 67.3 ab 64.8 c 67.6 a Min 46 56 48 48 49 54 54 59 44 Max 80 65 78 84 83 87 79 77 83
WASHINGTON STATE UNIVERSITY—TREE FRUIT RESEARCH AND EXTENSION CENTER
2003 ARTICLE, Quality of the 2001 Crop of Washington Apples page 5 of 55
POSTHARVEST INFORMATION NETWORK http://postharvest.tfrec.wsu.edu/EMK2003B.pdf
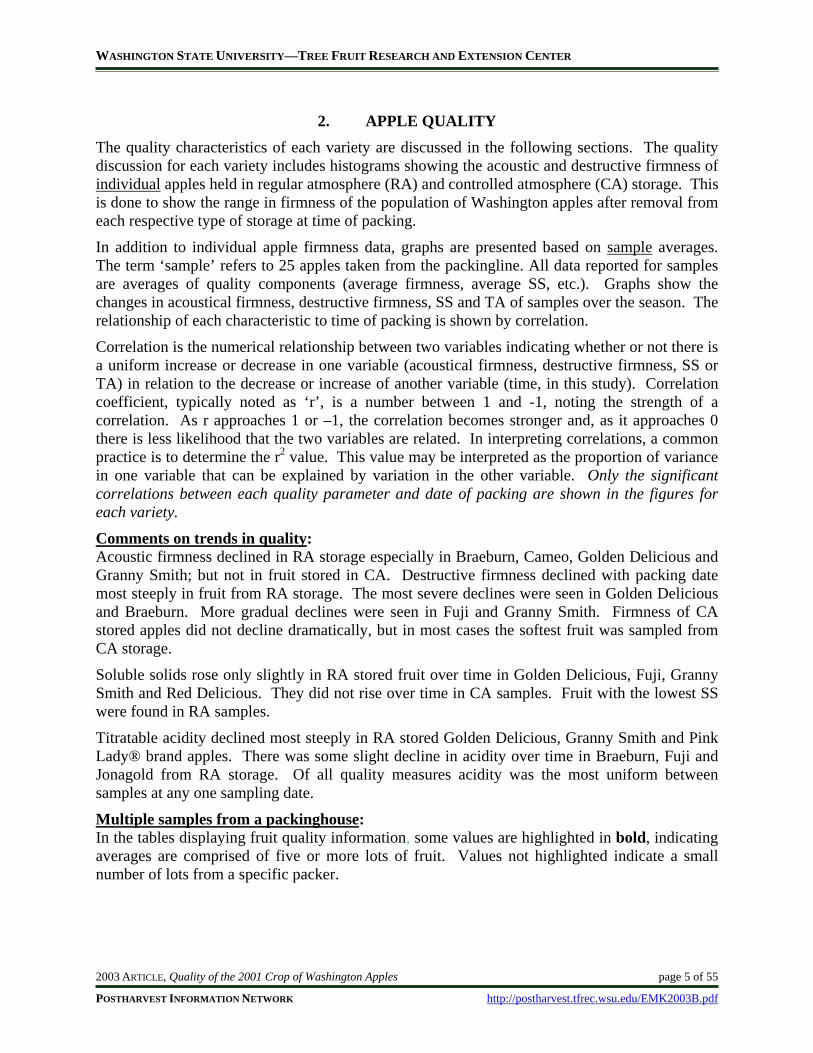
2. APPLE QUALITY The quality characteristics of each variety are discussed in the following sections. The quality discussion for each variety includes histograms showing the acoustic and destructive firmness of individual apples held in regular atmosphere (RA) and controlled atmosphere (CA) storage. This is done to show the range in firmness of the population of Washington apples after removal from each respective type of storage at time of packing.
In addition to individual apple firmness data, graphs are presented based on sample averages. The term ‘sample’ refers to 25 apples taken from the packingline. All data reported for samples are averages of quality components (average firmness, average SS, etc.). Graphs show the changes in acoustical firmness, destructive firmness, SS and TA of samples over the season. The relationship of each characteristic to time of packing is shown by correlation.
Correlation is the numerical relationship between two variables indicating whether or not there is a uniform increase or decrease in one variable (acoustical firmness, destructive firmness, SS or TA) in relation to the decrease or increase of another variable (time, in this study). Correlation coefficient, typically noted as ‘r’, is a number between 1 and -1, noting the strength of a correlation. As r approaches 1 or –1, the correlation becomes stronger and, as it approaches 0 there is less likelihood that the two variables are related. In interpreting correlations, a common practice is to determine the r2 value. This value may be interpreted as the proportion of variance in one variable that can be explained by variation in the other variable. Only the significant correlations between each quality parameter and date of packing are shown in the figures for each variety.
Comments on trends in quality: Acoustic firmness declined in RA storage especially in Braeburn, Cameo, Golden Delicious and Granny Smith; but not in fruit stored in CA. Destructive firmness declined with packing date most steeply in fruit from RA storage. The most severe declines were seen in Golden Delicious and Braeburn. More gradual declines were seen in Fuji and Granny Smith. Firmness of CA stored apples did not decline dramatically, but in most cases the softest fruit was sampled from CA storage.
Soluble solids rose only slightly in RA stored fruit over time in Golden Delicious, Fuji, Granny Smith and Red Delicious. They did not rise over time in CA samples. Fruit with the lowest SS were found in RA samples.
Titratable acidity declined most steeply in RA stored Golden Delicious, Granny Smith and Pink Lady® brand apples. There was some slight decline in acidity over time in Braeburn, Fuji and Jonagold from RA storage. Of all quality measures acidity was the most uniform between samples at any one sampling date.
Multiple samples from a packinghouse: In the tables displaying fruit quality information, some values are highlighted in bold, indicating averages are comprised of five or more lots of fruit. Values not highlighted indicate a small number of lots from a specific packer.
WASHINGTON STATE UNIVERSITY—TREE FRUIT RESEARCH AND EXTENSION CENTER
2003 ARTICLE, Quality of the 2001 Crop of Washington Apples page 6 of 55
POSTHARVEST INFORMATION NETWORK http://postharvest.tfrec.wsu.edu/EMK2003B.pdf
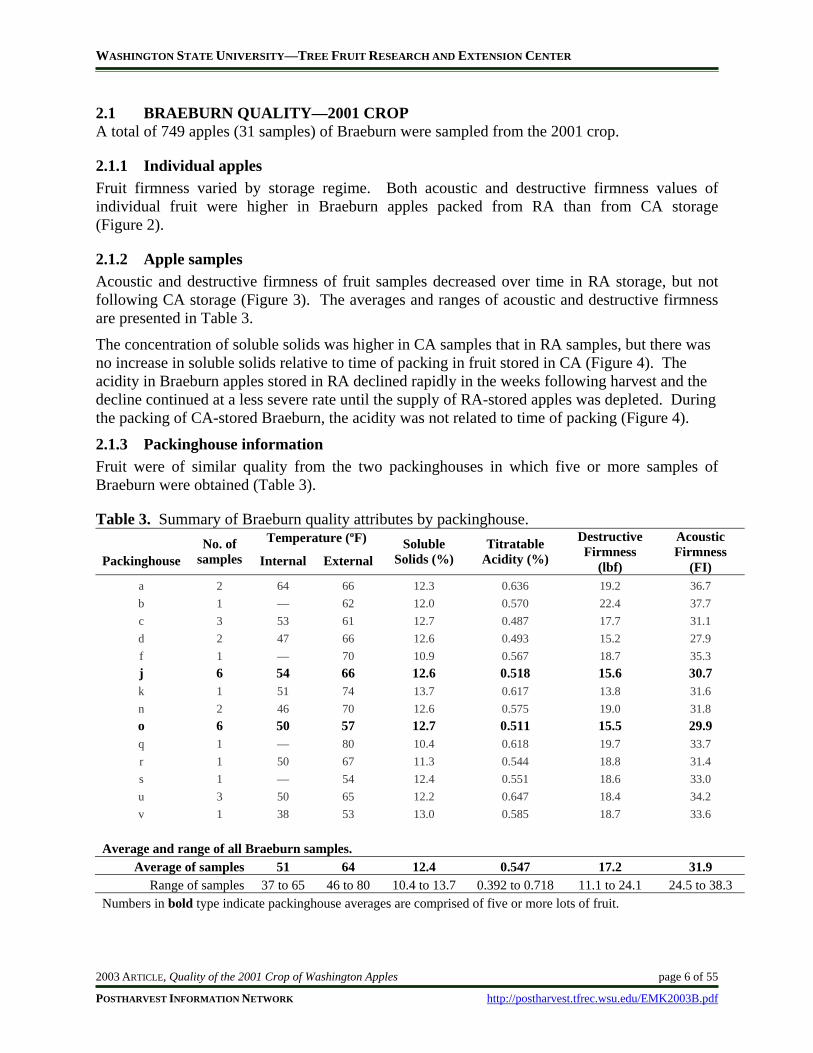
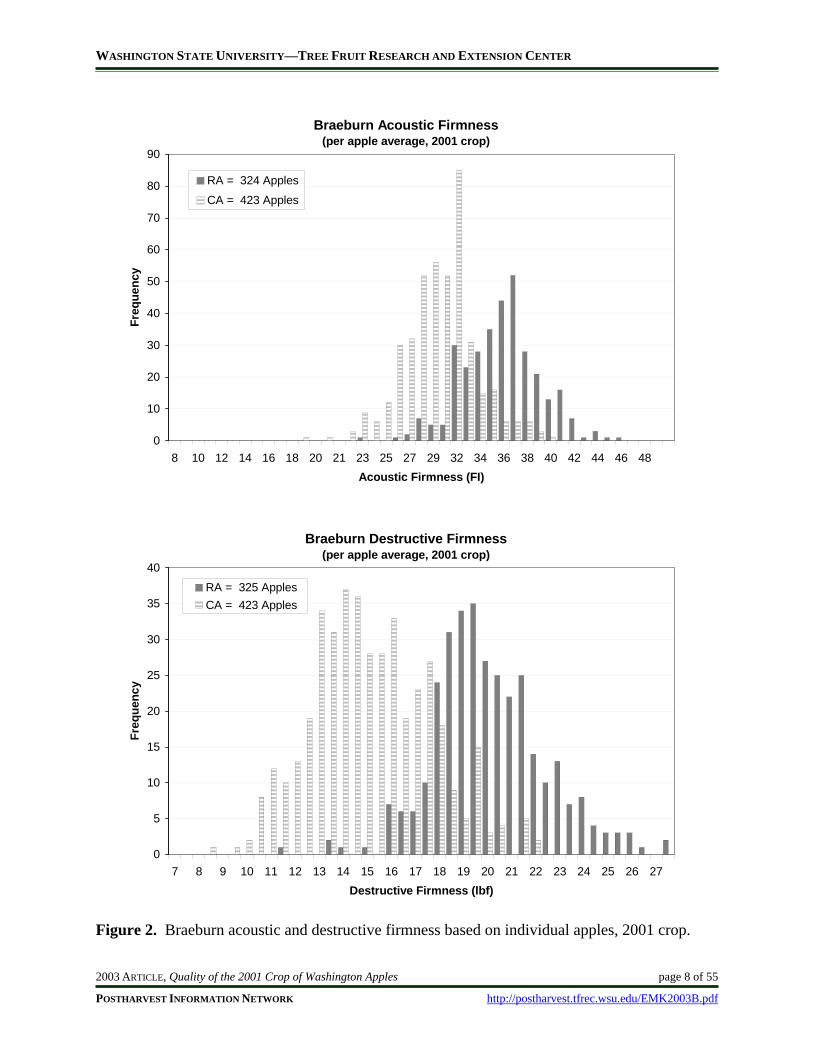
2.1 BRAEBURN QUALITY—2001 CROP A total of 749 apples (31 samples) of Braeburn were sampled from the 2001 crop.
2.1.1 Individual apples Fruit firmness varied by storage regime. Both acoustic and destructive firmness values of individual fruit were higher in Braeburn apples packed from RA than from CA storage (Figure 2).
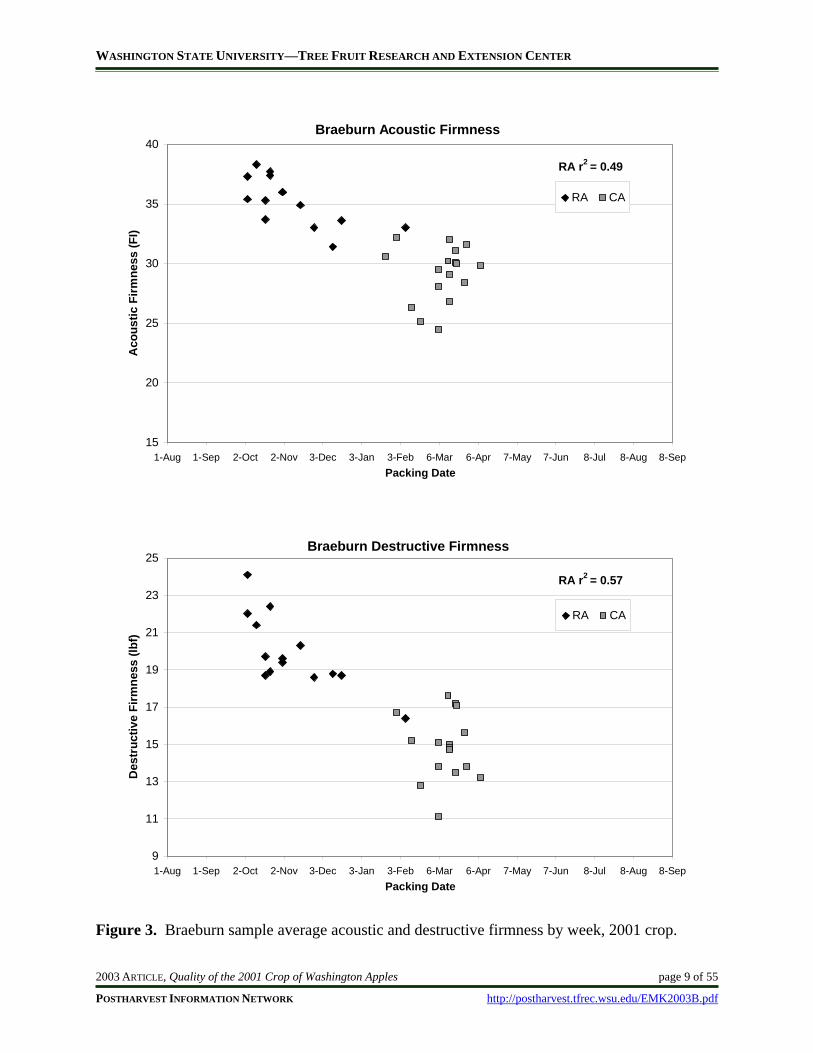
2.1.2 Apple samples Acoustic and destructive firmness of fruit samples decreased over time in RA storage, but not following CA storage (Figure 3). The averages and ranges of acoustic and destructive firmness are presented in Table 3.
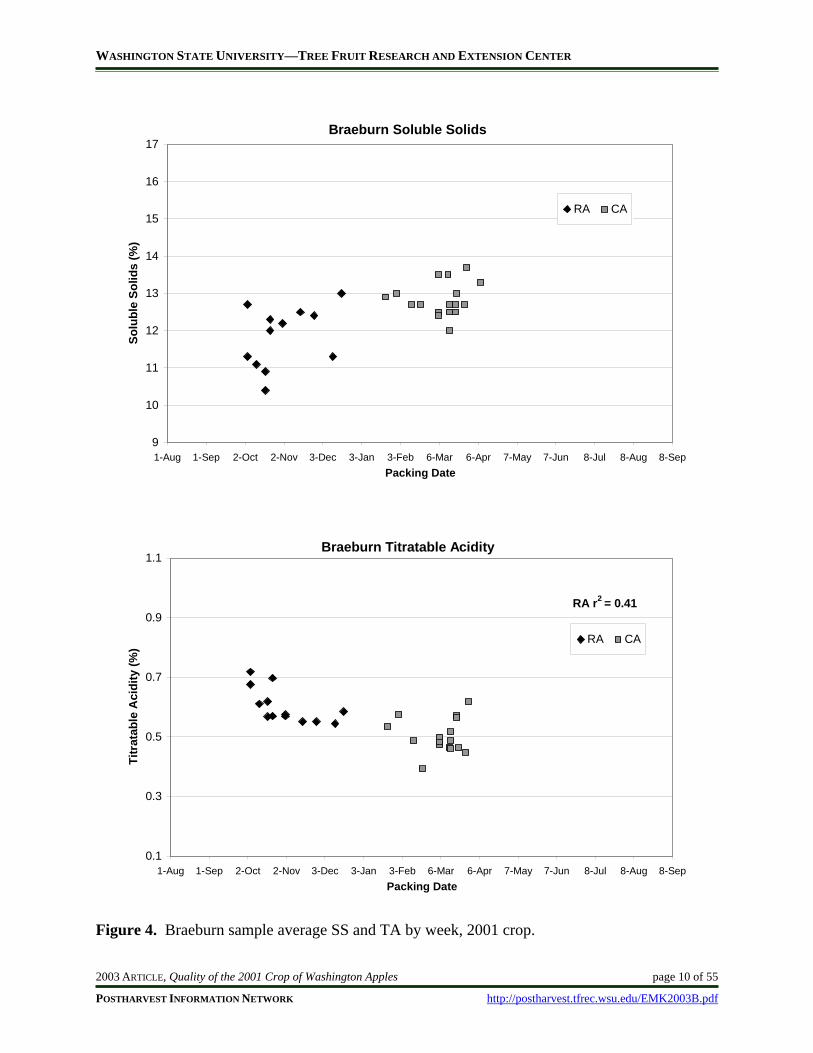
The concentration of soluble solids was higher in CA samples that in RA samples, but there was no increase in soluble solids relative to time of packing in fruit stored in CA (Figure 4). The acidity in Braeburn apples stored in RA declined rapidly in the weeks following harvest and the decline continued at a less severe rate until the supply of RA-stored apples was depleted. During the packing of CA-stored Braeburn, the acidity was not related to time of packing (Figure 4).
2.1.3 Packinghouse information Fruit were of similar quality from the two packinghouses in which five or more samples of Braeburn were obtained (Table 3).
Table 3. Summary of Braeburn quality attributes by packinghouse. Temperature (ºF)
Packinghouse No. of
samples Internal External Soluble
Solids (%) Titratable
Acidity (%)
Destructive Firmness
(lbf)
Acoustic Firmness
(FI) a 2 64 66 12.3 0.636 19.2 36.7 b 1 — 62 12.0 0.570 22.4 37.7 c 3 53 61 12.7 0.487 17.7 31.1 d 2 47 66 12.6 0.493 15.2 27.9 f 1 — 70 10.9 0.567 18.7 35.3 j 6 54 66 12.6 0.518 15.6 30.7 k 1 51 74 13.7 0.617 13.8 31.6 n 2 46 70 12.6 0.575 19.0 31.8 o 6 50 57 12.7 0.511 15.5 29.9 q 1 — 80 10.4 0.618 19.7 33.7 r 1 50 67 11.3 0.544 18.8 31.4 s 1 — 54 12.4 0.551 18.6 33.0 u 3 50 65 12.2 0.647 18.4 34.2 v 1 38 53 13.0 0.585 18.7 33.6
Average and range of all Braeburn samples. Average of samples 51 64 12.4 0.547 17.2 31.9
Range of samples 37 to 65 46 to 80 10.4 to 13.7 0.392 to 0.718 11.1 to 24.1 24.5 to 38.3 Numbers in bold type indicate packinghouse averages are comprised of five or more lots of fruit.
WASHINGTON STATE UNIVERSITY—TREE FRUIT RESEARCH AND EXTENSION CENTER
2003 ARTICLE, Quality of the 2001 Crop of Washington Apples page 7 of 55
POSTHARVEST INFORMATION NETWORK http://postharvest.tfrec.wsu.edu/EMK2003B.pdf
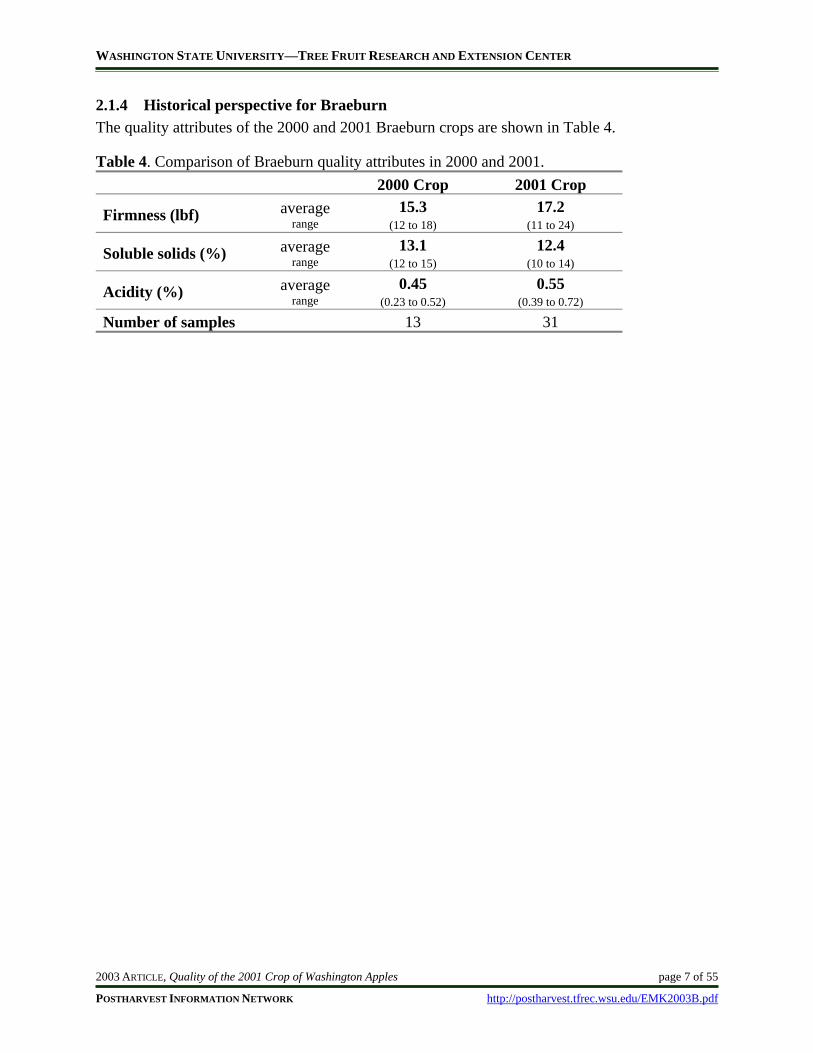
2.1.4 Historical perspective for Braeburn The quality attributes of the 2000 and 2001 Braeburn crops are shown in Table 4.
Table 4. Comparison of Braeburn quality attributes in 2000 and 2001. 2000 Crop 2001 Crop
Firmness (lbf) average range
15.3 (12 to 18)
17.2 (11 to 24)
Soluble solids (%) average range
13.1 (12 to 15)
12.4 (10 to 14)
Acidity (%) average range
0.45 (0.23 to 0.52)
0.55 (0.39 to 0.72)
Number of samples 13 31
WASHINGTON STATE UNIVERSITY—TREE FRUIT RESEARCH AND EXTENSION CENTER
2003 ARTICLE, Quality of the 2001 Crop of Washington Apples page 8 of 55
POSTHARVEST INFORMATION NETWORK http://postharvest.tfrec.wsu.edu/EMK2003B.pdf
Braeburn Acoustic Firmness(per apple average, 2001 crop)
0
10
20
30
40
50
60
70
80
90
8 10 12 14 16 18 20 21 23 25 27 29 32 34 36 38 40 42 44 46 48Acoustic Firmness (FI)
Freq
uenc
y
RA = 324 Apples
CA = 423 Apples
Braeburn Destructive Firmness(per apple average, 2001 crop)
0
5
10
15
20
25
30
35
40
7 8 9 10 11 12 13 14 15 16 17 18 19 20 21 22 23 24 25 26 27Destructive Firmness (lbf)
Freq
uenc
y
RA = 325 ApplesCA = 423 Apples
Figure 2. Braeburn acoustic and destructive firmness based on individual apples, 2001 crop.
WASHINGTON STATE UNIVERSITY—TREE FRUIT RESEARCH AND EXTENSION CENTER
2003 ARTICLE, Quality of the 2001 Crop of Washington Apples page 9 of 55
POSTHARVEST INFORMATION NETWORK http://postharvest.tfrec.wsu.edu/EMK2003B.pdf
Braeburn Acoustic Firmness
15
20
25
30
35
40
1-Aug 1-Sep 2-Oct 2-Nov 3-Dec 3-Jan 3-Feb 6-Mar 6-Apr 7-May 7-Jun 8-Jul 8-Aug 8-SepPacking Date
Aco
ustic
Firm
ness
(FI)
RA CA
RA r2 = 0.49
Braeburn Destructive Firmness
9
11
13
15
17
19
21
23
25
1-Aug 1-Sep 2-Oct 2-Nov 3-Dec 3-Jan 3-Feb 6-Mar 6-Apr 7-May 7-Jun 8-Jul 8-Aug 8-SepPacking Date
Des
truc
tive
Firm
ness
(lbf
)
RA CA
RA r2 = 0.57
Figure 3. Braeburn sample average acoustic and destructive firmness by week, 2001 crop.
WASHINGTON STATE UNIVERSITY—TREE FRUIT RESEARCH AND EXTENSION CENTER
2003 ARTICLE, Quality of the 2001 Crop of Washington Apples page 10 of 55
POSTHARVEST INFORMATION NETWORK http://postharvest.tfrec.wsu.edu/EMK2003B.pdf
Braeburn Soluble Solids
9
10
11
12
13
14
15
16
17
1-Aug 1-Sep 2-Oct 2-Nov 3-Dec 3-Jan 3-Feb 6-Mar 6-Apr 7-May 7-Jun 8-Jul 8-Aug 8-SepPacking Date
Solu
ble
Solid
s (%
)
RA CA
Braeburn Titratable Acidity
0.1
0.3
0.5
0.7
0.9
1.1
1-Aug 1-Sep 2-Oct 2-Nov 3-Dec 3-Jan 3-Feb 6-Mar 6-Apr 7-May 7-Jun 8-Jul 8-Aug 8-SepPacking Date
Titr
atab
le A
cidi
ty (%
)
RA CA
RA r2 = 0.41
Figure 4. Braeburn sample average SS and TA by week, 2001 crop.
WASHINGTON STATE UNIVERSITY—TREE FRUIT RESEARCH AND EXTENSION CENTER
2003 ARTICLE, Quality of the 2001 Crop of Washington Apples page 11 of 55
POSTHARVEST INFORMATION NETWORK http://postharvest.tfrec.wsu.edu/EMK2003B.pdf
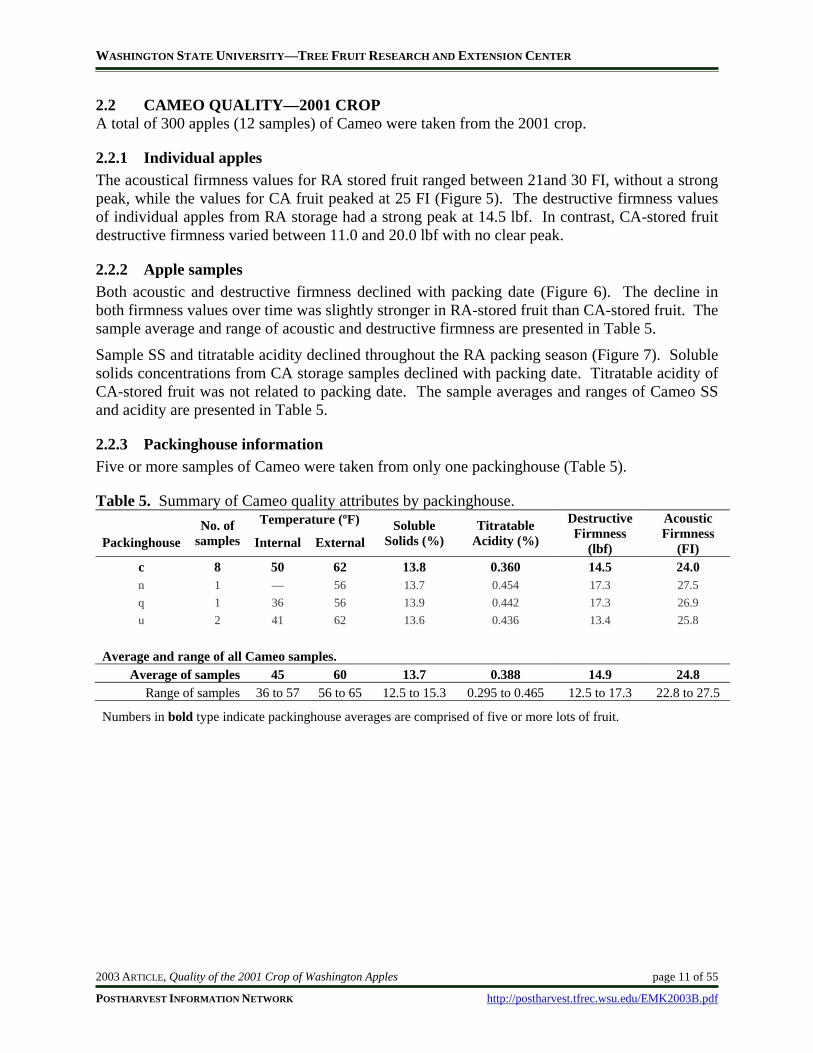
2.2 CAMEO QUALITY—2001 CROP A total of 300 apples (12 samples) of Cameo were taken from the 2001 crop.
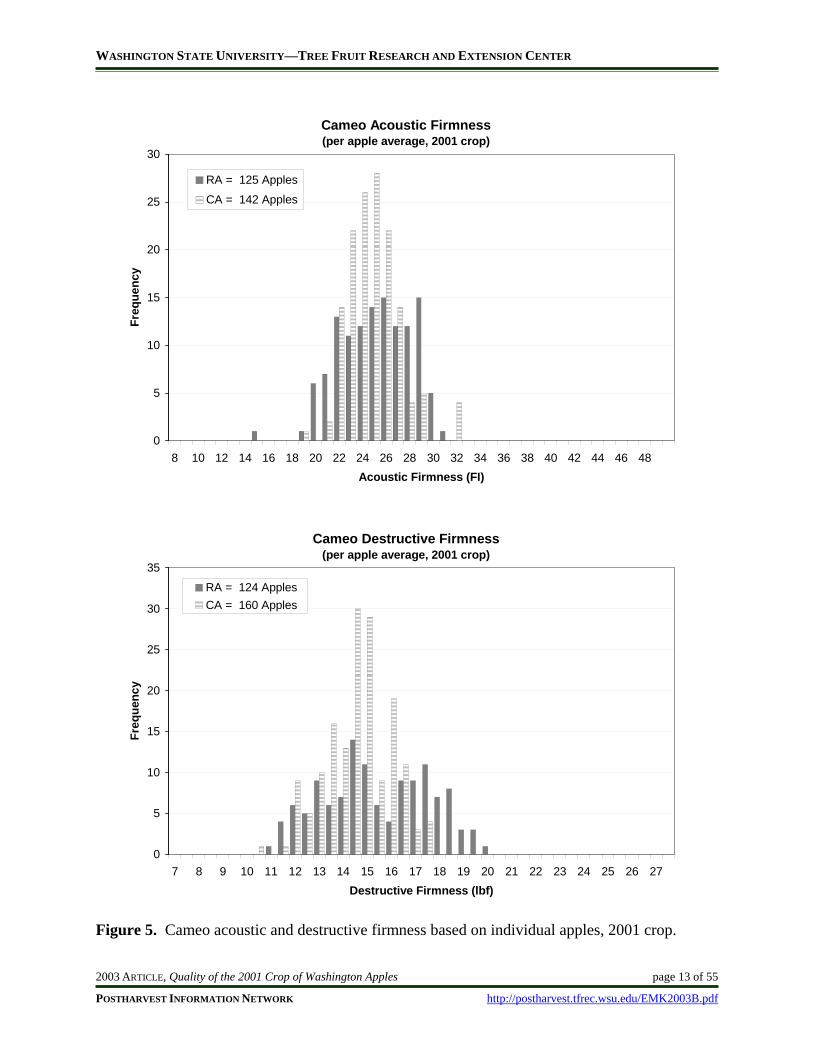
2.2.1 Individual apples The acoustical firmness values for RA stored fruit ranged between 21and 30 FI, without a strong peak, while the values for CA fruit peaked at 25 FI (Figure 5). The destructive firmness values of individual apples from RA storage had a strong peak at 14.5 lbf. In contrast, CA-stored fruit destructive firmness varied between 11.0 and 20.0 lbf with no clear peak.
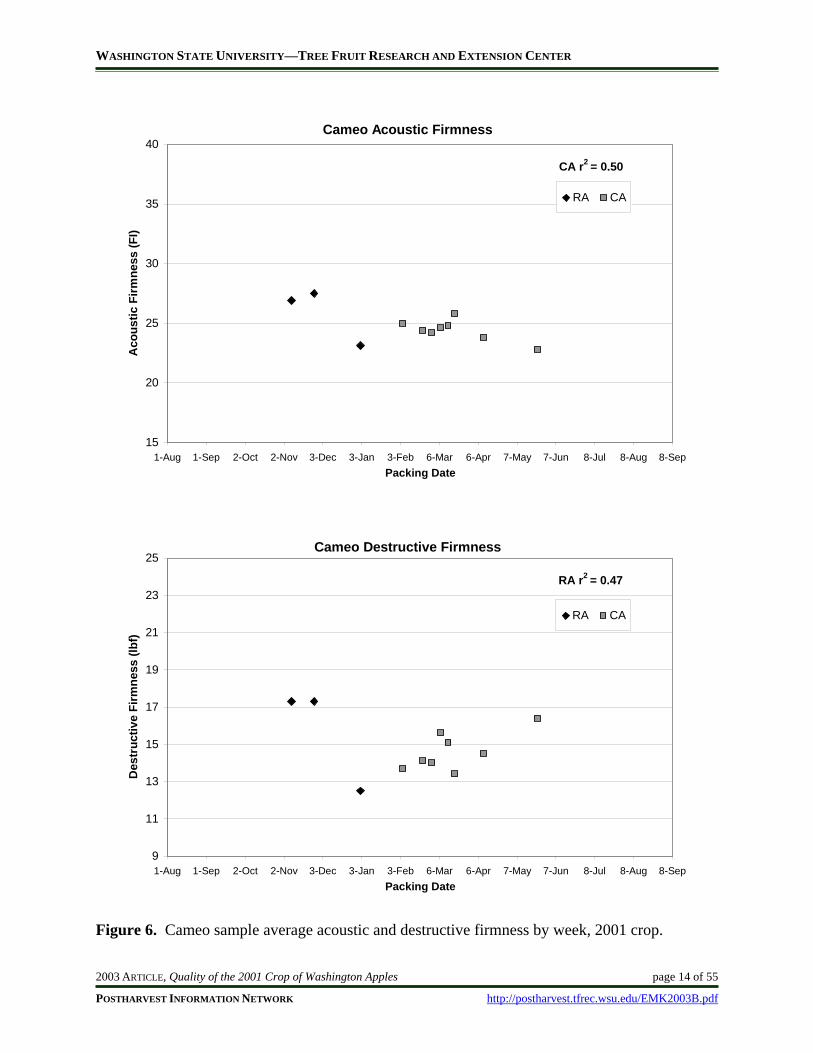
2.2.2 Apple samples Both acoustic and destructive firmness declined with packing date (Figure 6). The decline in both firmness values over time was slightly stronger in RA-stored fruit than CA-stored fruit. The sample average and range of acoustic and destructive firmness are presented in Table 5.
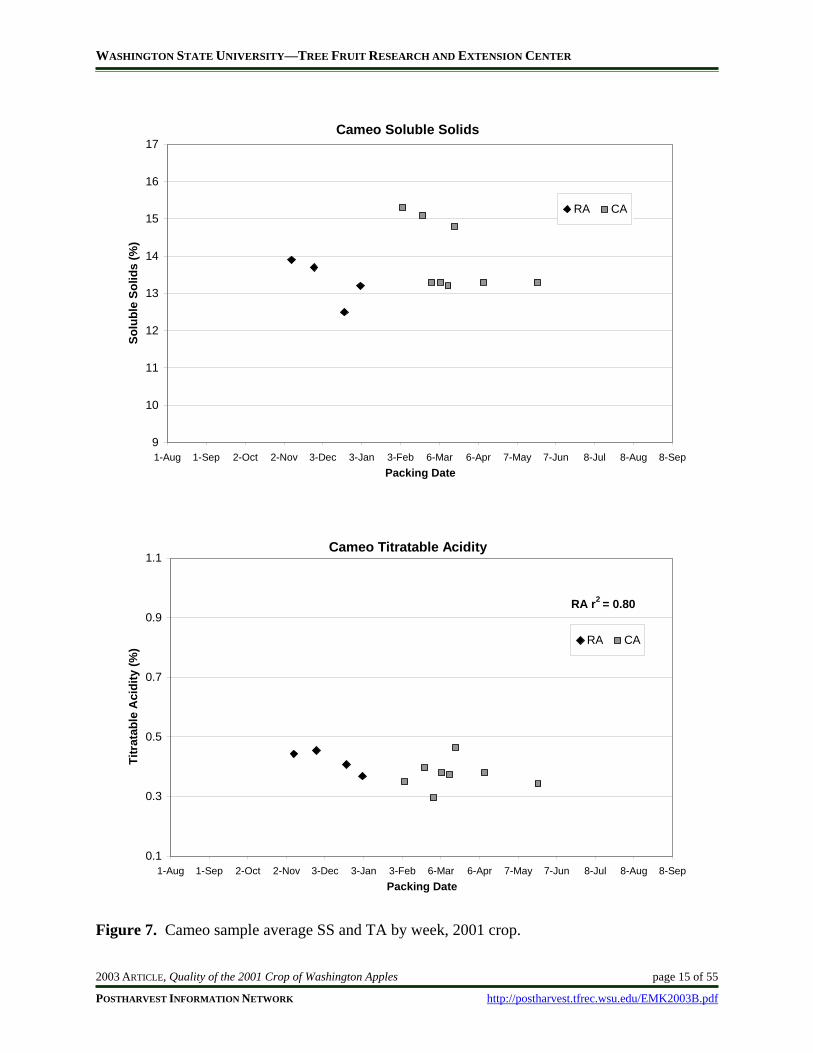
Sample SS and titratable acidity declined throughout the RA packing season (Figure 7). Soluble solids concentrations from CA storage samples declined with packing date. Titratable acidity of CA-stored fruit was not related to packing date. The sample averages and ranges of Cameo SS and acidity are presented in Table 5.
2.2.3 Packinghouse information Five or more samples of Cameo were taken from only one packinghouse (Table 5).
Table 5. Summary of Cameo quality attributes by packinghouse. Temperature (ºF)
Packinghouse No. of
samples Internal External Soluble
Solids (%) Titratable
Acidity (%)
Destructive Firmness
(lbf)
Acoustic Firmness
(FI) c 8 50 62 13.8 0.360 14.5 24.0 n 1 — 56 13.7 0.454 17.3 27.5 q 1 36 56 13.9 0.442 17.3 26.9 u 2 41 62 13.6 0.436 13.4 25.8
Average and range of all Cameo samples. Average of samples 45 60 13.7 0.388 14.9 24.8
Range of samples 36 to 57 56 to 65 12.5 to 15.3 0.295 to 0.465 12.5 to 17.3 22.8 to 27.5
Numbers in bold type indicate packinghouse averages are comprised of five or more lots of fruit.
WASHINGTON STATE UNIVERSITY—TREE FRUIT RESEARCH AND EXTENSION CENTER
2003 ARTICLE, Quality of the 2001 Crop of Washington Apples page 12 of 55
POSTHARVEST INFORMATION NETWORK http://postharvest.tfrec.wsu.edu/EMK2003B.pdf
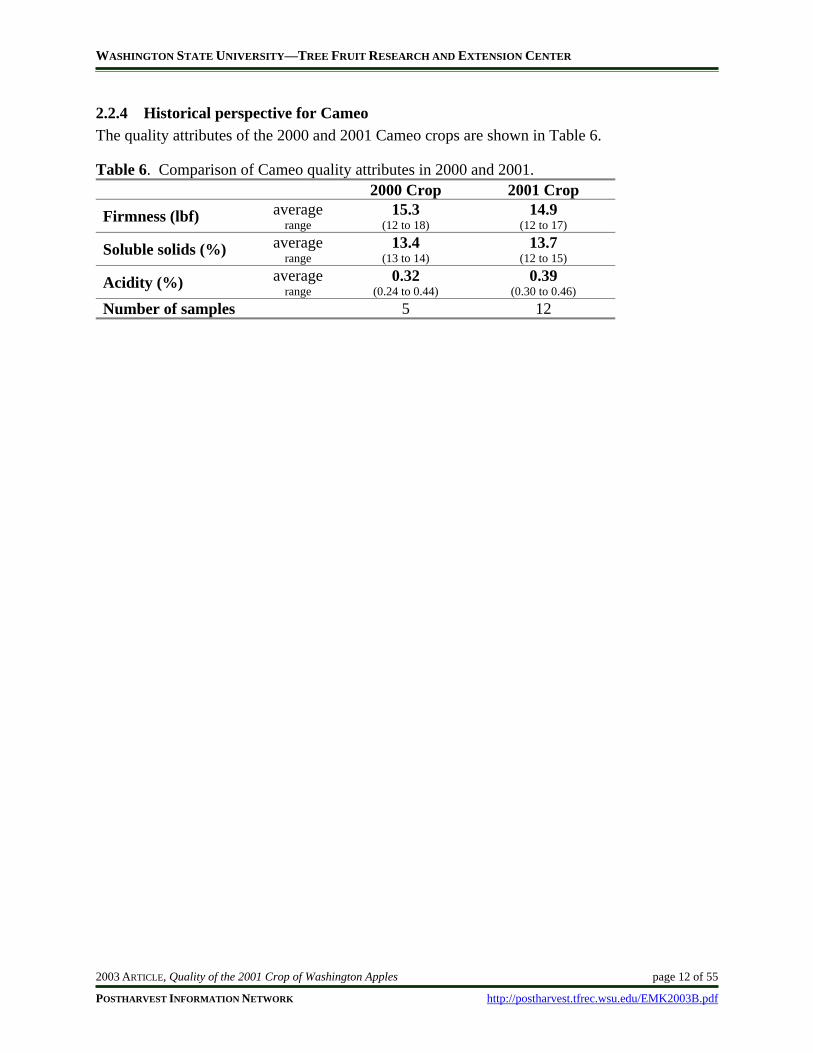
2.2.4 Historical perspective for Cameo The quality attributes of the 2000 and 2001 Cameo crops are shown in Table 6.
Table 6. Comparison of Cameo quality attributes in 2000 and 2001. 2000 Crop 2001 Crop
Firmness (lbf) average range
15.3 (12 to 18)
14.9 (12 to 17)
Soluble solids (%) average range
13.4 (13 to 14)
13.7 (12 to 15)
Acidity (%) average range
0.32 (0.24 to 0.44)
0.39 (0.30 to 0.46)
Number of samples 5 12
WASHINGTON STATE UNIVERSITY—TREE FRUIT RESEARCH AND EXTENSION CENTER
2003 ARTICLE, Quality of the 2001 Crop of Washington Apples page 13 of 55
POSTHARVEST INFORMATION NETWORK http://postharvest.tfrec.wsu.edu/EMK2003B.pdf
Cameo Acoustic Firmness(per apple average, 2001 crop)
0
5
10
15
20
25
30
8 10 12 14 16 18 20 22 24 26 28 30 32 34 36 38 40 42 44 46 48Acoustic Firmness (FI)
Freq
uenc
y
RA = 125 Apples
CA = 142 Apples
Cameo Destructive Firmness(per apple average, 2001 crop)
0
5
10
15
20
25
30
35
7 8 9 10 11 12 13 14 15 16 17 18 19 20 21 22 23 24 25 26 27Destructive Firmness (lbf)
Freq
uenc
y
RA = 124 ApplesCA = 160 Apples
Figure 5. Cameo acoustic and destructive firmness based on individual apples, 2001 crop.
WASHINGTON STATE UNIVERSITY—TREE FRUIT RESEARCH AND EXTENSION CENTER
2003 ARTICLE, Quality of the 2001 Crop of Washington Apples page 14 of 55
POSTHARVEST INFORMATION NETWORK http://postharvest.tfrec.wsu.edu/EMK2003B.pdf
Cameo Acoustic Firmness
15
20
25
30
35
40
1-Aug 1-Sep 2-Oct 2-Nov 3-Dec 3-Jan 3-Feb 6-Mar 6-Apr 7-May 7-Jun 8-Jul 8-Aug 8-SepPacking Date
Aco
ustic
Firm
ness
(FI)
RA CA
CA r2 = 0.50
Cameo Destructive Firmness
9
11
13
15
17
19
21
23
25
1-Aug 1-Sep 2-Oct 2-Nov 3-Dec 3-Jan 3-Feb 6-Mar 6-Apr 7-May 7-Jun 8-Jul 8-Aug 8-SepPacking Date
Des
truc
tive
Firm
ness
(lbf
)
RA CA
RA r2 = 0.47
Figure 6. Cameo sample average acoustic and destructive firmness by week, 2001 crop.
WASHINGTON STATE UNIVERSITY—TREE FRUIT RESEARCH AND EXTENSION CENTER
2003 ARTICLE, Quality of the 2001 Crop of Washington Apples page 15 of 55
POSTHARVEST INFORMATION NETWORK http://postharvest.tfrec.wsu.edu/EMK2003B.pdf
Cameo Soluble Solids
9
10
11
12
13
14
15
16
17
1-Aug 1-Sep 2-Oct 2-Nov 3-Dec 3-Jan 3-Feb 6-Mar 6-Apr 7-May 7-Jun 8-Jul 8-Aug 8-SepPacking Date
Solu
ble
Solid
s (%
)
RA CA
Cameo Titratable Acidity
0.1
0.3
0.5
0.7
0.9
1.1
1-Aug 1-Sep 2-Oct 2-Nov 3-Dec 3-Jan 3-Feb 6-Mar 6-Apr 7-May 7-Jun 8-Jul 8-Aug 8-SepPacking Date
Titr
atab
le A
cidi
ty (%
)
RA CA
RA r2 = 0.80
Figure 7. Cameo sample average SS and TA by week, 2001 crop.
WASHINGTON STATE UNIVERSITY—TREE FRUIT RESEARCH AND EXTENSION CENTER
2003 ARTICLE, Quality of the 2001 Crop of Washington Apples page 16 of 55
POSTHARVEST INFORMATION NETWORK http://postharvest.tfrec.wsu.edu/EMK2003B.pdf
2.3 FUJI QUALITY—2001 CROP A total of 1737 apples (75 samples) of Fuji were taken from the 2001 crop.
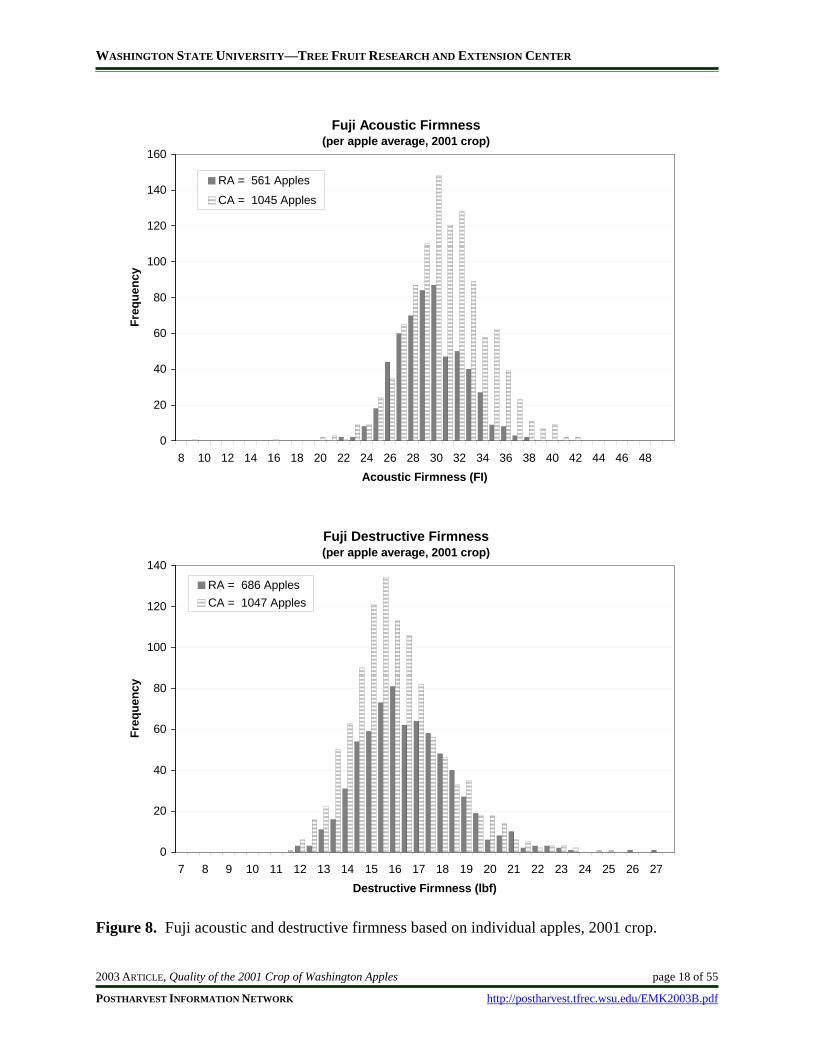
2.3.1 Individual apples There was very little difference in acoustic and destructive firmness of RA and CA-stored Fuji (Figure 8). Destructive firmness values were heavy-tailed to the right, indicating a trend for higher firmness apples. Only one of the 1737 apples sampled measured below 12 lbf.
2.3.2 Apple samples There was a great deal of variability in firmness at every packing date for Fuji apples. Values for destructive firmness of samples showed a stronger relationship with packing date than acoustical firmness (Figure 9). The average and range of acoustic and destructive firmness are presented in Table 7.
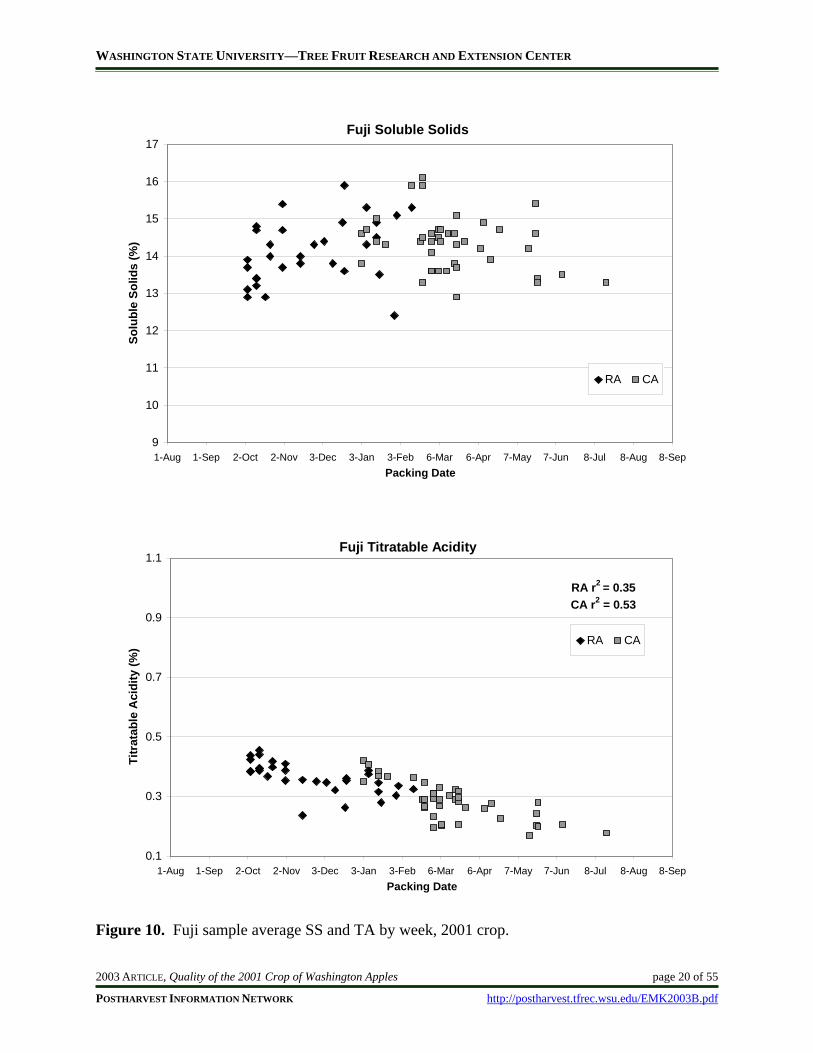
Fuji SS showed a weak relationship to the date of packing out of CA or RA storage (Figure 10). Values for SS were high but variable ranging from 12.4 to 16.1 (Table 7).
The seasonal change in acidity is the most telling quality measurement in Fuji (Figure 10). Acidity steadily declined over the course of the entire season at a very consistent rate. Acidity in CA-stored Fuji was lower than that of RA-stored fruit, and 21% of samples from CA were below 0.210%. The sample average and range of acidity for Fuji are presented in Table 7.
WASHINGTON STATE UNIVERSITY—TREE FRUIT RESEARCH AND EXTENSION CENTER
2003 ARTICLE, Quality of the 2001 Crop of Washington Apples page 17 of 55
POSTHARVEST INFORMATION NETWORK http://postharvest.tfrec.wsu.edu/EMK2003B.pdf
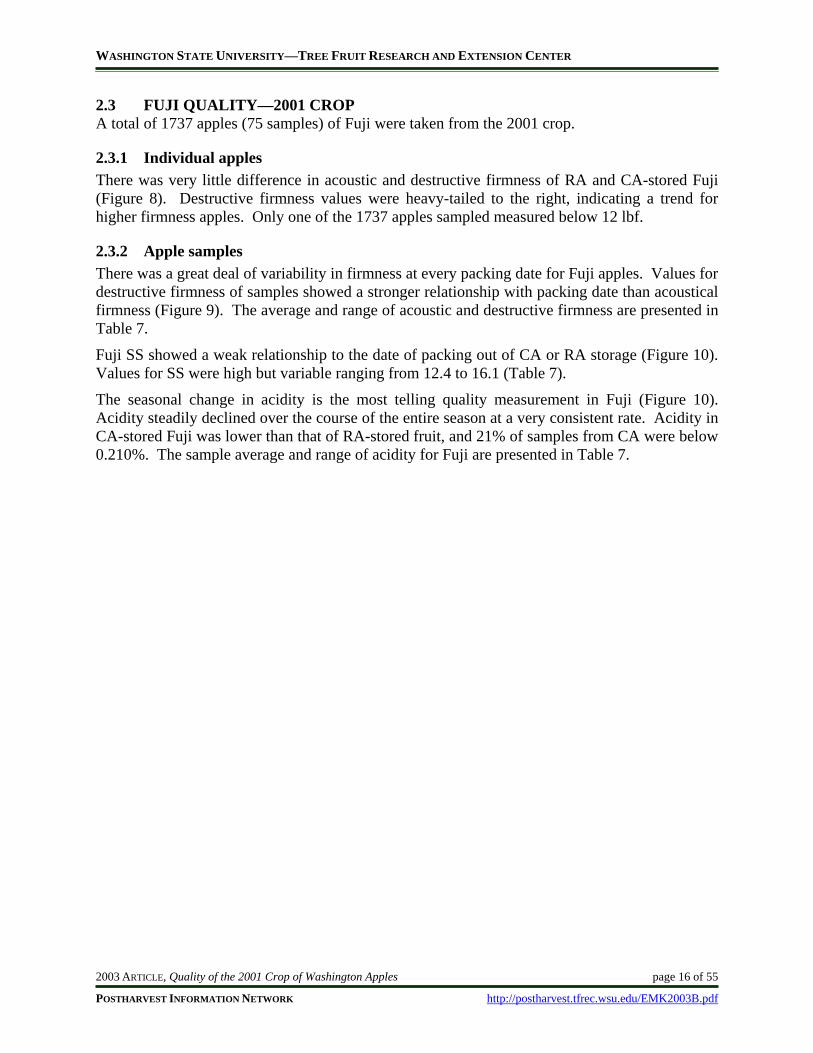
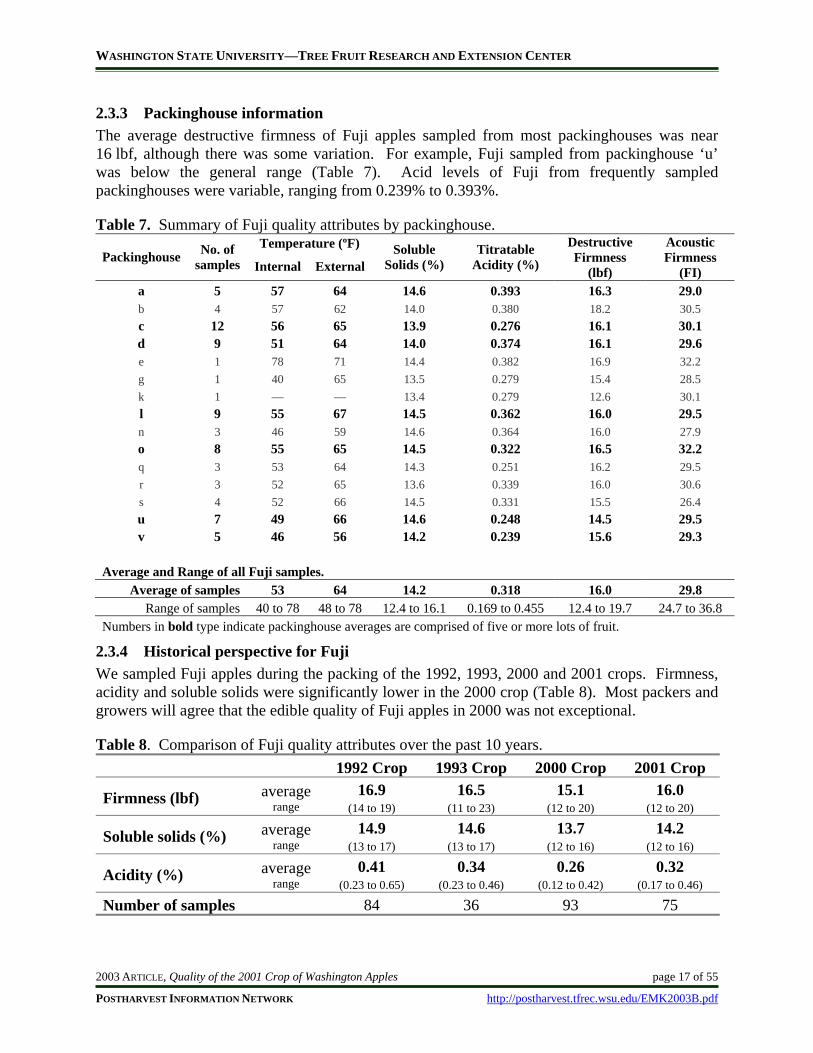
2.3.3 Packinghouse information The average destructive firmness of Fuji apples sampled from most packinghouses was near 16 lbf, although there was some variation. For example, Fuji sampled from packinghouse ‘u’ was below the general range (Table 7). Acid levels of Fuji from frequently sampled packinghouses were variable, ranging from 0.239% to 0.393%.
Table 7. Summary of Fuji quality attributes by packinghouse. Temperature (ºF)
Packinghouse No. of samples Internal External
Soluble Solids (%)
Titratable Acidity (%)
Destructive Firmness
(lbf)
Acoustic Firmness
(FI) a 5 57 64 14.6 0.393 16.3 29.0 b 4 57 62 14.0 0.380 18.2 30.5 c 12 56 65 13.9 0.276 16.1 30.1 d 9 51 64 14.0 0.374 16.1 29.6 e 1 78 71 14.4 0.382 16.9 32.2 g 1 40 65 13.5 0.279 15.4 28.5 k 1 — — 13.4 0.279 12.6 30.1 l 9 55 67 14.5 0.362 16.0 29.5 n 3 46 59 14.6 0.364 16.0 27.9 o 8 55 65 14.5 0.322 16.5 32.2 q 3 53 64 14.3 0.251 16.2 29.5 r 3 52 65 13.6 0.339 16.0 30.6 s 4 52 66 14.5 0.331 15.5 26.4 u 7 49 66 14.6 0.248 14.5 29.5 v 5 46 56 14.2 0.239 15.6 29.3
Average and Range of all Fuji samples. Average of samples 53 64 14.2 0.318 16.0 29.8
Range of samples 40 to 78 48 to 78 12.4 to 16.1 0.169 to 0.455 12.4 to 19.7 24.7 to 36.8 Numbers in bold type indicate packinghouse averages are comprised of five or more lots of fruit.
2.3.4 Historical perspective for Fuji We sampled Fuji apples during the packing of the 1992, 1993, 2000 and 2001 crops. Firmness, acidity and soluble solids were significantly lower in the 2000 crop (Table 8). Most packers and growers will agree that the edible quality of Fuji apples in 2000 was not exceptional.
Table 8. Comparison of Fuji quality attributes over the past 10 years. 1992 Crop 1993 Crop 2000 Crop 2001 Crop
Firmness (lbf) average range
16.9 (14 to 19)
16.5 (11 to 23)
15.1 (12 to 20)
16.0 (12 to 20)
Soluble solids (%) average range
14.9 (13 to 17)
14.6 (13 to 17)
13.7 (12 to 16)
14.2 (12 to 16)
Acidity (%) average range
0.41 (0.23 to 0.65)
0.34 (0.23 to 0.46)
0.26 (0.12 to 0.42)
0.32 (0.17 to 0.46)
Number of samples 84 36 93 75
WASHINGTON STATE UNIVERSITY—TREE FRUIT RESEARCH AND EXTENSION CENTER
2003 ARTICLE, Quality of the 2001 Crop of Washington Apples page 18 of 55
POSTHARVEST INFORMATION NETWORK http://postharvest.tfrec.wsu.edu/EMK2003B.pdf
Fuji Acoustic Firmness(per apple average, 2001 crop)
0
20
40
60
80
100
120
140
160
8 10 12 14 16 18 20 22 24 26 28 30 32 34 36 38 40 42 44 46 48Acoustic Firmness (FI)
Freq
uenc
y
RA = 561 Apples
CA = 1045 Apples
Fuji Destructive Firmness(per apple average, 2001 crop)
0
20
40
60
80
100
120
140
7 8 9 10 11 12 13 14 15 16 17 18 19 20 21 22 23 24 25 26 27Destructive Firmness (lbf)
Freq
uenc
y
RA = 686 ApplesCA = 1047 Apples
Figure 8. Fuji acoustic and destructive firmness based on individual apples, 2001 crop.

WASHINGTON STATE UNIVERSITY—TREE FRUIT RESEARCH AND EXTENSION CENTER
2003 ARTICLE, Quality of the 2001 Crop of Washington Apples page 19 of 55
POSTHARVEST INFORMATION NETWORK http://postharvest.tfrec.wsu.edu/EMK2003B.pdf
Fuji Acoustic Firmness
15
20
25
30
35
40
1-Aug 1-Sep 2-Oct 2-Nov 3-Dec 3-Jan 3-Feb 6-Mar 6-Apr 7-May 7-Jun 8-Jul 8-Aug 8-SepPacking Date
Aco
ustic
Firm
ness
(FI)
RA CA
Fuji Destructive Firmness
9
11
13
15
17
19
21
23
25
1-Aug 1-Sep 2-Oct 2-Nov 3-Dec 3-Jan 3-Feb 6-Mar 6-Apr 7-May 7-Jun 8-Jul 8-Aug 8-SepPacking Date
Des
truc
tive
Firm
ness
(lbf
) RA CA
RA r2 = 0.27CA r2 = 0.29
Figure 9. Fuji sample average acoustic and destructive firmness by week, 2001 crop.
WASHINGTON STATE UNIVERSITY—TREE FRUIT RESEARCH AND EXTENSION CENTER
2003 ARTICLE, Quality of the 2001 Crop of Washington Apples page 20 of 55
POSTHARVEST INFORMATION NETWORK http://postharvest.tfrec.wsu.edu/EMK2003B.pdf
Fuji Soluble Solids
9
10
11
12
13
14
15
16
17
1-Aug 1-Sep 2-Oct 2-Nov 3-Dec 3-Jan 3-Feb 6-Mar 6-Apr 7-May 7-Jun 8-Jul 8-Aug 8-SepPacking Date
Solu
ble
Solid
s (%
)
RA CA
Fuji Titratable Acidity
0.1
0.3
0.5
0.7
0.9
1.1
1-Aug 1-Sep 2-Oct 2-Nov 3-Dec 3-Jan 3-Feb 6-Mar 6-Apr 7-May 7-Jun 8-Jul 8-Aug 8-SepPacking Date
Titr
atab
le A
cidi
ty (%
) RA CA
RA r2 = 0.35CA r2 = 0.53
Figure 10. Fuji sample average SS and TA by week, 2001 crop.
WASHINGTON STATE UNIVERSITY—TREE FRUIT RESEARCH AND EXTENSION CENTER
2003 ARTICLE, Quality of the 2001 Crop of Washington Apples page 21 of 55
POSTHARVEST INFORMATION NETWORK http://postharvest.tfrec.wsu.edu/EMK2003B.pdf
2.4 GALA QUALITY—2001 CROP A total of 1892 apples (83 samples) of Gala were taken from the 2001 crop.
2.4.1 Individual apples Acoustic firmness values peaked at 25 FI for RA and 24 FI for CA (Figure 11). The distribution of destructive firmness values for Gala apples was heavy to the center, with more values near 14.0 and 14.5 lbf (Figure 11). Destructive firmness of fruit stored in RA was higher than fruit stored in CA. There were few outlying low-firmness values, with only 1% of all apples below 11 lbf destructive firmness.
2.4.2 Apple samples The decline in firmness with packing date was more severe when measured destructively than acoustically (Figure 12). The decline in firmness was more apparent in RA than in CA-stored fruit (Figure 12). The average and range of acoustic and destructive firmness values are presented in Table 9.
Soluble solids levels in Gala were not associated with the date of packing out of RA storage and only slightly associated with the date of packing in CA-stored fruit (Figure 13).
Acidity levels were not associated with date of packing. The sample averages and ranges of Gala SS and acidity are presented in Table 9.
2.4.3 Packinghouse information The quality of Gala apples in the 2001 packing season was relatively uniform and of high quality throughout the year.
Table 9. Summary of Gala quality attributes by packinghouse. Temperature (ºF) Packinghouse No. of
samples Internal External Soluble
Solids (%) Titratable
Acidity (%) Destructive
Firmness (lbf) Acoustic
Firmness (FI) a 7 62 68 12.5 0.334 14.8 23.5 b 2 42 57 13.2 0.398 13.4 23.9 c 18 49 63 13.2 0.372 15.2 24.1 d 2 68 78 12.7 0.400 16.6 24.6 e 1 — 60 14.4 0.353 12.8 21.7 g 6 56 66 13.6 0.361 14.9 24.0 j 4 58 73 12.6 0.350 17.0 23.2 l 7 50 67 13.5 0.382 15.1 25.8
m 7 55 72 13.5 0.367 15.1 24.6 n 5 48 66 13.8 0.350 14.2 21.6 o 9 59 65 13.4 0.374 14.3 23.5 r 8 59 68 13.9 0.376 14.6 24.1 s 2 59 72 13.0 0.446 15.7 24.2 u 1 60 63 14.9 0.337 15.2 27.1 v 4 44 59 13.0 0.334 14.4 22.4
Average and range of all Gala samples. Average of samples 54 66 13.3 0.366 15.0 23.8
Range of samples 40 to 84 49 to 84 11.3 to 14.9 0.266 to 0.454 12.2 to 18.5 18.6 to 28.1 Numbers in bold type indicate packinghouse averages are comprised of five or more lots of fruit.
WASHINGTON STATE UNIVERSITY—TREE FRUIT RESEARCH AND EXTENSION CENTER
2003 ARTICLE, Quality of the 2001 Crop of Washington Apples page 22 of 55
POSTHARVEST INFORMATION NETWORK http://postharvest.tfrec.wsu.edu/EMK2003B.pdf
2.4.4 Historical perspective for Gala Gala apples were sampled during the packing of the 1992, 1993, 1995, 2000 and 2001 crops (Table 10).
Table 10. Comparison of Gala quality attributes over the past 10 years.
1992 Crop
1993 Crop
1995 Crop
2000 Crop
2001 Crop
Firmness (lbf) average range
16.1 (14 to 18)
16.7 (13 to 20)
15.2 (12 to 18)
14.6 (8 to 16)
15.0 (12 to 19)
Soluble solids (%)
average range
13.0 (11 to 16)
13.1 (11 to 16)
13.9 (12 to 16)
13.3 (10 to 15)
13.3 (11 to 15)
Acidity (%) average range
0.53 (0.32 to 0.82)
0.42 (0.32 to 0.56)
0.30 (0.22 to 0.38)
0.33 (0.23 to 0.42)
0.37 (0.27 to 0.45)
Number of samples
180 100 210 55 83
WASHINGTON STATE UNIVERSITY—TREE FRUIT RESEARCH AND EXTENSION CENTER
2003 ARTICLE, Quality of the 2001 Crop of Washington Apples page 23 of 55
POSTHARVEST INFORMATION NETWORK http://postharvest.tfrec.wsu.edu/EMK2003B.pdf
Gala Acoustic Firmness(per apple average, 2001 crop)
0
20
40
60
80
100
120
140
160
8 10 12 14 16 18 20 22 24 26 28 30 32 34 36 38 40 42 44 46 48Acoustic Firmness (FI)
Freq
uenc
y
RA = 1023 Apples
CA = 849 Apples
Gala Destructive Firmness(per apple average, 2001 crop)
0
10
20
30
40
50
60
70
80
90
7 8 9 10 11 12 13 14 15 16 17 18 19 20 21 22 23 24 25 26 27Destructive Firmness (lbf)
Freq
uenc
y
RA = 1041 ApplesCA = 840 Apples
Figure 11. Gala acoustic and destructive firmness based on individual apples, 2001 crop.

WASHINGTON STATE UNIVERSITY—TREE FRUIT RESEARCH AND EXTENSION CENTER
2003 ARTICLE, Quality of the 2001 Crop of Washington Apples page 24 of 55
POSTHARVEST INFORMATION NETWORK http://postharvest.tfrec.wsu.edu/EMK2003B.pdf
Gala Acoustic Firmness
15
20
25
30
35
40
1-Aug 1-Sep 2-Oct 2-Nov 3-Dec 3-Jan 3-Feb 6-Mar 6-Apr 7-May 7-Jun 8-Jul 8-Aug 8-SepPacking Date
Aco
ustic
Firm
ness
(FI)
RA CA
RA r2 = 0.21
Gala Destructive Firmness
9
11
13
15
17
19
21
23
25
1-Aug 1-Sep 2-Oct 2-Nov 3-Dec 3-Jan 3-Feb 6-Mar 6-Apr 7-May 7-Jun 8-Jul 8-Aug 8-SepPacking Date
Des
truc
tive
Firm
ness
(lbf
)
RA CA
RA r2 = 0.28
Figure 12. Gala sample average acoustic and destructive firmness by week, 2001 crop.
WASHINGTON STATE UNIVERSITY—TREE FRUIT RESEARCH AND EXTENSION CENTER
2003 ARTICLE, Quality of the 2001 Crop of Washington Apples page 25 of 55
POSTHARVEST INFORMATION NETWORK http://postharvest.tfrec.wsu.edu/EMK2003B.pdf
Gala Soluble Solids
9
10
11
12
13
14
15
16
17
1-Aug 1-Sep 2-Oct 2-Nov 3-Dec 3-Jan 3-Feb 6-Mar 6-Apr 7-May 7-Jun 8-Jul 8-Aug 8-SepPacking Date
Solu
ble
Solid
s (%
)
RA CA
Gala Titratable Acidity
0.1
0.3
0.5
0.7
0.9
1.1
1-Aug 1-Sep 2-Oct 2-Nov 3-Dec 3-Jan 3-Feb 6-Mar 6-Apr 7-May 7-Jun 8-Jul 8-Aug 8-SepPacking Date
Titr
atab
le A
cidi
ty (%
)
RA CA
Figure 13. Gala sample average SS and TA by week, 2001 crop.
WASHINGTON STATE UNIVERSITY—TREE FRUIT RESEARCH AND EXTENSION CENTER
2003 ARTICLE, Quality of the 2001 Crop of Washington Apples page 26 of 55
POSTHARVEST INFORMATION NETWORK http://postharvest.tfrec.wsu.edu/EMK2003B.pdf
2.5 GOLDEN DELICIOUS QUALITY—2001 CROP A total of 2020 apples (83 samples) of Golden Delicious were obtained from the 2001 crop.
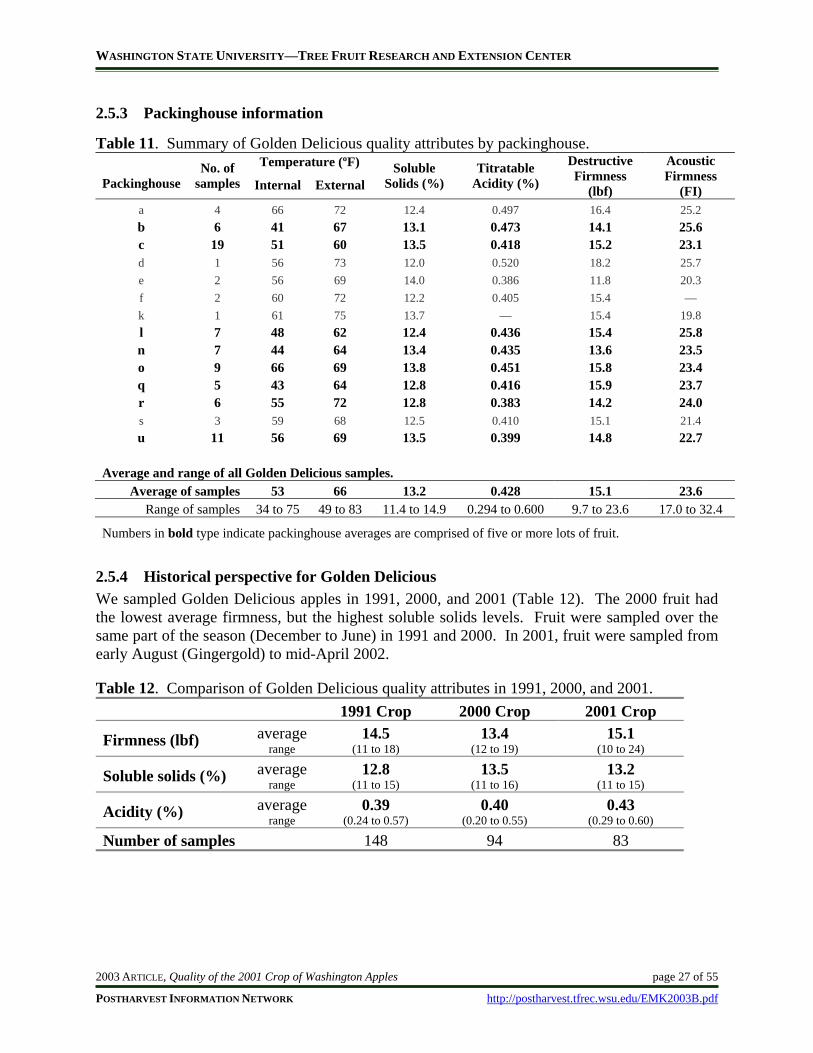
2.5.1 Individual apples In general, Golden Delicious apples sampled from RA were firmer than those from CA as measured by either the destructive or acoustical method (Figure 14). The acoustical firmness generally ranged between 25 FI and 29 FI for RA and showed a strong peak at 22 FI for CA. Although the destructive firmness of both RA and CA fruit peaked at about the same point, there were more firm fruit from RA than from CA.
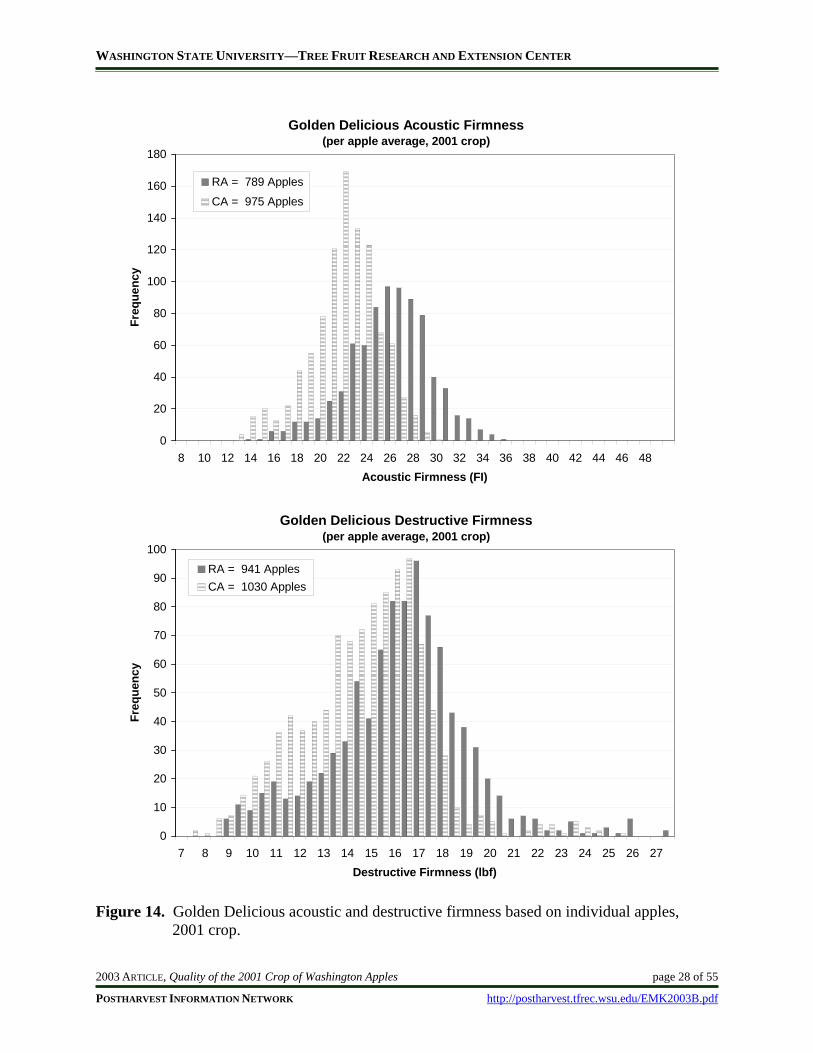
2.5.2 Apple samples Firmness in Golden Delicious apples was highest in fruit packed at harvest. The fruit lost firmness rapidly as the RA season progressed as measured destructively, with sample averages as low as 9.7 lbf (Figure 15). A similar pattern emerged with the acoustical firmness (Figure 15). After the release of CA-stored fruit low firmness values were not associated with later packing dates and the destructive firmness of only one sample averaged below 11 lbf. The average and range of acoustic and destructive firmness are presented in Table 11.
Soluble solids concentration in samples of Golden Delicious apples was not associated with the date of packing, although 20% of samples packed at the end of the RA storage season were below 12.0 % (Figure 16). The average and range of Golden Delicious soluble solids are presented in Table 11.
The acidity in Golden Delicious was highest in the first weeks of sampling RA-stored fruit, with values as high as 0.600% acidity but at the end of the RA-stored packing season values were as low as 0.294 %. Acidity concentration of fruit held in CA storage was not associated with the date of packing (Figure 16). The average and range of Golden Delicious acidity are presented in Table 11.
WASHINGTON STATE UNIVERSITY—TREE FRUIT RESEARCH AND EXTENSION CENTER
2003 ARTICLE, Quality of the 2001 Crop of Washington Apples page 27 of 55
POSTHARVEST INFORMATION NETWORK http://postharvest.tfrec.wsu.edu/EMK2003B.pdf
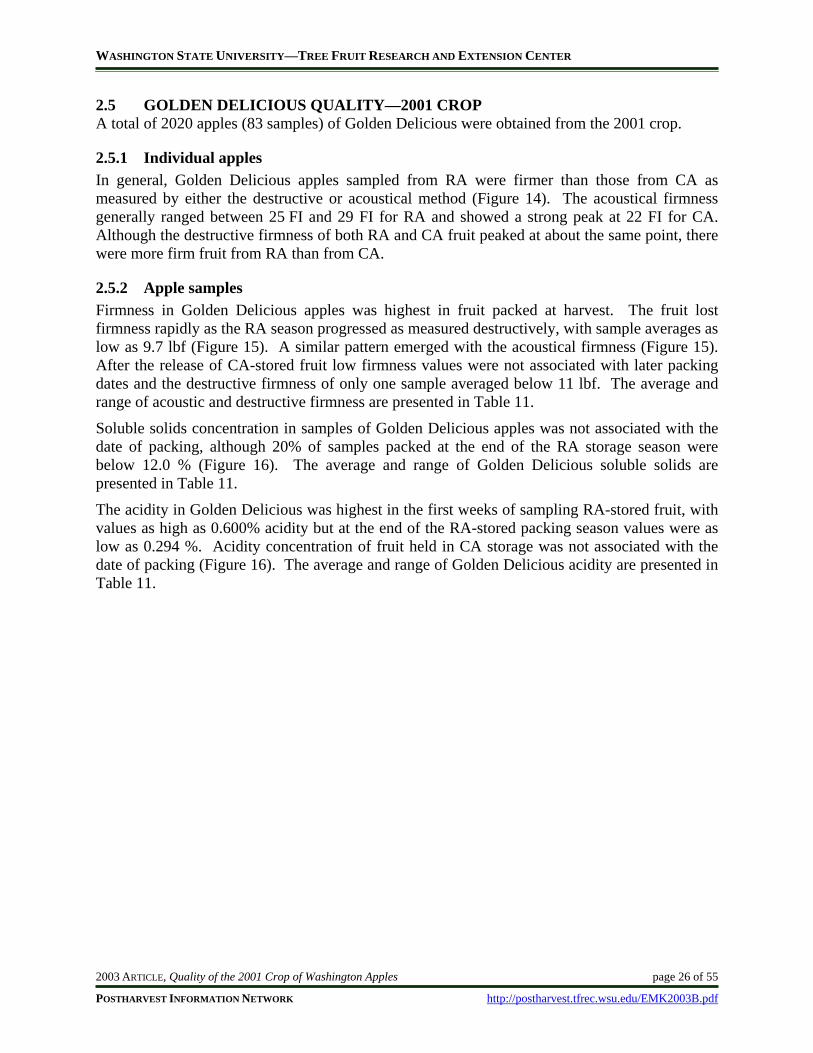
2.5.3 Packinghouse information
Table 11. Summary of Golden Delicious quality attributes by packinghouse. Temperature (ºF)
Packinghouse No. of
samples Internal External Soluble
Solids (%) Titratable
Acidity (%)
Destructive Firmness
(lbf)
Acoustic Firmness
(FI) a 4 66 72 12.4 0.497 16.4 25.2 b 6 41 67 13.1 0.473 14.1 25.6 c 19 51 60 13.5 0.418 15.2 23.1 d 1 56 73 12.0 0.520 18.2 25.7 e 2 56 69 14.0 0.386 11.8 20.3 f 2 60 72 12.2 0.405 15.4 — k 1 61 75 13.7 — 15.4 19.8 l 7 48 62 12.4 0.436 15.4 25.8 n 7 44 64 13.4 0.435 13.6 23.5 o 9 66 69 13.8 0.451 15.8 23.4 q 5 43 64 12.8 0.416 15.9 23.7 r 6 55 72 12.8 0.383 14.2 24.0 s 3 59 68 12.5 0.410 15.1 21.4 u 11 56 69 13.5 0.399 14.8 22.7
Average and range of all Golden Delicious samples. Average of samples 53 66 13.2 0.428 15.1 23.6
Range of samples 34 to 75 49 to 83 11.4 to 14.9 0.294 to 0.600 9.7 to 23.6 17.0 to 32.4
Numbers in bold type indicate packinghouse averages are comprised of five or more lots of fruit.
2.5.4 Historical perspective for Golden Delicious We sampled Golden Delicious apples in 1991, 2000, and 2001 (Table 12). The 2000 fruit had the lowest average firmness, but the highest soluble solids levels. Fruit were sampled over the same part of the season (December to June) in 1991 and 2000. In 2001, fruit were sampled from early August (Gingergold) to mid-April 2002.
Table 12. Comparison of Golden Delicious quality attributes in 1991, 2000, and 2001. 1991 Crop 2000 Crop 2001 Crop
Firmness (lbf) average range
14.5 (11 to 18)
13.4 (12 to 19)
15.1 (10 to 24)
Soluble solids (%) average range
12.8 (11 to 15)
13.5 (11 to 16)
13.2 (11 to 15)
Acidity (%) average range
0.39 (0.24 to 0.57)
0.40 (0.20 to 0.55)
0.43 (0.29 to 0.60)
Number of samples 148 94 83
WASHINGTON STATE UNIVERSITY—TREE FRUIT RESEARCH AND EXTENSION CENTER
2003 ARTICLE, Quality of the 2001 Crop of Washington Apples page 28 of 55
POSTHARVEST INFORMATION NETWORK http://postharvest.tfrec.wsu.edu/EMK2003B.pdf
Golden Delicious Acoustic Firmness(per apple average, 2001 crop)
0
20
40
60
80
100
120
140
160
180
8 10 12 14 16 18 20 22 24 26 28 30 32 34 36 38 40 42 44 46 48Acoustic Firmness (FI)
Freq
uenc
y
RA = 789 Apples
CA = 975 Apples
Golden Delicious Destructive Firmness(per apple average, 2001 crop)
0
10
20
30
40
50
60
70
80
90
100
7 8 9 10 11 12 13 14 15 16 17 18 19 20 21 22 23 24 25 26 27Destructive Firmness (lbf)
Freq
uenc
y
RA = 941 ApplesCA = 1030 Apples
Figure 14. Golden Delicious acoustic and destructive firmness based on individual apples, 2001 crop.
WASHINGTON STATE UNIVERSITY—TREE FRUIT RESEARCH AND EXTENSION CENTER
2003 ARTICLE, Quality of the 2001 Crop of Washington Apples page 29 of 55
POSTHARVEST INFORMATION NETWORK http://postharvest.tfrec.wsu.edu/EMK2003B.pdf
Golden Delicious Acoustic Firmness
15
20
25
30
35
40
1-Aug 1-Sep 2-Oct 2-Nov 3-Dec 3-Jan 3-Feb 6-Mar 6-Apr 7-May 7-Jun 8-Jul 8-Aug 8-SepPacking Date
Aco
ustic
Firm
ness
(FI)
RA CA
RA r2 = 0.48
Golden Delicious Destructive Firmness
9
11
13
15
17
19
21
23
25
1-Aug 1-Sep 2-Oct 2-Nov 3-Dec 3-Jan 3-Feb 6-Mar 6-Apr 7-May 7-Jun 8-Jul 8-Aug 8-SepPacking Date
Des
truc
tive
Firm
ness
(lbf
)
RA CA
RA r2 = 0.56
Figure 15. Golden Delicious sample average acoustic and destructive firmness by week, 2001 crop.
WASHINGTON STATE UNIVERSITY—TREE FRUIT RESEARCH AND EXTENSION CENTER
2003 ARTICLE, Quality of the 2001 Crop of Washington Apples page 30 of 55
POSTHARVEST INFORMATION NETWORK http://postharvest.tfrec.wsu.edu/EMK2003B.pdf
Golden Delicious Soluble Solids
9
10
11
12
13
14
15
16
17
1-Aug 1-Sep 2-Oct 2-Nov 3-Dec 3-Jan 3-Feb 6-Mar 6-Apr 7-May 7-Jun 8-Jul 8-Aug 8-SepPacking Date
Solu
ble
Solid
s (%
)
RA CA
Golden Delicious Titratable Acidity
0.1
0.3
0.5
0.7
0.9
1.1
1-Aug 1-Sep 2-Oct 2-Nov 3-Dec 3-Jan 3-Feb 6-Mar 6-Apr 7-May 7-Jun 8-Jul 8-Aug 8-SepPacking Date
Titr
atab
le A
cidi
ty (%
) RA CA
RA r2 = 0.25CA r2 = 0.24
Figure 16. Golden Delicious sample average SS and TA by week, 2001 crop.
WASHINGTON STATE UNIVERSITY—TREE FRUIT RESEARCH AND EXTENSION CENTER
2003 ARTICLE, Quality of the 2001 Crop of Washington Apples page 31 of 55
POSTHARVEST INFORMATION NETWORK http://postharvest.tfrec.wsu.edu/EMK2003B.pdf
2.6 GRANNY SMITH QUALITY—2001 CROP A total of 850 apples (34 samples) of Granny Smith were taken from the 2001 crop.
2.6.1 Individual apples Acoustic firmness was generally higher in RA-stored fruit than in CA-stored fruit (Figure 17). The distribution of destructive firmness for Granny Smith apples packed after CA and RA storage were similar with both peaking at 18 lbf (Figure 17). However there were more firm fruit from RA than from CA. Values of destructive firmness were as high as 24.0 lbf and no individual fruit was below 12.5 lbf.
2.6.2 Apple samples Granny Smith apples were typically of lower destructive or acoustical firmness when packed later in the season (Figure 18). Acoustical firmness showed a strong correlation with packing date, especially out of RA storage (Figure 18). Destructive firmness tests showed a reasonable correlation with packing date, especially out of CA storage. The sample averages and ranges of acoustic and destructive firmness are presented in Table 13.
Soluble solids concentration increased with later dates of packing for Granny Smith apples stored in RA, but was less associated with packing date in CA-stored fruit (Figure 19). The sample average and range of soluble solids are presented in Table 13.
There was a steep decline in Granny Smith acidity of both RA and CA-stored fruit over the season (Figure 19). RA-stored apples declined from above 1.00% acidity to below 0.60%. CA-stored apples declined from 0.88% to 0.27%. The average and range of Granny Smith acidity are presented in Table 13.
WASHINGTON STATE UNIVERSITY—TREE FRUIT RESEARCH AND EXTENSION CENTER
2003 ARTICLE, Quality of the 2001 Crop of Washington Apples page 32 of 55
POSTHARVEST INFORMATION NETWORK http://postharvest.tfrec.wsu.edu/EMK2003B.pdf
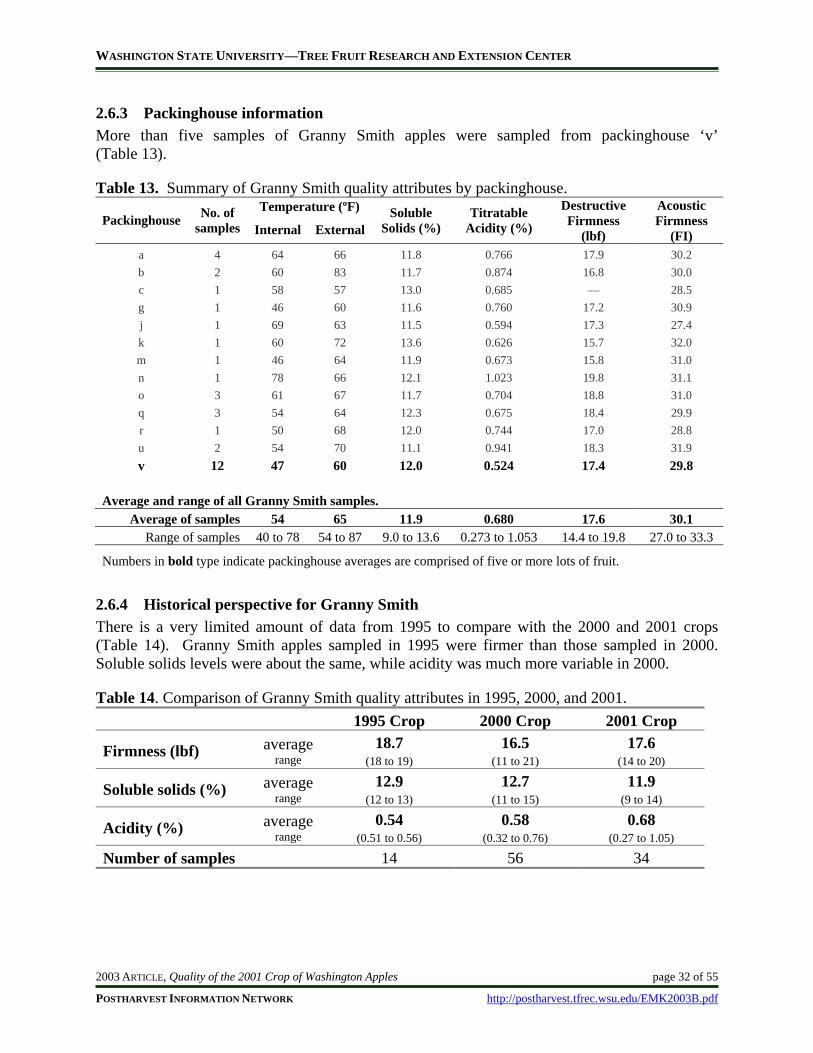
2.6.3 Packinghouse information More than five samples of Granny Smith apples were sampled from packinghouse ‘v’ (Table 13).
Table 13. Summary of Granny Smith quality attributes by packinghouse. Temperature (ºF)
Packinghouse No. of samples Internal External
Soluble Solids (%)
Titratable Acidity (%)
Destructive Firmness
(lbf)
Acoustic Firmness
(FI) a 4 64 66 11.8 0.766 17.9 30.2 b 2 60 83 11.7 0.874 16.8 30.0 c 1 58 57 13.0 0.685 — 28.5 g 1 46 60 11.6 0.760 17.2 30.9 j 1 69 63 11.5 0.594 17.3 27.4 k 1 60 72 13.6 0.626 15.7 32.0 m 1 46 64 11.9 0.673 15.8 31.0 n 1 78 66 12.1 1.023 19.8 31.1 o 3 61 67 11.7 0.704 18.8 31.0 q 3 54 64 12.3 0.675 18.4 29.9 r 1 50 68 12.0 0.744 17.0 28.8 u 2 54 70 11.1 0.941 18.3 31.9 v 12 47 60 12.0 0.524 17.4 29.8
Average and range of all Granny Smith samples. Average of samples 54 65 11.9 0.680 17.6 30.1
Range of samples 40 to 78 54 to 87 9.0 to 13.6 0.273 to 1.053 14.4 to 19.8 27.0 to 33.3
Numbers in bold type indicate packinghouse averages are comprised of five or more lots of fruit.
2.6.4 Historical perspective for Granny Smith There is a very limited amount of data from 1995 to compare with the 2000 and 2001 crops (Table 14). Granny Smith apples sampled in 1995 were firmer than those sampled in 2000. Soluble solids levels were about the same, while acidity was much more variable in 2000.
Table 14. Comparison of Granny Smith quality attributes in 1995, 2000, and 2001. 1995 Crop 2000 Crop 2001 Crop
Firmness (lbf) average range
18.7 (18 to 19)
16.5 (11 to 21)
17.6 (14 to 20)
Soluble solids (%) average range
12.9 (12 to 13)
12.7 (11 to 15)
11.9 (9 to 14)
Acidity (%) average range
0.54 (0.51 to 0.56)
0.58 (0.32 to 0.76)
0.68 (0.27 to 1.05)
Number of samples 14 56 34
WASHINGTON STATE UNIVERSITY—TREE FRUIT RESEARCH AND EXTENSION CENTER
2003 ARTICLE, Quality of the 2001 Crop of Washington Apples page 33 of 55
POSTHARVEST INFORMATION NETWORK http://postharvest.tfrec.wsu.edu/EMK2003B.pdf
Granny Smith Acoustic Firmness(per apple average, 2001 crop)
0
10
20
30
40
50
60
70
80
90
8 10 12 14 16 18 20 22 24 26 28 30 32 34 36 38 40 42 44 46 48Acoustic Firmness (FI)
Freq
uenc
y
RA = 447 Apples
CA = 398 Apples
Granny Smith Destructive Firmness(per apple average, 2001 crop)
0
10
20
30
40
50
60
70
7 8 9 10 11 12 13 14 15 16 17 18 19 20 21 22 23 24 25 26 27Destructive Firmness (lbf)
Freq
uenc
y
RA = 451 ApplesCA = 400 Apples
Figure 17. Granny Smith acoustic and destructive firmness based on individual apples, 2001 crop.
WASHINGTON STATE UNIVERSITY—TREE FRUIT RESEARCH AND EXTENSION CENTER
2003 ARTICLE, Quality of the 2001 Crop of Washington Apples page 34 of 55
POSTHARVEST INFORMATION NETWORK http://postharvest.tfrec.wsu.edu/EMK2003B.pdf
Granny Smith Acoustic Firmness
15
20
25
30
35
40
1-Aug 1-Sep 2-Oct 2-Nov 3-Dec 3-Jan 3-Feb 6-Mar 6-Apr 7-May 7-Jun 8-Jul 8-Aug 8-SepPacking Date
Aco
ustic
Firm
ness
(FI)
RA CA
RA r2 = 0.51
Granny Smith Destructive Firmness
9
11
13
15
17
19
21
23
25
1-Aug 1-Sep 2-Oct 2-Nov 3-Dec 3-Jan 3-Feb 6-Mar 6-Apr 7-May 7-Jun 8-Jul 8-Aug 8-SepPacking Date
Des
truc
tive
Firm
ness
(lbf
) RA CA
RA r2 = 0.22CA r2 = 0.41
Figure 18. Granny Smith sample average acoustic and destructive firmness by week, 2001 crop.
WASHINGTON STATE UNIVERSITY—TREE FRUIT RESEARCH AND EXTENSION CENTER
2003 ARTICLE, Quality of the 2001 Crop of Washington Apples page 35 of 55
POSTHARVEST INFORMATION NETWORK http://postharvest.tfrec.wsu.edu/EMK2003B.pdf
Granny Smith Soluble Solids
9
10
11
12
13
14
15
16
17
1-Aug 1-Sep 2-Oct 2-Nov 3-Dec 3-Jan 3-Feb 6-Mar 6-Apr 7-May 7-Jun 8-Jul 8-Aug 8-SepPacking Date
Solu
ble
Solid
s (%
)
RA CA
RA r2 = 0.51CA r2 = 0.27
Granny Smith Titratable Acidity
0.1
0.3
0.5
0.7
0.9
1.1
1-Aug 1-Sep 2-Oct 2-Nov 3-Dec 3-Jan 3-Feb 6-Mar 6-Apr 7-May 7-Jun 8-Jul 8-Aug 8-SepPacking Date
Titr
atab
le A
cidi
ty (%
)
RA CA
RA r2 = 0.52CA r2 = 0.69
Figure 19. Granny Smith sample average SS and TA by week, 2001 crop.
WASHINGTON STATE UNIVERSITY—TREE FRUIT RESEARCH AND EXTENSION CENTER
2003 ARTICLE, Quality of the 2001 Crop of Washington Apples page 36 of 55
POSTHARVEST INFORMATION NETWORK http://postharvest.tfrec.wsu.edu/EMK2003B.pdf
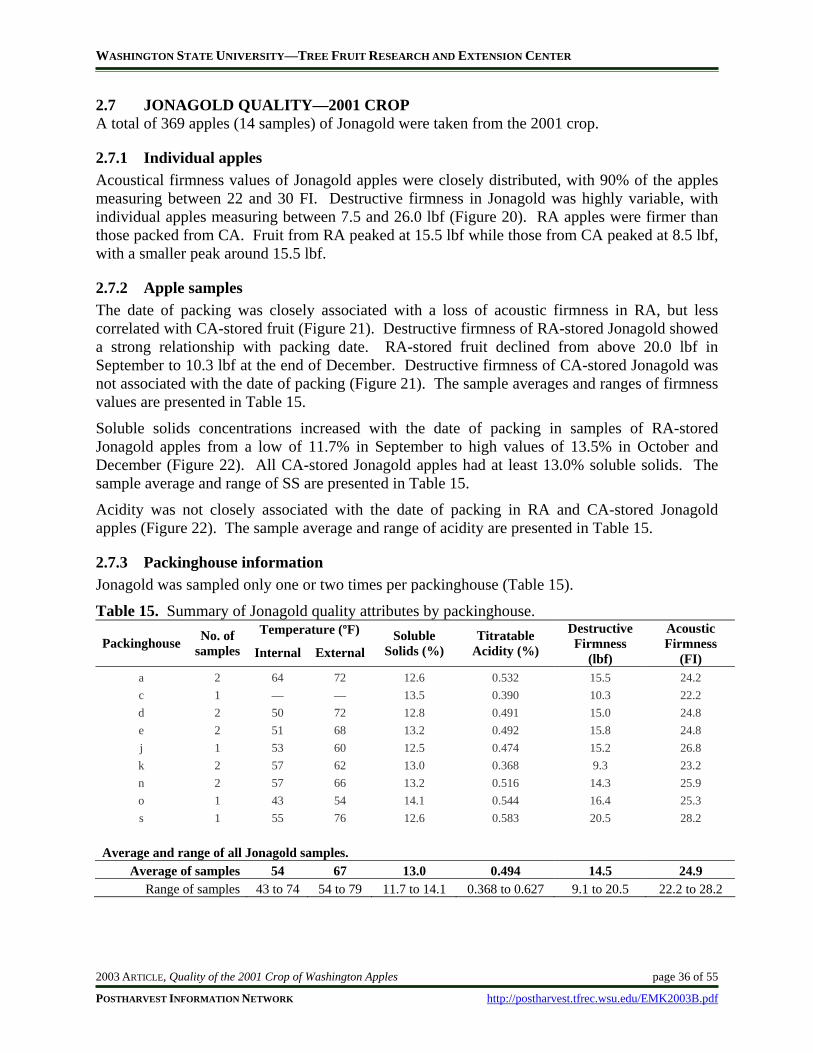
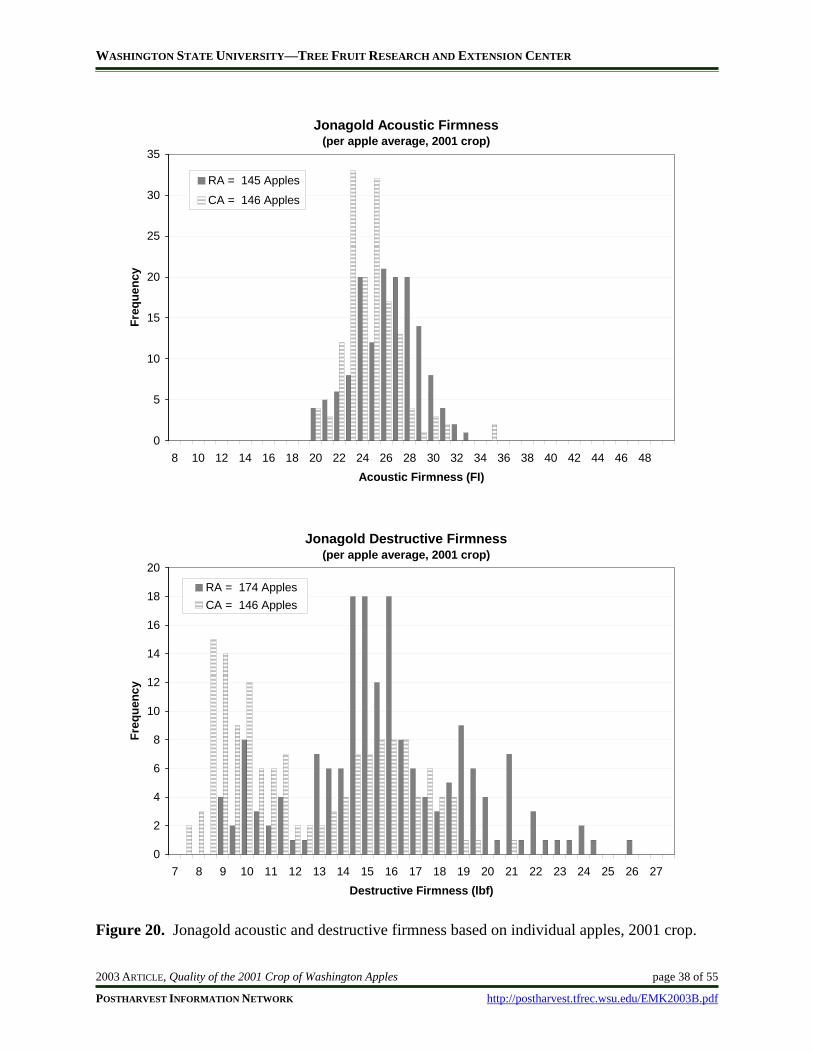
2.7 JONAGOLD QUALITY—2001 CROP A total of 369 apples (14 samples) of Jonagold were taken from the 2001 crop.
2.7.1 Individual apples Acoustical firmness values of Jonagold apples were closely distributed, with 90% of the apples measuring between 22 and 30 FI. Destructive firmness in Jonagold was highly variable, with individual apples measuring between 7.5 and 26.0 lbf (Figure 20). RA apples were firmer than those packed from CA. Fruit from RA peaked at 15.5 lbf while those from CA peaked at 8.5 lbf, with a smaller peak around 15.5 lbf.
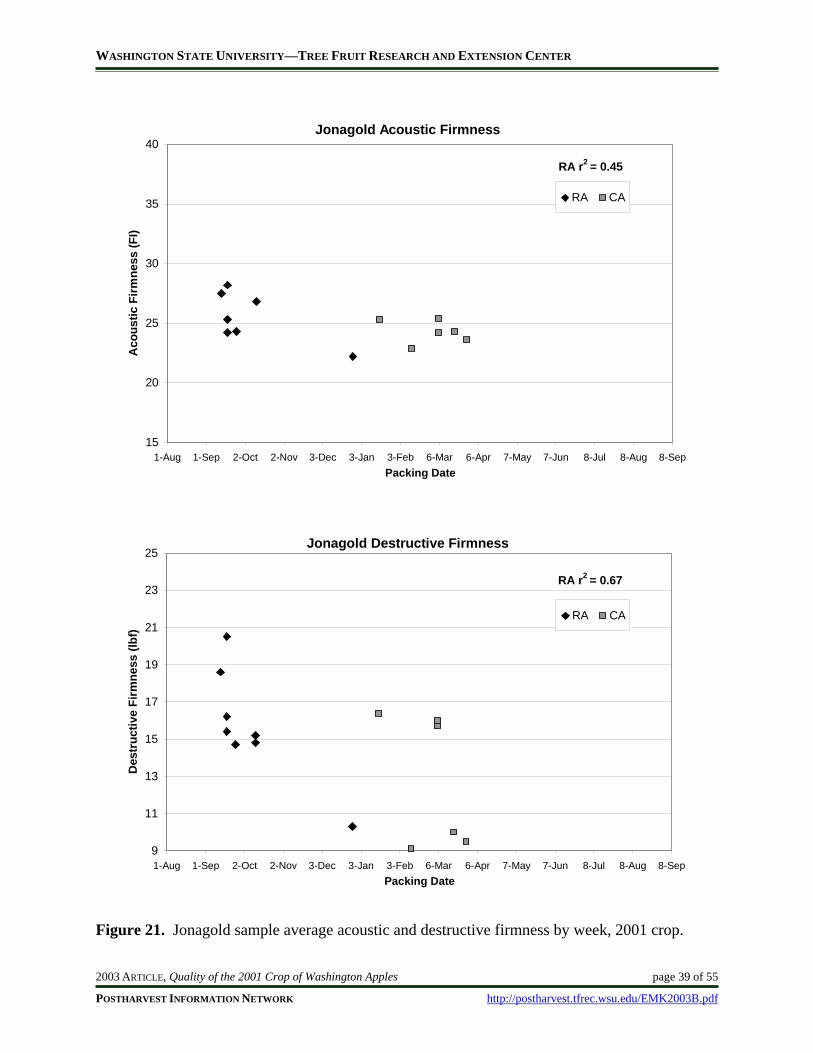
2.7.2 Apple samples The date of packing was closely associated with a loss of acoustic firmness in RA, but less correlated with CA-stored fruit (Figure 21). Destructive firmness of RA-stored Jonagold showed a strong relationship with packing date. RA-stored fruit declined from above 20.0 lbf in September to 10.3 lbf at the end of December. Destructive firmness of CA-stored Jonagold was not associated with the date of packing (Figure 21). The sample averages and ranges of firmness values are presented in Table 15.
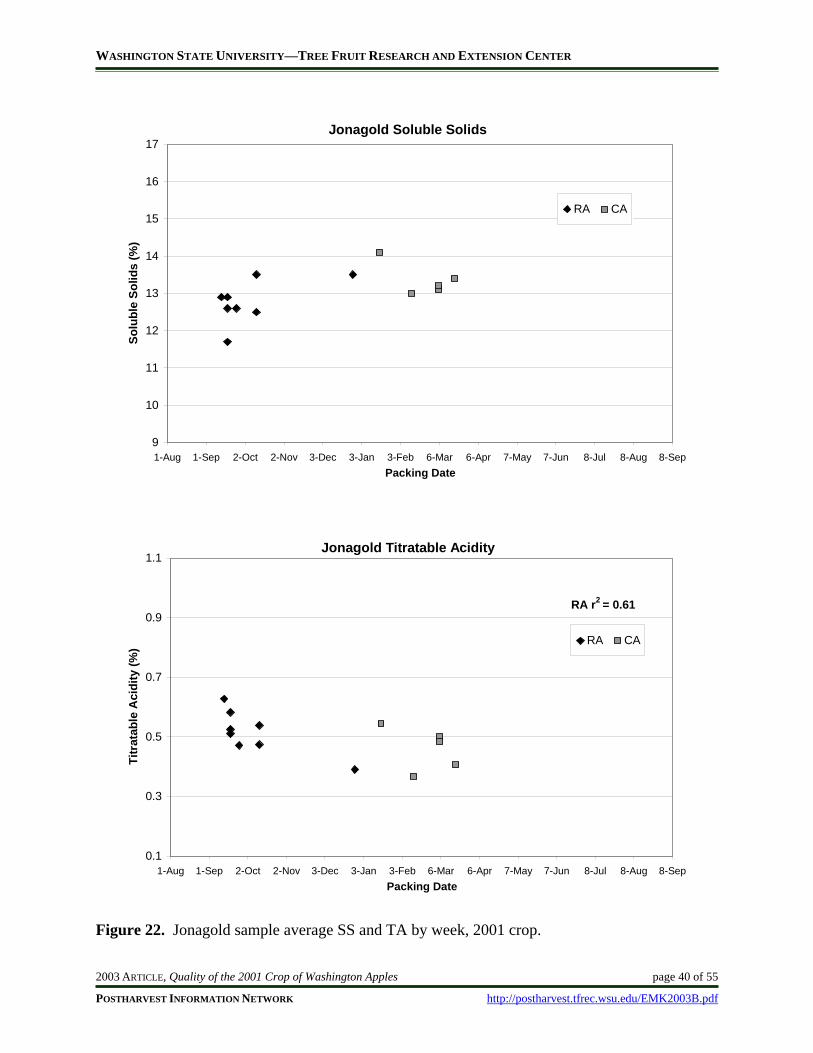
Soluble solids concentrations increased with the date of packing in samples of RA-stored Jonagold apples from a low of 11.7% in September to high values of 13.5% in October and December (Figure 22). All CA-stored Jonagold apples had at least 13.0% soluble solids. The sample average and range of SS are presented in Table 15.
Acidity was not closely associated with the date of packing in RA and CA-stored Jonagold apples (Figure 22). The sample average and range of acidity are presented in Table 15.
2.7.3 Packinghouse information Jonagold was sampled only one or two times per packinghouse (Table 15).
Table 15. Summary of Jonagold quality attributes by packinghouse. Temperature (ºF)
Packinghouse No. of samples Internal External
Soluble Solids (%)
Titratable Acidity (%)
Destructive Firmness
(lbf)
Acoustic Firmness
(FI) a 2 64 72 12.6 0.532 15.5 24.2 c 1 — — 13.5 0.390 10.3 22.2 d 2 50 72 12.8 0.491 15.0 24.8 e 2 51 68 13.2 0.492 15.8 24.8 j 1 53 60 12.5 0.474 15.2 26.8 k 2 57 62 13.0 0.368 9.3 23.2 n 2 57 66 13.2 0.516 14.3 25.9 o 1 43 54 14.1 0.544 16.4 25.3 s 1 55 76 12.6 0.583 20.5 28.2
Average and range of all Jonagold samples. Average of samples 54 67 13.0 0.494 14.5 24.9
Range of samples 43 to 74 54 to 79 11.7 to 14.1 0.368 to 0.627 9.1 to 20.5 22.2 to 28.2
WASHINGTON STATE UNIVERSITY—TREE FRUIT RESEARCH AND EXTENSION CENTER
2003 ARTICLE, Quality of the 2001 Crop of Washington Apples page 37 of 55
POSTHARVEST INFORMATION NETWORK http://postharvest.tfrec.wsu.edu/EMK2003B.pdf
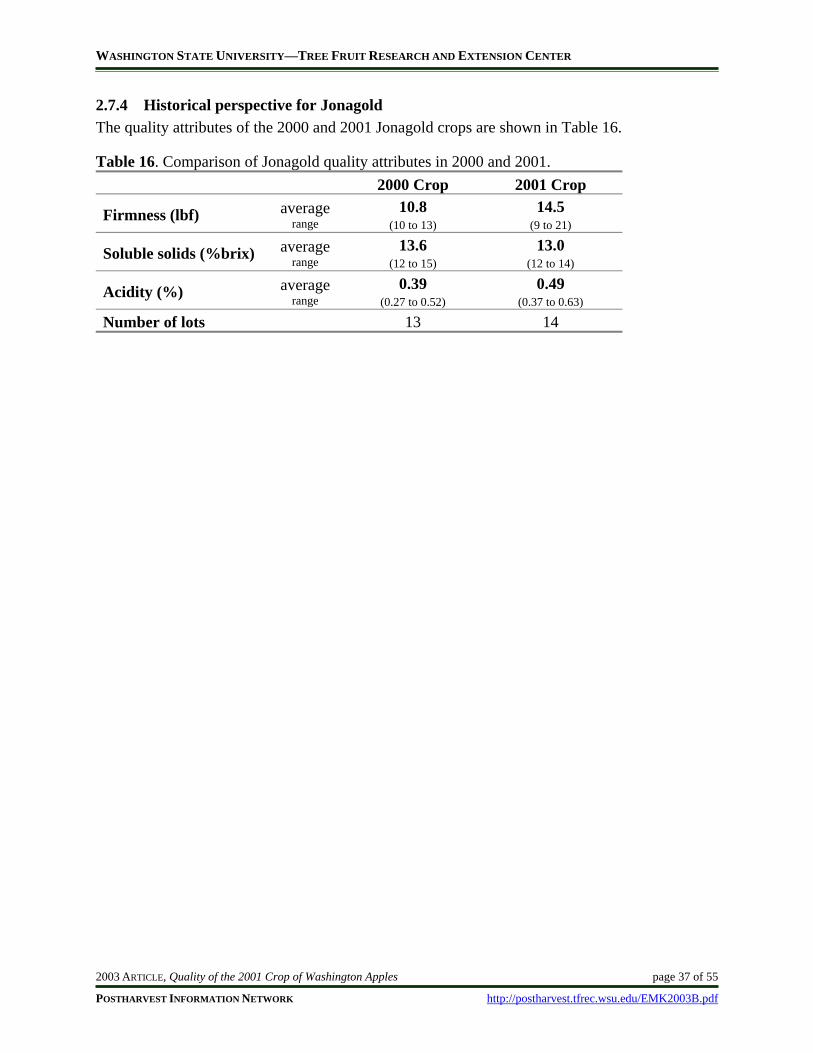
2.7.4 Historical perspective for Jonagold The quality attributes of the 2000 and 2001 Jonagold crops are shown in Table 16.
Table 16. Comparison of Jonagold quality attributes in 2000 and 2001. 2000 Crop 2001 Crop
Firmness (lbf) average range
10.8 (10 to 13)
14.5 (9 to 21)
Soluble solids (%brix) average range
13.6 (12 to 15)
13.0 (12 to 14)
Acidity (%) average range
0.39 (0.27 to 0.52)
0.49 (0.37 to 0.63)
Number of lots 13 14
WASHINGTON STATE UNIVERSITY—TREE FRUIT RESEARCH AND EXTENSION CENTER
2003 ARTICLE, Quality of the 2001 Crop of Washington Apples page 38 of 55
POSTHARVEST INFORMATION NETWORK http://postharvest.tfrec.wsu.edu/EMK2003B.pdf
Jonagold Acoustic Firmness(per apple average, 2001 crop)
0
5
10
15
20
25
30
35
8 10 12 14 16 18 20 22 24 26 28 30 32 34 36 38 40 42 44 46 48Acoustic Firmness (FI)
Freq
uenc
y
RA = 145 Apples
CA = 146 Apples
Jonagold Destructive Firmness(per apple average, 2001 crop)
0
2
4
6
8
10
12
14
16
18
20
7 8 9 10 11 12 13 14 15 16 17 18 19 20 21 22 23 24 25 26 27Destructive Firmness (lbf)
Freq
uenc
y
RA = 174 ApplesCA = 146 Apples
Figure 20. Jonagold acoustic and destructive firmness based on individual apples, 2001 crop.
WASHINGTON STATE UNIVERSITY—TREE FRUIT RESEARCH AND EXTENSION CENTER
2003 ARTICLE, Quality of the 2001 Crop of Washington Apples page 39 of 55
POSTHARVEST INFORMATION NETWORK http://postharvest.tfrec.wsu.edu/EMK2003B.pdf
Jonagold Acoustic Firmness
15
20
25
30
35
40
1-Aug 1-Sep 2-Oct 2-Nov 3-Dec 3-Jan 3-Feb 6-Mar 6-Apr 7-May 7-Jun 8-Jul 8-Aug 8-SepPacking Date
Aco
ustic
Firm
ness
(FI)
RA CA
RA r2 = 0.45
Jonagold Destructive Firmness
9
11
13
15
17
19
21
23
25
1-Aug 1-Sep 2-Oct 2-Nov 3-Dec 3-Jan 3-Feb 6-Mar 6-Apr 7-May 7-Jun 8-Jul 8-Aug 8-SepPacking Date
Des
truc
tive
Firm
ness
(lbf
)
RA CA
RA r2 = 0.67
Figure 21. Jonagold sample average acoustic and destructive firmness by week, 2001 crop.
WASHINGTON STATE UNIVERSITY—TREE FRUIT RESEARCH AND EXTENSION CENTER
2003 ARTICLE, Quality of the 2001 Crop of Washington Apples page 40 of 55
POSTHARVEST INFORMATION NETWORK http://postharvest.tfrec.wsu.edu/EMK2003B.pdf
Jonagold Soluble Solids
9
10
11
12
13
14
15
16
17
1-Aug 1-Sep 2-Oct 2-Nov 3-Dec 3-Jan 3-Feb 6-Mar 6-Apr 7-May 7-Jun 8-Jul 8-Aug 8-SepPacking Date
Solu
ble
Solid
s (%
)
RA CA
Jonagold Titratable Acidity
0.1
0.3
0.5
0.7
0.9
1.1
1-Aug 1-Sep 2-Oct 2-Nov 3-Dec 3-Jan 3-Feb 6-Mar 6-Apr 7-May 7-Jun 8-Jul 8-Aug 8-SepPacking Date
Titr
atab
le A
cidi
ty (%
) RA CA
RA r2 = 0.61
Figure 22. Jonagold sample average SS and TA by week, 2001 crop.
WASHINGTON STATE UNIVERSITY—TREE FRUIT RESEARCH AND EXTENSION CENTER
2003 ARTICLE, Quality of the 2001 Crop of Washington Apples page 41 of 55
POSTHARVEST INFORMATION NETWORK http://postharvest.tfrec.wsu.edu/EMK2003B.pdf
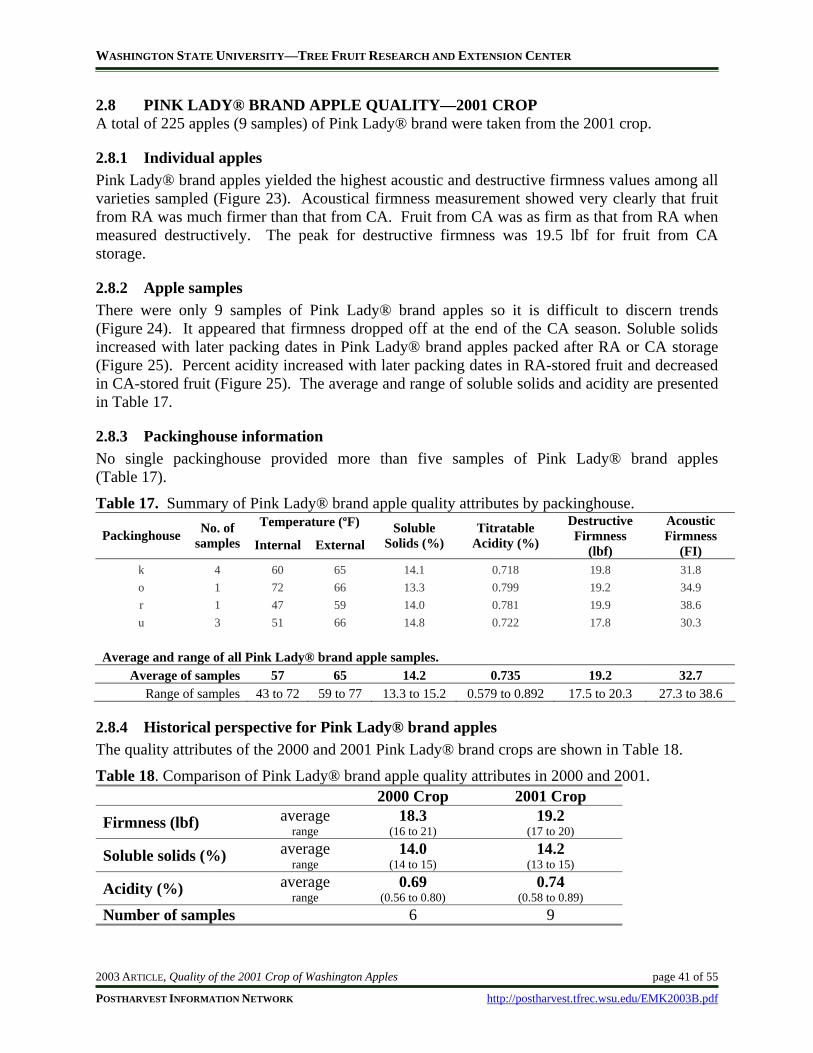
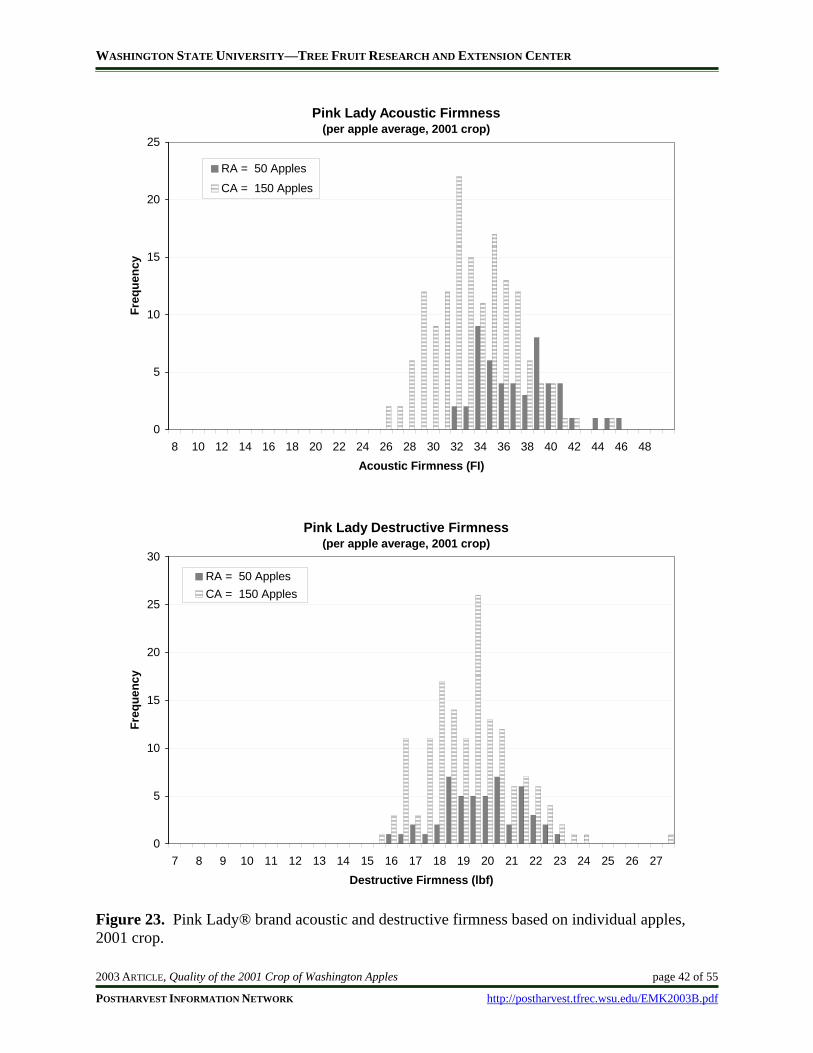
2.8 PINK LADY® BRAND APPLE QUALITY—2001 CROP A total of 225 apples (9 samples) of Pink Lady® brand were taken from the 2001 crop.
2.8.1 Individual apples Pink Lady® brand apples yielded the highest acoustic and destructive firmness values among all varieties sampled (Figure 23). Acoustical firmness measurement showed very clearly that fruit from RA was much firmer than that from CA. Fruit from CA was as firm as that from RA when measured destructively. The peak for destructive firmness was 19.5 lbf for fruit from CA storage.
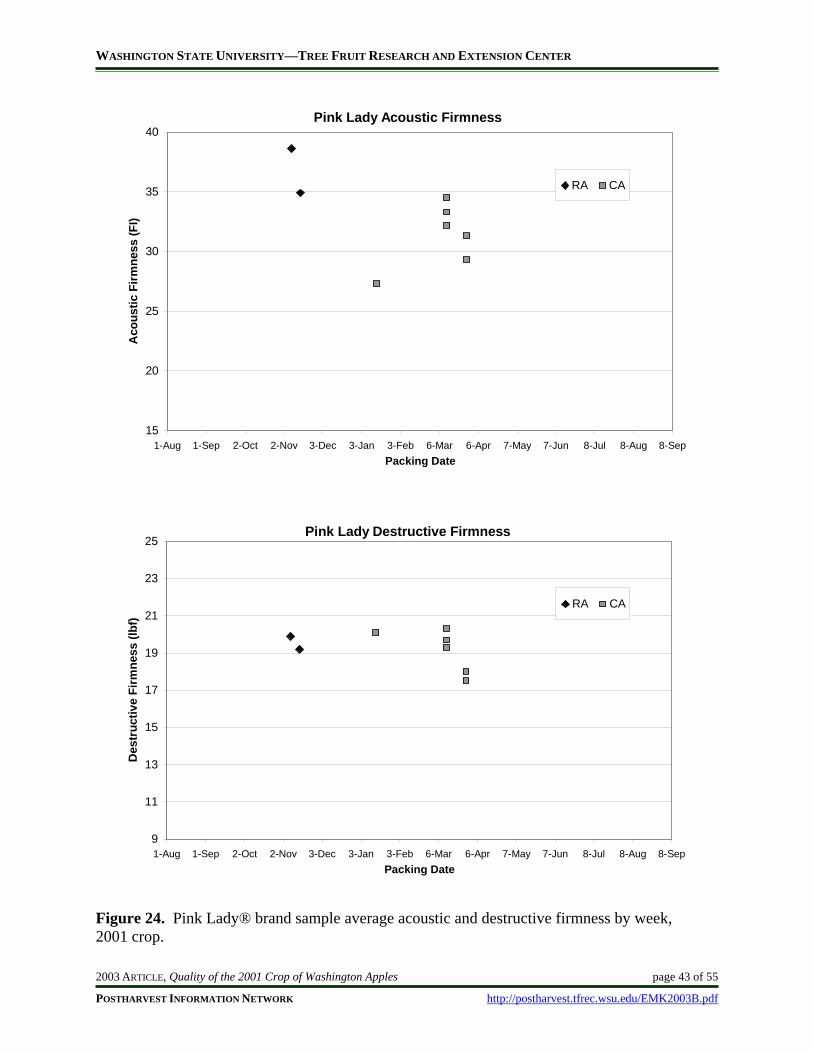
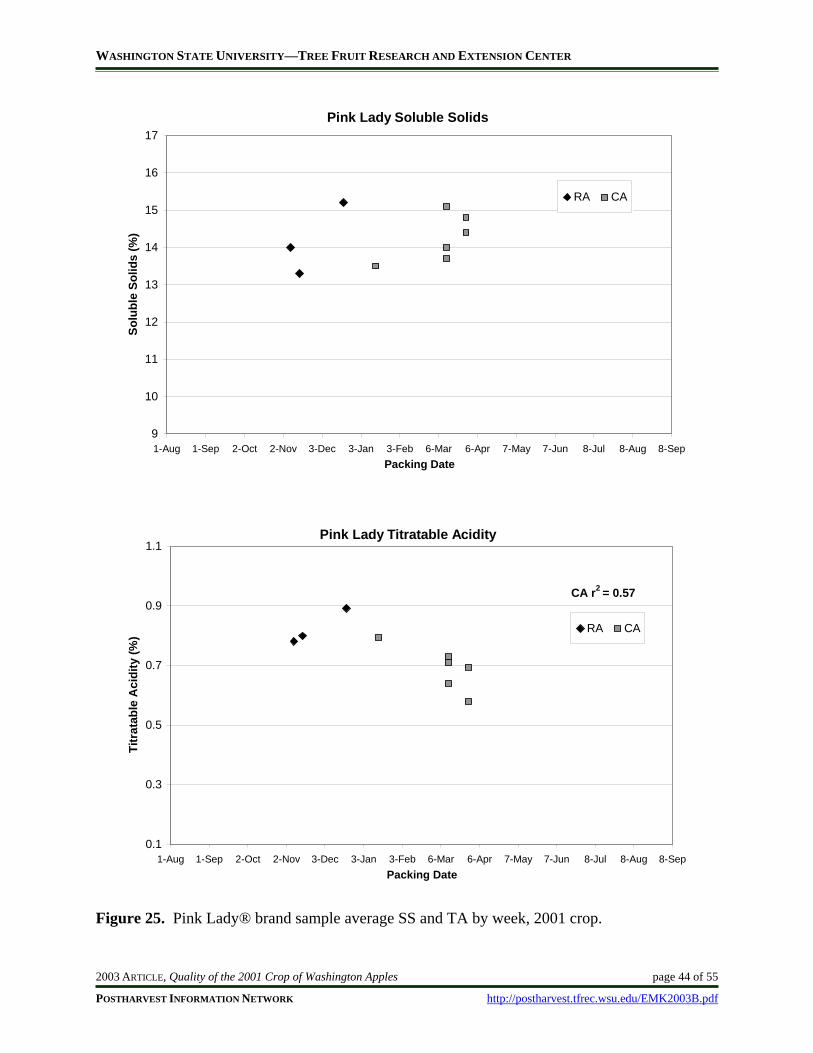
2.8.2 Apple samples There were only 9 samples of Pink Lady® brand apples so it is difficult to discern trends (Figure 24). It appeared that firmness dropped off at the end of the CA season. Soluble solids increased with later packing dates in Pink Lady® brand apples packed after RA or CA storage (Figure 25). Percent acidity increased with later packing dates in RA-stored fruit and decreased in CA-stored fruit (Figure 25). The average and range of soluble solids and acidity are presented in Table 17.
2.8.3 Packinghouse information No single packinghouse provided more than five samples of Pink Lady® brand apples (Table 17).
Table 17. Summary of Pink Lady® brand apple quality attributes by packinghouse. Temperature (ºF)
Packinghouse No. of samples Internal External
Soluble Solids (%)
Titratable Acidity (%)
Destructive Firmness
(lbf)
Acoustic Firmness
(FI) k 4 60 65 14.1 0.718 19.8 31.8 o 1 72 66 13.3 0.799 19.2 34.9 r 1 47 59 14.0 0.781 19.9 38.6 u 3 51 66 14.8 0.722 17.8 30.3
Average and range of all Pink Lady® brand apple samples. Average of samples 57 65 14.2 0.735 19.2 32.7
Range of samples 43 to 72 59 to 77 13.3 to 15.2 0.579 to 0.892 17.5 to 20.3 27.3 to 38.6
2.8.4 Historical perspective for Pink Lady® brand apples The quality attributes of the 2000 and 2001 Pink Lady® brand crops are shown in Table 18.
Table 18. Comparison of Pink Lady® brand apple quality attributes in 2000 and 2001. 2000 Crop 2001 Crop
Firmness (lbf) average range
18.3 (16 to 21)
19.2 (17 to 20)
Soluble solids (%) average range
14.0 (14 to 15)
14.2 (13 to 15)
Acidity (%) average range
0.69 (0.56 to 0.80)
0.74 (0.58 to 0.89)
Number of samples 6 9
WASHINGTON STATE UNIVERSITY—TREE FRUIT RESEARCH AND EXTENSION CENTER
2003 ARTICLE, Quality of the 2001 Crop of Washington Apples page 42 of 55
POSTHARVEST INFORMATION NETWORK http://postharvest.tfrec.wsu.edu/EMK2003B.pdf
Pink Lady Acoustic Firmness(per apple average, 2001 crop)
0
5
10
15
20
25
8 10 12 14 16 18 20 22 24 26 28 30 32 34 36 38 40 42 44 46 48Acoustic Firmness (FI)
Freq
uenc
y
RA = 50 Apples
CA = 150 Apples
Pink Lady Destructive Firmness(per apple average, 2001 crop)
0
5
10
15
20
25
30
7 8 9 10 11 12 13 14 15 16 17 18 19 20 21 22 23 24 25 26 27Destructive Firmness (lbf)
Freq
uenc
y
RA = 50 ApplesCA = 150 Apples
Figure 23. Pink Lady® brand acoustic and destructive firmness based on individual apples, 2001 crop.
WASHINGTON STATE UNIVERSITY—TREE FRUIT RESEARCH AND EXTENSION CENTER
2003 ARTICLE, Quality of the 2001 Crop of Washington Apples page 43 of 55
POSTHARVEST INFORMATION NETWORK http://postharvest.tfrec.wsu.edu/EMK2003B.pdf
Pink Lady Acoustic Firmness
15
20
25
30
35
40
1-Aug 1-Sep 2-Oct 2-Nov 3-Dec 3-Jan 3-Feb 6-Mar 6-Apr 7-May 7-Jun 8-Jul 8-Aug 8-SepPacking Date
Aco
ustic
Firm
ness
(FI)
RA CA
Pink Lady Destructive Firmness
9
11
13
15
17
19
21
23
25
1-Aug 1-Sep 2-Oct 2-Nov 3-Dec 3-Jan 3-Feb 6-Mar 6-Apr 7-May 7-Jun 8-Jul 8-Aug 8-SepPacking Date
Des
truc
tive
Firm
ness
(lbf
)
RA CA
Figure 24. Pink Lady® brand sample average acoustic and destructive firmness by week, 2001 crop.
WASHINGTON STATE UNIVERSITY—TREE FRUIT RESEARCH AND EXTENSION CENTER
2003 ARTICLE, Quality of the 2001 Crop of Washington Apples page 44 of 55
POSTHARVEST INFORMATION NETWORK http://postharvest.tfrec.wsu.edu/EMK2003B.pdf
Pink Lady Soluble Solids
9
10
11
12
13
14
15
16
17
1-Aug 1-Sep 2-Oct 2-Nov 3-Dec 3-Jan 3-Feb 6-Mar 6-Apr 7-May 7-Jun 8-Jul 8-Aug 8-SepPacking Date
Solu
ble
Solid
s (%
)
RA CA
Pink Lady Titratable Acidity
0.1
0.3
0.5
0.7
0.9
1.1
1-Aug 1-Sep 2-Oct 2-Nov 3-Dec 3-Jan 3-Feb 6-Mar 6-Apr 7-May 7-Jun 8-Jul 8-Aug 8-SepPacking Date
Titr
atab
le A
cidi
ty (%
)
RA CA
CA r2 = 0.57
Figure 25. Pink Lady® brand sample average SS and TA by week, 2001 crop.
WASHINGTON STATE UNIVERSITY—TREE FRUIT RESEARCH AND EXTENSION CENTER
2003 ARTICLE, Quality of the 2001 Crop of Washington Apples page 45 of 55
POSTHARVEST INFORMATION NETWORK http://postharvest.tfrec.wsu.edu/EMK2003B.pdf
2.9 RED DELICIOUS QUALITY—2001 CROP A total of 3,187 apples (138 samples) of Red Delicious were taken from the 2001 crop.
2.9.1 Individual apples Acoustic firmness of CA-stored fruit was higher than RA, while destructive firmness for RA-stored fruit was slightly higher than CA (Figure 26). The range in destructive firmness was from 7 lbf to 24 lbf; the peak for CA fruit was 15.5 lbf and RA fruit peaked at 16 lbf.
2.9.2 Apple samples There was a huge range in sample firmness throughout the season whether measured destructively or acoustically. Firmness of CA-stored fruit was not correlated with time of packing, although RA-stored fruit showed a decline in destructive firmness over time (Figure 27). Acoustic firmness average and range for Red Delicious are presented in Table 19.
Red Delicious soluble solids concentration was slightly correlated with time of packing in fruit stored in RA, with values in September as low as 10.0% and in November and December above 14.0 % (Figure 28). Soluble solids concentration of fruit stored in CA was not associated with an increase or decrease over time. The sample average and range of soluble solids in Red Delicious are presented in Table 19.
A decline in acidity was only slightly associated with the date of packing in Red Delicious stored in RA, with values in September as high as 0.376% and concentrations in December below 0.250% (Figure 28). Acidity out of CA storage was more closely associated with the date of packing. In CA-stored Red Delicious 39% of all samples measured below 0.200%.
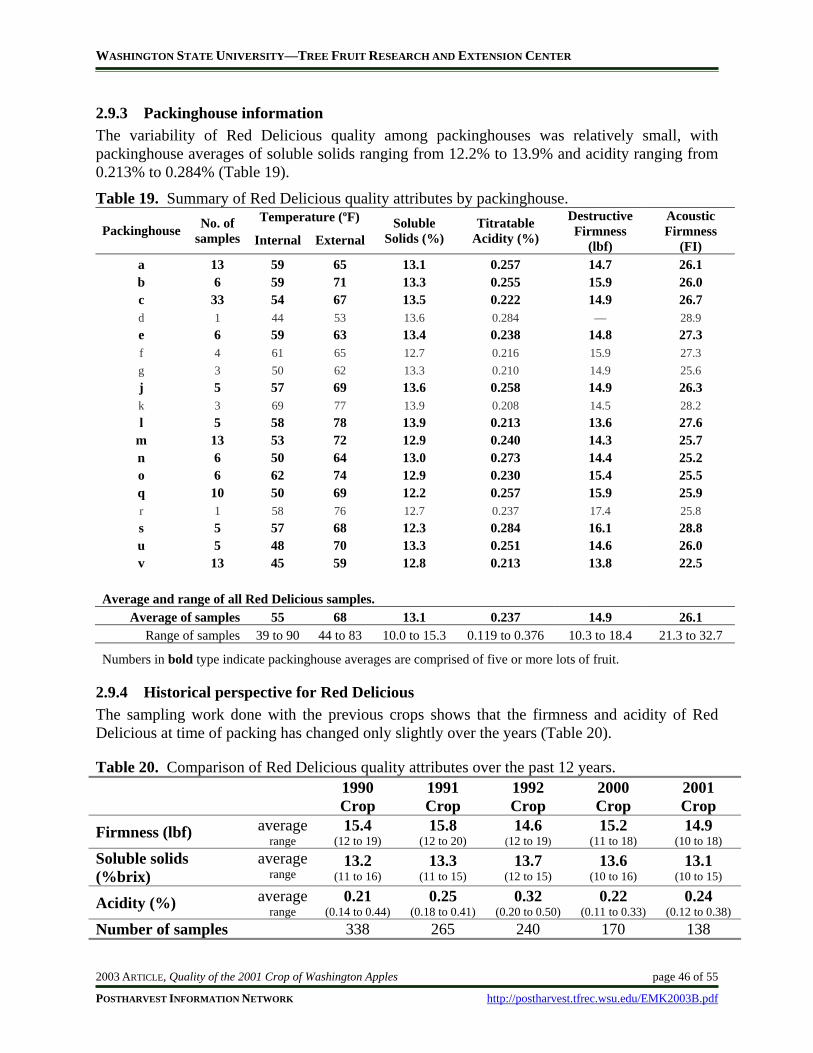
WASHINGTON STATE UNIVERSITY—TREE FRUIT RESEARCH AND EXTENSION CENTER
2003 ARTICLE, Quality of the 2001 Crop of Washington Apples page 46 of 55
POSTHARVEST INFORMATION NETWORK http://postharvest.tfrec.wsu.edu/EMK2003B.pdf
2.9.3 Packinghouse information The variability of Red Delicious quality among packinghouses was relatively small, with packinghouse averages of soluble solids ranging from 12.2% to 13.9% and acidity ranging from 0.213% to 0.284% (Table 19).
Table 19. Summary of Red Delicious quality attributes by packinghouse. Temperature (ºF)
Packinghouse No. of samples Internal External
Soluble Solids (%)
Titratable Acidity (%)
Destructive Firmness
(lbf)
Acoustic Firmness
(FI) a 13 59 65 13.1 0.257 14.7 26.1 b 6 59 71 13.3 0.255 15.9 26.0 c 33 54 67 13.5 0.222 14.9 26.7 d 1 44 53 13.6 0.284 — 28.9 e 6 59 63 13.4 0.238 14.8 27.3 f 4 61 65 12.7 0.216 15.9 27.3 g 3 50 62 13.3 0.210 14.9 25.6 j 5 57 69 13.6 0.258 14.9 26.3 k 3 69 77 13.9 0.208 14.5 28.2 l 5 58 78 13.9 0.213 13.6 27.6
m 13 53 72 12.9 0.240 14.3 25.7 n 6 50 64 13.0 0.273 14.4 25.2 o 6 62 74 12.9 0.230 15.4 25.5 q 10 50 69 12.2 0.257 15.9 25.9 r 1 58 76 12.7 0.237 17.4 25.8 s 5 57 68 12.3 0.284 16.1 28.8 u 5 48 70 13.3 0.251 14.6 26.0 v 13 45 59 12.8 0.213 13.8 22.5
Average and range of all Red Delicious samples. Average of samples 55 68 13.1 0.237 14.9 26.1
Range of samples 39 to 90 44 to 83 10.0 to 15.3 0.119 to 0.376 10.3 to 18.4 21.3 to 32.7
Numbers in bold type indicate packinghouse averages are comprised of five or more lots of fruit.
2.9.4 Historical perspective for Red Delicious The sampling work done with the previous crops shows that the firmness and acidity of Red Delicious at time of packing has changed only slightly over the years (Table 20).
Table 20. Comparison of Red Delicious quality attributes over the past 12 years. 1990
Crop 1991 Crop
1992 Crop
2000 Crop
2001 Crop
Firmness (lbf) average range
15.4 (12 to 19)
15.8 (12 to 20)
14.6 (12 to 19)
15.2 (11 to 18)
14.9 (10 to 18)
Soluble solids (%brix)
average range
13.2 (11 to 16)
13.3 (11 to 15)
13.7 (12 to 15)
13.6 (10 to 16)
13.1 (10 to 15)
Acidity (%) average range
0.21 (0.14 to 0.44)
0.25 (0.18 to 0.41)
0.32 (0.20 to 0.50)
0.22 (0.11 to 0.33)
0.24 (0.12 to 0.38)
Number of samples 338 265 240 170 138
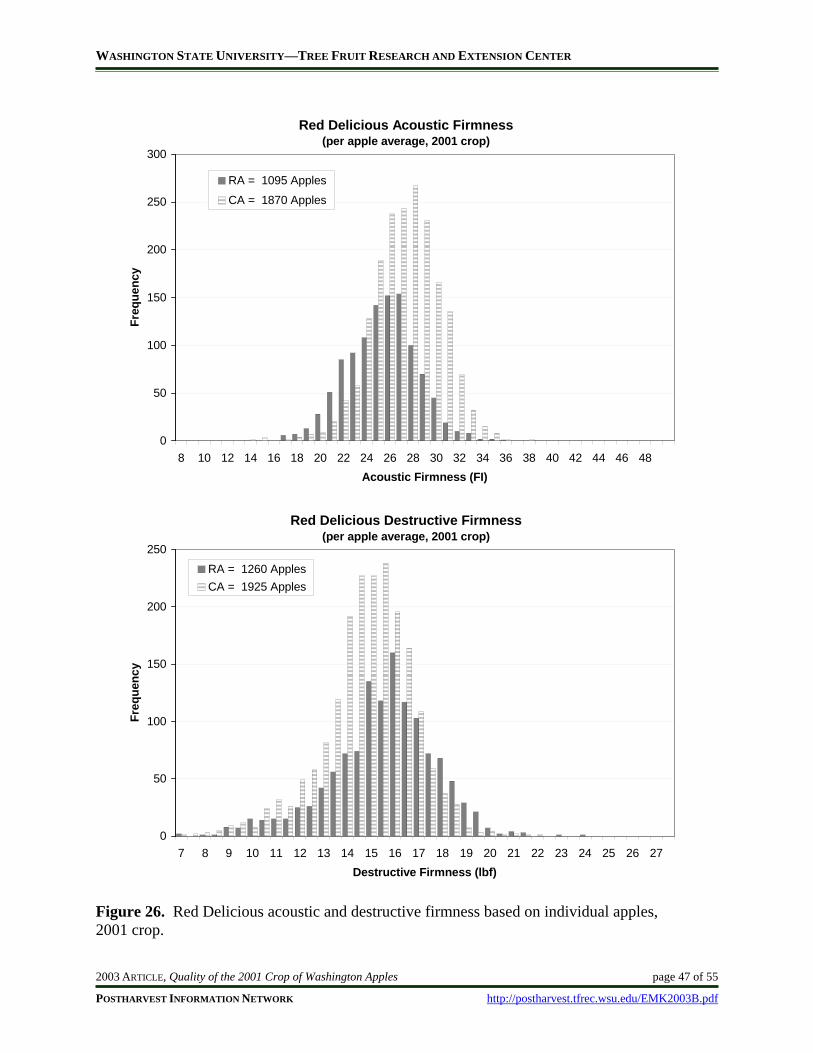
WASHINGTON STATE UNIVERSITY—TREE FRUIT RESEARCH AND EXTENSION CENTER
2003 ARTICLE, Quality of the 2001 Crop of Washington Apples page 47 of 55
POSTHARVEST INFORMATION NETWORK http://postharvest.tfrec.wsu.edu/EMK2003B.pdf
Red Delicious Acoustic Firmness(per apple average, 2001 crop)
0
50
100
150
200
250
300
8 10 12 14 16 18 20 22 24 26 28 30 32 34 36 38 40 42 44 46 48Acoustic Firmness (FI)
Freq
uenc
y
RA = 1095 Apples
CA = 1870 Apples
Red Delicious Destructive Firmness(per apple average, 2001 crop)
0
50
100
150
200
250
7 8 9 10 11 12 13 14 15 16 17 18 19 20 21 22 23 24 25 26 27Destructive Firmness (lbf)
Freq
uenc
y
RA = 1260 ApplesCA = 1925 Apples
Figure 26. Red Delicious acoustic and destructive firmness based on individual apples, 2001 crop.
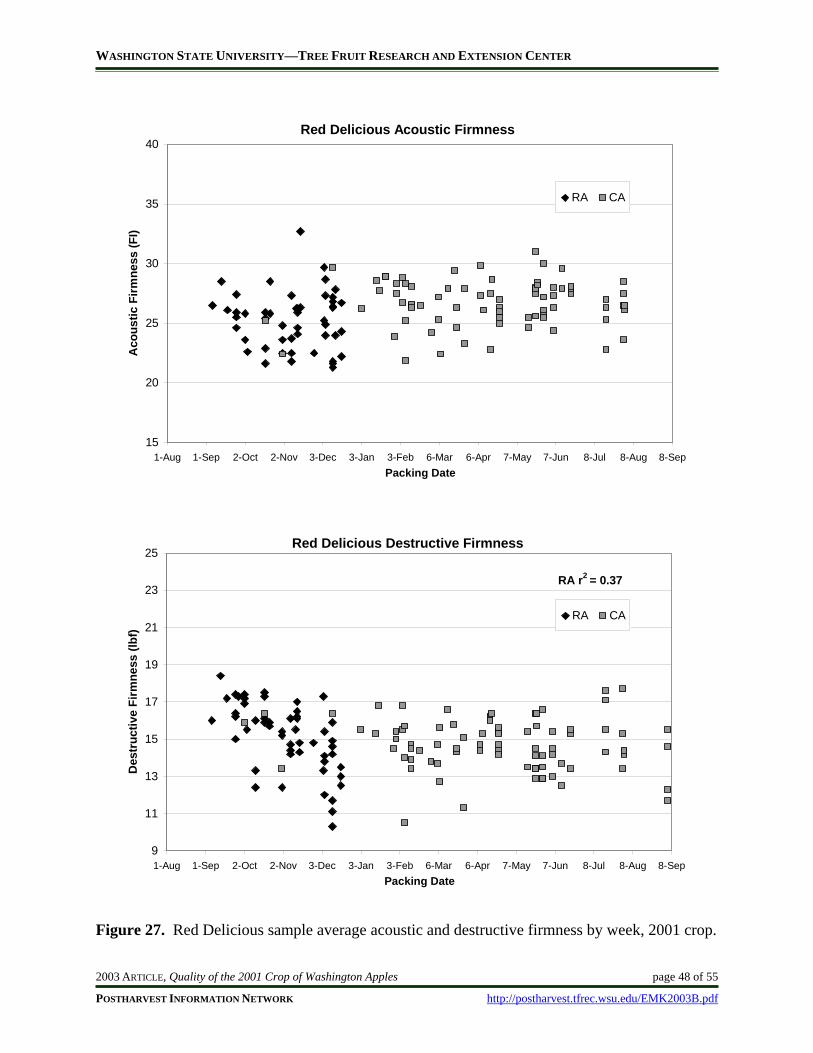
WASHINGTON STATE UNIVERSITY—TREE FRUIT RESEARCH AND EXTENSION CENTER
2003 ARTICLE, Quality of the 2001 Crop of Washington Apples page 48 of 55
POSTHARVEST INFORMATION NETWORK http://postharvest.tfrec.wsu.edu/EMK2003B.pdf
Red Delicious Acoustic Firmness
15
20
25
30
35
40
1-Aug 1-Sep 2-Oct 2-Nov 3-Dec 3-Jan 3-Feb 6-Mar 6-Apr 7-May 7-Jun 8-Jul 8-Aug 8-SepPacking Date
Aco
ustic
Firm
ness
(FI)
RA CA
Red Delicious Destructive Firmness
9
11
13
15
17
19
21
23
25
1-Aug 1-Sep 2-Oct 2-Nov 3-Dec 3-Jan 3-Feb 6-Mar 6-Apr 7-May 7-Jun 8-Jul 8-Aug 8-SepPacking Date
Des
truc
tive
Firm
ness
(lbf
)
RA CA
RA r2 = 0.37
Figure 27. Red Delicious sample average acoustic and destructive firmness by week, 2001 crop.
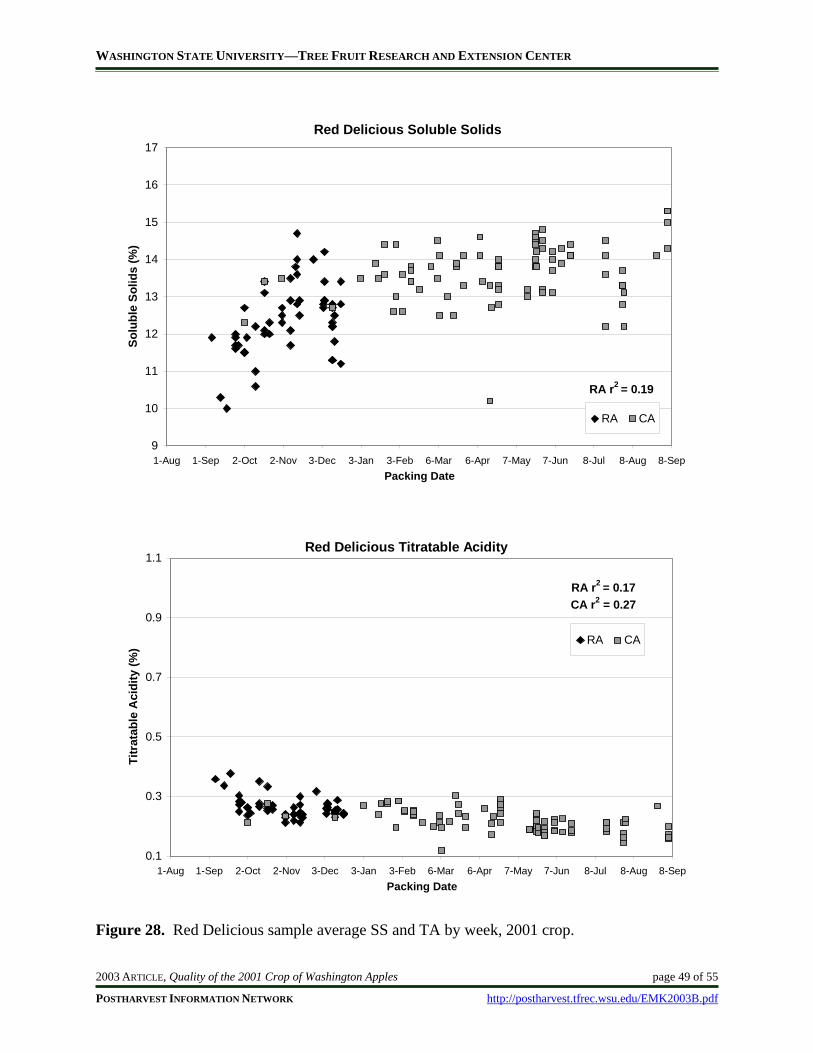
WASHINGTON STATE UNIVERSITY—TREE FRUIT RESEARCH AND EXTENSION CENTER
2003 ARTICLE, Quality of the 2001 Crop of Washington Apples page 49 of 55
POSTHARVEST INFORMATION NETWORK http://postharvest.tfrec.wsu.edu/EMK2003B.pdf
Red Delicious Soluble Solids
9
10
11
12
13
14
15
16
17
1-Aug 1-Sep 2-Oct 2-Nov 3-Dec 3-Jan 3-Feb 6-Mar 6-Apr 7-May 7-Jun 8-Jul 8-Aug 8-SepPacking Date
Solu
ble
Solid
s (%
)
RA CA
RA r2 = 0.19
Red Delicious Titratable Acidity
0.1
0.3
0.5
0.7
0.9
1.1
1-Aug 1-Sep 2-Oct 2-Nov 3-Dec 3-Jan 3-Feb 6-Mar 6-Apr 7-May 7-Jun 8-Jul 8-Aug 8-SepPacking Date
Titr
atab
le A
cidi
ty (%
)
RA CA
RA r2 = 0.17CA r2 = 0.27
Figure 28. Red Delicious sample average SS and TA by week, 2001 crop.
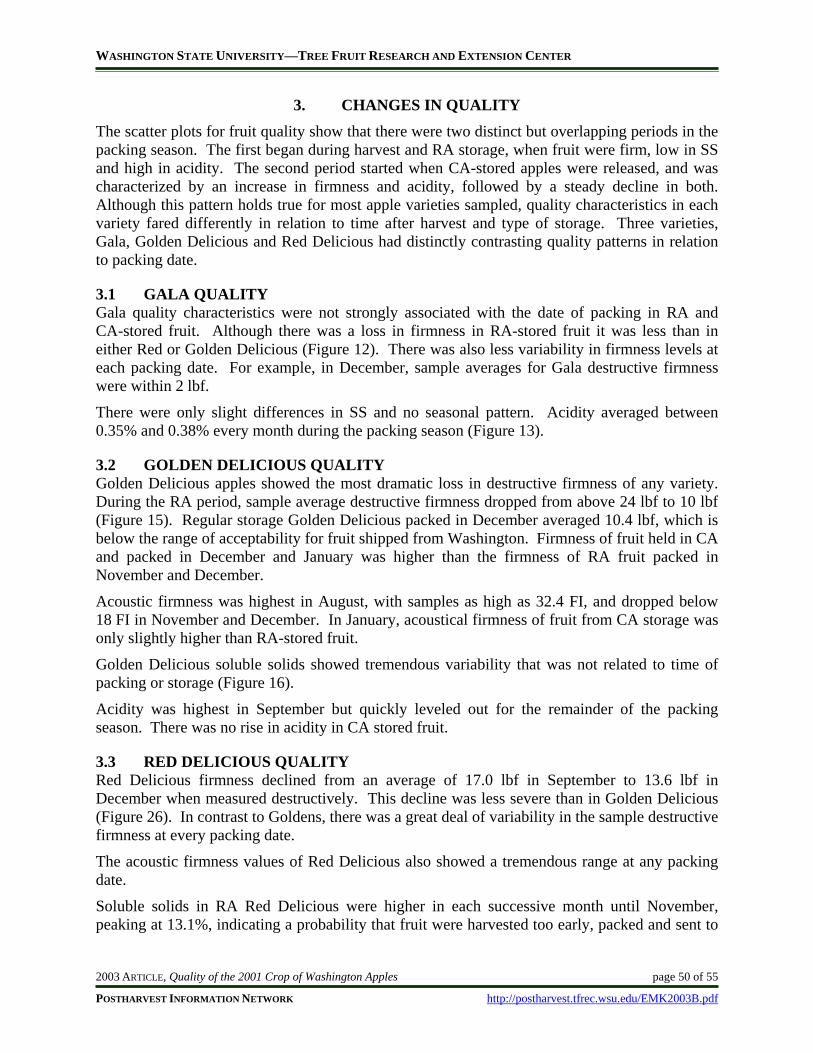
WASHINGTON STATE UNIVERSITY—TREE FRUIT RESEARCH AND EXTENSION CENTER
2003 ARTICLE, Quality of the 2001 Crop of Washington Apples page 50 of 55
POSTHARVEST INFORMATION NETWORK http://postharvest.tfrec.wsu.edu/EMK2003B.pdf
3. CHANGES IN QUALITY The scatter plots for fruit quality show that there were two distinct but overlapping periods in the packing season. The first began during harvest and RA storage, when fruit were firm, low in SS and high in acidity. The second period started when CA-stored apples were released, and was characterized by an increase in firmness and acidity, followed by a steady decline in both. Although this pattern holds true for most apple varieties sampled, quality characteristics in each variety fared differently in relation to time after harvest and type of storage. Three varieties, Gala, Golden Delicious and Red Delicious had distinctly contrasting quality patterns in relation to packing date.
3.1 GALA QUALITY Gala quality characteristics were not strongly associated with the date of packing in RA and CA-stored fruit. Although there was a loss in firmness in RA-stored fruit it was less than in either Red or Golden Delicious (Figure 12). There was also less variability in firmness levels at each packing date. For example, in December, sample averages for Gala destructive firmness were within 2 lbf.
There were only slight differences in SS and no seasonal pattern. Acidity averaged between 0.35% and 0.38% every month during the packing season (Figure 13).
3.2 GOLDEN DELICIOUS QUALITY Golden Delicious apples showed the most dramatic loss in destructive firmness of any variety. During the RA period, sample average destructive firmness dropped from above 24 lbf to 10 lbf (Figure 15). Regular storage Golden Delicious packed in December averaged 10.4 lbf, which is below the range of acceptability for fruit shipped from Washington. Firmness of fruit held in CA and packed in December and January was higher than the firmness of RA fruit packed in November and December.
Acoustic firmness was highest in August, with samples as high as 32.4 FI, and dropped below 18 FI in November and December. In January, acoustical firmness of fruit from CA storage was only slightly higher than RA-stored fruit.
Golden Delicious soluble solids showed tremendous variability that was not related to time of packing or storage (Figure 16).
Acidity was highest in September but quickly leveled out for the remainder of the packing season. There was no rise in acidity in CA stored fruit.
3.3 RED DELICIOUS QUALITY Red Delicious firmness declined from an average of 17.0 lbf in September to 13.6 lbf in December when measured destructively. This decline was less severe than in Golden Delicious (Figure 26). In contrast to Goldens, there was a great deal of variability in the sample destructive firmness at every packing date.
The acoustic firmness values of Red Delicious also showed a tremendous range at any packing date.
Soluble solids in RA Red Delicious were higher in each successive month until November, peaking at 13.1%, indicating a probability that fruit were harvested too early, packed and sent to
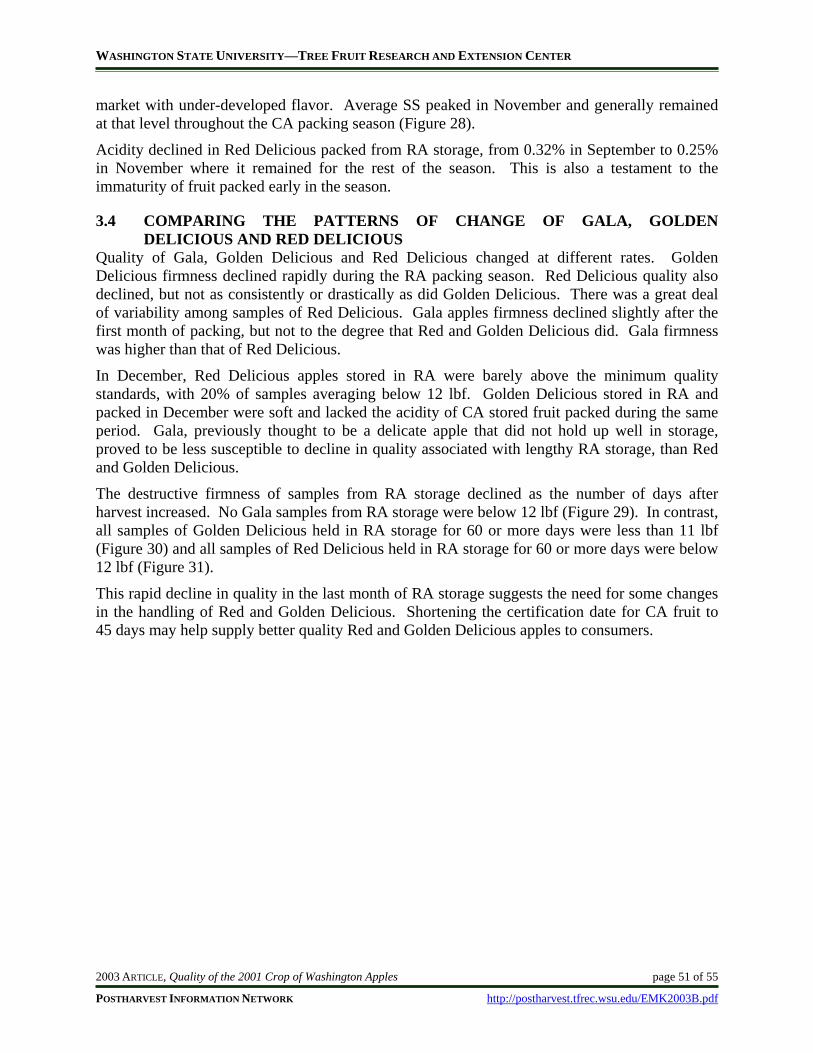
WASHINGTON STATE UNIVERSITY—TREE FRUIT RESEARCH AND EXTENSION CENTER
2003 ARTICLE, Quality of the 2001 Crop of Washington Apples page 51 of 55
POSTHARVEST INFORMATION NETWORK http://postharvest.tfrec.wsu.edu/EMK2003B.pdf
market with under-developed flavor. Average SS peaked in November and generally remained at that level throughout the CA packing season (Figure 28).
Acidity declined in Red Delicious packed from RA storage, from 0.32% in September to 0.25% in November where it remained for the rest of the season. This is also a testament to the immaturity of fruit packed early in the season.
3.4 COMPARING THE PATTERNS OF CHANGE OF GALA, GOLDEN DELICIOUS AND RED DELICIOUS
Quality of Gala, Golden Delicious and Red Delicious changed at different rates. Golden Delicious firmness declined rapidly during the RA packing season. Red Delicious quality also declined, but not as consistently or drastically as did Golden Delicious. There was a great deal of variability among samples of Red Delicious. Gala apples firmness declined slightly after the first month of packing, but not to the degree that Red and Golden Delicious did. Gala firmness was higher than that of Red Delicious.
In December, Red Delicious apples stored in RA were barely above the minimum quality standards, with 20% of samples averaging below 12 lbf. Golden Delicious stored in RA and packed in December were soft and lacked the acidity of CA stored fruit packed during the same period. Gala, previously thought to be a delicate apple that did not hold up well in storage, proved to be less susceptible to decline in quality associated with lengthy RA storage, than Red and Golden Delicious.
The destructive firmness of samples from RA storage declined as the number of days after harvest increased. No Gala samples from RA storage were below 12 lbf (Figure 29). In contrast, all samples of Golden Delicious held in RA storage for 60 or more days were less than 11 lbf (Figure 30) and all samples of Red Delicious held in RA storage for 60 or more days were below 12 lbf (Figure 31).
This rapid decline in quality in the last month of RA storage suggests the need for some changes in the handling of Red and Golden Delicious. Shortening the certification date for CA fruit to 45 days may help supply better quality Red and Golden Delicious apples to consumers.
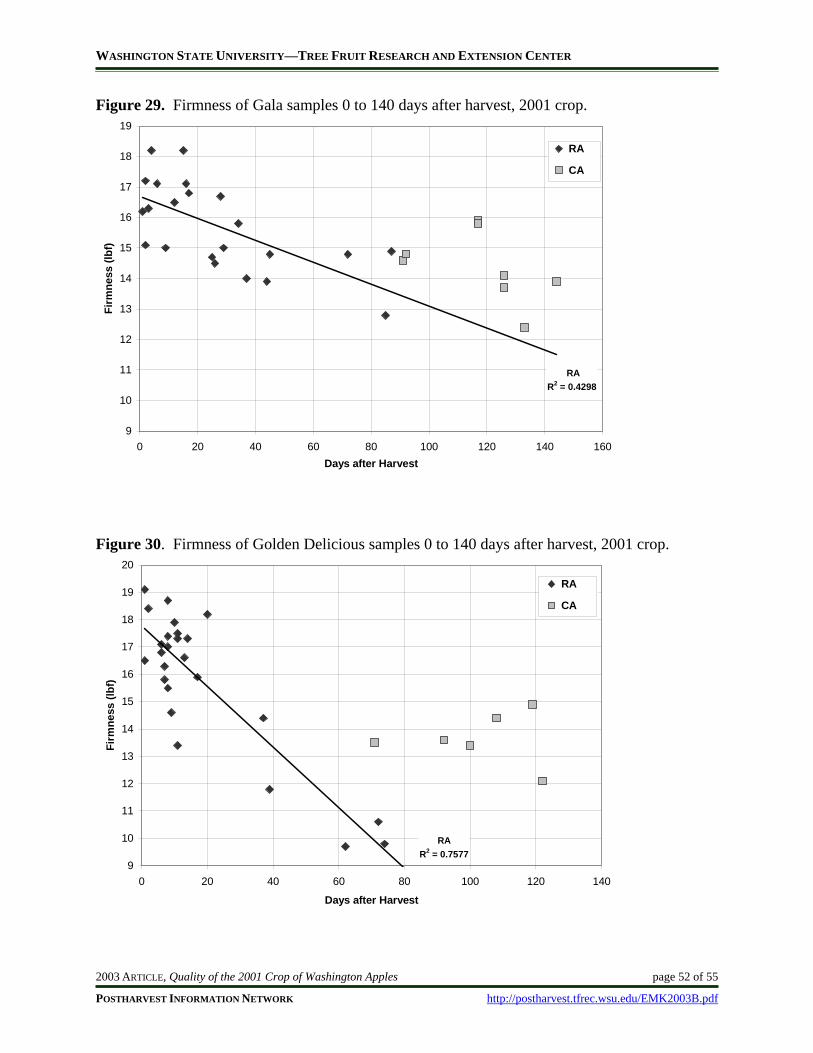
WASHINGTON STATE UNIVERSITY—TREE FRUIT RESEARCH AND EXTENSION CENTER
2003 ARTICLE, Quality of the 2001 Crop of Washington Apples page 52 of 55
POSTHARVEST INFORMATION NETWORK http://postharvest.tfrec.wsu.edu/EMK2003B.pdf
Figure 29. Firmness of Gala samples 0 to 140 days after harvest, 2001 crop.
RA R2 = 0.4298
9
10
11
12
13
14
15
16
17
18
19
0 20 40 60 80 100 120 140 160Days after Harvest
Firm
ness
(lbf
)
RA
CA
Figure 30. Firmness of Golden Delicious samples 0 to 140 days after harvest, 2001 crop.
RAR2 = 0.7577
9
10
11
12
13
14
15
16
17
18
19
20
0 20 40 60 80 100 120 140
Days after Harvest
Firm
ness
(lbf
)
RA
CA

WASHINGTON STATE UNIVERSITY—TREE FRUIT RESEARCH AND EXTENSION CENTER
2003 ARTICLE, Quality of the 2001 Crop of Washington Apples page 53 of 55
POSTHARVEST INFORMATION NETWORK http://postharvest.tfrec.wsu.edu/EMK2003B.pdf
Figure 31. Firmness of Red Delicious samples 0 to 140 days after harvest, 2001 crop.
9
10
11
12
13
14
15
16
17
18
19
0 20 40 60 80 100 120 140
Days after Harvest
Firm
ness
(lbf
)
RA
CA
WASHINGTON STATE UNIVERSITY—TREE FRUIT RESEARCH AND EXTENSION CENTER
2003 ARTICLE, Quality of the 2001 Crop of Washington Apples page 54 of 55
POSTHARVEST INFORMATION NETWORK http://postharvest.tfrec.wsu.edu/EMK2003B.pdf
4. COMPARISON OF 2000 AND 2001 CROPS Sampling of the 2000 crop began in December of 2000, whereas the first samples of the 2001 crop were taken in August of 2001. In the 2000 season RA-stored fruit was largely gone when sampling began. As a result, a year-long comparison of the two seasons is not valid. Comparisons in this section include only apples sampled from December through the end of the season in both years.
In general, apples packed from the 2001 crop were firmer, higher in SS and higher TA than those packed from the 2000 harvest. Not all varieties were significantly different in all quality parameters.
• Braeburn apples were higher in TA in 2001 than in 2000, while firmness and SS were the same both years. Note that there were many more Braeburn apples sampled from the 2001 crop than the previous season.
• Cameo apples were also about the same each year with only the acoustical firmness values higher in 2001.
• Golden Delicious apples sampled from the 2001 crop were firmer (destructively and acoustically) than those from the previous season. Neither SS nor acidity were different.
• Jonagold and Pink Lady® brand apple quality did not differ between years. Again there were many more of these apples sampled in 2001.
• Fuji apples packed from the 2001 crop were clearly superior to those packed in 2000 in all quality characteristics.
• Granny Smith apples from the 2001 crop were firmer and higher in SS but not in acidity than those packed from the 2000 harvest.
• Gala apple quality parameters were consistent each season and similar in 2000 and 2001. The acidity was the only quality parameter that differed between years, with fruit from the 2001 harvest having higher acidity values.
• Red Delicious apples were the same both years except for a slightly higher level of SS in fruit from the 2001 harvest.
WASHINGTON STATE UNIVERSITY—TREE FRUIT RESEARCH AND EXTENSION CENTER
2003 ARTICLE, Quality of the 2001 Crop of Washington Apples page 55 of 55
POSTHARVEST INFORMATION NETWORK http://postharvest.tfrec.wsu.edu/EMK2003B.pdf
5. CONCLUSIONS 1. Fruit quality varied from year to year. Quality of most varieties was higher in 2001 than
in 2000.
2. Quality varied by storage regime. Fruit packed immediately after harvest was the firmest and highest in acidity. As the packing season progressed, fruit sampled from RA storage declined in firmness and acidity. When CA fruit was packed firmness increased then leveled off.
3. Golden Delicious apples lost firmness rapidly in RA storage. CA stored fruit were firmer. Thus it would be helpful to have more fruit placed in CA by reducing the time to certification to 45 days. There was a great deal of variability in SS levels throughout the season. This variety may benefit from a SS standard.
4. Red Delicious apples were highly variable in firmness throughout the year. It was possible to obtain firm apples or very soft apples throughout the year. The firmness standard should be raised or the minimum length of time in CA should be shortened from 60 to 45 days to reduce variability in sample to sample quality.
5. Gala apples were of consistent firmness, SS and acidity throughout the sampling season.
6. Braeburn, Granny Smith and Fuji apples lost firmness throughout the season but the levels remained high. Granny Smith apple lost a tremendous amount of acidity throughout the season, but levels remained high until the middle of the summer.
7. Fuji apples lost over half their acidity throughout the season, which may lead a reduction in consumer satisfaction.
8. Jonagold apples were of variable firmness throughout the season and by the end of the RA season and during the CA season they were very soft.
9. Measurement of firmness by the destructive method and acoustic method do not give comparable results, although they are correlated with one another.
10. Temperature management continues to need improvement as both internal and external temperatures are too high to conserve quality, especially when boxes do not have vent spaces and are palletized prior to cooling.