Embed Size (px)
Citation preview
Available online at www.sciencedirect.com
www.elsevier.com/locate/specom
Speech Communication 52 (2010) 481–492
Quality of talking heads in different interaction and media contexts
Benjamin Weiss a,*, Christine Kuhnel a, Ina Wechsung a, Sascha Fagel b, Sebastian Moller a
a Quality and Usability Lab, Deutsche Telekom Labs, TU Berlin, Ernst-Reuter-Platz 7, D-10587 Berlin, Germanyb Institut fur Sprache und Kommunikation, TU Berlin, Ernst-Reuter-Platz 7, D-10587 Berlin, Germany
Received 30 March 2009; received in revised form 3 January 2010; accepted 15 February 2010
Abstract
We investigate the impact of three different factors on the quality of talking heads as metaphors of a spoken dialogue system in thesmart home domain. The main focus lies on the effect of voice and head characteristics on audio and video quality, as well as overallquality. Furthermore, the influence of interactivity and of media context on user perception is analysed. For this purpose two subsequentexperiments were conducted: the first was designed as a non-interactive rating test of videos of talking heads, while the second experimentwas interactive. Here, the participants had to solve a number of tasks in dialogue with a talking head. To assess the impact of the mediacontext, redundant information was provided via an additional visual output channel to half of the participants. As a secondary effect,the importance of participants’ gender is examined. It is shown that perceived quality differences observed in the non-interactive settingare blurred when the interactivity and media contexts provide distraction from the talking head. Furthermore, a simple additional feed-back screen improves the perceived quality of the talking heads. Gender effects are negligible concerning the ratings in interaction, butfemale and male participants exhibit different behaviour in the experiment. This advocates for more realistic evaluation settings in orderto increase the external validity of the obtained quality judgements.� 2010 Elsevier B.V. All rights reserved.
Keywords: Embodied conversational agent; Smart home; Talking head; Usability; WOZ
1. Introduction
A growing research community is working on embodiedconversational agents (ECAs). Human–human dialoguesare studied and insights concerning, for example, emotions(Kramer, 2008) and gestures (Kipp, 2004) are transferredto the human–computer interaction (HCI). Evaluation ofECAs in HCI addresses e.g. the impact of human-likeexpressions on system efficiency (Ruttkay and Pelachaud,2004) or on the intelligibility of the audio-visual speech(Massaro et al., 2000). With the LIPS-Challenge a unifiedapproach was started in 2008 to annually evaluate differentsynthesis systems and techniques with the same training
0167-6393/$ - see front matter � 2010 Elsevier B.V. All rights reserved.
doi:10.1016/j.specom.2010.02.011
* Corresponding author. Tel.: +49 30 8353 58526.E-mail addresses: [email protected] (B. Weiss), Christine.Kueh
[email protected] (C. Kuhnel), [email protected] (I. Wechsung),[email protected] (S. Fagel), [email protected](S. Moller).
data, subjects, test material and metrics, including intelligi-bility and naturalness of the produced sentences (cf. Theo-bald et al., 2008, for the specification).
It is assumed that the supposed similarity to humanface-to-face communication (Kramer and Bente, 2002)eliminates the need of learning special strategies for HCI(Xiao et al., 2002). It is argued that one of the main advan-tages of ECAs is a facilitated interaction compared to typ-ical user interfaces by intuitively using (subconscious)social cues (Cassell et al., 2000). Such cues can be both ver-bal and non-verbal such as signalling disagreement withgestures.
Users might be more motivated to interact with an ECAthan a traditional uni-modal interface (Takeuchi andNaito, 1995). In Pandzic et al. (1999) participants ratedthe waiting time of a theatre information system more sat-isfying with a talking head than with speech only or text.Apparently, they were more distracted and thus acceptedthe comparable waiting time more easily. More positive
482 B. Weiss et al. / Speech Communication 52 (2010) 481–492
ratings of dialogue systems that include ECAs areexplained with the so called ‘persona effect’: the positiveeffect on user’s interaction induced by a life-like interfaceagent (Dehn and Van Mulken, 2000; Lester et al., 1997;Van Mulken et al., 1998). Consequently, studies are con-ducted to examine the persona effect on measures of effi-ciency and effectiveness: log-data in the case of thedialogue itself or for example knowledge acquisition testresults as a correlate for effectiveness in tutoring systemsfor teaching. However, results are ambiguous (cf. Yeeet al., 2007), as sometimes positive effects are observed(e.g. Gong and Nass, 2007; Cowell and Stanney, 2005),and sometimes no effects are found (e.g. Prendingeret al., 2004; Xiao, 2006).
Due to differences in test design, results of evaluationstudies are difficult to compare and interpret. For instance,ECA features which are varied in a test include appearanceand gender (Buisine et al., 2004; Zimmerman et al., 2005),but also the level of anthropomorphism (cf. Gong, 2008;King and Ohya, 1996; Nowak, 2004), or the usage ofnon-verbal gestures (Buisine et al., 2004). Using either text(e.g. Sproull et al., 1996) or speech (e.g. Berry et al., 2001)as a reference (anchor) condition is another importantmethodological difference, that complicates comparability.In particular, the persona effect is highly dependent on taskdomain: Zimmerman et al. (2005) could confirm a positiveeffect of human-like ECAs on perceived usability for afinancial task domain, but not for entertainment or tutor-ing. In the studies of Xiao et al. (2002) and Andre et al.(1998) no persona effect was observed, but the ratingsassessed were dependent on type of task – e.g. three differ-ent avatars were rated more positively after a text-editortutorial than after the task of selecting items for travellingin Xiao et al. (2002).
Not in all studies – especially not in tutoring application– did test participants actually interact with the ECA (e.g.Breitfuss et al., 2008; Buisine et al., 2004; McBreen andJack, 2000; Nowak and Rauh, 2005). This is a relevant dis-tinction, as for example the more human-like ECA is ratedmore intelligent in a non-interactive condition, but notafter an interaction (Koda and Maes, 1996).
To sum up, the persona effect has been observed in sev-eral conditions. However, results differ for the context fac-tors mentioned above and may therefore not be generalizedover different ECAs, tasks or domains. Additionally, theeffect is more obvious in subjective ratings than in interac-tion parameters. In a comparison of three different facialmodels, a standard cartoon-like head speaking one wel-come message was rated significantly more appealing thana synthesis based on real video samples (Pandzic et al.,1999). The standard face but with additional texture wasrated worst. Apart from this interesting ranking of thevarying degrees of naturalness in timing and appearance(the sample-based head displayed the most natural facebut least natural movement) the ratings were remarkablylow in general. A similar selection of facial models is usedin our experiments.
As a complement to these studies, our work focuses onfactors influencing perceived quality in the smart homedomain. This is analysed based on data obtained in twosubsequent experiments: a non-interactive rating experi-ment and an interactive task-solving experiment.
One of the main questions is the impact of talking headcomponents (TTS, animated head) on the talking headquality: How do participants perceive talking heads? What
is the influence of the TTS and head component? The impactof interactivity is another focus: Are characteristics of talk-
ing heads still perceived as different when entering a real dia-
logue? Changes in perception and judgement due to anadditional output channel are analysed as well: Does addi-
tional information offered on a screen impede the evaluationof talking heads? Does it enhance the interaction quality? Are
participants able to distinguish between talking head, system,
and interaction quality?
The application is a smart home environment, whereseveral devices, for example a TV and an answeringmachine can be controlled via spoken input. The ECA –in our case a talking head – acts as the interface and thusas the metaphor of the system. We chose male ECAs asappropriate for this purpose, as a male voice was ratedmore competent than a female voice for a technical domainin Nass et al. (1997).
Participants prefer ECAs with an obvious gender overandrogynous ones, and they prefer ECAs of their own gen-der (Nowak and Rauh, 2005; McBreen and Jack, 2000),only for women). Therefore, dependence of ratings on par-ticipants’ gender is analysed as well.
The remainder of this article is structured as follows. InSection 2, the methodology of both experiments isdescribed and the talking heads and their components arecharacterized. In Section 3 set-up, procedure, and resultsof the first experiment are explained. The second experi-ment is presented in Section 4, including analysis ofassessed ratings and extracted log-data. The results coverthe impact of degree of interactivity and media contexton the ratings of the different metaphors. Gender effectsare presented in Section 5. The results are discussed in Sec-tion 6, and conclusions are drawn in Section 7.
2. Methodology
The goal of these two experiments is to assess the impactof different text-to-speech and text-to-visual-speech com-ponents on the perceived quality of both the talking headsas metaphors of a dialogue system and the system itself. Itis of special interest how context factors like the degree ofinteractivity and amount of available media feedback inter-act with the perception of quality.
In a first watching-and-listening-only experiment (E1)six different talking heads, combinations of three headcomponents and two German speech synthesis systems,were compared using a 3 � 2 within-subject design. Theaim of this experiment was to evaluate the influence ofthe two components (head and voice) on the speech, video
B. Weiss et al. / Speech Communication 52 (2010) 481–492 483
and overall quality ratings of the talking heads in a non-interactive setting. The second Wizard-of-Oz experiment(E2) compared the four best-rated head-voice combina-tions in an interactive setting, addressing the validity ofthe quality scores obtained in E1 for future system usage.
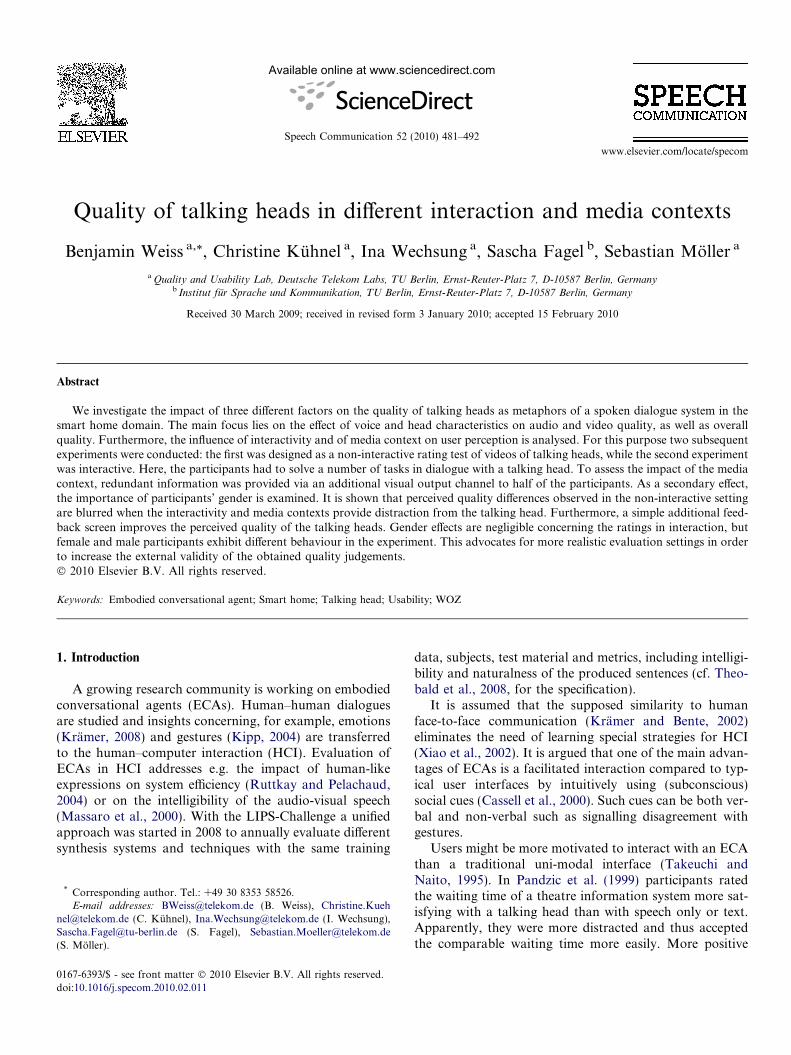
The first head (TH) originates from the Thinking HeadProject (Burnham et al., 2008). This head is based on a3D model of a human being, in this case the Australianartist STELARC. In addition to having a human-like tex-ture build from pictures of STELARC, it exhibits randomhead movements and extra-linguistic facial expressionslike smiling and winking. As the control of the visualarticulation was built for English and does not define sep-arate phonetic articulators (like lip-spreading or jaw open-ing), but target visemes, a German synthesis was made byhand using the most appropriate English visemes andapplying basic co-articulation rules from Massy (seebelow). The original English visemes were created frommotion-capture data. The two following head componentsdo not exhibit facial expressions or movements apart fromvisual articulation. The second head was developed at TUBerlin: Massy (MS), the Modular Audiovisual SpeechSYnthesizer is a parametric 3D head model and providesaccurate audio-visual speech synchronization and includesarticulators like the velum and tongue body which arenot always visible. MS also accounts for co-articulationwith rules based on empiric data of German (Fagel andClemens, 2004). The third head is a 2D German Text-To-Audiovisual-Speech synthesis system based on speakercloning (CL) using motion capture. The co-articulationbehaviour was extracted from the videos. CL was devel-oped by a cooperation between TU Berlin and GIPSA-lab Grenoble (Fagel et al., 2007). Pictures of the threehead components are displayed in Fig. 1. Because of thelow quality scores obtained in the first experiment, Clonewas not used in E2.
The speech synthesis systems producing the respectivevoices include the Modular Architecture for Research onspeech sYnthesis (Mary) (Schroder and Trouvain, 2003)and the Mbrola system (Mbrola) (Dutoit et al., 1996). Amale German voice was selected for both systems, namely‘hmm-bits3’ for Mary and ‘de2’ for Mbrola. Both wereconsidered best from a selection of the two TTS-systemsin an earlier informal listening test.
Fig. 1. Three head components from left to right: Thinking Head, Clone,and Massy.
3. Experiment E1
3.1. E1 – Procedure
In the first experiment (E1), videos of the talking headsspeaking short, meaningful sentences (approx. 2 s) relatedto a smart-home domain were presented to 14 participants(aged 20–32, M ¼ 27, SD ¼ 4:21, gender balanced, paid forattendance). Thus, the quality of the agent metaphor – i.e.voice and head decoupled of the system (Erickson, 1997) –could be analysed. This approach allows the assessment ofthe metaphor quality in a strictly controlled setting, andwithout any interfering interaction.
60 videos were pre-recorded presenting the talking headsuttering 10 sentences for all 2 � 3 voice-head combina-tions. The sentences are of variable phrase length, and con-tain both questions and statements. One example is:
‘The following devices can be turned on or off: the TV, thelamps and the fan.’
The participants first received a short introduction andwere asked four questions concerning their experience withtalking heads and spoken dialogue systems in general.
The body of experiment E1 was divided into two parts,one per-sentence part and one per-set part. The per-sen-tence part consisted of single stimuli presented in random-ized order. After every stimulus the participants were askedto answer four questions (per-sentence-questionnaire). Onequestion concerning the content of the sentence – includedonly to focus their attention not exclusively on the appear-ance but on understanding as well – was excluded from fur-ther analysis. With the remaining three questions theparticipants were asked to rate the SPEECH QUALITY SQ(‘How do you rate the speech quality?’), VISUAL QUALITY
VQ (‘How do you rate the visual quality of the head?’) andOVERALL QUALITY OQ of the talking head (‘How do you
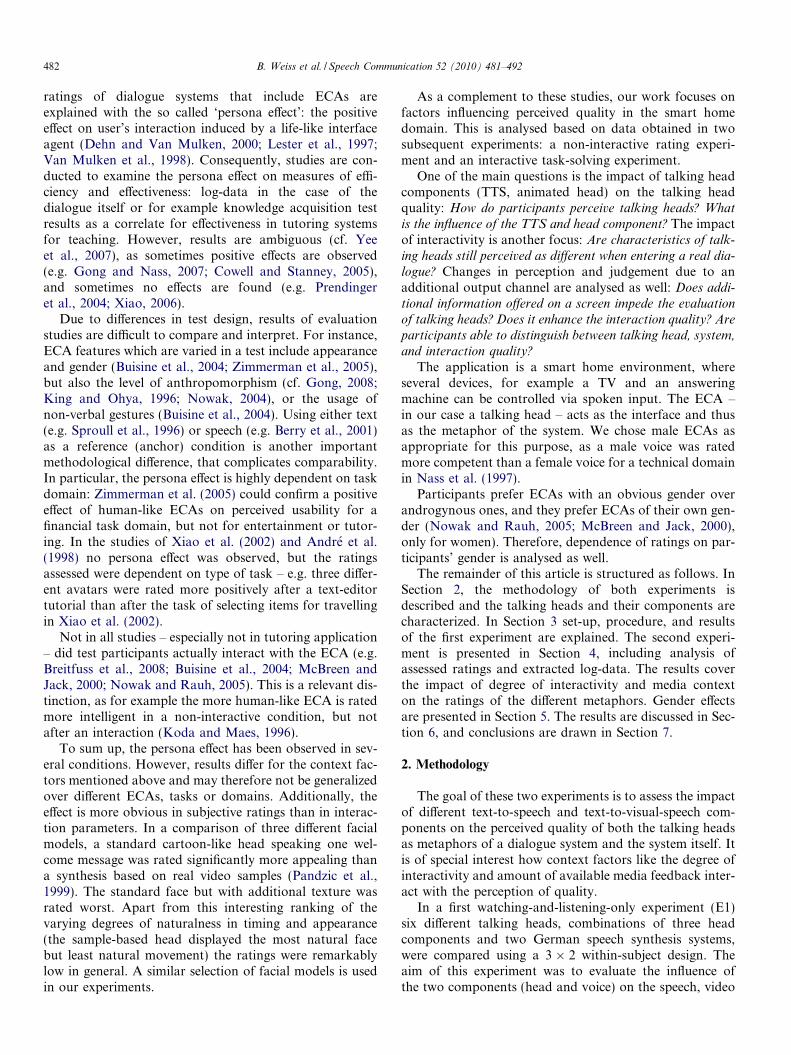
rate the overall quality?’) for each stimulus (cf. Fig. 2). Inthe per-set part a set of six stimuli was presented for everyvoice-head combination followed by a questionnaire (per-set-questionnaire). The order of the six sets was random-ized for each participant. This questionnaire assessed theparticipants’ detailed impression of the talking head(‘Please use the following antonym pairs to rate your impres-
sion of the animated head.’) using 25 semantic-differentialitems (cf. Fig. 3). Every item was rated on a five-point scalewith the poles described by antonyms. These items derivefrom a questionnaire currently being developed at our labbased on (Adcock and Van Eck, 2005). For the analysis,the ratings of the quality scales are transformed to �2 (verybad) to 2 (very good). The same is done for the results of
How do you rate the overall quality?
very good good undecided bad very bad
Fig. 2. Example of one question to collect quality ratings.
pleasant unpleasant
reserved enthusiastic
Fig. 3. Example of one item of the semantic differential.
484 B. Weiss et al. / Speech Communication 52 (2010) 481–492
the semantic differential. For those antonyms not intrinsi-cally positive or negative, the more human-like anddynamic (e.g. enthusiastic) are chosen as positive ends ofthe sub-scales.
3.2. E1 – Results for the different head and voice components
The non-interactive experiment E1 yielded three majorresults: OVERALL QUALITY of the metaphors can bedescribed as a linear combination of the VISUAL QUALITY
related to the appearance of the talking head and theSPEECH QUALITY related to the synthesis system (data aver-aged over all 10 sentences for each participant, Pearson’sr ¼ :83;Ep ¼ :49; p < :001).
OQ ¼ :47þ :51 � SQþ :33 � VQ
Furthermore, in E1 the participants were able to distinctlydiscern between these two aspects, insofar as VISUAL
QUALITY is only dependent on the head component andSPEECH QUALITY much more on the speech than the headcomponent. No interaction effects between these two fac-tors could be found. Finally, the participants prefer themetaphor which receives the best head and voice ratings– the more human-like talking head (TH), and the morenatural speech synthesis (Mary). The two parts of theexperiment – single sentences randomized and a set of sen-tences for each metaphor – are consistent in their results.Considering all data, there is a clear ranking for the six dif-ferent combinations, i.e. TH better than MA better thanCL, with Mary rated higher than Mbrola for each headcomponent. For more information and detailed statistics,please confer to (Kuhnel et al., 2008).
Analysing the semantic differential revealed three factors(naturalness, friendliness, attractiveness), which all differedsystematically for the six metaphors (cf. Weiss et al.,2009). The more friendly, natural and attractive a meta-phor was rated, the higher the OVERALL QUALITY was.
TH is considered as friendly as MS, but more natural andmore attractive. It is interesting to see that friendliness doesnot correspond to human-like texture, or natural extra-lin-guistic movements. We can only speculate that friendlinessmight depend on other features representing a different per-sonality (such as head shape or more constant slight smil-ing) rather than on the degree of artificiality.
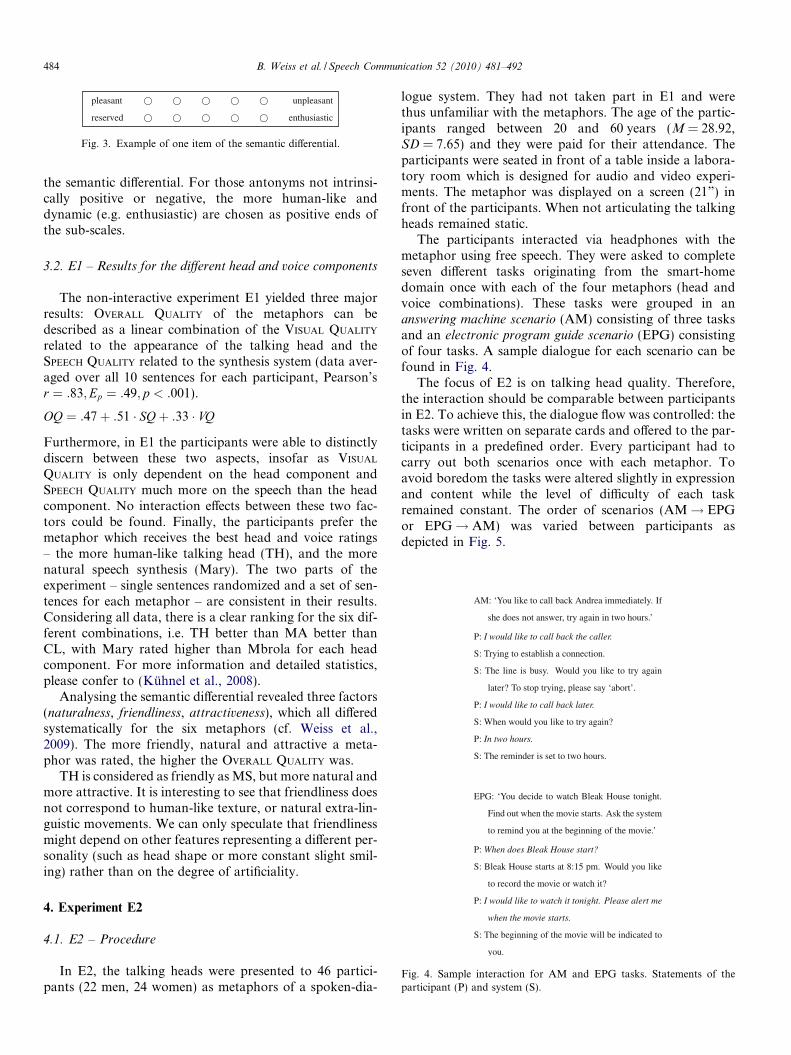
Fig. 4. Sample interaction for AM and EPG tasks. Statements of theparticipant (P) and system (S).
4. Experiment E2
4.1. E2 – Procedure
In E2, the talking heads were presented to 46 partici-pants (22 men, 24 women) as metaphors of a spoken-dia-
logue system. They had not taken part in E1 and werethus unfamiliar with the metaphors. The age of the partic-ipants ranged between 20 and 60 years (M = 28.92,SD = 7.65) and they were paid for their attendance. Theparticipants were seated in front of a table inside a labora-tory room which is designed for audio and video experi-ments. The metaphor was displayed on a screen (21”) infront of the participants. When not articulating the talkingheads remained static.
The participants interacted via headphones with themetaphor using free speech. They were asked to completeseven different tasks originating from the smart-homedomain once with each of the four metaphors (head andvoice combinations). These tasks were grouped in ananswering machine scenario (AM) consisting of three tasksand an electronic program guide scenario (EPG) consistingof four tasks. A sample dialogue for each scenario can befound in Fig. 4.
The focus of E2 is on talking head quality. Therefore,the interaction should be comparable between participantsin E2. To achieve this, the dialogue flow was controlled: thetasks were written on separate cards and offered to the par-ticipants in a predefined order. Every participant had tocarry out both scenarios once with each metaphor. Toavoid boredom the tasks were altered slightly in expressionand content while the level of difficulty of each taskremained constant. The order of scenarios (AM! EPGor EPG! AM) was varied between participants asdepicted in Fig. 5.
B. Weiss et al. / Speech Communication 52 (2010) 481–492 485
4.1.1. Degree of interactivity
Log-data was recorded in terms of system output andtime stamps. The system output consisted of pre-recordedfilms of the talking heads, played by the wizard once hereceived input from the participants. Because of the con-trolled interaction, the possible prompts and their orderas played by the wizard are of limited variety. Thus, systemoutput and order of system output is basically the same foreach participant. To monitor the success in controlling thedialogue flow parameters are extracted from the log-dataand analysed. These parameters are
� dialogue duration (dd): beginning of interaction (wel-come message of head component) to end of interactionof each set,� number of system turns (#turns): number of videos
played per set,� number of help- (#help), ‘no input’- (#noInput) and ‘no
match’-messages (#noMatch): number of additional vid-eos played per set,� number of times the participant departed from the pre-
defined task order (#back).
and will be explained in the following.If the participants deviated from the required dialogue
flow by changing the order of tasks, this was logged as aparameter (#back). If the participant skipped a task, thewizard had a few standard videos to bring him back ontrack. This also was logged (#help). If the participant said
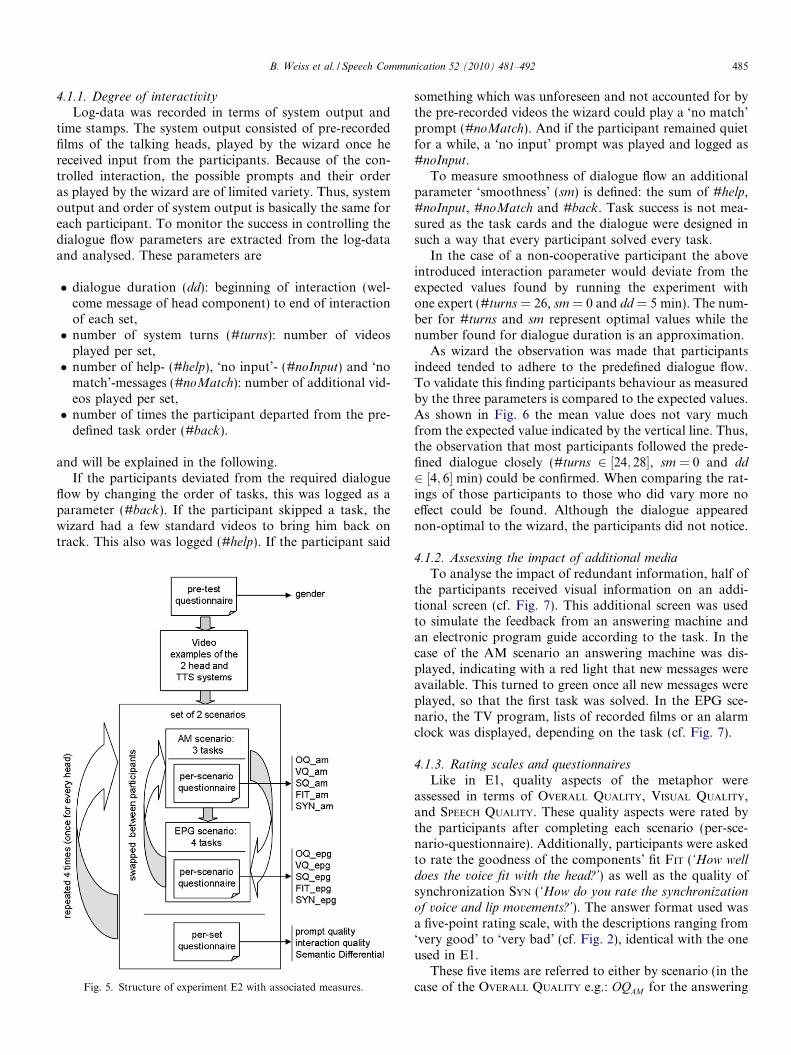
Fig. 5. Structure of experiment E2 with associated measures.
something which was unforeseen and not accounted for bythe pre-recorded videos the wizard could play a ‘no match’prompt (#noMatch). And if the participant remained quietfor a while, a ‘no input’ prompt was played and logged as#noInput.
To measure smoothness of dialogue flow an additionalparameter ‘smoothness’ (sm) is defined: the sum of #help,#noInput, #noMatch and #back. Task success is not mea-sured as the task cards and the dialogue were designed insuch a way that every participant solved every task.
In the case of a non-cooperative participant the aboveintroduced interaction parameter would deviate from theexpected values found by running the experiment withone expert (#turns = 26, sm = 0 and dd = 5 min). The num-ber for #turns and sm represent optimal values while thenumber found for dialogue duration is an approximation.
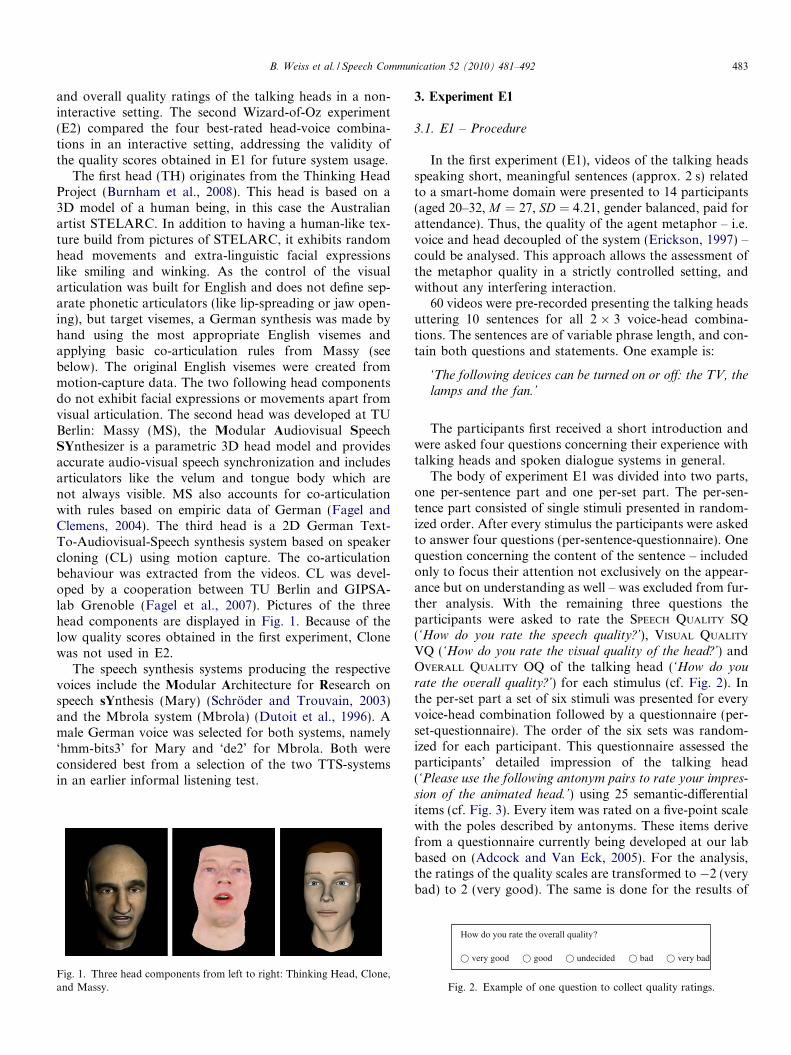
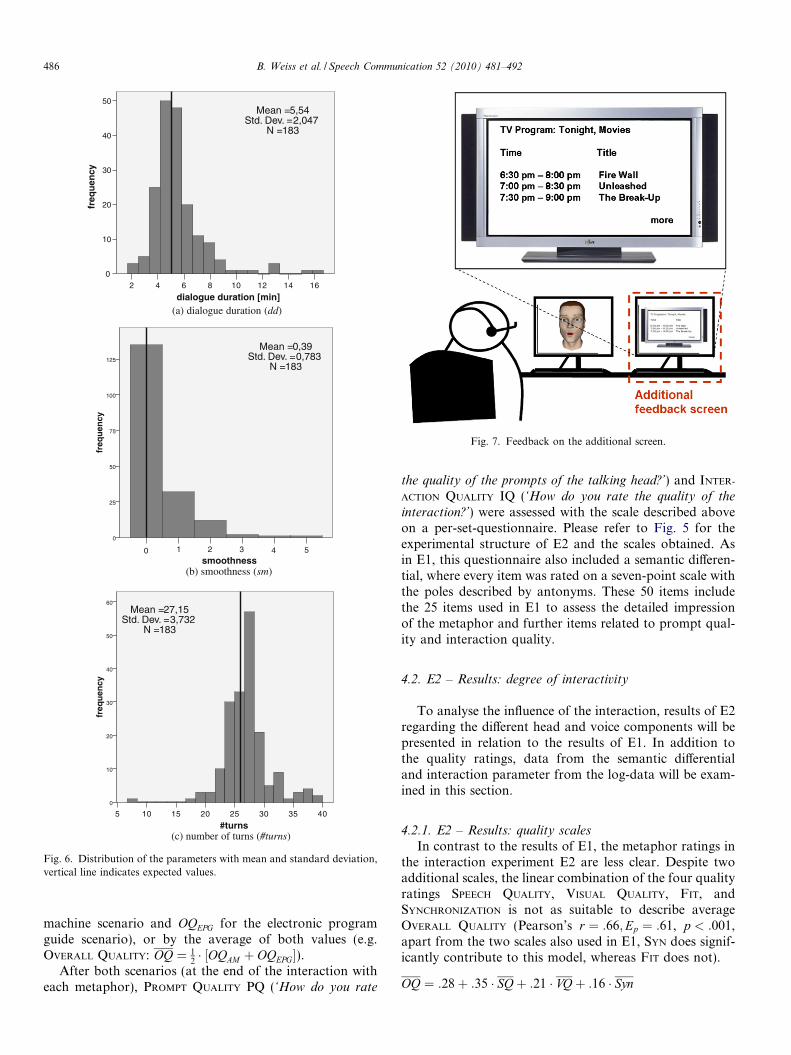
As wizard the observation was made that participantsindeed tended to adhere to the predefined dialogue flow.To validate this finding participants behaviour as measuredby the three parameters is compared to the expected values.As shown in Fig. 6 the mean value does not vary muchfrom the expected value indicated by the vertical line. Thus,the observation that most participants followed the prede-fined dialogue closely (#turns 2 ½24; 28�, sm = 0 and dd
2 ½4; 6� min) could be confirmed. When comparing the rat-ings of those participants to those who did vary more noeffect could be found. Although the dialogue appearednon-optimal to the wizard, the participants did not notice.
4.1.2. Assessing the impact of additional media
To analyse the impact of redundant information, half ofthe participants received visual information on an addi-tional screen (cf. Fig. 7). This additional screen was usedto simulate the feedback from an answering machine andan electronic program guide according to the task. In thecase of the AM scenario an answering machine was dis-played, indicating with a red light that new messages wereavailable. This turned to green once all new messages wereplayed, so that the first task was solved. In the EPG sce-nario, the TV program, lists of recorded films or an alarmclock was displayed, depending on the task (cf. Fig. 7).
4.1.3. Rating scales and questionnaires
Like in E1, quality aspects of the metaphor wereassessed in terms of OVERALL QUALITY, VISUAL QUALITY,and SPEECH QUALITY. These quality aspects were rated bythe participants after completing each scenario (per-sce-nario-questionnaire). Additionally, participants were askedto rate the goodness of the components’ fit FIT (‘How well
does the voice fit with the head?’) as well as the quality ofsynchronization SYN (‘How do you rate the synchronization
of voice and lip movements?’). The answer format used wasa five-point rating scale, with the descriptions ranging from‘very good’ to ‘very bad’ (cf. Fig. 2), identical with the oneused in E1.
These five items are referred to either by scenario (in thecase of the OVERALL QUALITY e.g.: OQAM for the answering
dialogue duration [min]2 4 6 8 01 21 41 61
freq
uen
cy50
40
30
20
10
0
Mean =5,54Std. Dev. =2,047
N =183
(a) dialogue duration (dd)
smoothness543210
freq
uen
cy
125
100
75
50
25
0
Mean =0,39Std. Dev. =0,783
N =183
(b) smoothness (sm)
#turns5 01 51 02 52 03 53 04
freq
uen
cy
60
50
40
30
20
10
0
Mean =27,15Std. Dev. =3,732
N =183
(c) number of turns (#turns)
Fig. 6. Distribution of the parameters with mean and standard deviation,vertical line indicates expected values.
Fig. 7. Feedback on the additional screen.
486 B. Weiss et al. / Speech Communication 52 (2010) 481–492
machine scenario and OQEPG for the electronic programguide scenario), or by the average of both values (e.g.OVERALL QUALITY: OQ ¼ 1
2� ½OQAM þ OQEPG�).
After both scenarios (at the end of the interaction witheach metaphor), PROMPT QUALITY PQ (‘How do you rate
the quality of the prompts of the talking head?’) and INTER-
ACTION QUALITY IQ (‘How do you rate the quality of the
interaction?’) were assessed with the scale described aboveon a per-set-questionnaire. Please refer to Fig. 5 for theexperimental structure of E2 and the scales obtained. Asin E1, this questionnaire also included a semantic differen-tial, where every item was rated on a seven-point scale withthe poles described by antonyms. These 50 items includethe 25 items used in E1 to assess the detailed impressionof the metaphor and further items related to prompt qual-ity and interaction quality.
4.2. E2 – Results: degree of interactivity
To analyse the influence of the interaction, results of E2regarding the different head and voice components will bepresented in relation to the results of E1. In addition tothe quality ratings, data from the semantic differentialand interaction parameter from the log-data will be exam-ined in this section.
4.2.1. E2 – Results: quality scales
In contrast to the results of E1, the metaphor ratings inthe interaction experiment E2 are less clear. Despite twoadditional scales, the linear combination of the four qualityratings SPEECH QUALITY, VISUAL QUALITY, FIT, andSYNCHRONIZATION is not as suitable to describe averageOVERALL QUALITY (Pearson’s r ¼ :66;Ep ¼ :61, p < :001,apart from the two scales also used in E1, SYN does signif-icantly contribute to this model, whereas FIT does not).
OQ ¼ :28þ :35 � SQþ :21 � VQþ :16 � Syn
factor 3
Rating
Que
stio
nnai
re It
em
26
28
29
33
34
37
44
MS−MbrolaMS−MaryTH−MbrolaTH−Mary
−3 −2 −1 0 1 2 3 −3 −2 −1 0 1 2 3
factor 6
Rating
Que
stio
nnai
re It
em
25
31
32
41
45
70
MS−MbrolaMS−MaryTH−MbrolaTH−Mary
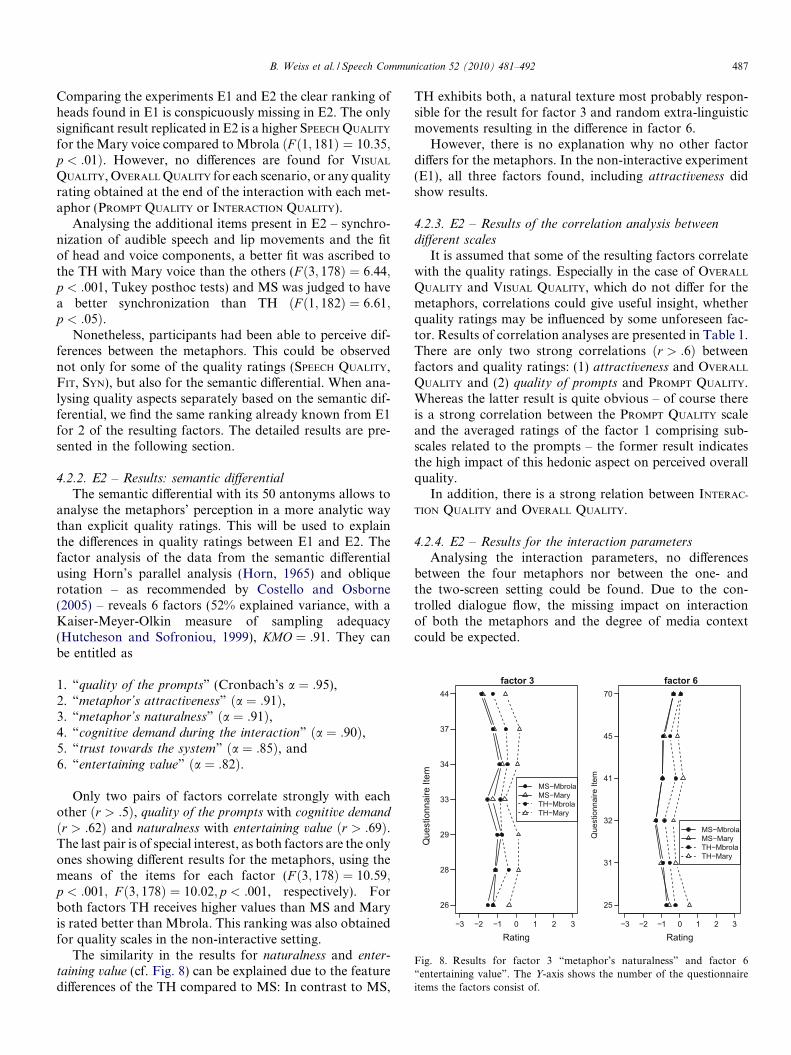
Fig. 8. Results for factor 3 “metaphor’s naturalness” and factor 6“entertaining value”. The Y-axis shows the number of the questionnaireitems the factors consist of.
B. Weiss et al. / Speech Communication 52 (2010) 481–492 487
Comparing the experiments E1 and E2 the clear ranking ofheads found in E1 is conspicuously missing in E2. The onlysignificant result replicated in E2 is a higher SPEECH QUALITY
for the Mary voice compared to Mbrola ðF ð1; 181Þ ¼ 10:35;p < :01Þ. However, no differences are found for VISUAL
QUALITY, OVERALL QUALITY for each scenario, or any qualityrating obtained at the end of the interaction with each met-aphor (PROMPT QUALITY or INTERACTION QUALITY).
Analysing the additional items present in E2 – synchro-nization of audible speech and lip movements and the fitof head and voice components, a better fit was ascribed tothe TH with Mary voice than the others (F ð3; 178Þ ¼ 6:44;p < :001, Tukey posthoc tests) and MS was judged to havea better synchronization than TH ðF ð1; 182Þ ¼ 6:61;p < :05Þ.
Nonetheless, participants had been able to perceive dif-ferences between the metaphors. This could be observednot only for some of the quality ratings (SPEECH QUALITY,FIT, SYN), but also for the semantic differential. When ana-lysing quality aspects separately based on the semantic dif-ferential, we find the same ranking already known from E1for 2 of the resulting factors. The detailed results are pre-sented in the following section.
4.2.2. E2 – Results: semantic differential
The semantic differential with its 50 antonyms allows toanalyse the metaphors’ perception in a more analytic waythan explicit quality ratings. This will be used to explainthe differences in quality ratings between E1 and E2. Thefactor analysis of the data from the semantic differentialusing Horn’s parallel analysis (Horn, 1965) and obliquerotation – as recommended by Costello and Osborne(2005) – reveals 6 factors (52% explained variance, with aKaiser-Meyer-Olkin measure of sampling adequacy(Hutcheson and Sofroniou, 1999), KMO ¼ :91. They canbe entitled as
1. “quality of the prompts” (Cronbach’s a ¼ :95),2. “metaphor’s attractiveness” ða ¼ :91Þ,3. “metaphor’s naturalness” ða ¼ :91Þ,4. “cognitive demand during the interaction” ða ¼ :90Þ,5. “trust towards the system” ða ¼ :85Þ, and6. “entertaining value” ða ¼ :82Þ.
Only two pairs of factors correlate strongly with eachother ðr > :5Þ, quality of the prompts with cognitive demand
ðr > :62Þ and naturalness with entertaining value ðr > :69Þ.The last pair is of special interest, as both factors are the onlyones showing different results for the metaphors, using themeans of the items for each factor (F ð3; 178Þ ¼ 10:59;p < :001; F ð3; 178Þ ¼ 10:02; p < :001, respectively). Forboth factors TH receives higher values than MS and Maryis rated better than Mbrola. This ranking was also obtainedfor quality scales in the non-interactive setting.
The similarity in the results for naturalness and enter-taining value (cf. Fig. 8) can be explained due to the featuredifferences of the TH compared to MS: In contrast to MS,
TH exhibits both, a natural texture most probably respon-sible for the result for factor 3 and random extra-linguisticmovements resulting in the difference in factor 6.
However, there is no explanation why no other factordiffers for the metaphors. In the non-interactive experiment(E1), all three factors found, including attractiveness didshow results.
4.2.3. E2 – Results of the correlation analysis between
different scales
It is assumed that some of the resulting factors correlatewith the quality ratings. Especially in the case of OVERALL
QUALITY and VISUAL QUALITY, which do not differ for themetaphors, correlations could give useful insight, whetherquality ratings may be influenced by some unforeseen fac-tor. Results of correlation analyses are presented in Table 1.There are only two strong correlations ðr > :6Þ betweenfactors and quality ratings: (1) attractiveness and OVERALL
QUALITY and (2) quality of prompts and PROMPT QUALITY.Whereas the latter result is quite obvious – of course thereis a strong correlation between the PROMPT QUALITY scaleand the averaged ratings of the factor 1 comprising sub-scales related to the prompts – the former result indicatesthe high impact of this hedonic aspect on perceived overallquality.
In addition, there is a strong relation between INTERAC-
TION QUALITY and OVERALL QUALITY.
4.2.4. E2 – Results for the interaction parameters
Analysing the interaction parameters, no differencesbetween the four metaphors nor between the one- andthe two-screen setting could be found. Due to the con-trolled dialogue flow, the missing impact on interactionof both the metaphors and the degree of media contextcould be expected.
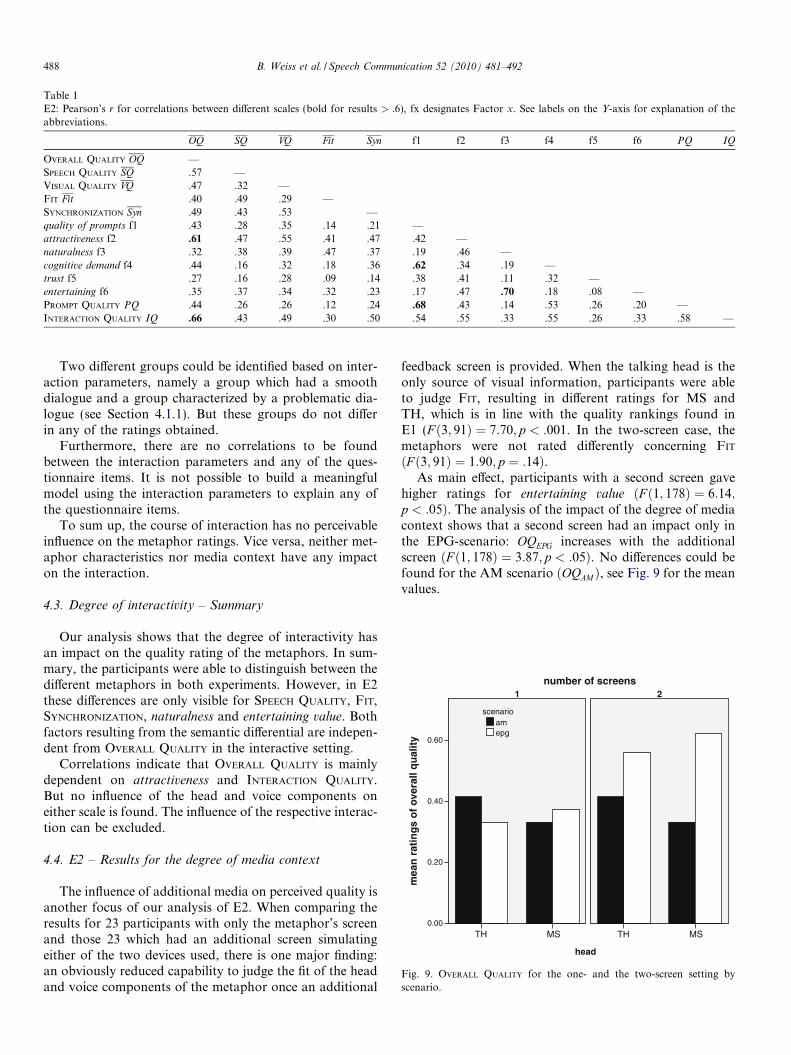
Table 1E2: Pearson’s r for correlations between different scales (bold for results > :6), fx designates Factor x. See labels on the Y-axis for explanation of theabbreviations.
OQ SQ VQ Fit Syn f1 f2 f3 f4 f5 f6 PQ IQ
OVERALL QUALITY OQ —SPEECH QUALITY SQ .57 —VISUAL QUALITY VQ .47 .32 —FIT Fit .40 .49 .29 —SYNCHRONIZATION Syn .49 .43 .53 —quality of prompts f1 .43 .28 .35 .14 .21 —attractiveness f2 .61 .47 .55 .41 .47 .42 —naturalness f3 .32 .38 .39 .47 .37 .19 .46 —cognitive demand f4 .44 .16 .32 .18 .36 .62 .34 .19 —trust f5 .27 .16 .28 .09 .14 .38 .41 .11 .32 —entertaining f6 .35 .37 .34 .32 .23 .17 .47 .70 .18 .08 —PROMPT QUALITY PQ .44 .26 .26 .12 .24 .68 .43 .14 .53 .26 .20 —INTERACTION QUALITY IQ .66 .43 .49 .30 .50 .54 .55 .33 .55 .26 .33 .58 —
head
MSTH
mea
n r
atin
gs
of
over
all q
ual
ity 0.60
0.40
0.20
0.00MSTH
number of screens21
epgam
scenario
Fig. 9. OVERALL QUALITY for the one- and the two-screen setting byscenario.
488 B. Weiss et al. / Speech Communication 52 (2010) 481–492
Two different groups could be identified based on inter-action parameters, namely a group which had a smoothdialogue and a group characterized by a problematic dia-logue (see Section 4.1.1). But these groups do not differin any of the ratings obtained.
Furthermore, there are no correlations to be foundbetween the interaction parameters and any of the ques-tionnaire items. It is not possible to build a meaningfulmodel using the interaction parameters to explain any ofthe questionnaire items.
To sum up, the course of interaction has no perceivableinfluence on the metaphor ratings. Vice versa, neither met-aphor characteristics nor media context have any impacton the interaction.
4.3. Degree of interactivity – Summary
Our analysis shows that the degree of interactivity hasan impact on the quality rating of the metaphors. In sum-mary, the participants were able to distinguish between thedifferent metaphors in both experiments. However, in E2these differences are only visible for SPEECH QUALITY, FIT,SYNCHRONIZATION, naturalness and entertaining value. Bothfactors resulting from the semantic differential are indepen-dent from OVERALL QUALITY in the interactive setting.
Correlations indicate that OVERALL QUALITY is mainlydependent on attractiveness and INTERACTION QUALITY.But no influence of the head and voice components oneither scale is found. The influence of the respective interac-tion can be excluded.
4.4. E2 – Results for the degree of media context
The influence of additional media on perceived quality isanother focus of our analysis of E2. When comparing theresults for 23 participants with only the metaphor’s screenand those 23 which had an additional screen simulatingeither of the two devices used, there is one major finding:an obviously reduced capability to judge the fit of the headand voice components of the metaphor once an additional
feedback screen is provided. When the talking head is theonly source of visual information, participants were ableto judge FIT, resulting in different ratings for MS andTH, which is in line with the quality rankings found inE1 (F ð3; 91Þ ¼ 7:70; p < :001. In the two-screen case, themetaphors were not rated differently concerning FIT
ðF ð3; 91Þ ¼ 1:90; p ¼ :14Þ.As main effect, participants with a second screen gave
higher ratings for entertaining value ðF ð1; 178Þ ¼ 6:14;p < :05Þ. The analysis of the impact of the degree of mediacontext shows that a second screen had an impact only inthe EPG-scenario: OQEPG increases with the additionalscreen ðF ð1; 178Þ ¼ 3:87; p < :05Þ. No differences could befound for the AM scenario ðOQAMÞ, see Fig. 9 for the meanvalues.
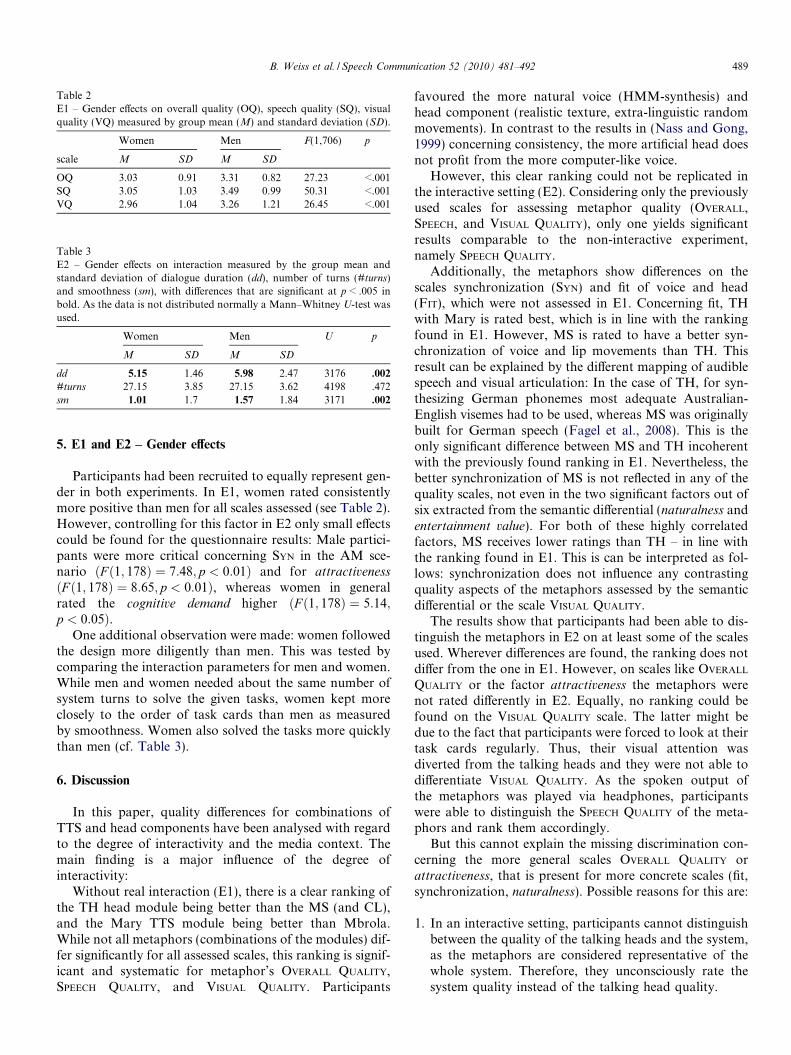
Table 2E1 – Gender effects on overall quality (OQ), speech quality (SQ), visualquality (VQ) measured by group mean (M) and standard deviation (SD).
Women Men F(1,706) p
scale M SD M SD
OQ 3.03 0.91 3.31 0.82 27.23 <.001SQ 3.05 1.03 3.49 0.99 50.31 <.001VQ 2.96 1.04 3.26 1.21 26.45 <.001
Table 3E2 – Gender effects on interaction measured by the group mean andstandard deviation of dialogue duration (dd), number of turns (#turns)and smoothness (sm), with differences that are significant at p < .005 inbold. As the data is not distributed normally a Mann–Whitney U-test wasused.
Women Men U p
M SD M SD
dd 5.15 1.46 5.98 2.47 3176 .002
#turns 27.15 3.85 27.15 3.62 4198 .472sm 1.01 1.7 1.57 1.84 3171 .002
B. Weiss et al. / Speech Communication 52 (2010) 481–492 489
5. E1 and E2 – Gender effects
Participants had been recruited to equally represent gen-der in both experiments. In E1, women rated consistentlymore positive than men for all scales assessed (see Table 2).However, controlling for this factor in E2 only small effectscould be found for the questionnaire results: Male partici-pants were more critical concerning SYN in the AM sce-nario ðF ð1; 178Þ ¼ 7:48; p < 0:01Þ and for attractiveness
ðF ð1; 178Þ ¼ 8:65; p < 0:01Þ, whereas women in generalrated the cognitive demand higher ðF ð1; 178Þ ¼ 5:14;p < 0:05Þ.
One additional observation were made: women followedthe design more diligently than men. This was tested bycomparing the interaction parameters for men and women.While men and women needed about the same number ofsystem turns to solve the given tasks, women kept moreclosely to the order of task cards than men as measuredby smoothness. Women also solved the tasks more quicklythan men (cf. Table 3).
6. Discussion
In this paper, quality differences for combinations ofTTS and head components have been analysed with regardto the degree of interactivity and the media context. Themain finding is a major influence of the degree ofinteractivity:
Without real interaction (E1), there is a clear ranking ofthe TH head module being better than the MS (and CL),and the Mary TTS module being better than Mbrola.While not all metaphors (combinations of the modules) dif-fer significantly for all assessed scales, this ranking is signif-icant and systematic for metaphor’s OVERALL QUALITY,SPEECH QUALITY, and VISUAL QUALITY. Participants
favoured the more natural voice (HMM-synthesis) andhead component (realistic texture, extra-linguistic randommovements). In contrast to the results in (Nass and Gong,1999) concerning consistency, the more artificial head doesnot profit from the more computer-like voice.
However, this clear ranking could not be replicated inthe interactive setting (E2). Considering only the previouslyused scales for assessing metaphor quality (OVERALL,SPEECH, and VISUAL QUALITY), only one yields significantresults comparable to the non-interactive experiment,namely SPEECH QUALITY.
Additionally, the metaphors show differences on thescales synchronization (SYN) and fit of voice and head(FIT), which were not assessed in E1. Concerning fit, THwith Mary is rated best, which is in line with the rankingfound in E1. However, MS is rated to have a better syn-chronization of voice and lip movements than TH. Thisresult can be explained by the different mapping of audiblespeech and visual articulation: In the case of TH, for syn-thesizing German phonemes most adequate Australian-English visemes had to be used, whereas MS was originallybuilt for German speech (Fagel et al., 2008). This is theonly significant difference between MS and TH incoherentwith the previously found ranking in E1. Nevertheless, thebetter synchronization of MS is not reflected in any of thequality scales, not even in the two significant factors out ofsix extracted from the semantic differential (naturalness andentertainment value). For both of these highly correlatedfactors, MS receives lower ratings than TH – in line withthe ranking found in E1. This is can be interpreted as fol-lows: synchronization does not influence any contrastingquality aspects of the metaphors assessed by the semanticdifferential or the scale VISUAL QUALITY.
The results show that participants had been able to dis-tinguish the metaphors in E2 on at least some of the scalesused. Wherever differences are found, the ranking does notdiffer from the one in E1. However, on scales like OVERALL
QUALITY or the factor attractiveness the metaphors werenot rated differently in E2. Equally, no ranking could befound on the VISUAL QUALITY scale. The latter might bedue to the fact that participants were forced to look at theirtask cards regularly. Thus, their visual attention wasdiverted from the talking heads and they were not able todifferentiate VISUAL QUALITY. As the spoken output ofthe metaphors was played via headphones, participantswere able to distinguish the SPEECH QUALITY of the meta-phors and rank them accordingly.
But this cannot explain the missing discrimination con-cerning the more general scales OVERALL QUALITY orattractiveness, that is present for more concrete scales (fit,synchronization, naturalness). Possible reasons for this are:
1. In an interactive setting, participants cannot distinguishbetween the quality of the talking heads and the system,as the metaphors are considered representative of thewhole system. Therefore, they unconsciously rate thesystem quality instead of the talking head quality.
490 B. Weiss et al. / Speech Communication 52 (2010) 481–492
2. Participants are distracted by the interaction and theycan perceive only some of the characteristics as varyingbetween the talking heads, which are more salient (sim-ple classification like naturalness and fit, but notattractiveness).
No impact of metaphor characteristics on OVERALL
QUALITY could be found, while ratings on scales clearlyassessing metaphor-related aspects (FIT, SYNCHRONISATION,naturalness) show differences for the metaphors. This sup-ports hypothesis (1), namely that participants conflatedsystem quality – which was constant by design – with themetaphors’ OVERALL QUALITY. Moller and Skowronek(2003) already found a similar result for uni-modal spokendialogue systems, namely that – in contrast to speech input– perceived speech output quality is conjoint with the qual-ity of the whole system.
Following hypothesis (2), the impact of interactivityexplains the poor results for OVERALL QUALITY. Based onthis argumentation, differences in FIT and SYNCHRONISATION
might just be more present than OVERALL QUALITY andattractiveness.
Strong correlations are found between OVERALL
QUALITY and both attractiveness and INTERACTION QUALITY.Neither does attractiveness differ significantly between themetaphors, nor are there interaction parameters explainingINTERACTION QUALITY. However, it has been shown beforethat the perceived dialogue is not necessarily influenced bythe de-facto course of dialogue (cf. Frøkj�r et al., 2000). Inour case the dialogue flow was controlled and thus onlyvery few parameters could be used to model the subjectiveratings as proposed with the PARADISE framework byWalker et al. (1998). This was done to force the partici-pants to rate the head and not the system quality and wecould interpret the results as having succeeded in this.Based on this point, we see the ratings on OVERALL QUAL-
ITY and attractiveness as neither influenced by the dialogueflow nor the metaphor characteristics.
The other factor varied in a controlled way is the degreeof media context: providing redundant information on ascreen and thus offering a distraction on the visual channelfurther hinders the participants’ ability to perceive andjudge the differences between the metaphors. This couldbe observed by the different ratings obtained with the FIT
scale for the one- and the two-screen setting. At the sametime this additional information leads to a higher metaphorquality and higher ratings for entertaining value. This is inline with the general finding that the metaphor ratings areobviously influenced by other factors. We interpret thisfinding as showing that for the subjects the metaphors rep-resent the whole system and the metaphor’s rating benefitsfrom the increased system quality due to the additionalscreen (hypothesis (1)): As the second screen providesinformation of the electronic program guide in a more sali-ent modality – film names, times and channels as text listsin addition to spoken lists – OVERALL QUALITY (of the met-aphor) is higher in this case than without this second
screen. We conclude therefore that participants are lessable to distinguish between discrete quality aspects themore influencing or distracting factors are present. In otherwords, the more complex a stimulus, the more difficult toobtain analytic ratings.
Apart from the factors presented so far, the effects ofgender have also been analysed. Concerning gender differ-ences, some interesting results could also be found. Menand women exhibit different interaction behaviour asrecorded by the interaction parameter. This is in line withfindings reported in (Canada and Brusca, 1991). Womentend to follow the instructions much more closely whilemen stray from the given path to ‘play’ with the system.When considering the subjective data from the experi-ments, contradictory results are obtained. In the non-interactive experiment, female users rate the heads consis-tently better than male participants. In the interactiveexperiment, this could not be confirmed, as there are con-flicting results. We consider the gender effect on ratingsnegligible.
7. Conclusion
Analysing the results of these two experiments leads tothree important observations concerning the design ofuser studies including ECAs. (1) If an evaluation of singu-lar system components or aspects is desirable, functiontests should be carried out with as few distractions as pos-sible. (2) Replacing one system component with a betterone will not necessarily lead to a higher perceived qualityof the talking head (and thus not improve the overallquality of the whole system) if this improvement maynot be perceived by the users. This result shows theimportance of the degree of interactivity and may notbe valid for e.g. tutoring systems without interaction. (3)When choosing participants for user tests in the smarthome domain, gender has to be taken into considerationnot only for interpreting the results, but also concerningthe expected behaviour during the study. It has to bedecided whether a more playful or an obedient attituderegarding interaction behaviour is preferable for the givenstudy.
Irrespective of these findings, we conclude that a morehuman-like head and voice is preferable for the outputcomponent of a smart-home system. However, otheraspects of multi-modal systems may be more efficient, suchas choosing the most appropriate medium for the informa-tion to be presented.
To answer the open questions, another experiment iscurrently being conducted. The four metaphors are evalu-ated again. This time participants interact with a fully func-tional smart home system. They are in a real living roomand experience direct feedback from the system. Thus, thistime an even higher distraction is provided. Furthermore,the interaction is not as strictly defined and more interac-tion parameters can be gathered. We hope to be able toanswer the question of whether or not the metaphor quality
B. Weiss et al. / Speech Communication 52 (2010) 481–492 491
is conflated with system quality/particular interaction andif the user is too distracted to actually evaluate the head.As a reference, the system with the metaphors is comparedto a system without a head component to test for accept-ability of the embodiment and the persona effect in thesmart home domain.
At the same time the TH is enhanced with facial expres-sions, rendering the metaphor more affective.
Acknowledgment
The project was financially supported by the DeutscheForschungsgemeinschaft DFG (German Research Com-munity), Grant MO 1038/6-1.
References
Adcock, A., Van Eck, R., 2005. Reliability and factor structure of theattitude toward tutoring agent scale (ATTAS). Journal of InteractiveLearning Research 16 (2), 195–217.
Andre, E., Rist, T., Muller, J., 1998. Webpersona: a lifelike presentationagent for the world-wide web. Knowledge-Based Systems 11 (1), 25–36.
Berry, D.C., Butler, L.T., de Rosis, F., 2001. Evaluating a realistic agent inan advice-giving task. International Journal of Human–ComputerStudies 63 (3), 304–327.
Breitfuss, W., Prendinger, H., Ishizuka, M., 2008. Automatic generationof gaze and gestures for dialogues between embodied conversationalagents: system description and study on gaze behavior. In: Proc. AISB2008 Symposium on Multimodal Output Generation (MOG 2008), pp.18–25.
Buisine, S., Abrilian, S., Martin, J.C., 2004. Evaluation of multimodalbehaviour of embodied agents. In: Ruttkay, Z., Pelachaud, C. (Eds.),From Brows to Trust: Evaluating Embodied Conversational Agents.Springer-Verlag, New York, pp. 217–238.
Burnham, D., Abrahamyan, A., Cavedon, L., Davis, C., Hodgins, A.,Kim, J., Kroos, C., Kuratate, T., Lewis, T., Luerssen, M., Paine, G.,Powers, D., Riley, M., Stelarc, Stevens, K., 2008. From talking tothinking heads: 2008. In: Proc. International Conference on Auditory-Visual Speech Processing (AVSP).
Canada, K., Brusca, F., 1991. The technological gender gap: evidence andrecommendations for educators and computer-based instructiondesigners. Educational Technology Research and Development 39(2), 43–51.
Cassell, J., Sullivan, J., Prevost, S., Churchill, E., 2000. EmbodiedConversational Agents. MIT Press, Cambridge.
Costello, A., Osborne, J., 2005. Best practices in exploratory factoranalysis: four recommendations for getting the most from youranalysis. Practical Assessment Research & Evaluation 10 (7).
Cowell, A.J., Stanney, K.M., 2005. Manipulation of non-verbal interac-tion style and demographic embodiment to increase anthropomorphiccomputer character credibility. International Journal of Human–Computer Studies 62 (2), 281–306.
Dehn, D.M., Van Mulken, S., 2000. The impact of animated interfaceagents: a review of empirical research. International Journal ofHuman–Computer Studies 52 (1), 1–22.
Dutoit, T., Pagel, V., Pierret, N., Bataille, F., Van der Vreken, O., 1996.The MBROLA project: towards s set of high-quality speech synthe-sizers free of use for non-commercial purposes. In: Proc. InternationalConference on Spoken Language Processing (ICSLP), pp. 1393–1396.
Erickson, T., 1997. Designing Agents as if People Mattered. AAAI Press,Menlo Park.
Fagel, S., Bailly, G., Elisei, F., 2007. Intelligibility of natural and 3d-cloned German speech. In: Proc. International Conference on Audi-tory-Visual Speech Processing (AVSP). Paper L2-1.
Fagel, S., Clemens, C., 2004. An articulation model for audiovisual speechsynthesis – determination, adjustment, evaluation. Speech Communi-cation 44 (1–4), 141–154.
Fagel, S., Kuhnel, C., Weiss, B., Wechsung, I., Moller, S., 2008. Acomparison of German talking heads in a smart home environment.In: Proc. International Conference on Auditory-Visual Speech Pro-cessing (AVSP).
Frøkj�r, E., Hertzum, M., Hornb�k, K., 2000. Measuring usability: areeffectiveness, efficiency, and satisfaction really correlated? In: Proc.Conference on Human Factors in Computing Systems (CHI), pp. 345–352.
Gong, L., 2008. The boundary of racial prejudice: comparing preferencesfor computer-synthesized white, black, and robot characters. Com-puters in Human Behavior 24 (5), 2074–2093.
Gong, L., Nass, C., 2007. When a talking-face computer agent is half-human and half-humanoid: human identity and consistency prefer-ence. Human Communication Research 33, 163–193.
Horn, J., 1965. A rationale and a test for the number of factors in factoranalysis. Psychometrika 30 (2), 179–185.
Hutcheson, G., Sofroniou, N., 1999. The multivariate social scientist. SagePublications, Thousand Oaks.
Kuhnel, C., Weiss, B., Wechsung, I., Fagel, S., Moller, S., 2008.Evaluating talking heads for smart home systems. In: Proc. Interna-tional Conference on Multimodal Interfaces (ICMI).
King, W.J., Ohya, J., 1996. The representation of agents: anthropomor-phism, agency, and intelligence. In: Proc. Conference on HumanFactors in Computing Systems (CHI).
Kipp, M., 2004. Gesture Generation by Imitation – From Human Behaviorto Computer Character Animation. Dissertation.com, Boca Raton.
Koda, T., Maes, P., 1996. Agents with faces: the effects of personificationof agents. In: Proc. IEEE International Workshop on Robot andHuman Communication, pp. 189–194.
Kramer, N., 2008. Soziale Wirkungen virtueller Helfer. Medienpsychol-ogie.. Kohlhammer, Stuttgart.
Kramer, N.C., Bente, G., 2002. Virtuelle Helfer: embodied conversationalagents in der Mensch-Computer-Interaktion. In: Virtuelle Realitaten.Hogrefe, Gottingen, pp. 203–225.
Lester, J.C., Stone, B.A., Converse, S.A., Kahler, S.E., Barlow, S.T., 1997.Animated pedagogical agents and problem-solving effectiveness: alarge-scale empirical evaluation. In: Proc. World Conference onArtificial Intelligence in Education, pp. 23–30.
Massaro, D., Cohen, M., Beskow, J., Cole, R., 2000. Developing andevaluating conversational agents. In: Cassell, J., Sullivan, J., Prevost,S., Churchill, E. (Eds.), Embodied Conversational Agents. MIT Press,pp. 286–318.
McBreen, H.M., Jack, M., 2000. Empirical evaluation of animated agentsin a multi-modal e-retail application. In: Proc. AAAI Fall Symposiumon Socially Intelligent Agents, pp. 122–126.
Moller, S., Skowronek, J., 2003. Quantifying the impact of systemcharacteristics on perceived quality dimensions of a spoken dialogueservice. In: Proc. European Conference on Speech Communicationand Technology, Geneva, vol. 3, pp. 1953–1956.
Nass, C., Gong, L., 1999. Maximized modality or constrained consis-tency? In: Proc. International Conference on Auditory-Visual SpeechProcessing (AVSP).
Nass, C., Moon, Y., Green, N., 1997. Are computers gender-neutral?Gender stereotypic responses to computers. Journal of Applied SocialPsychology 27 (10), 864–876.
Nowak, K.L., 2004. The influence of anthropomorphism and agency onsocial judgment in virtual environments. Journal of Computer-Mediated Communication 9 (2).
Nowak, K.L., Rauh, C., 2005. The influence of the avatar on onlineperceptions of anthropomorphism, androgyny, credibility, homophily,and attraction. Journal of Computer-Mediated Communication11 (1).
Pandzic, I.S., Ostermann, J., Millen, D.R., 1999. User evaluation:synthetic talking faces for interactive services. The Visual Computer15 (7/8), 330–340.
492 B. Weiss et al. / Speech Communication 52 (2010) 481–492
Prendinger, H., Mori, J., Saeyor, S., Mori, K., Okazaki, K., Juli, Y.,Mayer, S., Dohi, H., Ishizuka, M., 2004. Scripting and evaluatingaffective interactions with embodied conversational agents. KIZeitschrift 1, 4–10.
Ruttkay, Z., Pelachaud, C. (Eds.), 2004. From Brows to Trust: EvaluatingEmbodied Conversational Agents. Springer-Verlag, New York.
Schroder, M., Trouvain, J., 2003. The German text-to-speech synthesissystem MARY: a tool for research, development and teaching.International Journal of Speech Technology 6 (4), 365–377.
Sproull, L., Subramani, M., Kiesler, S., Walker, J.H., Waters, K., 1996.When the interface is a face. Human Computer Interaction 11 (2), 97–124.
Takeuchi, A., Naito, T., 1995. Situated facial displays: towards socialinteraction. In: Katz, I., Mack, R., Marks, L. (Eds.), Human Factorsin Computing Systems: CHI’95 Conference Proceedings. ACM Press,New York, pp. 450–455.
Theobald, B.-J., Fagel, S., Bailly, G., Elisei, F., 2008. Lips2008: visualspeech synthesis challenge. In: Proc. INTERSPEECH, Brisbane, pp.2310–2313.
Van Mulken, S., Andre, E., Muller, J., 1998. The persona effect: howsubstantial is it? In: Proc. HCI on People and Computers.
Walker, M.A., Litman, D.J., Kamm, C.A., Abella, A., 1998. Evaluatingspoken dialogue agents with PARADISE: two case studies. ComputerSpeech and Language 12 (4), 317–347.
Weiss, B., Kuhnel, C., Wechsung, I., Moller, S., Fagel, S., 2009.Comparison of different talking heads in non-interactive settings. In:Proc. Human Computer Interaction International (HCII), San Diego,pp. 349–357.
Xiao, J., 2006. Empirical studies on embodied conversational agents.Ph.D. thesis, Georgia Institute of Technology.
Xiao, J., Stasko, J., Catrambone, R., 2002. Embodied conversationalagents as a UI paradigm: a framework for evaluation. In: Embodiedconversational agents – let’s specify and evaluate them! Workshop inconjunction with International Conference on Autonomous Agentsand Multiagent Systems (AAMAS).
Yee, N., Bailenson, J.N., Rickertsen, K., 2007. A meta-analysis of theimpact of the inclusion and realism of human-like faces on userexperiences in interfaces. In: Proc. Conference on Human Factors inComputing Systems (CHI), pp. 1–10.
Zimmerman, J., Ayoob, E., Forlizzi, J., McQuaid, M., 2005. Putting a faceon embodied interface agents. In: Proc. Conference on DesigningPleasurable Products and Interfaces (DPPI), pp. 233–248.